a learning analytics approach
TRANSCRIPT

A Learning Analytics Approach to Correlate the Academic Achievements of Students with Interaction Data from an Educational Simulator
Mehrnoosh Vahdat, Luca Oneto,
Davide Anguita, Mathias Funk, and Matthias Rauterberg
September 17, 2015
EC-TEL 2015
http://www.icephd.org www.SmartLab.ws

Outline
• Introduction
• Interaction Data
• Process Mining and Complexity
• Results

Outline
• Introduction• Our aim
• Context
• Experiment
• Interaction Data
• Process Mining and Complexity
• Results
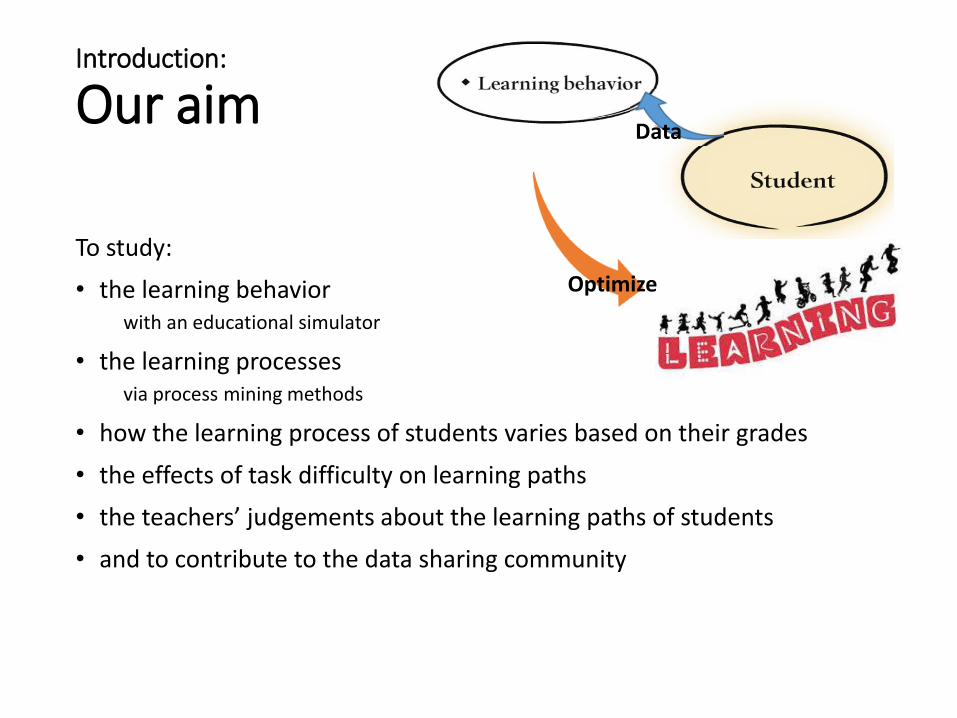
Introduction:
Our aim
To study:
• the learning behavior with an educational simulator
• the learning processes via process mining methods
• how the learning process of students varies based on their grades
• the effects of task difficulty on learning paths
• the teachers’ judgements about the learning paths of students
• and to contribute to the data sharing community
Data
Optimize

Introduction:
Learning Analytics Process
In LA/ EDM process, data is collected and analyzed, and after post processing, feedback and interventions are made in order to optimize learning (based on [1, 2, 16])

Introduction:
Context• Our educational simulator: DEEDS
• Provides learning materials
• Stands for: Digital Electronics Education and Design Suite
• Is an interactive simulation environment for e-learning in digital electronics [3]
• Asks to solve varied-level problems

Introduction:
Experiment• On two sets of BSc students
• 125 students: for pilot (March to June 2014)
• 100 students: (October to December 2014)
• During the course of digital design at the University of Genoa:
• 6 laboratory sessions [15]

Outline
• Introduction
• Interaction Data• Learning process with DEEDS
• Data collection
• Data granularity
• Process Mining and Complexity
• Results

Learning process with DEEDS
http://www.esng.dibe.unige.it/deeds/

Interaction Data: Data collection• Activity logs from system:
• Students-performed actions with a given outcome• Source view during a time span, finishing an activity with relevant features
• Time series, application names, window titles, DEEDS components
• Screen records from volunteers to make sense of data
• Feedback on data to avoid problems

Interaction Data: Data granularity• Three levels of granularity based on activities
• Level 1: all the activities: in-task and out-of-task
• Level 2: in-task
• Level 3: grouped into higher level

Outline
• Introduction
• Interaction Data
• Method: Process Mining• Creating the process models
• Process Mining
• Fuzzy Miner
• Disco
• Comparing the process models• Complexity Metric
• Results

Process Mining
• Emerged from the business community
• To obtain valuable knowledge from a process
• To get better insight on the underlying educational processes [4, 5]
• Challenge: educational processes are very unordered and complex
• Solution: complexity metrics to measure the understandability of process models
https://fluxicon.com/disco/

Creating the process models:
Educational processes• Educational processes are very unordered and complex
• Algorithm to obtain the process models: Fuzzy miner [6, 7]
• Events are unstructured, the process model is not known beforehand.
• Disco tool based on Fuzzy miner: discovering models through seamless abstraction and generalization [8]
• Dealing with spaghetti-like processes
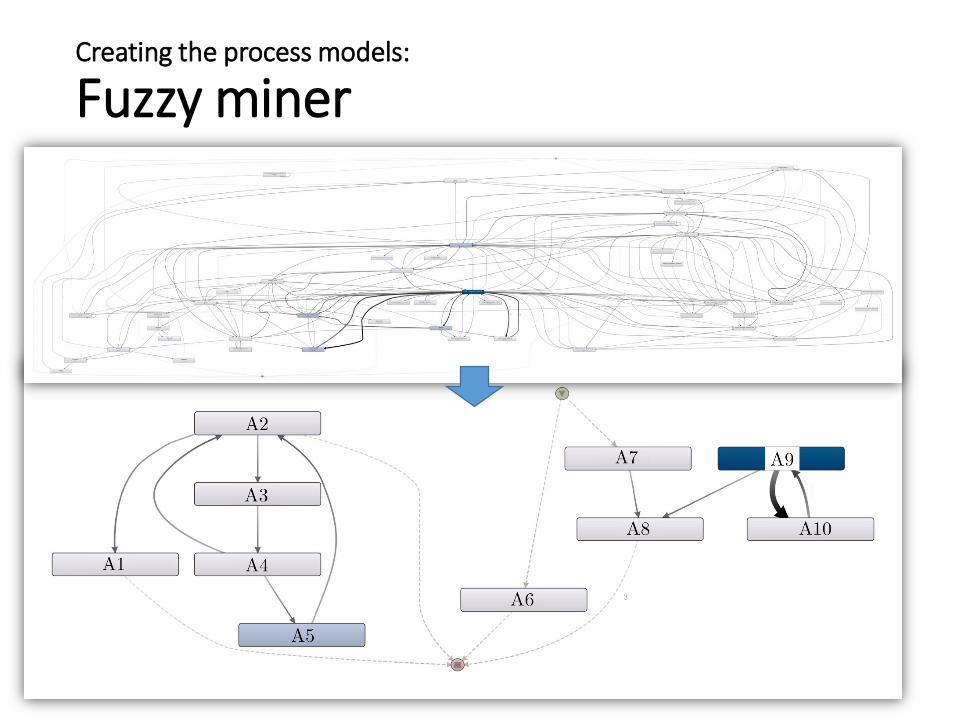
Creating the process models:
Fuzzy miner•
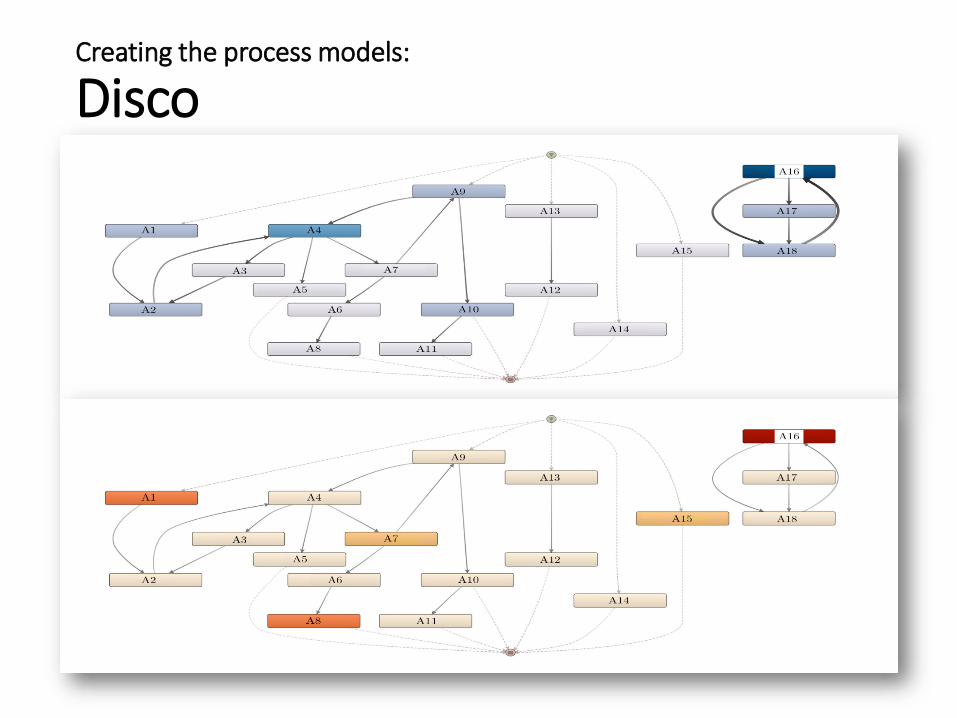
Creating the process models:
Disco•

Process Mining:
Comparing the process models• Process models help understand the processes, but understanding
complex models faces cognitive limits
• Complexity metrics measure understandability and maintainability of a workflow net [9]
• Applied metric: Cyclomatic Complexity of McCabe (CM) [10]
• to measure the complexity of a control-flow graph of a program
Complexity of
Process Models

Outline
• Introduction
• Interaction Data
• Method: Process Mining
• Results• Complexity and task difficulty
• Complexity and grades
• Complexity and granularity
• Teachers’ Feedback

Results:Task Difficulty
40
50
60
70
80
90
100
110
1 2 3 4 5 6
CO
GN
ITIV
E C
OM
PLE
XIT
Y
SESSIONS
COGNIT IVE COMPLEXITY AVERAGE PER SESSION
0
0.1
0.2
0.3
0.4
0.5
0.6
0.7
0.8
0.9
1
1 2 3 4 5 6
GR
AD
E
SESSION
AVERAGE OF INTERMEDIATE GRADES

Grade Clusters
40
50
60
70
80
90
100
110
120
1 2 3 4 5 6
CO
GN
ITIV
E C
OM
PLE
XIT
Y N
=0
SESSIONS
High-graded Low-graded
40
50
60
70
80
90
100
110
120
1 2 3 4 5 6
CO
GN
ITIV
E C
OM
PLE
XIT
Y N
=2
SESSIONS
High-graded Low-graded
0
0.2
0.4
0.6
0.8
1
1 2 3 4 5 6
Final Grades
High grades Low grades
0
0.2
0.4
0.6
0.8
1
1 2 3 4 5 6
Final Grades
High grades Low grades
Grade = µ±Nσ

Granularity

Teachers’ Feedback
0
1
2
3
4
5
6
Very difficult Very easy
Sess
ion
s
Difficulty Scale
Session Difficulty based on Teachers
10-Y experienced 4-Y experienced 2-Y experienced 3-M experienced

Outcome
• the learning process of students through Process Mining
• the variation of processes based on grades and task difficulty
• teachers’ judgments about the learning paths
Increased awareness on:
Optimize

Our Data Set
• Data set will be published on UCI repository (by November 2015)
• Check www.la.smartlab.ws for updates!

References• [1] M. A. Chatti, A. L. Dyckhoff, U. Schroeder, and H. Thüs. A reference model for learning
analytics. International Journal of Technology Enhanced Learning, 4(5):318–331, 2012.
• [2] D. Clow. The learning analytics cycle: Closing the loop effectively. In International Conference on Learning Analytics and Knowledge, 2012.
• [3] Donzellini, G., Ponta, D.: A simulation environment for e-learning in digital design. IEEE Transactions on Industrial Electronics 54(6) (2007) 3078–3085
• [4] Trcka, N., Pechenizkiy, M., Van Der Aalst, W.: Process mining from educational data. Chapman & Hall/CRC (2010)
• [5] Pechenizkiy, M., Trcka, N., Vasilyeva, E., Van Der Aalst, W., De Bra, P.: Process mining online assessment data. In: International Working Group on Educational Data Mining. (2009)
• [6] Günther, C.W., Van Der Aalst, W.M.P.: Fuzzy mining–adaptive process simplification based on multi-perspective metrics. In: Business Process Management. (2007)
• [7] Van der Aalst, W., Weijters, T., Maruster, L.: Workflow mining: Discovering process models from event logs. IEEE Transactions on Knowledge and Data Engineering 16(9) (2004) 1128–1142
• [8] Van Der Aalst, W.M.: Tool support. In: Process Mining. (2011)
• [9] Gruhn, V., Laue, R.: Complexity metrics for business process models. In: International conference on business information systems. (2006)

References• [10] McCabe, T.J.: A complexity measure. IEEE Transactions on Software Engineering (4)
(1976) 308–320
• [11] C. Romero and S. Ventura. Educational data mining: A survey from 1995 to 2005. Expert systems with applications, 33(1):135–146, 2007.
• [12] G. Siemens and P. Long. Penetrating the fog: Analytics in learning and education. Educause Review, 46(5):30–32, 2011.
• [13] Drachsler, Hendrik, and Wolfgang Greller. "The pulse of learning analytics understandings and expectations from the stakeholders." Proceedings of the 2nd
international conference on learning analytics and knowledge. ACM, 2012.
• [14] A. Pena-Ayala. Educational data mining: A survey and a data mining-based analysis of recent works. Expert systems with applications, 41(4):1432–1462, 2014.
• [15] Vahdat, M., Oneto, L., Ghio, A., Donzellini, G., Anguita, D., Funk, M., Rauterberg, M.: A learning analytics methodology to profile students behavior and explore interactions with a digital electronics simulator. In: Open Learning and Teaching in Educational Communities. (2014)
• [16] Vahdat, M., , Ghio, A., , Oneto, L., Anguita, D., Funk, M., Rauterberg, M.: Advances in learning analytics and educational data mining. In: European Symposium on Artificial Neural Networks, Computational Intelligence and Machine Learning. (2015)

A Learning Analytics Approach to Correlate the Academic Achievements of Students with Interaction Data from an Educational SimulatorWas presented by Mehrnoosh VahdatAt EC-TEL 2015
Toledo – September 17, 2015
http://www.icephd.org www.SmartLab.ws
http://goo.gl/ouywVU
@MehrnooshV
These slides are provided under the Creative Commons Attribution Licence: http://creativecommons.org/licenses/by/4.0/. Some images used may have different licence terms.