a-level topic: continuous data 6 starter activity chapter
TRANSCRIPT
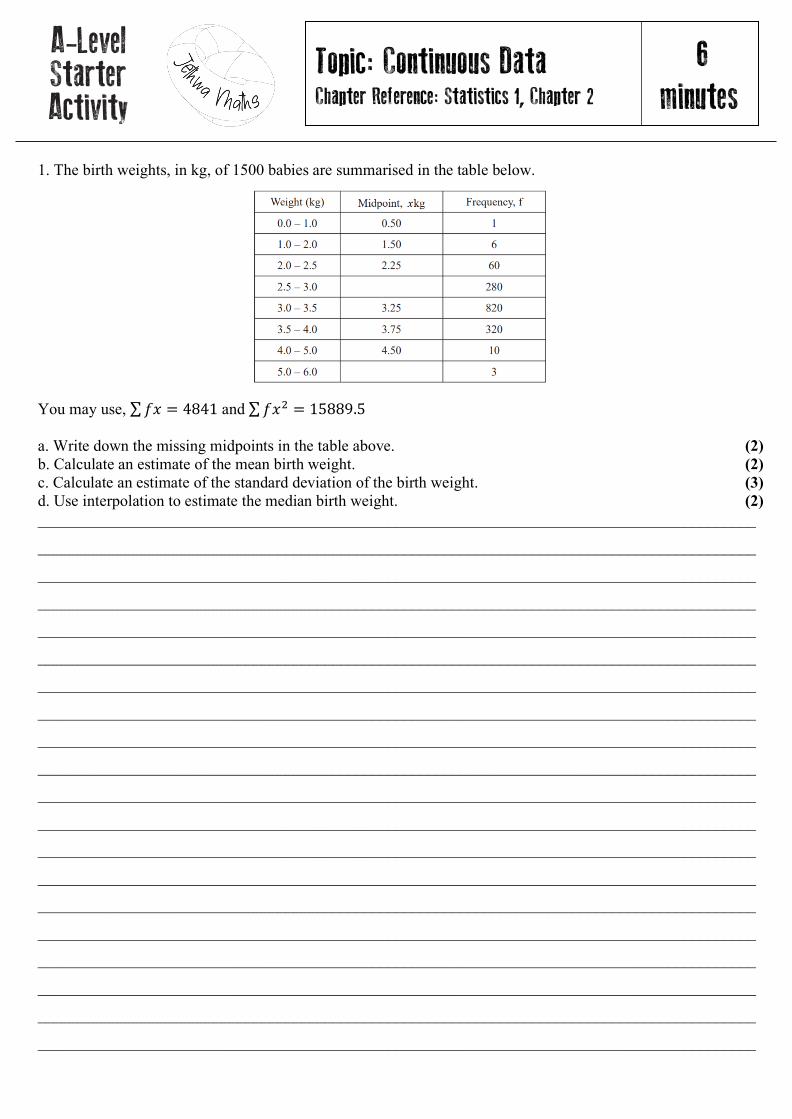
1. The birth weights, in kg, of 1500 babies are summarised in the table below. You may use, ∑𝑓𝑓𝑓𝑓 = 4841 and ∑𝑓𝑓𝑓𝑓2 = 15889.5 a. Write down the missing midpoints in the table above. (2) b. Calculate an estimate of the mean birth weight. (2) c. Calculate an estimate of the standard deviation of the birth weight. (3) d. Use interpolation to estimate the median birth weight. (2) __________________________________________________________________________________________
__________________________________________________________________________________________
__________________________________________________________________________________________
__________________________________________________________________________________________
__________________________________________________________________________________________
__________________________________________________________________________________________
__________________________________________________________________________________________
__________________________________________________________________________________________
__________________________________________________________________________________________
__________________________________________________________________________________________
__________________________________________________________________________________________
__________________________________________________________________________________________
__________________________________________________________________________________________
__________________________________________________________________________________________
__________________________________________________________________________________________
__________________________________________________________________________________________
__________________________________________________________________________________________
__________________________________________________________________________________________
__________________________________________________________________________________________
__________________________________________________________________________________________
A-Level Starter Activity
Topic: Continuous Data Chapter Reference: Statistics 1, Chapter 2
6 minutes

Solutions
1a. 2.75 M1 5.5 M1
1b.
Mean birth weight = 48411500
M1 = 3.2273…. = 3.23 M1
1c.
Standard deviation = �15889.51500
− (48411500
)2 M1
= 0.421093…. M1 = 0.4211 M1
1d.
Q2 = 3 + 403820
× 0.5 M1 = 3.2457…. = 3.25 M1

1. Keith records the amount of rainfall, in mm, at his school, each day for the week. The results are given below:
2.8, 5.6, 2.3, 9.4, 0.0, 0.5, 1.8
Jenny then record the amount of rainfall, x mm, at the school each day for the following 21 days. The results for 21 days are summarised below.
�𝑥𝑥 = 84.6 a. Calculate the mean amount of rainfall during the whole 28 days. (2) Keith realises that he has transposed two of his figures. The number 9.4 should have been 4.9 and the number 0.5 should have been 5.0. Keith corrects these figures. b. State, giving your reason, the effect this will have on the mean. (3) __________________________________________________________________________________________
__________________________________________________________________________________________
__________________________________________________________________________________________
__________________________________________________________________________________________
__________________________________________________________________________________________
__________________________________________________________________________________________
__________________________________________________________________________________________
__________________________________________________________________________________________
__________________________________________________________________________________________
__________________________________________________________________________________________
__________________________________________________________________________________________
__________________________________________________________________________________________
__________________________________________________________________________________________
__________________________________________________________________________________________
__________________________________________________________________________________________
A-Level Starter Activity
Topic: Discrete Data and The Mean Chapter Reference: Statistics 1, Chapter 2
5 minutes

Solutions
1a. mean = 2.8+5.6+2.3+9.4+0.0+0.5+1.8+84.6
28 M1
mean = 10728
mean = 3.8214… mean = 3.82 mm (3 s.f)
M1
1b.
9.4 drops by 4.5 M1 0.5 rises by 4.5 M1 Therefore, there is no change in the mean. M1

1. The following table summaries the time, t, minutes to the nearest minute, recorded for a group of students to complete an exam.
You may use, ∑𝑓𝑓𝑡𝑡2 = 134281.25
a. Estimate the mean and standard deviation of these data. (5) b. Use linear interpolation to estimate the value of the medium. (2) c. Show that the estimated value of the lower quartile is 18.6 to 3 significant figures. (1) d. Estimate the interquartile range of this distribution. (2) The person timing the exam made an error and the student took 5 minutes less than the times recorded above. The table below summarises the actual times. e. Without further calculations, explain the effect this would have on each of the estimates found in parts a, b, c, and d. (3) __________________________________________________________________________________________
__________________________________________________________________________________________
__________________________________________________________________________________________
__________________________________________________________________________________________
__________________________________________________________________________________________
__________________________________________________________________________________________
__________________________________________________________________________________________
__________________________________________________________________________________________
__________________________________________________________________________________________
__________________________________________________________________________________________
__________________________________________________________________________________________
__________________________________________________________________________________________
__________________________________________________________________________________________
__________________________________________________________________________________________
__________________________________________________________________________________________
__________________________________________________________________________________________
__________________________________________________________________________________________
__________________________________________________________________________________________
A-Level Starter Activity
Topic: Quartiles, S.D, Interpolation Chapter Reference: Statistics 1, Chapter 2
10 minutes

__________________________________________________________________________________________
__________________________________________________________________________________________
__________________________________________________________________________________________
__________________________________________________________________________________________
__________________________________________________________________________________________
__________________________________________________________________________________________
__________________________________________________________________________________________
__________________________________________________________________________________________
__________________________________________________________________________________________
__________________________________________________________________________________________
__________________________________________________________________________________________
__________________________________________________________________________________________
__________________________________________________________________________________________
__________________________________________________________________________________________
__________________________________________________________________________________________
__________________________________________________________________________________________
__________________________________________________________________________________________
__________________________________________________________________________________________
__________________________________________________________________________________________
__________________________________________________________________________________________
__________________________________________________________________________________________
__________________________________________________________________________________________
__________________________________________________________________________________________
__________________________________________________________________________________________
__________________________________________________________________________________________
__________________________________________________________________________________________
__________________________________________________________________________________________
__________________________________________________________________________________________
__________________________________________________________________________________________
__________________________________________________________________________________________
__________________________________________________________________________________________
__________________________________________________________________________________________
__________________________________________________________________________________________
__________________________________________________________________________________________
__________________________________________________________________________________________
__________________________________________________________________________________________
__________________________________________________________________________________________

Solutions 1a. ∑𝑓𝑓𝑡𝑡 = 4837.5 M1 Mean = 4837.5
200 M1
Mean = 21.1875 M1
𝜎𝜎 = �134281.25200
− (4837.5200
)2 M1
𝜎𝜎 = 9.2923 M1 1b.
Q2 = [20.5] + 100
100.5−6288
× 5 M1
Q2 = 22.659…. – 22.7 M1 1c.
Q1 = [10.5] + 50
50.2562
× 10 M1
Q1 = 18.56 M1 1d.
Q3 = 25.5 M1 IQR = 6.9 M1
1e.
The mean and standard deviation remain the same M1 The median and the quartiles would decrease M1 The IQR would remain unchanged. M1

1. Cotinine is a chemical that is made by the body from nicotine which is found in cigarette smoke. A doctor tested the blood of 12 patients, who claimed to smoke a packet of cigarettes a day, for cotinine. The results, in appropriate units, are shown below.
You may use ∑𝑥𝑥2 = 724 961 a. Find the mean and standard deviation of the level of cotinine in a patient’s blood. (4) b. Find the medium, upper and lower quartiles of these data. (3) A doctor suspects that some of this patients have been smoking more than a packet of cigarettes per day. He decides to use Q3 + 1.5(Q3 – Q1) to determine if any of the cotinine results are far enough away from the upper quartile to be outliers. c. Identify which patient(s) may have been smoking more than a packet of cigarettes a day. Show your working clearly. (4) __________________________________________________________________________________________
__________________________________________________________________________________________
__________________________________________________________________________________________
__________________________________________________________________________________________
__________________________________________________________________________________________
__________________________________________________________________________________________
__________________________________________________________________________________________
__________________________________________________________________________________________
__________________________________________________________________________________________
__________________________________________________________________________________________
__________________________________________________________________________________________
__________________________________________________________________________________________
__________________________________________________________________________________________
__________________________________________________________________________________________
__________________________________________________________________________________________
__________________________________________________________________________________________
__________________________________________________________________________________________
__________________________________________________________________________________________
__________________________________________________________________________________________
A-Level Starter Activity
Topic: Measures of Spread Chapter Reference: Statistics 1, Chapter 2
6 minutes

Solutions
1a. Mean is 2757
12 M1
= 229.75 M1
Standard Deviation = �72496112
− (229.75)2 M1
= 87.34045 M1 1b.
Ordered list is: 125, 160, 169, 171, 175, 186, 210, 243, 250, 258, 390, 420 Q2 = 1
2(186 + 210) = 198 M1
Q1 = 12
(169 + 171) = 170 M1
Q3 = 12
(250 + 258) = 254 M1 1c.
Q3 + 1.5(Q3 – Q1) = 254 + 1.5(254 – 170) M1 = 280 M1 Therefore patients F(420) M1 and B(390) are outliers. M1

1. A policeman records the speed of the traffic on a busy road with a 30 mph speed limit. He records the speeds of a sample of 450 cars. The histogram in the figure below represents the results. a. Calculate the number of cars that were exceeding the speed limit by at least 5 mph in the sample. (3) b. Estimate the value of the mean speed of the cars in the sample. (3) c. Estimate, to 1 decimal place, the value of the median speed of the cars in the sample. (2) d. State, with a reason, whether the estimate of the mean or median is a better representation of the average speed of the traffic on the road. (2) __________________________________________________________________________________________
__________________________________________________________________________________________
__________________________________________________________________________________________
__________________________________________________________________________________________
__________________________________________________________________________________________
_________________________________________________________________________________________
__________________________________________________________________________________________
__________________________________________________________________________________________
__________________________________________________________________________________________
__________________________________________________________________________________________
__________________________________________________________________________________________
__________________________________________________________________________________________
__________________________________________________________________________________________
__________________________________________________________________________________________
__________________________________________________________________________________________
__________________________________________________________________________________________
__________________________________________________________________________________________
A-Level Starter Activity
Topic: Histograms Chapter Reference: Statistics 1, Chapter 2
7 minutes

__________________________________________________________________________________________
__________________________________________________________________________________________
__________________________________________________________________________________________
__________________________________________________________________________________________
__________________________________________________________________________________________
__________________________________________________________________________________________
__________________________________________________________________________________________
__________________________________________________________________________________________
__________________________________________________________________________________________
__________________________________________________________________________________________
__________________________________________________________________________________________
__________________________________________________________________________________________
__________________________________________________________________________________________
__________________________________________________________________________________________
__________________________________________________________________________________________
__________________________________________________________________________________________
__________________________________________________________________________________________
__________________________________________________________________________________________
__________________________________________________________________________________________
__________________________________________________________________________________________
__________________________________________________________________________________________
__________________________________________________________________________________________
__________________________________________________________________________________________
__________________________________________________________________________________________
__________________________________________________________________________________________
__________________________________________________________________________________________
__________________________________________________________________________________________
__________________________________________________________________________________________
__________________________________________________________________________________________
__________________________________________________________________________________________
__________________________________________________________________________________________
__________________________________________________________________________________________
__________________________________________________________________________________________
__________________________________________________________________________________________
__________________________________________________________________________________________
__________________________________________________________________________________________
__________________________________________________________________________________________
__________________________________________________________________________________________

Solutions
1a. One large square = 450
22.5 M1
One large square = 20 cards M1 Number of cars above 35 mph = 4.5 x 20 = 90 cars M1
1b.
�̅�𝑥 = 30×12.5+240×25+90×32.5+30×37.5+60×42.5250
M1 �̅�𝑥 = 28.83…. M1 �̅�𝑥 = 28.8 M1
1c.
Q2 = 20 + 195240
× 10 M1 Q2 = 28.125 = 28.1 M1
1d.
If the data is equally distributed, use the median as it is not affected by extreme values. M1 If the data is symmetrical, use the mean as all the data is used. M1
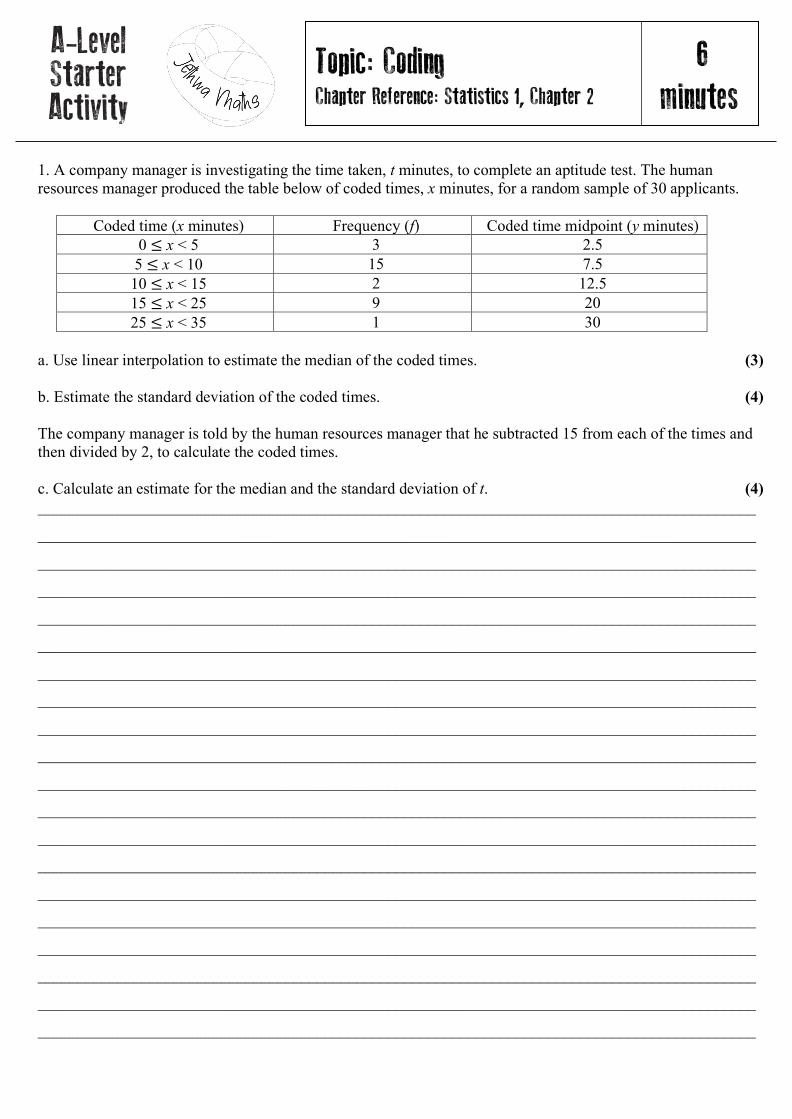
1. A company manager is investigating the time taken, t minutes, to complete an aptitude test. The human resources manager produced the table below of coded times, x minutes, for a random sample of 30 applicants.
Coded time (x minutes) Frequency (f) Coded time midpoint (y minutes) 0 ≤ x < 5 3 2.5 5 ≤ x < 10 15 7.5 10 ≤ x < 15 2 12.5 15 ≤ x < 25 9 20 25 ≤ x < 35 1 30
a. Use linear interpolation to estimate the median of the coded times. (3)
b. Estimate the standard deviation of the coded times. (4) The company manager is told by the human resources manager that he subtracted 15 from each of the times and then divided by 2, to calculate the coded times. c. Calculate an estimate for the median and the standard deviation of t. (4) __________________________________________________________________________________________
__________________________________________________________________________________________
__________________________________________________________________________________________
__________________________________________________________________________________________
__________________________________________________________________________________________
__________________________________________________________________________________________
__________________________________________________________________________________________
__________________________________________________________________________________________
__________________________________________________________________________________________
__________________________________________________________________________________________
__________________________________________________________________________________________
__________________________________________________________________________________________
__________________________________________________________________________________________
__________________________________________________________________________________________
__________________________________________________________________________________________
__________________________________________________________________________________________
__________________________________________________________________________________________
__________________________________________________________________________________________
__________________________________________________________________________________________
__________________________________________________________________________________________
A-Level Starter Activity
Topic: Coding Chapter Reference: Statistics 1, Chapter 2
6 minutes

Solutions
1a. Median lies in the group 5 ≤ x < 10 M1 Q2 = 5 + 12
15× 5 M1
Q2 = 9.166 M1 1b.
Mean = 3 ×2.5+15 ×7.5+2 ×12.5+9×20+1×3030
M1
Mean = 35530
M1
𝜎𝜎2 = 567530
− (35530
)2 M1 𝜎𝜎 = 7.01 M1
1c.
Q2 for t = 2 x 9 + 15 M1 t = 33 M1 𝜎𝜎 for t = 2 x 7.01 M1 𝜎𝜎 = 14.02 M1