a live imaging cell motility screen identifies prostaglandin e2 as a
TRANSCRIPT

of March 18, 2018.This information is current as
Signal Antagonist as a T Cell Stop2Identifies Prostaglandin E
A Live Imaging Cell Motility Screen
and Anna HuttenlocherAndrew J. Wiemer, Subramanya Hegde, Jenny E. Gumperz
ol.1100103http://www.jimmunol.org/content/early/2011/09/07/jimmun
published online 7 September 2011J Immunol
MaterialSupplementary
3.DC1http://www.jimmunol.org/content/suppl/2011/09/07/jimmunol.110010
average*
4 weeks from acceptance to publicationFast Publication! •
Every submission reviewed by practicing scientistsNo Triage! •
from submission to initial decisionRapid Reviews! 30 days* •
Submit online. ?The JIWhy
Subscriptionhttp://jimmunol.org/subscription
is online at: The Journal of ImmunologyInformation about subscribing to
Permissionshttp://www.aai.org/About/Publications/JI/copyright.htmlSubmit copyright permission requests at:
Email Alertshttp://jimmunol.org/alertsReceive free email-alerts when new articles cite this article. Sign up at:
Print ISSN: 0022-1767 Online ISSN: 1550-6606. Immunologists, Inc. All rights reserved.Copyright © 2011 by The American Association of1451 Rockville Pike, Suite 650, Rockville, MD 20852The American Association of Immunologists, Inc.,
is published twice each month byThe Journal of Immunology
by guest on March 18, 2018
http://ww
w.jim
munol.org/
Dow
nloaded from
by guest on March 18, 2018
http://ww
w.jim
munol.org/
Dow
nloaded from

The Journal of Immunology
A Live Imaging Cell Motility Screen Identifies Prostaglandin E2
as a T Cell Stop Signal Antagonist
Andrew J. Wiemer,* Subramanya Hegde,* Jenny E. Gumperz,* and Anna Huttenlocher*,†
The T cell migration stop signal is a central step in T cell activation and inflammation; however, its regulatory mechanisms remain
largely unknown. Using a live-cell, imaging-based, high-throughput screen, we identified the PG, PGE2, as a T cell stop signal
antagonist. Src kinase inhibitors, microtubule inhibitors, and PGE2 prevented the T cell stop signal, and impaired T cell–APC
conjugation and T cell proliferation induced by primary human allogeneic dendritic cells. However, Src inhibition, but not PGE2
or microtubule inhibition, impaired TCR-induced ZAP-70 signaling, demonstrating that T cell stop signal antagonists can
function either upstream or downstream of proximal TCR signaling. Moreover, we found that PGE2 abrogated TCR-induced
activation of the small GTPase Rap1, suggesting that PGE2 may modulate T cell adhesion and stopping through Rap1. These
results identify a novel role for PGs in preventing T cell stop signals and limiting T cell activation induced by dendritic cells. The
Journal of Immunology, 2011, 187: 000–000.
Tcells are highly migratory cells that travel at speeds up to 30mm/min (1) and during inflammation can arrest their mi-gration in response to receptor-mediated signals (2). T cells
receive a migration “stop signal” and can rapidly halt migrationafter TCR signaling and interaction with APCs. Transient T cellstopping can also be sufficient to induce T cell activation undersome conditions (3, 4), and more prolonged interactions can beassociated with the generation of CD8+ memory T cells (5). In anycase, the T cell stop signal is essential for some types of immunesynapse formation and T cell activation (6), and represents an at-tractive therapeutic target. The molecular mechanisms controllingthe T cell stop signal are not well understood but likely involvesignaling through one or more of the TCR proximal kinases Lck,Fyn, and ZAP-70, and activation of the small GTPase Rap1 (7).Inhibiting proximal TCR signaling through ligation of the endog-enous receptor CTLA-4 can reverse the T cell stop signal (8).Despite its importance we have limited understanding of the
signaling pathways that regulate T cell arrest induced by TCRengagement. In this study, we describe a live-cell, imaging-based,high-throughput method to identify signaling pathways that controlthe T cell stop signal induced by TCR ligation. Using live imaging,
we can assess the kinetics that accompany the decision to stop or goin response to TCR engagement and we can identify small mol-ecules that modify the kinetics of T cell stopping, and thereby mayimpact duration of T cell–APC interactions. This is especiallyimportant in light of recent studies that demonstrate that the du-ration of T cell–APC contacts can determine T cell fate and thedevelopment of T cell activation or tolerance (9).In this study, we identified PGE2 as a novel regulator of T cell
stopping and T cell–dendritic cell (DC) interactions. PGs are bio-active lipids that have been implicated in inflammation and aretargeted by cyclooxygenase (COX) inhibitors commonly used totreat inflammatory disease (10, 11). However, the precise mech-anisms by which PGs control inflammation are not well un-derstood, and recent studies have suggested that specific PGs,notably PGE2, may have anti-inflammatory effects (12, 13). Ourfindings provide novel insight into how PGE2 may limit T cellactivation by impairing T cell arrest and inhibiting T cell–DCinteractions. Moreover, our studies demonstrate that PGE2, unlikeSrc kinase inhibition, alters T cell stopping downstream of ZAP-70 and linker of activated T cells (LAT) phosphorylation at thelevel of Rap1 GTPase activation, indicating that the T cell stopsignal can be decoupled from proximal TCR signaling.
Materials and MethodsReagents and supplies
OKT3 Ab was purified from a B cell hybridoma line (14), and ICAM-1–Fcwas purified from transfected CHO cells (15) by affinity to protein G-Sepharose. Calcein-acetoxymethyl ester (AM) was obtained from Invi-trogen (Carlsbad, CA). FTY720 was from Cayman Chemical (Ann Arbor,MI). PHA, PP2, U-73122, and PGE2 were obtained from Fisher Scientific.
T cell purification
Leukocytes were obtained from whole blood (16) using Lymphoprep andresuspended in fresh T cell media (RPMI 1640, 10% heat-inactivated FBS,13 HEPES, pyruvate, nonessential amino acids, b-mercaptoethanol). Cellswere stimulated with PHA and expanded in the presence of IL-2 (50 U/ml;Chiron) for 5–10 d. For conjugation and proliferation assays, fresh humanT cells were magnetically purified by a negative selection method usinga pan T cell isolation kit (Miltenyi Biotec, Auburn, CA).
Generation of DCs
DCs were obtained as described previously (17, 18). Monocytes werepurified by magnetic sorting with anti-CD14 beads (Miltenyi Biotec)and differentiated 3 d in RPMI 1640 media supplemented with 2 mM
*Department of Medical Microbiology and Immunology, University of Wisconsin,Madison, WI 53706; and †Department of Pediatrics, University of Wisconsin, Mad-ison, WI 53706
Received for publication January 20, 2011. Accepted for publication August 1, 2011.
This work was supported by National Institutes of Health/National Institute of Al-lergy and Infectious Diseases Grant R01 AI068062 (to A.H.) and the BurroughsWellcome Foundation (A.H.). A.J.W. received postdoctoral support from a Universityof Wisconsin Institute on Aging Training grant (National Institutes of Health grantT32AG000213-17), Sanjay Asthana, principal investigator.
A.J.W. designed research, performed research, contributed new reagents or analytictools, analyzed data, and wrote the paper; S.H. performed research and reviewed thepaper; J.E.G. designed research and reviewed the paper; and A.H. designed research,analyzed data, and wrote the paper.
Address correspondence and reprint requests to Dr. Anna Huttenlocher, Departmentof Medical Microbiology and Immunology, University of Wisconsin, 4205 Micro-bial Sciences Building, 1550 Linden Avenue, Madison, WI 53706. E-mail address:[email protected]
The online version of this article contains supplemental material.
Abbreviations used in this article: AM, acetoxymethyl ester; COX, cyclooxygenase;DC, dendritic cell; HPBT, human peripheral blood T; LAT, linker of activated T cells;ROI, region of interest; SLE, systemic lupus erythematosus.
Copyright� 2011 by The American Association of Immunologists, Inc. 0022-1767/11/$16.00
www.jimmunol.org/cgi/doi/10.4049/jimmunol.1100103
Published September 7, 2011, doi:10.4049/jimmunol.1100103 by guest on M
arch 18, 2018http://w
ww
.jimm
unol.org/D
ownloaded from

L-glutamine, 100 mg/ml penicillin/streptomycin, and 10% FBS containing300 U/ml recombinant human GM-CSF (Berlex Labs) and 200 U/mlrecombinant human IL-4 (PeproTech, Rocky Hill, NJ).
Plate coating
The 384-well tissue culture-treated plates (BD Optilux) were coated byaddition of ICAM (20 ml to each well) at 5 mg/ml in coating buffer (TrispH 9.5). Plates were incubated at 37˚C for 1 h, washed, and blocked byaddition of 50 ml blocking buffer (2% BSA in 13 PBS) for 1 h at 37˚C.
Quantification of adhesion
Cells were suspended at 500,000/ml and labeled by addition of 1 mMcalcein-AM for 15 min. Cells were collected by centrifugation and washedtwice with media. Cells were plated and centrifuged at 500 3 g for 5 min,then incubated for 30 min at 37˚C in the presence of inhibitors. A total of 1mg/ml OKT3 for was added for 10 min. Cells were aspirated and washedthree to six times with pre-equilibrated fresh media. Adherent cells werequantified by plate reading.
Stop signal assay
We established conditions (modified from Ref. 8) for modeling the T cell stopsignal in a high-throughput assay (Supplemental Table I). Human peripheralblood T (HPBT) cells were labeled with calcein-AM (Invitrogen). A total of50 ml HPBT cells at 1 3 106/ml (after 5–14 d of expansion) was added toeach well of a 384-well plate. Cells were plated and centrifuged at 500 3 gfor 5 min, then incubated for 5 min at 37˚C. For low-throughput experiments,cells were washed twice using pre-equilibrated culture media, and testcompounds were added by pipetting. For high-throughput experiments, cellswere mixed six times with a robotic pipette and media exchanged once. Testcompounds (6–12 mM) were added using a 384-well pin transfer device. TheT cell stop signal was induced with soluble OKT3 (1 mg/ml), a CD3 Abknown to stimulate TCR signaling (14), for 10 min after plating and washingthe cells. Migration was monitored using a BD Pathway microscope. Twoimages were acquired under 103 magnification at an interval of ∼7.5 min.Cells in the t = 0 image were outlined with a three-pixel dilation width todefine the region of interest (ROI) for each cell, and intensity within the ROIwas calculated. Background intensity was subtracted, and the percentageremaining intensity for each individual ROI was calculated according to theequation (Ifinal 2 BG)/(Iinitial 2 BG) = Iremaining, where I is pixel intensity andBG is background intensity. ROIs (cells) with Iremaining values .0.5 weredeemed stopped, whereas those with values ,0.5 were migrating. Hits weredefined by having a percentage migration .40%. Treatment with OKT3caused rapid depolarization, stopped migration within minutes, and changedthe distribution of the population of T cells from primarily migratory tostopped (Supplemental Video 1). Typically, 60–80% of control cells weremigrating compared with 5–20% of the OKT3-treated cells. This approachyielded an average Z9 factor of 0.5 and a 6.7-fold difference between positiveand negative controls.
2 dimensional/OKT3 stop signal
A total of 50 ml HPBT cells (after 5–14 d of expansion) was added to eachwell of a 384-well plate. Cells were plated and centrifuged at 5003 g for 5min, then incubated for 5 min at 37˚C. Cells were washed twice using pre-equilibrated culture media, and test compounds were added by pipetting.Cells were incubated with compounds for 30 min at 37˚C. Stop signal wasinduced by addition of OKT3 Ab for 10 min at 37˚C. Cells were placed onmovable microscope stage in a climate-controlled chamber set at 37˚C.Images were obtained using Metamorph, and data were analyzed byMicrosoft Excel. For typical experiments, images were acquired for 15 minat 30- or 45-s intervals simultaneously for 8–12 experimental conditions.Migration was quantified by cell tracking; typically, 30 cells picked atrandom per video were tracked.
Cell-based conjugation assay
DCs were stimulated for 8 h with 250 ng/ml LPS (Sigma-Aldrich, St. Louis,MO). DCs were labeled with DiD (Invitrogen). T cells were labeled with2.5 mM CFSE. T cells (1 3 105 cells in 100 ml) were treated for 30 minwith indicated concentration of compounds, then mixed at a 1:1 ratio withDCs in media. Mixture was immediately centrifuged at 800 3 g for 3 minand incubated at 37˚C for the indicated time. Mixture was vortexed for 30 sand analyzed by flow cytometry.
T cell proliferation assay
T cells were labeled with 2.5 mM CFSE and cultured at a 50:1 ratio withallogeneic LPS-matured DCs with inhibitors or DMSO. Proliferation was
assessed on day 6 by flow cytometry. The percentage of live T cells that hadundergone cell division was determined by gating on DAPI2 CD3+ cells andassessing the fraction that showed diminished CFSE fluorescence intensity.
Western blot analysis
T cells (days 5–10) at 2 3 107/ml in 0.5–1 ml media were incubated withcompounds for 30 min. Cells were placed on ice for 5 min, then coated with1 mg/ml OKT3 on ice for 20 min. Cells were suspended in 100 ml mediacontaining goat anti-mouse F(Ab9)2 at 37˚C for 3 min. Cells were lysed with500 ml ice-cold radioimmunoprecipitation assay buffer (25 mM Tris-HCl pH7.6, 150 mM NaCl, 1% Nonidet P-40, 1% sodium deoxycholate, 0.1% SDS).Lysing buffer contained freshly added phosphatase inhibitor mixture (1:100dilution, P-5726; Sigma) and protease inhibitor mixture (1:100 dilution, P-8340; Sigma). Proteins were resolved by SDS-PAGE on 10% gels, trans-ferred to nitrocellulose, and blotted with p-ZAP-70–Y319 (Cell Signaling),p-LAT-Y191 (Cell Signaling), p-Lck-Y505 (Cell Signaling), pY (4G10),vinculin (Sigma), p-Src-416 (Cell Signaling), p-Src-529 (Cell Signaling), orFyn (Santa Cruz) Abs. Detection was performed using Alexa Fluor 680 goatanti-mouse IgG (Molecular Probes) and IRDye 800CW goat anti-rabbit IgG(Rockland).
Rap1 activation assay
Activated HPBT cells (25 3 106) were suspended in 1 ml fresh T cellmedia in the presence or absence of test compounds for 30 min at 37˚C andstimulated with OKT3 as described earlier. Cells were lysed in 500 mlRap1 lysis buffer (1% Triton X-100; 50 mM Tris-HCl, pH 7.5; 100 mMNaCl; 10 mM MgCl2; 1 mM PMSF; 1 mM leupeptin; 0.5 mM aprotinin)(19). Lysates were cleared by centrifugation (16,000 rpm for 10 min) andincubated with glutathione S-transferase-RalGDS-Rap-binding domain(Millipore) for 1 h at 4˚C with rotation. Beads were washed three timeswith lysis buffer and subjected to Western blot analysis with anti-Rap1(Santa Cruz). Twenty-five microliters lysate was reserved to use as aloading control.
IL-2 production
Activated HPBT cells (1.5 3 106) in 1 ml T cell media were added to 24-well plates that had been precoated for 2 h with 1 mg/ml OKT3 in PBS.Cells were stimulated for 5 h at 37˚C in the presence of brefeldin A(eBioscience). Cells were pelleted by centrifugation and resuspended inFACS buffer (2% FBS in PBS). Cells were labeled with allophycocyanin-CD4 (eBioscience) according to manufacturer’s protocol, washed, andfixed overnight with 4% paraformaldehyde. Cells were resuspended inFACS buffer containing 0.1% saponin for 15 min. Cells were blocked for15 min with Fc block (eBioscience) and labeled for 30 min with FITC–IL-2 (eBioscience). Cells were washed twice with FACS buffer and analyzedby flow cytometry.
Statistical analysis
All columns in bar graphs represent the mean of the indicated number ofreplicates. Error bars on graphs represent SEMs. ANOVAwith Tukey’s posthoc testing was used to calculate statistical significance. Unless otherwiseindicated, comparisons were done relative to the control. An a level of0.05 was used as the level of significance.
ResultsThe Src inhibitor, PP2, is a T cell stop signal antagonist
To identify novel regulators of the T cell migration stop signal, wedeveloped an image-based, high-throughput screen for small mol-ecules that impair TCR-induced T cell arrest (Fig. 1, SupplementalTable I, Supplemental Video 1). The T cell stop signal was inducedin primary human T cells by treatment with the anti-CD3 Ab OKT3as described in Materials and Methods (Fig. 1A). Soluble OKT3was sufficient to induce the T cell stop signal without TCR cross-linking or costimulation with anti-CD28 Ab, which is generallyrequired to induce full T cell activation and proliferation, suggest-ing that early TCR engagement may be sufficient to induce theT cell stop signal (Fig. 1B, Supplemental Video 1).Lck and Fyn both play a critical role in proximal TCR signal
transduction (20). To determine whether inhibition of proximalTCR signal transduction was sufficient to block the stop signal, wepretreated T cells with the Src kinase inhibitor PP2, which inhi-bits both Lck and Fyn activity (20). PP2 had no effect on T cell
2 PGE2 PREVENTS THE T CELL STOP SIGNAL
by guest on March 18, 2018
http://ww
w.jim
munol.org/
Dow
nloaded from
random motility on ICAM-1 but blocked T cell arrest induced byTCR ligation with OKT3 (Fig. 1B). In the presence of both OKT3and PP2, primary human T cells on ICAM-1 demonstrated rapid,random motility comparable with untreated control T cells onICAM-1. The findings demonstrate that Src kinases are requiredfor the T cell stop signal but not T cell random motility.
Src kinase inhibitors PP1 and SU6656, but not SKI-1, impairTCR-induced T cell arrest
To determine whether blocking proximal TCR signal transductionusing other Src family kinase inhibitors was also sufficient toblock the TCR-induced stop signal, we used a panel of other Src
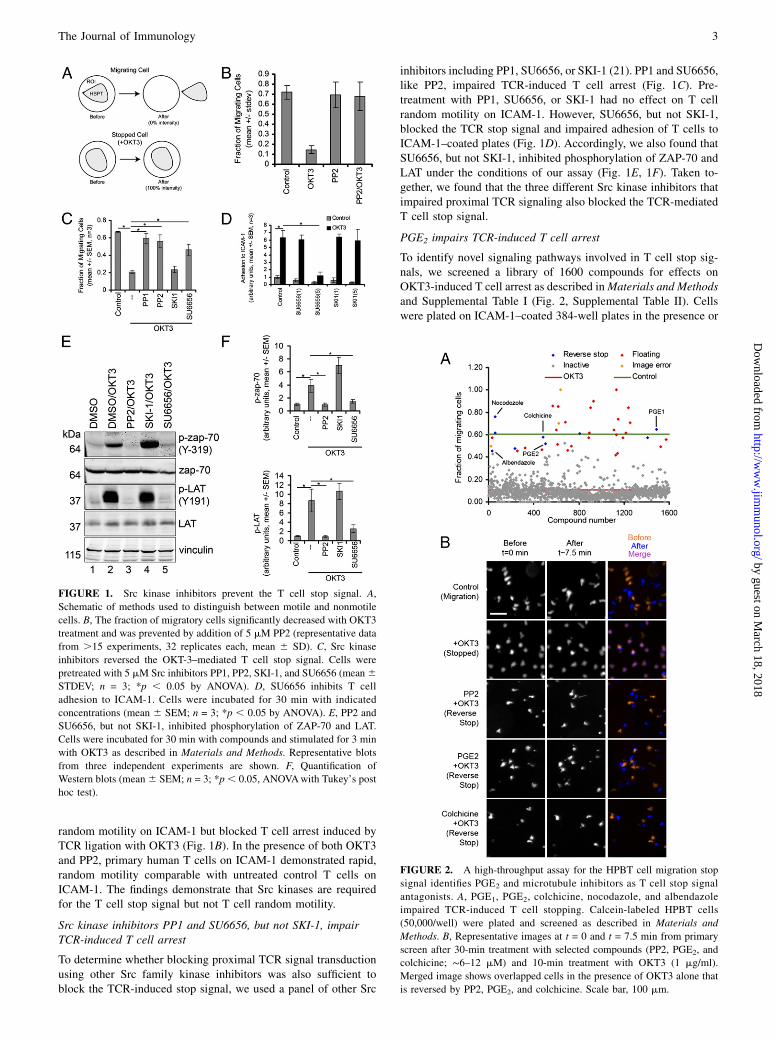
inhibitors including PP1, SU6656, or SKI-1 (21). PP1 and SU6656,like PP2, impaired TCR-induced T cell arrest (Fig. 1C). Pre-treatment with PP1, SU6656, or SKI-1 had no effect on T cellrandom motility on ICAM-1. However, SU6656, but not SKI-1,blocked the TCR stop signal and impaired adhesion of T cells toICAM-1–coated plates (Fig. 1D). Accordingly, we also found thatSU6656, but not SKI-1, inhibited phosphorylation of ZAP-70 andLAT under the conditions of our assay (Fig. 1E, 1F). Taken to-gether, we found that the three different Src kinase inhibitors thatimpaired proximal TCR signaling also blocked the TCR-mediatedT cell stop signal.
PGE2 impairs TCR-induced T cell arrest
To identify novel signaling pathways involved in T cell stop sig-nals, we screened a library of 1600 compounds for effects onOKT3-induced T cell arrest as described inMaterials and Methodsand Supplemental Table I (Fig. 2, Supplemental Table II). Cellswere plated on ICAM-1–coated 384-well plates in the presence or
FIGURE 1. Src kinase inhibitors prevent the T cell stop signal. A,
Schematic of methods used to distinguish between motile and nonmotile
cells. B, The fraction of migratory cells significantly decreased with OKT3
treatment and was prevented by addition of 5 mM PP2 (representative data
from .15 experiments, 32 replicates each, mean 6 SD). C, Src kinase
inhibitors reversed the OKT-3–mediated T cell stop signal. Cells were
pretreated with 5 mM Src inhibitors PP1, PP2, SKI-1, and SU6656 (mean6STDEV; n = 3; *p , 0.05 by ANOVA). D, SU6656 inhibits T cell
adhesion to ICAM-1. Cells were incubated for 30 min with indicated
concentrations (mean 6 SEM; n = 3; *p , 0.05 by ANOVA). E, PP2 and
SU6656, but not SKI-1, inhibited phosphorylation of ZAP-70 and LAT.
Cells were incubated for 30 min with compounds and stimulated for 3 min
with OKT3 as described in Materials and Methods. Representative blots
from three independent experiments are shown. F, Quantification of
Western blots (mean6 SEM; n = 3; *p, 0.05, ANOVAwith Tukey’s post
hoc test).
FIGURE 2. A high-throughput assay for the HPBT cell migration stop
signal identifies PGE2 and microtubule inhibitors as T cell stop signal
antagonists. A, PGE1, PGE2, colchicine, nocodazole, and albendazole
impaired TCR-induced T cell stopping. Calcein-labeled HPBT cells
(50,000/well) were plated and screened as described in Materials and
Methods. B, Representative images at t = 0 and t = 7.5 min from primary
screen after 30-min treatment with selected compounds (PP2, PGE2, and
colchicine; ∼6–12 mM) and 10-min treatment with OKT3 (1 mg/ml).
Merged image shows overlapped cells in the presence of OKT3 alone that
is reversed by PP2, PGE2, and colchicine. Scale bar, 100 mm.
The Journal of Immunology 3
by guest on March 18, 2018
http://ww
w.jim
munol.org/
Dow
nloaded from

absence of test compounds. Approximately 60% of control cells(green line) were actively migrating, whereas stimulation withOKT3 induced a stop signal, decreasing migration to ∼10% (Fig.2A, red line). The majority of test compounds did not alter theability of T cells to stop migrating (Fig. 2A, gray dots). Afterconfirmation, five compounds, 0.31% of the total screened, pre-vented the T cell stop signal (Fig. 2A). The positive compoundsincluded two PGs (PGE1 and PGE2) and three microtubule-disrupting compounds (colchicine, albendazole, and nocodazole;Table I). Representative time-lapse images for PP2, PGE2, andcolchicine are shown in Fig. 2B. Control cells that were activelymigrating do not colocalize at times t = 0 and t = 7.5, whereascells stopped with OKT3 colocalized. Treatment with PP2, PGE2,or colchicine was sufficient to reverse colocalization and blockT cell stopping.
To confirm these results, we performed time-lapse microscopy totrack the kinetics of T cell motility in T cells stimulated with OKT3 inthe presence and absence of test compounds (Fig. 3). As previouslyreported, primary human T cells were highly polarized and motile onICAM-1–coated plates (Fig. 3A). Treatment with OKT3 induceda loss of T cell polarity and impaired migration (from 10 mm/min incontrol T cells to 3 mm/min with OKT3; Fig. 3). The effects ofOKT3 on cell polarity and T cell motility were prevented by eithertreatment with PGE2 or the microtubule-disrupting compound, col-chicine (Fig. 3B, 3C, Supplemental Videos 2–4). The other positivehits also increased T cell polarity and random motility in the presenceof OKT3 (Supplemental Fig. 1A); however, PP2 was most effectiveat reversing T cell stopping. Taken together, these results identifyboth PGs (PGE2) and microtubule-disrupting agents (colchicine) asnovel T cell stop signal antagonists. The identification of PGs as stop
Table I. Confirmed hits from screening 1600 compounds of known bioactivity
Name Structure % Migration
ControlsUntreated Not applicable 72CD3 Not applicable 15PP2 68
ProstanoidsAlprostadil (PGE1) 65
Dinoprostone (PGE2) 52
MicrotubulesColchicine 58
Albendazole 46
Nocodazole 62
4 PGE2 PREVENTS THE T CELL STOP SIGNAL
by guest on March 18, 2018
http://ww
w.jim
munol.org/
Dow
nloaded from

signal antagonists is particularly surprising because PGs have pre-viously been reported to inhibit T cell-directed migration (22).
PP2, but not PGE2 or colchicine, impairs proximal TCR signaltransduction
Src kinase inhibition with PP2 prevents proximal TCR signaltransduction and activation of ZAP-70. To determinewhether PGE2
functions upstream of proximal T cell signaling to affect T cellarrest, we characterized the effects of PGE2 on phosphorylation ofdownstream targets (Fig. 4). In accordance with previous reports,stimulation of human T cells with OKT3 for 3 min induced anincrease in total tyrosine phosphorylation, which was blockedby PP2 but was not altered by treatment with PGE2 or colchicine.To determine whether PGE2 affects ZAP-70 phosphorylation, weexamined phosphorylation on tyrosine 319 (23). OKT3 stronglystimulated ZAP-70 Y319 phosphorylation, which was preventedby treatment with PP2. In contrast, PGE2 and colchicine, at con-centrations that abrogate T cell arrest, had no effect on OKT3-induced ZAP-70 phosphorylation. PP2, but not PGE2 or colchi-cine, prevented OKT3-induced ZAP-70 activation and phos-phorylation of LAT at Y191. Moreover, PP2, but not PGE2 orcolchicine, decreased levels of the activating Fyn phosphorylationat Y420. Taken together, these results demonstrate that PGE2 andcolchicine, in contrast with PP2, function as T cell stop signalantagonists downstream or independently of proximal T cell sig-nal transduction. These results were surprising because PGE2 has
been reported to inhibit Src kinase activity under some conditions(10, 24).
PGE2 impairs TCR-induced, LFA-1–mediated adhesion toICAM-1
TCR engagement induces LFA-1 activation and T cell adhesionto ICAM-1 (25). To determine whether PGE2 modulates TCR-mediated LFA-1 activation, we tested the effects of PGE2 onT cell adhesion to ICAM-1 in the presence of OKT3. Treatmentwith OKT3 induced a 3- to 6-fold increase in adhesion to ICAM-1relative to untreated control cells (Fig. 5A). PP2 blocked TCR-induced adhesion of T cells to ICAM-1. PGE2 and colchicinealso impaired T cell adhesion to ICAM-1 in the presence ofOKT3. These results suggest that PGE2 limits T cell arrest by im-pairing TCR-mediated inside-out LFA-1 activation and adhesion toICAM-1.
PGE2 impairs TCR-induced Rap1 activation
TCR engagement induces activation of the small GTPase Rap1,which is required for inside out activation of LFA-1 and subsequentadhesion to ICAM-1 (19). To determine whether PGE2 modulatesRap1 activation, we tested the effects of PGE2 on Rap1 GTPbinding after stimulation with OKT3. OKT3 induced an ∼8-foldincrease in GTP-bound Rap1 relative to untreated control cells(Fig. 5B). Both PP2 and PGE2 blocked Rap1 activation (Fig. 5C).These results suggest that PGE2 may limit T cell arrest by pre-
FIGURE 3. PGE2 treatment impairs the TCR stop
signal. A, Differential interference contrast microscopy
images of HPBT cells migrating on ICAM-1 in the
presence or absence of PGE2 (5 mM) and OKT3 (1 mg/
ml) demonstrated that OKT3 induced a loss of cell
polarity that is abrogated in the presence of both PGE2
and OKT3. Scale bar, 20 mm. B, Displacement of in-
dividual cells during a 15-min period. C, Migration
speeds (in mm/min) expressed as mean 6 SEM (n = 3;
*p , 0.05, ANOVA).
The Journal of Immunology 5
by guest on March 18, 2018
http://ww
w.jim
munol.org/
Dow
nloaded from

venting Rap1 GTPase activation and impairing LFA-1–mediatedadhesion to ICAM-1.
PGE2 impairs T cell–DC interactions and DC-induced T cellproliferation
Duration of T cell–DC interactions modulate T cell fate and ac-tivation (9). To determine whether PGE2 modulates human T cell–DC interactions, we characterized the effects of PGE2 on theinteractions between T cells and allogeneic DCs using flowcytometry. DCs were derived from peripheral blood monocytestreated with GM-CSF and IL-4 for 3 d, followed by LPS for 8 h.Interactions with naive human T cells labeled with CFSE wereperformed using flow cytometry as described in Materials andMethods (17) (Fig. 6, Supplemental Fig. 1B). In the presence ofvehicle control, the efficiency of T cell–DC conjugation was22.3% (Fig. 6A). PP2 (50 mM) reduced the rate of conjugation to9.5%, which was reported as TCR-dependent conjugation. Treat-ment of T cells with PGE2 (50 mM) also inhibited conjugation,with an approximate 60% decrease in TCR-dependent conjugation(Fig. 6B, 6C). To determine whether PGE2 modulates downstreamT cell signaling, we tested the effects of PGE2 on TCR-stimulatedIL-2 production (Fig. 6D). OKT3 induced a ∼15-fold increase inIL-2 production relative to untreated control cells. PP2, PGE2, andcolchicine blocked TCR-induced IL-2 production.To determine whether PGE2 modulates DC-induced T cell pro-
liferation, we analyzed proliferation of T cells using CFSE dilu-tion at day 6 after stimulation with allogeneic DCs (Fig. 6E,Supplemental Fig. 1C). In the presence of DMSO only, 31% ofcells were proliferative. PP2 and PGE2 blocked T cell prolifera-
tion at concentrations of 50 mM (0.6 and 0.5% of control, re-spectively). The inhibition by PGE2 was dose dependent (Fig. 6F),and a statistically significant decrease in proliferation was seen atconcentrations as low as 2.5 mM. Growth inhibition was alsoobserved on stimulation with CD3/CD28-coated beads in the pres-ence of PGE2 (Supplemental Fig. 1D). Taken together, these datademonstrate that PGE2 impairs T cell–DC conjugation and DC-induced T cell proliferation.
DiscussionThe identification of small molecules that alter T cell interactionswith APCs represents an intriguing therapeutic strategy for auto-immune diseases such as rheumatoid arthritis and systemic lupuserythematosus (SLE). Indeed, a recent study has highlighted thecritical importance of T cell and APC contact duration in deter-mining T cell fate in vivo and the development of T cell toleranceor activation (9). There are currently no known small moleculesthat reverse the T cell stop signal in clinical use, and the additionof such drugs to treat autoimmune diseases is particularly attrac-tive given the high cost of biologic agents and the resultant burdenon the healthcare system. In this study, we have identified at leastthree distinct classes of “reverse-stop” small molecules that impairTCR-induced T cell arrest but not random T cell motility: 1) Srcfamily tyrosine kinase inhibitors, 2) microtubule depolymerizingagents, and 3) PGs. These compounds act in contrast with inhib-itors of phospholipase C (U73122), which block both basaland activated T cell motility or sphingosine-1-phosphate analogFTY720 and the PI3K inhibitor LY-294002, which altered basalmotility but did not affect adhesion or spreading induced by OKT3(Supplemental Table III).
FIGURE 4. PP2, but not PGE2 or colchicine, impairs TCR-induced
phosphorylation of ZAP-70 and LAT. A, Western blot analysis of whole-
cell lysate. Cells were treated with 5 mM compounds. OKT3 induced total
tyrosine phosphorylation (4G10) and phosphorylation of ZAP-70 at Y319
and phosphorylation of LAT at Y191, which was prevented by treatment
with PP2, but not PGE2 or colchicine. PP2, but not PGE2 or colchicine,
also impaired phosphorylation of Fyn. For analysis of Fyn, lysates were
immunoprecipitated with Fyn Ab and blotted with p-Src-418 Ab. One
representative blot from three experiments is shown. B, Quantification of
Western blots (mean 6 SEM; n = 3; *p , 0.05, ANOVA).
FIGURE 5. PGE2 treatment impairs TCR-induced adhesion to ICAM-1
and activation of Rap1. A, Adhesion to ICAM-1. Cells were treated with 10
or 50 mM PP2, colchicine, or PGE2 and assessed for adhesion to ICAM-1
in the presence or absence of OKT3. B, Representative Western blot
analysis of GTP-bound Rap1 after treatment with 10 mM PP2 or PGE2 and
stimulation with OKT3. C, Quantification of rap1 GTP binding (mean 6SEM; n = 3; *p , 0.05, ANOVA).
6 PGE2 PREVENTS THE T CELL STOP SIGNAL
by guest on March 18, 2018
http://ww
w.jim
munol.org/
Dow
nloaded from

The requirement of Src family kinases for the TCR-inducedT cell stop signal, but not for T cell random motility, indicatesthat Src inhibitors represent T cell stop signal antagonists. This isconsistent with the model that proximal T cell signaling is nec-essary for TCR-induced T cell arrest. It is intriguing that not all Srckinase inhibitors, most notably SKII, are capable of reversing theT cell stop signal. The results suggest that the stop signal is de-pendent on an Src family kinase, which is preferentially targeted byPP1, PP2, and SU6656, but not SKI1.
Previous work has indicated that Src kinase activation is requiredfor TCR-mediated polarization of the microtubule-organizingcenter toward the T cell–APC contact (26) (27). It is interestingthat our data indicate that Src inhibitors and microtubule disrup-tion impair T cell stopping and interactions with APC. This is, toour knowledge, the first report to show that microtubules arenecessary for the T cell arrest induced by TCR ligation. In ac-cordance with our findings, previous studies have reported thatmicrotubule disruption induces random motility of neutrophils(28) and modulates T cell random migration through rho/ROCKsignaling (29). However, ROCK inhibition did not affect TCR-induced T cell stopping in our system, suggesting that effects ofmicrotubule inhibition on T cell arrest may be independent ofRho/ROCK signaling.The finding that both microtubule polymerization inhibitors
and PGs are capable of preventing the T cell stop signal withoutaffecting ZAP-70 or LAT phosphorylation (i.e., proximal TCRsignaling) is particularly interesting (Fig. 3). In fact, we had ini-tially hypothesized that the screening results would yield mole-cules that work to disrupt proximal signaling, such as the Srcinhibitors. Our findings suggest that it is possible to decoupleproximal TCR signaling from the TCR stop signal. PGE2 had noeffect on the phosphorylation of Lck or Fyn at concentrations thatblock T cell arrest, suggesting that PGE2 effects on T cell arrestare independent of its effects on Src kinase activity. Our findingsidentified a novel role for PGE2 in the regulation of the smallGTPase Rap1, which is critical for TCR-induced inside-out acti-vation of LFA-1.To our knowledge, this is the first report to implicate PGE2
in regulating the T cell stop signal. In contrast, previous studieshave reported that PGE2 stimulates the ability of DCs to induceT cell proliferation (30). The finding that PGE1 and PGE2 impairT cell migration stopping, as well as inhibit T cell proliferation(31), indicate there may be counteracting mechanisms in place.Therefore, the presence of PGs may both promote and block DC-dependent T cell activation depending on the context of expo-sure. In addition, although PGE2 has been largely thought to beproinflammatory, recent studies have suggested that PGE2 and PGanalogs may be anti-inflammatory in cases of autoimmune dis-eases such as SLE (13), because of its effects on DC-mediatedcytokine production and shifting immune response from a Th1 toTh2 profile. Inhibition of the TCR stop signal would provide anadditional anti-inflammatory mechanism for PGE2.Interactions between DCs and T cells play a central role in the
pathogenesis of autoimmune diseases such as SLE and representan important therapeutic target. In addition to affecting the TCRstop signal, we found that PGE2 significantly impaired T cell–DCinteractions and DC-induced T cell proliferation (Fig. 4). PGE2
and certain PG analogs are Food and Drug Administration-approved agents, and the novel effects on T cell stop signal andinteractions with DCs suggest they may have therapeutic benefit inpatients with SLE. In support of this possibility is a recent articlethat suggests that PGE2 also inhibits IFN-a secretion by plasma-cytoid DCs, key players in SLE pathogenesis (13). In addition,another report recently demonstrated that COX inhibitors disruptresolution of inflammation that was dependent on PGE2 in amouse arthritis model (12). Moreover, our results may help toexplain why exacerbation of SLE-like symptoms has been re-ported in patients treated with COX inhibitors (13), which func-tion to decrease PG synthesis.In summary, we have identified small molecules that modulate
the T cell stop signal using a novel image-based, high-throughputscreen. Because the approach is activation based rather than in-hibition based, there are likely to be fewer off-target hits. We have
FIGURE 6. PGE2 inhibits T cell conjugation and proliferation with al-
logeneic DCs. A, CFSE-labeled T cells were mixed with allogeneic DiD-
labeled DCs and assessed for conjugation in the presence or absence of
PP2 (50 mM) or PGE2 (50 mM). Conjugation events as a percentage of
total events for one representative experiment are shown. B, Percentage
of conjugation from three independent experiments in the presence or ab-
sence of colchicine (50 mM), PP2 (50 mM), or PGE2 (50 mM). C, Fraction
of TCR-dependent conjugation inhibited by PGE2 (mean 6 SEM; n = 3;
*p , 0.05, ANOVA). D, IL-2 production in T cells that had been pre-
treated with PP2, PGE2, or colchicine (mean 6 SEM; n = 3; *p , 0.05,
ANOVA). E, CFSE-labeled T cells were activated by DCs and analyzed for
proliferation by CFSE dilution at 6 d poststimulation in the presence or
absence of PGE2 (50 mM) or PP2 (50 mM). Data are representative from
three independent experiments. F, Dose-response curves for allogeneic DC
stimulated T cell proliferation in the presence or absence of PGE2, PP2, or
colchicine (mean 6 SEM; n = 3; *p , 0.05, ANOVA).
The Journal of Immunology 7
by guest on March 18, 2018
http://ww
w.jim
munol.org/
Dow
nloaded from

shown that Src kinase inhibitors potently block the T cell stopsignal and impair T cell–DC interactions. Our findings suggest thatcompounds that function either downstream or independently ofZAP-70 and LAT are also capable of reversing the T cell stopsignal. The ability of PGs to block TCR-induced Rap1 activationand antagonize the T cell stop signal is especially intriguing andsupports the use of this class of compounds as therapeutic agentsthat may have benefit in autoimmune disease. Likewise, theseresults may help explain the surprising proinflammatory effectssometimes seen with COX-2 inhibitors. Taken together, the find-ings suggest that small molecules that reverse the migration stopsignal in vitro may either impair proximal TCR signaling, inhibitsignaling at the level of Rap1, or directly induce random mo-tility, thereby limiting TCR-induced stopping and DC-inducedT cell activation. This study illustrates that high-throughput im-aging of primary human cells can effectively be used to identifysmall molecules that alter migration stopping, allowing for fur-ther understanding of the molecular mechanisms that regulateAg-induced T cell arrest, and offering a new paradigm for drugdiscovery.
AcknowledgmentsWe thank Noel Peters and Song Guo at the University of Wisconsin Keck
Small Molecule Screening Facility and Kathy Schell at the University of
Wisconsin Flow Cytometry Facility for technical assistance. We thank
Sarah Wernimont, Miriam Shelef, David Bennin, and Taylor Starnes for
phlebotomy assistance.
DisclosuresThe authors have no financial conflicts of interest.
References1. Friedl, P., and B. Weigelin. 2008. Interstitial leukocyte migration and immune
function. Nat. Immunol. 9: 960–969.2. Dustin, M. L., S. K. Bromley, Z. Kan, D. A. Peterson, and E. R. Unanue. 1997.
Antigen receptor engagement delivers a stop signal to migrating T lymphocytes.Proc. Natl. Acad. Sci. USA 94: 3909–3913.
3. Gunzer, M., A. Schafer, S. Borgmann, S. Grabbe, K. S. Zanker, E. B. Brocker,E. Kampgen, and P. Friedl. 2000. Antigen presentation in extracellular matrix:interactions of T cells with dendritic cells are dynamic, short lived, and se-quential. Immunity 13: 323–332.
4. Gunzer, M., C. Weishaupt, A. Hillmer, Y. Basoglu, P. Friedl, K. E. Dittmar,W. Kolanus, G. Varga, and S. Grabbe. 2004. A spectrum of biophysical in-teraction modes between T cells and different antigen-presenting cells duringpriming in 3-D collagen and in vivo. Blood 104: 2801–2809.
5. Scholer, A., S. Hugues, A. Boissonnas, L. Fetler, and S. Amigorena. 2008. In-tercellular adhesion molecule-1-dependent stable interactions between T cellsand dendritic cells determine CD8+ T cell memory. Immunity 28: 258–270.
6. Mempel, T. R., S. E. Henrickson, and U. H. Von Andrian. 2004. T-cell priming bydendritic cells in lymph nodes occurs in three distinct phases. Nature 427: 154–159.
7. Guy, C. S., and D. A. Vignali. 2009. Organization of proximal signal initiation atthe TCR:CD3 complex. Immunol. Rev. 232: 7–21.
8. Schneider, H., J. Downey, A. Smith, B. H. Zinselmeyer, C. Rush, J. M. Brewer,B. Wei, N. Hogg, P. Garside, and C. E. Rudd. 2006. Reversal of the TCR stopsignal by CTLA-4. Science 313: 1972–1975.
9. Katzman, S. D., W. E. O’Gorman, A. V. Villarino, E. Gallo, R. S. Friedman,M. F. Krummel, G. P. Nolan, and A. K. Abbas. 2010. Duration of antigen re-ceptor signaling determines T-cell tolerance or activation. Proc. Natl. Acad. Sci.USA 107: 18085–18090.
10. Chemnitz, J. M., J. Driesen, S. Classen, J. L. Riley, S. Debey, M. Beyer,A. Popov, T. Zander, and J. L. Schultze. 2006. Prostaglandin E2 impairs CD4+T cell activation by inhibition of lck: implications in Hodgkin’s lymphoma.Cancer Res. 66: 1114–1122.
11. Wymann, M. P., and R. Schneiter. 2008. Lipid signalling in disease. Nat. Rev.Mol. Cell Biol. 9: 162–176.
12. Chan, M. M., and A. R. Moore. 2010. Resolution of inflammation in murineautoimmune arthritis is disrupted by cyclooxygenase-2 inhibition and restoredby prostaglandin E2-mediated lipoxin A4 production. J. Immunol. 184: 6418–6426.
13. Fabricius, D., M. Neubauer, B. Mandel, C. Schutz, A. Viardot, A. Vollmer,B. Jahrsdorfer, and K. M. Debatin. 2010. Prostaglandin E2 inhibits IFN-alphasecretion and Th1 costimulation by human plasmacytoid dendritic cells via E-prostanoid 2 and E-prostanoid 4 receptor engagement. J. Immunol. 184: 677–684.
14. Van Wauwe, J. P., J. R. De Mey, and J. G. Goossens. 1980. OKT3: a monoclonalanti-human T lymphocyte antibody with potent mitogenic properties. J. Immu-nol. 124: 2708–2713.
15. Stanley, P., and N. Hogg. 1998. The I domain of integrin LFA-1 interacts withICAM-1 domain 1 at residue Glu-34 but not Gln-73. J. Biol. Chem. 273: 3358–3362.
16. Simonson, W. T. N., S. J. Franco, and A. Huttenlocher. 2006. Talin1 regulatesTCR-mediated LFA-1 function. J. Immunol. 177: 7707–7714.
17. Hegde, S., E. Jankowska-Gan, D. A. Roenneburg, J. Torrealba,W. J. Burlingham, and J. E. Gumperz. 2009. Human NKT cells promotemonocyte differentiation into suppressive myeloid antigen-presenting cells. J.Leukoc. Biol. 86: 757–768.
18. Hegde, S., X. Chen, J. M. Keaton, F. Reddington, G. S. Besra, andJ. E. Gumperz. 2007. NKT cells direct monocytes into a DC differentiationpathway. J. Leukoc. Biol. 81: 1224–1235.
19. Katagiri, K., M. Hattori, N. Minato, and T. Kinashi. 2002. Rap1 functions asa key regulator of T-cell and antigen-presenting cell interactions and modulatesT-cell responses. Mol. Cell. Biol. 22: 1001–1015.
20. Salmond, R. J., A. Filby, I. Qureshi, S. Caserta, and R. Zamoyska. 2009. T-cellreceptor proximal signaling via the Src-family kinases, Lck and Fyn, influencesT-cell activation, differentiation, and tolerance. Immunol. Rev. 228: 9–22.
21. Blake, R. A., M. A. Broome, X. Liu, J. Wu, M. Gishizky, L. Sun, andS. A. Courtneidge. 2000. SU6656, a selective src family kinase inhibitor, used toprobe growth factor signaling. Mol. Cell. Biol. 20: 9018–9027.
22. Mesri, M., J. Liversidge, and J. V. Forrester. 1996. Prostaglandin E2 andmonoclonal antibody to lymphocyte function-associated antigen-1 differentiallyinhibit migration of T lymphocytes across microvascular retinal endothelial cellsin rat. Immunology 88: 471–477.
23. Pelosi, M., V. Di Bartolo, V. Mounier, D. Mege, J. M. Pascussi, E. Dufour,A. Blondel, and O. Acuto. 1999. Tyrosine 319 in the interdomain B of ZAP-70 isa binding site for the Src homology 2 domain of Lck. J. Biol. Chem. 274: 14229–14237.
24. Choudhry, M. A., S. Uddin, and M. M. Sayeed. 1998. Prostaglandin E2 modu-lation of p59fyn tyrosine kinase in T lymphocytes during sepsis. J. Immunol.160: 929–935.
25. Abraham, C., J. Griffith, and J. Miller. 1999. The dependence for leukocytefunction-associated antigen-1/ICAM-1 interactions in T cell activation cannot beovercome by expression of high density TCR ligand. J. Immunol. 162: 4399–4405.
26. Martın-Cofreces, N. B., D. Sancho, E. Fernandez, M. Vicente-Manzanares,M. Gordon-Alonso, M. C. Montoya, F. Michel, O. Acuto, B. Alarcon, andF. Sanchez-Madrid. 2006. Role of Fyn in the rearrangement of tubulin cyto-skeleton induced through TCR. J. Immunol. 176: 4201–4207.
27. Gomez, T. S., and D. D. Billadeau. 2008. T cell activation and the cytoskeleton:you can’t have one without the other. Adv. Immunol. 97: 1–64.
28. Xu, J., F. Wang, A. Van Keymeulen, M. Rentel, and H. R. Bourne. 2005.Neutrophil microtubules suppress polarity and enhance directional migration.Proc. Natl. Acad. Sci. USA 102: 6884–6889.
29. Takesono, A., S. J. Heasman, B. Wojciak-Stothard, R. Garg, and A. J. Ridley.2010. Microtubules regulate migratory polarity through Rho/ROCK signaling inT cells. PLoS ONE 5: e8774.
30. Scandella, E., Y. Men, S. Gillessen, R. Forster, and M. Groettrup. 2002. Pros-taglandin E2 is a key factor for CCR7 surface expression and migration ofmonocyte-derived dendritic cells. Blood 100: 1354–1361.
31. Goodwin, J. S., A. D. Bankhurst, and R. P. Messner. 1977. Suppression of humanT-cell mitogenesis by prostaglandin. Existence of a prostaglandin-producingsuppressor cell. J. Exp. Med. 146: 1719–1734.
8 PGE2 PREVENTS THE T CELL STOP SIGNAL
by guest on March 18, 2018
http://ww
w.jim
munol.org/
Dow
nloaded from