a market overview and literature reviewplug-in electric vehicle deployment in the northeast a market...
TRANSCRIPT

PLUG-IN ELECTRIC VEHICLE DEPLOYMENT IN THE NORTHEAST A Market Overview and Literature Review
By Charles Zhu and Nick Nigro
Center for Climate and Energy Solutions (C2ES)
Prepared for the
Transportation and Climate Initiative, Georgetown Climate Center, and New York State Energy Research and Development Authority
Funded by the U.S. Department of Energy
September 2012

2
Plug-‐in Electric Vehicle Deployment in the Northeast: A Market Overview and Literature Review September 2012
NOTICE
This material is based upon work supported by the Department of Energy under Award Number #DE-‐EE0005586.
This report was prepared as an account of work sponsored by an agency of the United States Government, the New York State Energy Research and Development Authority, and the State of New York. Neither the United States Government nor any agency thereof, nor any of their employees, makes any warranty, express or implied, or assumes any legal liability or responsibility for the accuracy, completeness, or usefulness of any information, apparatus, product, or process disclosed, or represents that its use would not infringe privately owned rights. Reference herein to any specific commercial product, process, or service by trade name, trademark, manufacturer, or otherwise does not necessarily constitute or imply its endorsement, recommendation, or favoring by the United States Government or any agency thereof. The views and opinions of authors expressed herein do not necessarily state or reflect those of the United States Government or any agency thereof.
Information and documents published under the name of the Transportation and Climate Initiative (TCI) represent work produced in support of the TCI or its projects. TCI materials do not necessarily reflect the positions of individual jurisdictions or agencies unless explicitly stated.

3
Plug-‐in Electric Vehicle Deployment in the Northeast: A Market Overview and Literature Review September 2012
Foreword Electric vehicles have the potential to decrease our nation’s dependence on oil and drastically reduce greenhouse gas emissions from the transportation sector. In an effort to stimulate economic growth, decrease the United States’ dependence on oil, and lessen the operating cost of personal transportation, the federal government issued a final rule in 2012 requiring new cars to average 54.5 miles per gallon by 2025. This goal is ambitious and will be difficult to accomplish without significant numbers of alternative fuel vehicles. Several alternative fuels are currently available, but electric vehicles (EVs) are emerging as the predominant alternative for passenger vehicles. While EVs are hitting the market and offer numerous advantages, such as zero tailpipe emissions, lower fuel costs, and the convenience of filling up at home, a number of barriers stand in the way of wide-‐scale EV deployment. This literature review, prepared by the Center for Climate and Energy Solutions, provides an overview of plug-‐in electric vehicle (PEV) deployment in the Northeast and Mid-‐Atlantic states. The report assesses current electric vehicle and electric vehicle charging station technology, looks at the state of PEV markets, reviews the benefits of PEV deployment, and identifies the barriers and challenges to PEVs in gaining market acceptance. The literature review is intended to serve as a resource for consumers and policy makers who seek to better understand the nature of electric vehicle deployment in this region and related challenges. The Georgetown Climate Center commissioned and oversaw the preparation of this literature review on behalf of the Transportation and Climate Initiative (TCI), as part of its effort to assess and address barriers to EV deployment in the Northeast and Mid-‐Atlantic States. Georgetown Climate Center Director of Research and Policy, Kate Zyla, and EV Program Coordinator, Cassie Powers, managed the oversight and review process, which included incorporating input from the TCI. In addition, Georgetown Climate Center worked extensively with 16 of the region’s Clean Cities Coordinators, who provided local information and offered comments. Their expertise and hard work were invaluable and enhanced the scope and quality of this report. This work is one of a series of products funded by a Department of Energy Electric Vehicle Readiness Planning Grant, awarded to the New York State Energy Research and Development Authority on behalf of TCI. Additional information can be found at http://www.georgetownclimate.org/tci/. We are grateful for their support.
The Georgetown Climate Center also appreciates the support of the Rockefeller Brothers Fund and the Barr Foundation, which support our electric vehicles work, and our other transportation funders: the Emily Hall Tremaine Foundation, Rockefeller Foundation, Oak Foundation, and Surdna Foundation.
Vicki Arroyo, Executive Director Peter Byrne, Faculty Director Georgetown Climate Center Georgetown Climate Center

4
Plug-‐in Electric Vehicle Deployment in the Northeast: A Market Overview and Literature Review September 2012
Contents 1. Executive Summary and Background ........................................................................................................................6 2. Plug-‐in Electric Vehicle Technologies Overview ........................................................................................................8
PEV Definitions and Comparisons .............................................................................................................................8
Electric Vehicle Supply Equipment (EVSE) Technology ...........................................................................................10
EVSE and Managed Charging...................................................................................................................................11 3. Market Potential and Overview ..............................................................................................................................12
National PEV Market Growth and Potential............................................................................................................12
Market Forecasts.................................................................................................................................................12 Consumer Demand..............................................................................................................................................14
Northeast and Mid-‐Atlantic PEV Market Growth and Potential .............................................................................15
4. PEV Benefits ............................................................................................................................................................17 Decreased Reliance on Oil .......................................................................................................................................17
Economic Growth ....................................................................................................................................................19
Local Air Quality ......................................................................................................................................................21 Global Climate Change ............................................................................................................................................23
5. PEV Deployment: Barriers and Options...................................................................................................................27
Vehicle Appeal.........................................................................................................................................................27
Capital Cost Reductions Needed for Vehicles .....................................................................................................27 Capturing and Presenting the Total Value Proposition ...........................................................................................31
Consumer Uncertainty and BEV Range Anxiety ..................................................................................................35
Summary and Policy Options...............................................................................................................................37 Charging Build-‐Out and Finance..............................................................................................................................40
EVSE Permitting and Inspection Process .............................................................................................................41
Residential Consumer Charging ..........................................................................................................................44 Workplace, Publicly Accessible & Commercial Charging.....................................................................................46
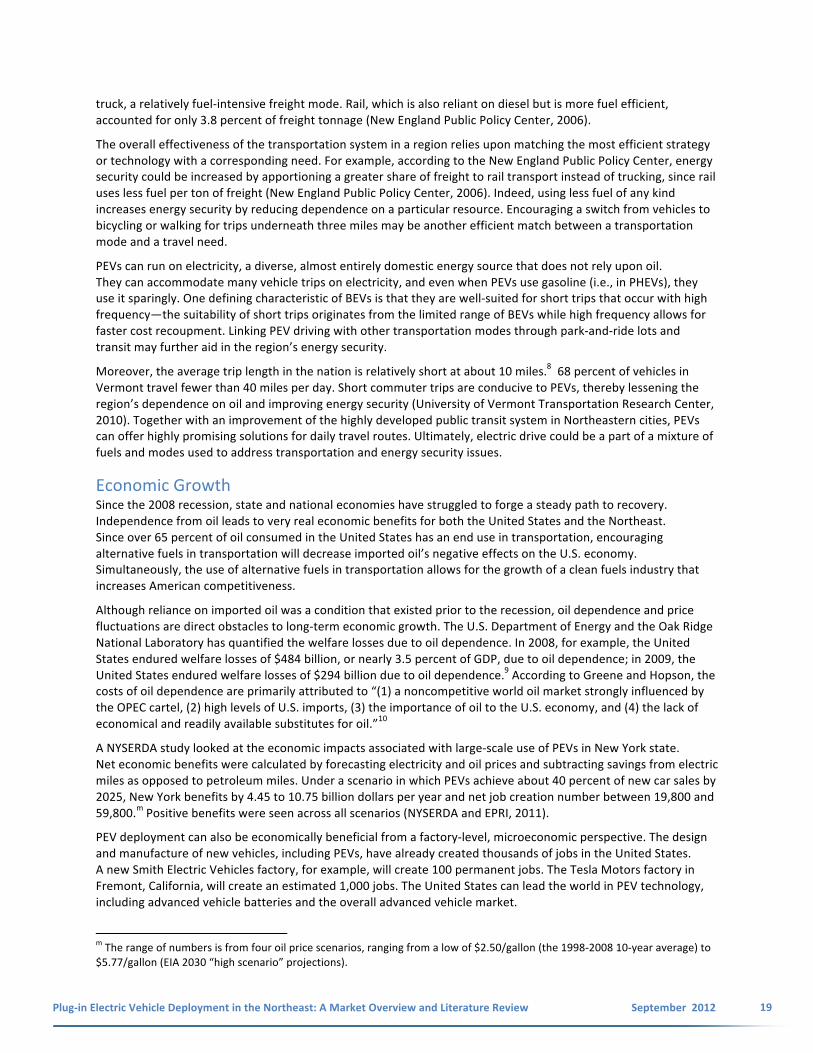
Standards.............................................................................................................................................................49
Financing Charging Infrastructure .......................................................................................................................50
Summary and Policy Actions ...............................................................................................................................53 Impacts on the Grid and Transportation Funds ......................................................................................................56
Grid Impacts ........................................................................................................................................................56
Impacts on Transportation Funds .......................................................................................................................58 Summary and Possible Solutions.........................................................................................................................60
6. Potential Next Steps ................................................................................................................................................63
Appendix A: PEV Deployment Partnerships ................................................................................................................65 Appendix B: Existing Government Incentives in TCI Jurisdictions ...............................................................................66
Bibliography ................................................................................................................................................................69

5
Plug-‐in Electric Vehicle Deployment in the Northeast: A Market Overview and Literature Review September 2012
Figures Figure 1: Simplified Explanation of Power Flows for Different Vehicle Types...............................................................8
Figure 2: Scenarios of PEV Market Growth in U.S. ......................................................................................................13
Figure 3: U.S. Retail Hybrid Registrations per 10,000 Residents, 2007-‐2009 (CAR, 2011). .........................................16
Figure 4: World Oil Price Variations and Associated Events (EIA, 2011) .....................................................................18
Figure 5: Projected U.S. Charging Infrastructure Market Value (in Millions of U.S. Dollars) (Zpryme 2010) ..............20
Figure 6: Counties Designated Nonattainment for EPA Criteria Pollutants in 2011....................................................21
Figure 7: Percentage Difference in Ozone Level Between Base Case and PEV Case ...................................................22
Figure 8: Change in Carbon Emissions when Switching from PEV to ICEV or HEV ......................................................26
Figure 9: Energy Consumption by Grid Interconnections in TCI Region......................................................................26
Figure 10: Major Factors Influencing New Vehicle Purchase Decision from Three Groups: Overall Group, Likely to Purchase EV Group, and Not Likely to Purchase EV Group (Zpryme 2010).................................................................28
Figure 11: Components of the Unit Cost of a Battery Pack (Argonne National Laboratory, 2011).............................29
Figure 12: Energy Cost per Mile and Efficiency Cost per Mile for PEVs as Compared to Other Vehicles....................31
Figure 13: Relative Annual Fuel Cost Savings from Switching to PEVs Based on Estimated Gasoline Prices in July 2008 (Lidicker, Lipman, & Shaheen, 2010); Average Retail Price of Electricity. ..........................................................32
Figure 14: Payback Period of EV Premium in New York City, Boston, and Philadelphia…………………………………………..33
Figure 15: Orange and Rockland Utility Time-‐Variant Structure .................................................................................34
Figure 16: Impact of the Strategic Installation of One Incremental Quick-‐Charging Station in Addition to One Existing Quick-‐Charging Station (Aoki, 2010). .............................................................................................................36
Figure 17: Charging Infrastructure Approaches (C2ES, 2012) .....................................................................................40
Figure 18: General Flowchart for Obtaining EVSE (Project Get Ready & ETEC, 2011) ................................................42
Figure 19: Survey on Payment for the Installation of a New Meter: Who Owns and Provides the Meter Socket Installed at the Customer’s Home (EPRI Infrastructure Working Council, 2011) ........................................................44
Figure 20: Challenges in Installing Chargers for Multi-‐Family Dwellings (SFEnvironment, 2011) ...............................46
Figure 21: Key Entities in PEV and EVSE-‐Related Standards (DOE: NREL, 2011) .........................................................50
Figure 22: Power Requirements and Potential Impact of Electric Vehicles (MIT, 2010).............................................56
Figure 23: Demand Response Potential versus Actual Deployed Demand Response Resources by Region...............58
Figure 24: Combined Federal and State Gasoline Taxes .............................................................................................59

6
Plug-‐in Electric Vehicle Deployment in the Northeast: A Market Overview and Literature Review September 2012
1. Executive Summary and Background Plug-‐in electric vehicles, or PEVs, have recently become available across the nation on an unprecedented scale. A successful mass deployment of these vehicles could create many public benefits, facilitating a transition away from an oil-‐dominated transportation system while reducing air pollutants and carbon emissions. However, widespread consumer acceptance of PEVs will depend on collective action from a diverse array of stakeholders, including electric utilities, manufacturers, nonprofits, and governments at all levels. Coordinated regional and local efforts are needed to accelerate and accommodate PEV deployment.
In 2011, the Transportation and Climate Initiative (TCI) launched the Northeast Electric Vehicle Network, comprised of 10 contiguous Northeast and Mid-‐Atlantic states plus the District of Columbia. Through the Network, TCI aims to explore ways in which PEV deployment may be accelerated across the region. As a first step, the Network commissioned the Center for Climate and Energy Solutions to write a review of EV market barriers, as well as plans and projections for PEV and EVSE deployment in the Northeast. This review gives a broad overview of PEV deployment, with an eye towards scenarios that are especially relevant to the Northeast. The body of the review is divided into four sections: a technology overview, a markets overview, benefits to PEV deployment, and barriers and options to PEVs in gaining wide market acceptance. The section on barriers and challenges is further divided into sub-‐sections on vehicle appeal, problems in obtaining and financing charging infrastructure, and potential impacts on the electric grid and transportation funding. The first section explains various PEV and charging technologies, distinguishing between different types of PEVs and charging levels while offering a brief explanation of PEV integration with the electrical grid. Next, the review examines the market potential of PEVs in the nation and the TCI region. This section offers market forecasts as well as estimated penetration rates, with the caveat that future projections of PEV growth are highly uncertain. The review then explains the various benefits of PEV adoption in the region, including energy security, economic growth, local air quality, and climate change mitigation.
The subsequent section details barriers to PEV deployment, as well as policy options for addressing these barriers. Vehicle challenges, issues with the build-‐out of charging infrastructure, and potential adverse effects of PEVs on the electric grid and highway funds are explained in turn. With respect to vehicle challenges, consumer acceptance of PEVs is currently hindered by the high upfront costs of PEVs compared to regular vehicles of the same size. Many consumers are also uncertain or uninformed about PEV technologies. However, costs are forecasted to decrease as vehicle sales increase, and PEV education can ameliorate consumer uncertainty. Charging build-‐out poses another significant challenge, as stakeholders must work together to streamline and standardize the process of charging with electric vehicle supply equipment (EVSE). These challenges are amplified in the Northeast, where many PEV drivers in multi-‐family dwellings may be unable to install EVSE in their homes, creating a need for more publicly accessible charging. Utilities must also begin examining ways to prevent PEVs from adversely affecting the electrical grid. At the same time, state Departments of Transportation (DOTs) may wish to examine the impact that PEVs, which pay no fuel taxes, may have on transportation revenues. DOTs may wish to explore alternative mechanisms for requiring PEVs to contribute to those revenues. However, PEV impacts on electric grids and on state motor funds will likely be negligible in the short-‐term. The review concludes with a summary of potential next steps and actions as a platform for further research and discussion.

7
Plug-‐in Electric Vehicle Deployment in the Northeast: A Market Overview and Literature Review September 2012
Georgetown Climate Center The nonpartisan Georgetown Climate Center seeks to advance effective climate, energy, and transportation policies in the United States—policies that reduce greenhouse gas emissions and help communities adapt to climate change.
Based at Georgetown Law, the Center works extensively with government officials, academics, and an array of stakeholders to strengthen state and federal climate partnerships. The Center analyzes the provisions of federal policy relevant to states and territories, and encourages policymakers to learn from and adopt innovative policies emerging from the states. To that end, the organization plays a key role in a number of state-‐based initiatives, and is the convener of the Transportation and Climate Initiative.
Transportation and Climate Initiative Launched in 2010, the Transportation Climate Initiative (TCI) is a regional collaboration of transportation, energy, and environmental officials in 11 Northeastern and Mid-‐Atlantic states and the District of Columbia working to develop a clean energy economy and reduce greenhouse gas emissions in the transportation sector. TCI primarily works in four areas: Clean Vehicles and Fuels, Sustainable Communities, Freight Movement, and Information and Communication Technologies.
Northeast Electric Vehicle Network In October, 2011, TCI launched the Northeast Electric Vehicle Network, which creates a foundation for efforts to plan for and deploy electric vehicles and electric vehicle charging stations throughout the TCI states. The Network is supported by a nearly $1 million Department of Energy (DOE) Electric Vehicle Readiness Grant awarded to the New York State Energy Research and Development Authority (NYSERDA) on behalf of TCI. The grant is being used to fund the Network’s initial planning activities, which include engaging stakeholders to identify opportunities and barriers to EV deployment; conducting a region-‐wide literature review of market barriers, electric grid impacts, plans for EV rollouts, and issues specific to the northeast; creating siting and design guidelines; creating model building codes, model permits and zoning ordinances; and undertaking education and outreach activities throughout the region.
Center for Climate and Energy Solutions C2ES, formerly the Pew Center on Global Climate Change, is an independent non-‐profit organization that seeks to provide independent analysis and innovative solutions to address energy and climate challenges. Ranked by the University of Pennsylvania as the world’s top environmental think tank in 2011, C2ES brings business, the environmental community, policymakers, and other stakeholders together to create timely and effective solutions to today’s most pressing energy and climate problems. C2ES brings significant experience with PEVs, having authored two papers on national PEV deployment. C2ES has also convened the PEV Deployment Initiative, or PEVDI, a national PEV dialogue on PEV deployment, with participants from auto manufacturers, governments at all levels, utilities, nonprofits, and more. PEVDI produced a nationwide PEV Action Plan. C2ES is committed to using its experience to deliver objective and high-‐quality information on PEV deployment.

8
Plug-‐in Electric Vehicle Deployment in the Northeast: A Market Overview and Literature Review September 2012
2. Plug-‐in Electric Vehicle Technologies Overview
PEV Definitions and Comparisons Plug-‐in electric vehicles (PEVs) are vehicles that are either exclusively or partially powered by electric batteries. Some PEVs can also run solely on conventional fossil fuels, but the electric batteries of all PEVs can be plugged in to the electrical grid for recharging. In contrast, conventional internal combustion engine (ICE) vehicles are powered exclusively through the combustion of fossil fuels such as gasoline or diesel. PEVs are further distinguished from hybrid electric vehicles (HEVs), such as the Toyota Prius, in that HEV batteries cannot be recharged by plugging into the electrical grid (Pew Center on Global Climate Change, 2011). Driving a PEV costs much less than conventional vehicles since a mile on electric power costs about 5 cents (assuming an electricity price of 15 cents per kWh) while the same distance with gasoline costs about 15 cents (assuming prices of $3.50 per gallon) (EERE 2005).
PEVs themselves can be divided into two categories: battery electric vehicles (BEVs), as exemplified by the Nissan LEAF, and plug-‐in hybrid electric vehicles (PHEVs), as exemplified by the Chevrolet Volt. The difference between BEVs and PHEVs is in how they balance a suitable electric driving range with convenience and cost. BEVs approach this balance by running exclusively on high-‐capacity batteries. PHEVs either activate a conventional ICE once electric batteries are drained (extended-‐range electric vehicles, EREVs, or series PHEVs), or use batteries in conjunction with the combustion engine (parallel PHEVs). Both vehicle types can be plugged in to fully recharge their batteries.
Figure 1: Simplified Explanation of Power Flows for Different Vehicle Types
Note: Grid electricity can be used to provide energy to the batteries in a PHEV, while hybrid electric vehicles cannot be charged from the grid. A plug-‐in hybrid series vehicle is also known as an extended range electric vehicle (EREV). Note that these diagrams are for illustration purposes only and do not represent the exact power flow of the Chevrolet Volt, Toyota Prius, or other vehicles (Pew Center on Global Climate Change, 2011).
Because BEVs do not require an ICE, they are generally less expensive than comparable PHEVs. However, the consequences of the BEV’s lower relative costs include a limited range as well as longer charging durations. For example, the 2012 Nissan LEAF, the most widely sold BEV in the United States, retails for about $3,945 less than the 2012 Chevrolet Volt. The LEAF has a stated range of 100 miles and a practical ”EPA sticker” range for combined highway and city driving of 73 miles. However, using a standard 120 Volt (V) electric plug, a BEV like the LEAF would take about 17 hours to fully charge. Thus, with a 120 V electric plug, many BEVs may not be fully chargeable overnight (HybridCars, 2011).
In contrast to BEVs, PHEVs are driven by both an electric motor and a petroleum-‐powered internal combustion engine (ICE). In the case of series PHEVs, also known as EREVs, the ICE activates once the batteries have drained. An electric generator within a series PHEV converts heat released from the combustion engine into electricity,

9
Plug-‐in Electric Vehicle Deployment in the Northeast: A Market Overview and Literature Review September 2012
which then powers the electric motor when batteries are depleted. The Chevrolet Volt, for example, has a 50-‐mile maximum electric range and a practical range closer to 35 miles, after which the combustion engine activates.
Parallel PHEVs rely continually on both the ICE and electric motor to drive the wheels. Parallel PHEVs may have smaller battery packs (Toyota Prius plug-‐in hybrid: 4.4 kilowatt-‐hour (kWh)) than either BEVs (Nissan LEAF: 24 kWh) or series PHEVs (Chevrolet Volt: 16 kWh) because batteries operate in conjunction with the ICE, as opposed to operating independently. The 2012 Prius plug-‐in hybrid, for example, has a maximum EPA all-‐electric range of only 6 miles, but when combined with the ICE, the plug-‐in Prius can travel 540 miles until both its power sources are depleted.1 It contains three batteries, two of which enable the car to operate in both all-‐electric and hybrid mode, and one that turns on to ensure hybrid operation when the other two batteries are drained.
The ICE allows PHEVs to travel wherever gasoline stations are available, while lower-‐capacity batteries allow for a PHEV like the Volt to be fully charged in about eight hours using a 120 V electric plug. A plug-‐in Prius can be charged in three hours with a 120 V plug. For PHEVs, although the combustion engine is smaller than those found in conventional vehicles, the engine can cost about $4,000. In sum, PHEVs are not range-‐limited and are more convenient for charging but may generally cost more than BEVs, depending on the size of the vehicle’s batteries (Nemry, Leduc, & Munoz, 2009).
While small, light-‐duty passenger PEVs have attracted the most media attention, PEV technologies have been deployed for light trucks as well as heavy-‐ and medium-‐duty vehicles. Heavy-‐ or medium-‐duty vehicles are often BEVsa with high-‐capacity, high-‐cost batteries. With respect to electric range, larger batteries can extend the range of medium-‐ and heavy-‐duty electric vehicles. For example, the Smith Electric/Trans Tech eTrans all-‐electric school bus offers options of 40, 60, 80, 100, and 120 kWh battery capacities. The 120 kWh battery is 3,000 pounds but gives the bus a range of 100 to 120 miles.2 Despite higher battery costs, these vehicles may have the potential to be economical because of the fuel savings from using electricity instead of diesel fuel in vans and large trucks (Touchstone Energy, 2010).
Fleet owners could be early adopters for light-‐duty vehicles as well as medium-‐ and heavy-‐duty vehicles. According to Green Fleet magazine (2011), electric medium-‐duty or van fleets are viable because fleets focus on total cost of ownership and electric vehicles allow for fuel cost savings from cheaper electric miles.b Moreover, fleets have recurring routes with return-‐to-‐base operations allowing for recharging, potentially larger vehicle size that allows for bigger batteries and thus cheaper batteries per kWh, and a top speed need of less than 50 miles per hour because driving usually occurs in urban areas (Green Fleet Magazine, 2011). In addition to light-‐duty passenger PEVs, examples of currently available fleet vehicles range from the light-‐duty van to the delivery truck (Navistar, formerly known as Modec; Smith Electric Vehicles) to the commuter bus (Proterra). However, real-‐life data and analysis on the economic benefits of medium-‐ and heavy-‐duty vehicles are currently lacking. As more fleets adopt medium-‐ and heavy-‐duty vehicles, the total cost of ownership of various vehicles may become clearer.
Finally, electric drive encompasses transportation modes besides four-‐wheeled motor vehicles. Although this is beyond the scope of this review, electric motorcycles and electric locomotives, for example, have both already been brought to market. Electric motorcycle manufacturers include Zero Motorcycles, Brammo, and Mission Motorcycles, as well as major motorcycle manufacturers such as Honda and BMW.3 Battery-‐drive locomotives are used frequently in industrial settings while electrified rail is common throughout the world. Sikorsky has also built demonstration electric helicopters.4 A full list of existing passenger and non-‐passenger electric vehicles can be found at Plug-‐in America.
aWhereas more than ten BEV light trucks, medium-‐duty, or heavy-‐duty “fleet vehicles” are currently available, only three PHEV fleet vehicles are currently available. b Electric miles mean a mile traveled powered only by batteries.

10
Plug-‐in Electric Vehicle Deployment in the Northeast: A Market Overview and Literature Review September 2012
Electric Vehicle Supply Equipment (EVSE) Technology As the market for electric vehicles grows, the placement and quantity of charging infrastructure (EVSE) influences and is influenced by PEV growth. “Range anxiety,” or the fear of being stranded due to a drained battery, is a significant consumer concern. Consumer uncertainty with respect to the process of using EVSE to charge PEVs is another significant barrier. “Range anxiety” and EVSE unfamiliarity may disappear as consumers are educated, but they remain strong initial obstacles to purchasing PEVs (Nemry, Leduc, & Munoz, 2009).
Because of their limited range and exclusive use of electricity, BEVs are more reliant on higher-‐power charging and more EVSE build-‐out than PHEVs are. However, PHEV growth will also likely be influenced by the availability of some charging infrastructure, especially near homes and workplaces.
Currently, there are three charging levels or “speeds” available on a commercial scale: Level 1 Alternating Current (AC), Level 2 AC, and Direct Current (DC) fast-‐charging. Level 1 AC charging, which supports 120 V charging, is the slowest of the standards. Currently, home EVSE that supports Level 1 AC charging is included with the purchase of a new electric vehicle. In this case, the EVSE is simply an adaptor with one end that plugs into a standard 120 V wall socket and another end that plugs into a socket located on the vehicle. The EVSE transfers AC into the car, where AC is converted into DC by the vehicle’s on-‐board charging system in order to charge the vehicle’s batteries. The additional load to the grid from charging the car using Level I AC is equivalent to a portable heater.
Level 2 AC charging uses a 240 V socket instead of a 120 V socket, and a trained, licensed electrician is usually required to install Level 2 EVSE. Because it can take more than a night to fully charge BEV battery packs using Level 1 AC, BEV drivers may want to install Level 2 AC at home, which can cost approximately $2,000 depending on equipment and installation pricing. Both Level 1 and Level 2 AC chargers use what is known as the J1772 connector, which is a standard that has been developed by the Society of Automotive Engineers (SAE). These standards must still be approved for Level 2 DC but have recently been accepted by all potential PEV manufacturers with autos deployed in the United States.
The term “DC fast charger” or “quick-‐charger” denotes a conversion from AC to DC outside of the car, or “off-‐board” conversion. c This off-‐board AC-‐DC conversion enhances the speed of charging since on-‐board conversion efficiency is limited. As seen in Table 1, a Level 2 DC charger can charge a BEV to 80 percent in twenty minutes. DC fast chargers are more expensive than AC chargers to purchase, install, and operate because of more expensive parts and necessary electrical upgrades. Thus, they are likely to be rarer than Level 2 AC chargers, and unlikely to be available at all for home EVSE. PHEVs are also unlikely to include hardware that supports DC fast chargers for the foreseeable future. A Level 3 AC and DC standard for much higher-‐power charging applications is under very early-‐stage development by the SAE.
SAE-‐approved Level 1 and Level 2 DC fast chargers may be available in the future, but neither has been developed because the SAE DC charging standard for the coupler and connector has not been finalized.d Although this standard has not been finalized, fast-‐chargers using a competing DC fast charging connector known as CHAdeMO, which employs a connector standard developed by the Tokyo Electric Power Company, are currently available. All Japanese PEVs, such as the Nissan LEAF, are compatible with CHAdeMO. Once the SAE Level 2 DC standard is finalized, there is a possibility that U.S. and European-‐manufactured cars will be incompatible with CHAdeMO fast chargers already being installed, and that Japanese vehicles already on the market may become incompatible with future SAE fast chargers.e However, stakeholders are discussing ways in which CHAdeMO chargers can be reconfigured as SAE chargers and vice versa.5 (SAE International, 2011). Finally, Tesla Motors vehicles will have its own separate standard for DC fast-‐charging.6
c DC-‐fast charging is an umbrella term usually referring to one of two standards: SAE Level 2 DC and CHAdeMO. “DC fast-‐charging” is also sometimes mistakenly referred to as Level 3. Level 3 has not been approved by SAE yet, though SAE is developing such a standard. d They are expected to be approved in mid-‐2012. e Since fast-‐charging holds the most appeal to BEVs and all BEVs in the current market are Japanese, compatibility problems will only come into being once SAE fast-‐chargers are built, and a U.S. or European manufacturer releases a fast-‐charging compatible vehicle. The Ford Focus EV, released in 2012, does not support fast-‐charging.

11
Plug-‐in Electric Vehicle Deployment in the Northeast: A Market Overview and Literature Review September 2012
Table 1: Charging Levels Included in Society of Automotive Engineers (SAE) J1772 Standard (SAE, 2011)
The Level 1, 2, and 3 charging standard refers to the electric power characteristics detailed in the table below.
BEV Charging Time by typical on-‐board charging capacities (min.)*
Level Current Electric Potential Difference (V)
Current (A)
Max Power (kW)*
3.3 kW charger
7 kW charger
20 kW charger
45 kW charger
Level 1 AC 120 12/16 1.4/1.92 1,020 Level 1 DC 200-‐450 80 36 -‐ -‐ 72 -‐ Level 2 AC 240 80 19.2 420 210 72 -‐ Level 2 (Fast Charger)
DC 200-‐450 200 90 -‐ -‐ -‐ 20
Proposed Level 3 DC 200-‐600 400 240 -‐ -‐ -‐ <10 *Each EVSE can deliver a max power that is limited by the capacity of the onboard charger. For example, the Nissan LEAF on-‐board charger is 3.3 kW while the Chevrolet Volt on-‐board charger is 1.44 kW. For this reason, it actually takes longer to charge a Chevrolet Volt using Level 2 AC even though its battery capacity in terms of kWh is lower. Charging power for most PEVs with release dates in the next year will be 7 kW or less. ** Assumes 25 kWh of usable capacity beginning at 20 percent state of charge (SOC). If power provided can charge the battery in less than one hour, then charging stops at 80 percent SOC. AC charging uses an on-‐board charger. DC charging uses an off-‐board charger.
In summary, all electric vehicles—and especially BEVs—will require charging infrastructure. SAE Level 1 AC will be widely compatible with all PEVs. SAE Level 2 AC will also be compatible with all PEVs and is important for BEVs to charge within a reasonable time frame, but will require additional installation costs. DC fast-‐charging significantly decreases the time required to charge a BEV. However, in contrast with Level 1 and Level 2 AC, there are three different standards in the United States for “DC fast-‐charging”—SAE Level 2 DC, the Japan-‐based CHAdeMO, and Tesla Motors’ proprietary standard. The SAE standard may become the dominant DC fast-‐charging standard, but early fast-‐charging stations all use CHAdeMO because the Level 2 DC charging coupler has not been finalized. Thus, existing DC fast charging stations may be incompatible with U.S. and European-‐manufactured BEVs.
EVSE and Managed Charging If PEVs become widespread, the electric grid must be able to accommodate additional load from PEV charging. In the immediate future, low PEV penetration will result in only negligible additional load. Further into the future, PEV growth and the highly local dynamics of PEV impact on the electrical grid will require at least some local electrical distribution upgrades and may require the implementation of policies like time-‐variant rates and technologies like smart-‐metering. Though PEV penetration is likely to remain very small over the next few years, early experience with PEV impacts on the electrical grid will allow utilities to identify best practices and consistent policies for the future.
Table 2: Cumulative Sales Forecast for Various PEVs by 2015 (DOE, 2011a).
Fisker Karma PHEV 36,000 Fisker Nina PHEV 195,000 Ford Focus BEV 70,000 Ford Transit Connect BEV 4,200 Chevrolet Volt PHEV 505,000 Navistar eStar (truck) BEV 4,000 Nissan LEAF BEV 300,000 Smith Electric Vehicles Newton (truck) BEV 5,000 Tesla Motors Model 5 BEV 55,000 Tesla Motors Roadster BEV 1,000 Think City BEV 57,000 Total 1,232,200

12
Plug-‐in Electric Vehicle Deployment in the Northeast: A Market Overview and Literature Review September 2012
Ideally, vehicles would charge during off-‐peak hours (mostly at night) in order to prevent the additional burden on the electrical grid during peak demand hours. Managed charging, i.e., technological and policy measures to encourage off-‐peak charging, can be deployed. Policy measures include lower electricity price rates during off-‐peak hours through time-‐variant rate structures. Technological solutions include “smart-‐charging” technologies, which can track daily usage patterns and charge when a surplus of electricity is available, thus reducing grid impacts while minimizing costs for the user. Such technology requires some means of understanding when charging peaks and troughs occur. Real-‐time communication with the grid through a wireless internet connection could be helpful. Several demonstration projects to develop smart charging are underway.
As the PEV market develops, the portfolio of available managed charging mechanisms may continue to diversify. Current PEV customers can program their EVSE to charge at certain times, which could allow customers to take advantage of special time-‐variant electricity rates. Eventually technology available on EVSE or the PEV could enable the vehicle to charge at the lowest possible cost using real-‐time electricity pricing. Finally, as described in Section 5, vehicle-‐to-‐grid (or V2G) technologies could allow for two-‐way electricity transfer between parked vehicles and the grid. Considering that the average vehicle is idle 95 percent of the time, V2G holds potential for integrating PEVs with the smart grid. Although it is unlikely that V2G will be commercially available on a wide scale for several years, PJM Interconnection, the University of Delaware, and several other research organizations currently have demonstration projects (Pew Center on Global Climate Change, 2011).
3. Market Potential and Overview
National PEV Market Growth and Potential
Market Forecasts Over the next two to three years, all major U.S. automakers—and some startups—will put PEVs on the road and hundreds of thousands of consumers may purchase a PEV. In 2011, Americans purchased over 17,000 Chevrolet Volts and Nissan LEAFs (the two main PEVs available throughout 2011).f While Nissan has achieved its worldwide sales goal for 2011, Chevrolet missed its 10,000-‐vehicle target for the year. The impact of missing this goal on future sales is unclear. To provide a comparison, the Toyota Prius (a hybrid electric vehicle) sold just 300 units in limited production in its first year. When sales expanded from Japan to North American and European markets in 2000, Prius sales rose to 19,000 and then to 29,500 the following year (TMC, 2010). Indeed, General Motors intends to have capacity to build up to 60,000 Volts in 2012 while Nissan intends to have capacity to build up to 150,000 LEAFs after 2012. The number of vehicles built will depend on worldwide demand.
Through 2012, many additional passenger PEVs will be available, including the Ford Focus EV, the Mitsubishi i (MiEV), the Toyota Prius Plug-‐in Hybrid, the Coda Sedan, and the Tesla Model S. Moreover, both the Volt and the LEAF are now available across the nation, whereas they were limited to certain locations for most of 2011. These vehicles will provide consumers with more choices in the PEV market.
Forecasts for PEV market growth over the next decade range widely. Pike Research forecasts that sales of plug-‐in electric vehicles will grow at an annual rate of 43 percent between 2011 and 2017, reaching 303,000 vehicles sold and 1 million vehicles on the road by 2017. The Obama Administration’s highly publicized goal of having 1 million PEVs on the road by the end of 2015 is thus within range of this particular forecast (Pike Research, 2011). The Center for Automotive Research (2010) estimates that 469,000 PEVs will be on U.S. roads by 2015 (CAR, 2011) while Zpryme estimates that 230,200 PEVs will be sold and 730,700 will be on the road by 2016 (Zpryme 2010). On the other hand, the U.S. Energy Information Administration (EIA) estimates that only 140,000 PEVs will be on the road in 2020 (EIA, 2011).
fMore than 7,600 Volts and 9,600 LEAFs were sold in 2011 according to http://bit.ly/yA8nOZ.

13
Plug-‐in Electric Vehicle Deployment in the Northeast: A Market Overview and Literature Review September 2012
Fleet vehicles such as taxis, delivery trucks, and transit buses comprise a small percentage of the nation’s total vehicle fleet (less than 3 percent) (USDOT BTS 2010), but usually travel more miles than ordinary passenger vehicles. Because fleet vehicles consume more motor fuel than passenger vehicles, run regular routes, and refuel at the same place each night, these vehicles offer a good opportunity for early electrification. Pike Research estimates a 36 percent growth rate in electric medium-‐duty vehicles between now and 2017—a doubling rate of less than 2.5 years. Moreover, PEV fuel savings may hold special appeal for fleet operators when compared to the ordinary consumer. Fleet operators are willing to pay 10-‐14 percent more for a hybrid or all-‐electric vehicle because of better awareness and accounting of fuel cost savings from electric miles (EDTA, 2011).
Long-‐term market projections depend on a variety of factors, including the continued presence of financial incentives such as the $7,500 federal tax credit for PEVs,g as well as non-‐financial incentives like high occupancy vehicle (HOV) lane access for PEVs. For example, HOV lane exemptions for hybrid electric vehicles added $1,200 to $1,500 to their resale value.7 Other factors include the price and availability of EVSE and consumer demand and acceptance.
Even with optimistic PEV forecasts, national PEV sales may remain small compared to the size of the overall vehicle fleet. Many experts agree that the PEV proportion of the U.S. vehicle fleet is likely to stay under 10 percent up until 2030 with most predictions closer to 5 percent, though annual market share may be close to 20 percent by 2020.h Indeed, EPA-‐NHTSA scenarios for reaching the Administration’s new 54.5 mpg standards for 2025 forecast that only 3 to 4 percent of the vehicle fleet must be plug-‐in electric vehicles by 2025 to meet the standard.i
Figure 2: Scenarios for PEV Market Growth in the U.S.
Note: The Electrification Coalition projection is a goal rather than a projection (ACEEE, 2010).
As seen in Figure 2: Scenarios , the early trajectory of electric vehicles may determine the long-‐term trajectory of the composition of the nation’s vehicle fleet. The rate and persistence of compound growth is likely to depend on early accumulation of knowledge by consumers, utilities, and businesses as they gain more PEV experience. For example, the Energy Information Administration (EIA), National Academy of Sciences (NAS), and the University of Michigan Transportation Research Institute have all devised long-‐term growth scenarios in which the absolute growth in the number of PEVs on the road between 2020 and 2030 is several times greater than the growth between 2010 and 2020, with exponential growth continuing after 2030 (ACEEE, 2010).
Considering that infrastructure investments in the electric grid often have a decades-‐long time span, the extent of market growth in 2030 or 2040 echoes investments and deployment strategies put in place today. The present
g The Federal Tax Credit gives up to $7,500 Federal income tax credit for any PEV with a large enough battery pack. See Federal Tax Credit inset in Section 5. h For example, the National Research Council and the National Academy of Sciences (NAS) estimate a 4 percent PEV makeup of the national fleet, or 13 million vehicles, in year 2030 under the most probable scenario (National Research Council, 2010). i Note that it takes some time for annual PEV market share to “catch up” to overall fleet makeup; McKinsey estimates the average vehicle to have a lifespan of about 10 years. Estimates for PEV market share by 2025 range from 5 to 40 percent (EPRI-‐NRDC, 2010)

14
Plug-‐in Electric Vehicle Deployment in the Northeast: A Market Overview and Literature Review September 2012
decisions made by PEV stakeholders in the TCI region could be a catalyst or a potential deterrent for future PEV deployment.
Consumer Demand Consumer demand will ultimately make or break PEVs. Current demand is concentrated in particular geographic and demographic markets. Although comprehensive data on the demographic characteristics of PEV consumers is currently unavailable, common traits exist, such as income level and degree of concern for the environment. This market of “early adopters” is generally characterized by an enthusiasm for new technology or concern for the environment that outweighs the risks of purchasing a higher-‐cost vehicle powered by different technologies (Indiana University, 2011). For these consumers, value exists in being the first to own a PEV and its associated environmental benefits and image projections (Tuttle & Baldick, 2010).
A recent survey conducted by Deloitte Global Services on PEV interest revealed that 12 percent of respondents in the United States identified themselves as “potential first movers,” and another 42 percent “might be willing to consider.” Another survey by Accenture found 57 percent of Americans would consider purchasing a PEV for their next vehicle (Accenture, 2011). However, many potential consumers have high expectations regarding price, range, and charging time that PEVs on the market today do not meet (Deloitte, 2011). Converting “potential consumers” into actual purchasers is a serious challenge.
Consumer demand is highly sensitive to price, and consumers are often hesitant or unwilling to pay more for a good if they can get something similar for less. This unwillingness is coupled with an undervaluation of fuel savings, as consumers have a discount rate of around 20 percent for fuel savings while the societal discount rate would be closer to 4 percent (Greene & Plotkin, 2011). Even if the present value of fuel savings over a vehicle’s lifetime outweighs the difference in initial cost based on a societal discount rate, it may not be enough to convince consumers to pay more upfront (Indiana University, 2011). Currently, upfront costs are already subsidized by the Federal government through a $7,500 income tax credit for a PEV purchase, and many states also have their own set of incentives.
Consumer interest in PEVs also increases when gasoline prices rise, according to the Deloitte survey. With gasoline prices at $3.50 per gallon, around 30 percent of respondents would be more likely to purchase a PEV. At $5 per gallon, the proportion of respondents increases to 78 percent (Deloitte, 2011). In contract, electricity prices vary less over time than oil prices (see Section 5). However, the impact of fuel prices on vehicle purchasing decisions is slow to emerge, modest in scale, confounded with many other variables like EVSE availability, and is often based more on the availability of gasoline and the rate of change in price than the absolute price (Tuttle & Baldick, 2010). As mentioned above, current PEVs do not often meet consumer expectations for price, range, and charging time.
Fleet operators are currently being encouraged to adopt electric vehicles through a number of incentives. Studies have shown that fleet operators conduct rigorous analyses of fuel cost savings, unlike the average passenger vehicle consumer (EDTA, 2011). Moreover, Executive Order 13514, signed in 2009, orders federal agencies to reduce fuel consumption by 2 percent each year from a 2005 baseline through 2020, resulting in a 30 percent total reduction. PEVs are likely to be a crucial part of this strategy, according to the Federal Fleet Management Guidance of 2010 (USDOE: EERE, 2011).
Consumer demand is likely to vary with respect to many factors, from fuel price to demographics to charging availability. Although these factors vary regionally, the TCI region exhibits several promising traits for widespread PEV deployment.

15
Plug-‐in Electric Vehicle Deployment in the Northeast: A Market Overview and Literature Review September 2012
Northeast and Mid-‐Atlantic PEV Market Growth and Potential While current PEV sales are concentrated in California, the Northeast and Mid-‐Atlantic have a potential market that matches and even surpasses that of any other region or state in the United States. High density, urbanization, short commute distances, and relatively high incomes make the TCI region especially suitable for widespread PEV deployment. McKinsey (2010) surveyed consumer sentiment in three “megacities”—New York City (NYC), Shanghai, and Paris—and found that PEVs could account for 16 percent of new vehicle sales in these cities by 2015, and that demand would likely outstrip supply.
Some studies point out that early adopters would not require a high-‐density charging network because they may not need to take lengthy trips and can do most of their charging at home (see Section 5) (Knupfer, 2011). PHEV drivers do not require a dense charging network because the internal combustion engine greatly increases the vehicle’s range. Moreover, small, densely populated states have less need for a high-‐density network. In addition, smaller states may have an easier time installing EVSE. For example, in its PEV feasibility study, Rhode Island noted that it is only 48 by 37 miles with just over one million residents—the second most densely populated state in the United States. Because of its size, political, business, and civic leaders are accessible and easier to convene than in larger states, allowing for significant coordination for PEV deployment (Rhode Island Clean Cities Coalition, 2011).
As a study by the Columbia Earth Institute states, increased demand for electric vehicles creates economies of scale that lead to reduced costs and more extensive charging infrastructure, thus inducing PEV adoption in neighboring areas. The Northeast Regional Electric Vehicle Partnership is a partnership between Philadelphia, NYC, and Boston that examines these synergies within the highly dense and highly traveled Northeast corridor (Columbia University, 2010).
Table 3: Hybrid and Electric Vehicle Penetration Rates by State for the TCI region and California (CAR, 2011)
Hybrid sales state ranking / number of sales for top 20
Hybrid penetration state ranking / hybrid cars per 10,000 people
Estimated Electric vehicles on the road in 2015 by state
CT 18 14,503 6 41.1 8,147 DC -‐ -‐ 5 43.2 1,459 DE -‐ -‐ 17 27.9 1,389 MA 9 25,756 8 39.0 14,469 MD 13 20,798 10 36.6 11,683 ME 4,095 13 31.1 2,300 NH -‐ -‐ 7 41.1 3,058 NJ 10 23,332 18 26.8 13,107 NY 3 44,848 -‐ -‐ 25,194 PA 8 28,279 -‐ -‐ 15,886 RI -‐ -‐ 15 30.3 1,793 VT -‐ -‐ 2 48.3 1,682 Total for given data 157,516 100,167 CA 1 199,958 1 54 112,328
Hybrid data is from 2007-‐2009 aggregated sales data. Growth in hybrid registrations in 2009 among Northeastern states outpaced that of other states, including California. Rankings that include sales 2010-‐2011 data are likely to be higher. Source: RL Polk and Co. through (CAR, 2011)
One proxy often used to measure PEV viability in a state is the penetration and trajectory of HEV sales over the past ten years. As seen in
Table 3, total California hybrid sales dwarf the number of hybrids sold in any single northeastern or Mid-‐Atlantic state. However, six of the twelve members of TCI were in the top 20 states for hybrid vehicle sales in calendar year 2009, and total sales within the region are comparable to those found in California. Furthermore, nine of the twelve members of TCI are among the ten states with the highest hybrid penetration, or population-‐weighted sales. If this metric is a proxy for consumer acceptance in the state, the TCI region has high potential for PEVs (CAR, 2011).

16
Plug-‐in Electric Vehicle Deployment in the Northeast: A Market Overview and Literature Review September 2012
Figure 3: U.S. Retail Hybrid Registrations per 10,000 Residents, 2007-‐2009 (CAR, 2011)
At a local level, several Northeast and Mid-‐Atlantic cities are likely to have high penetration rates relative to the national average. A Pike Research survey shows that current attitudes as well as demographic profiles of the Providence-‐New Bedford-‐Fall River, New York-‐Northern New Jersey-‐Long Island, and Philadelphia-‐Camden-‐Wilmington metropolitan statistical areas (MSAs) will lead to very high penetration rates or absolute sales numbers compared to other areas. In fact, the New York City MSA is forecasted to have the highest number of sales in the nation while the Philadelphia MSA will be among the top ten. Among states, Washington, DC, and Delaware are forecasted to have among the highest annualized penetration rates by 2017 at 4.6 and 4.5 percent, respectively (Pike Research, 2011). As a result, both General Motors and Nissan have chosen TCI states such as Connecticut, DC, New Jersey, and New York for early roll-‐out of PEVs.
Table 4: Initial Chosen Deployment States for the Volt, LEAF, and Ford Focus Electric
Model AZ CA CO CT DC FL GA IL MA MI NC NJ NY OR TN TX VA WA Chevrolet Volt x x x x x x x Nissan LEAF x x x x x Ford Focus Electric
x x x x x x x x x x x x x x x
Note: These are states in which automakers chose to make their PEVs initially available. The Volt (December 2011) and the LEAF (March 2012) are now available nationwide.
City deployment is bolstered by city fleets, which can publicize PEV use to potential drivers while giving public and private entities experience with EVSE deployment. The Northeast has already begun to assert leadership in the deployment of PEVs in public fleets. New York City, for example, has the nation’s largest HEV fleet and is quickly building the nation’s largest PEV fleet. As of July 2011, 430 of NYC’s 26,000-‐vehicle fleet are PEVs (both utility trucks and light-‐duty vehicles) used by departments as diverse as the New York Police Department and the Department of Correction. Moreover, the city is working to accelerate PEV penetration within its 13,000-‐vehicle

17
Plug-‐in Electric Vehicle Deployment in the Northeast: A Market Overview and Literature Review September 2012
yellow taxi fleet; in 2012, Nissan gave six Nissan LEAFs to taxi owners as well as support charging stations for a pilot program in preparation for a much larger deployment of all-‐electric taxis (City of New York, 2010).
Corporations, many of which are headquartered in the Northeast, can also take the lead in accelerating PEV deployment. For example, General Electric, which is headquartered in Fairfield, Connecticut, announced it would purchase 25,000 electric vehicles by 2015 for its global fleet (General Electric, 2011).
In sum, although the magnitude of PEV growth is uncertain, the TCI region is likely to be a primary early market for these vehicles. Although PEV makeup of the overall fleet will likely remain below 10 percent by 2025, PEV numbers could double every three or four years nationwide and may be more likely to do so in the Northeast and Mid-‐Atlantic because of traits that are especially conducive to PEV deployment.
4. PEV Benefits While uncertainty exists around consumer acceptance of PEVs, PEVs can help address four critical issues facing the United States today: a secure and reliable supply of energy, the need for economic growthj, air quality and public health, and climate change. Whereas many studies show that there could be significant nationwide benefits to PEV deployment, fewer studies have examined the distribution of such benefits across the country, which will vary by region, state, and city. Factors that affect the apportionment of these benefits include local transportation characteristics, suitability of PEVs and PEV-‐related businesses in the region, and the local power generation fuel mix.
Decreased Reliance on Oil National and regional economies rely upon the transportation system, which facilitates the flow of goods and people. The smooth functioning of the transportation system in turn relies upon a secure supply of oil—approximately 94 percent of delivered energy in the U.S. transportation sector is derived from oil (EIA, 2012).
However, the continued security of oil supplies is far from certain, which leads to macroeconomic losses and security problems. The gradual rise in the price of oil and oil price volatility put serious strains on the economy and the transportation system, creating serious adverse impacts on both. A gradual increase in oil prices may occur because new oil supplies may become costlier to extract. The difficulty of discovering new oil supplies also plays a part in the increase in oil prices (Yergin, 2011). Furthermore, demand is increasing at an unprecedented pace (with a brief dip in demand during the recent recession) because of the growing hunger for energy among developing countries. For example, world demand for oil increased by 11 percent between 2000 and 2008, and nearly 100 percent of this growth occurred in developing countries (BP Statistical Review, p. 11). The exact magnitude of this increase in oil prices depends on the rate at which new oil reserves are discovered as well as technological improvements to oil extraction.
jThe benefits delivered through energy security and economic growth overlap heavily. As such, the energy security section deals with benefits that are not easily quantifiable in dollar terms while the section on economic growth contains quantifiable benefits.

18
Plug-‐in Electric Vehicle Deployment in the Northeast: A Market Overview and Literature Review September 2012
Figure 4: World Oil Price Variations and Associated Events [Price Adjusted by CPI for All Urban Consumers (EIA, 2011)]
The historical rise in the price of oil has been complemented by increasing price volatility. This volatility stems from increased demand, geopolitical conflict, and artificial price increases because of market control by only a few countries. Short-‐term spikes in prices have already occurred several times, most notably in the 1970s because of the Arab oil embargok and most recently in the spring of 2011 due to the Arab Spring and a supply disruption in Libya. The United States deploys armed forces across the world in part for the purposes of ensuring secure oil supplies and reducing volatility. A 2009 RAND study estimated that the cost of deploying U.S. armed forces for the explicit purpose of protecting oil drilling infrastructure across the world ranges between $67.5 billion and $83 billion per year. This number is between 12 and 15 percent of the 2010 defense budget (Electrification Coalition, 2009).
A sharp, sudden cut in oil supply results in high oil prices and forces society to spend more money on fuel because many consumers cannot quickly switch to using less oil or alternative fuels. Cities in the Northeast and Mid-‐Atlantic have some of the most developed commuter rail and public transit systems in the country—efficient modes of transportation that are less sensitive to oil prices and hold significant potential for transitioning to local, clean energy such as electricity. The number of commuters using public transportation is higher than the national average, though rural areas generally have low rates (New England Policy Center, 2010).
However, the Northeast and Mid-‐Atlantic remain highly dependent on petroleum-‐based transportation. Freight is particularly vulnerable to price shocks. About 80 percent of freight shipped from New Englandl is by
k Between 1978 and 1980, Iranian oil production fell 72 percent, causing oil prices to skyrocket. lAll Northeast Electric Vehicle Network states minus DC, Maryland, Pennsylvania, New York, and New Jersey plus Maine.
Constant $2011 per barrel
Imported Refiner Acquisiron Cost (IRAC)
Official Price of Saudi Light
1973 Arab Oil Embargo
Saudis abandon "swing producer" role
Iran-‐Iraq War Begins
Iraq invades Kuwait
Gulf War ends
Prices rise on OPEC cutbacks, increased demand
Prices spike on supply disrupjons, rapid demand increases, constrained OPEC capacity, low inventories
Iranian Revolujon; Shah deposed PdVSA workers strike
in Venezuela
Asian economic crisis 9/11 amacks
Global financial crisis
Arab Spring; Libyan supply disrupjon
Rapid demand increases, constrained OPEC capacity; oil price reaches all-‐jme high
Year
19
Plug-‐in Electric Vehicle Deployment in the Northeast: A Market Overview and Literature Review September 2012
truck, a relatively fuel-‐intensive freight mode. Rail, which is also reliant on diesel but is more fuel efficient, accounted for only 3.8 percent of freight tonnage (New England Public Policy Center, 2006).
The overall effectiveness of the transportation system in a region relies upon matching the most efficient strategy or technology with a corresponding need. For example, according to the New England Public Policy Center, energy security could be increased by apportioning a greater share of freight to rail transport instead of trucking, since rail uses less fuel per ton of freight (New England Public Policy Center, 2006). Indeed, using less fuel of any kind increases energy security by reducing dependence on a particular resource. Encouraging a switch from vehicles to bicycling or walking for trips underneath three miles may be another efficient match between a transportation mode and a travel need.
PEVs can run on electricity, a diverse, almost entirely domestic energy source that does not rely upon oil. They can accommodate many vehicle trips on electricity, and even when PEVs use gasoline (i.e., in PHEVs), they use it sparingly. One defining characteristic of BEVs is that they are well-‐suited for short trips that occur with high frequency—the suitability of short trips originates from the limited range of BEVs while high frequency allows for faster cost recoupment. Linking PEV driving with other transportation modes through park-‐and-‐ride lots and transit may further aid in the region’s energy security.
Moreover, the average trip length in the nation is relatively short at about 10 miles.8 68 percent of vehicles in Vermont travel fewer than 40 miles per day. Short commuter trips are conducive to PEVs, thereby lessening the region’s dependence on oil and improving energy security (University of Vermont Transportation Research Center, 2010). Together with an improvement of the highly developed public transit system in Northeastern cities, PEVs can offer highly promising solutions for daily travel routes. Ultimately, electric drive could be a part of a mixture of fuels and modes used to address transportation and energy security issues.
Economic Growth Since the 2008 recession, state and national economies have struggled to forge a steady path to recovery. Independence from oil leads to very real economic benefits for both the United States and the Northeast. Since over 65 percent of oil consumed in the United States has an end use in transportation, encouraging alternative fuels in transportation will decrease imported oil’s negative effects on the U.S. economy. Simultaneously, the use of alternative fuels in transportation allows for the growth of a clean fuels industry that increases American competitiveness.
Although reliance on imported oil was a condition that existed prior to the recession, oil dependence and price fluctuations are direct obstacles to long-‐term economic growth. The U.S. Department of Energy and the Oak Ridge National Laboratory has quantified the welfare losses due to oil dependence. In 2008, for example, the United States endured welfare losses of $484 billion, or nearly 3.5 percent of GDP, due to oil dependence; in 2009, the United States endured welfare losses of $294 billion due to oil dependence.9 According to Greene and Hopson, the costs of oil dependence are primarily attributed to “(1) a noncompetitive world oil market strongly influenced by the OPEC cartel, (2) high levels of U.S. imports, (3) the importance of oil to the U.S. economy, and (4) the lack of economical and readily available substitutes for oil.”10
A NYSERDA study looked at the economic impacts associated with large-‐scale use of PEVs in New York state. Net economic benefits were calculated by forecasting electricity and oil prices and subtracting savings from electric miles as opposed to petroleum miles. Under a scenario in which PEVs achieve about 40 percent of new car sales by 2025, New York benefits by 4.45 to 10.75 billion dollars per year and net job creation number between 19,800 and 59,800.m Positive benefits were seen across all scenarios (NYSERDA and EPRI, 2011).
PEV deployment can also be economically beneficial from a factory-‐level, microeconomic perspective. The design and manufacture of new vehicles, including PEVs, have already created thousands of jobs in the United States. A new Smith Electric Vehicles factory, for example, will create 100 permanent jobs. The Tesla Motors factory in Fremont, California, will create an estimated 1,000 jobs. The United States can lead the world in PEV technology, including advanced vehicle batteries and the overall advanced vehicle market.
m The range of numbers is from four oil price scenarios, ranging from a low of $2.50/gallon (the 1998-‐2008 10-‐year average) to $5.77/gallon (EIA 2030 “high scenario” projections).

20
Plug-‐in Electric Vehicle Deployment in the Northeast: A Market Overview and Literature Review September 2012
However, if PEV growth does not accelerate, then EVSE service providers and battery manufactures may never reach full capacity. Some factories may not be commercially viable. In the PEV industry, this situation can be seen in the recent bankruptcy of Ener1 systems, although it is currently restructuring its finances to come back into solvency. Because many of these companies have loans from the U.S. Department of Energy, bankruptcies and shutdowns risk undermining public support of PEVs (C2ES 2012).11
Drawing the nascent PEV industry into the Northeast depends on the incentives offered, geographic optimization of the value chain, and the popularity of PEVs in surrounding areas. The PEV industry is not necessarily better served by former auto hubs in the Great Lakes region (Wial, 2010). Indeed, several PEV-‐related ventures have already sprung up in the Northeast. For example, Smith Electric Vehicles, a manufacturer of larger PEVs, recently announced that they will build a $5 million plant in the Bronx, which was directly supported by a $1.7 million tax break from New York City as well as additional incentives from state agencies. The University of Delaware is the nation’s top research institution for the development of V2G technologies and Delaware is acknowledged to have one of the friendliest environments for start-‐ups. For example, Fisker Automotive has repurposed a General Motors plant in Wilmington, Delaware, while AutoPort, based in New Castle, is creating the nation’s first V2G vehicles. In 2011 General Motors opened a $245 million re-‐purposed Allison Transmission plant in White Marsh, Maryland, to produce electric motors for the Chevy Volt and other plug-‐in vehicles—the first such facility operated by a major U.S. car manufacturer.
Besides the direct manufacture of PEVs, PEV deployment gives rise to a plethora of associated industries, which will thrive if PEVs gain high market penetration. For example, advanced lithium-‐ion batteries, the primary battery type used in PEVs, provide an opportunity for the United States to revitalize its manufacturing base. While the United States commanded only 2 percent of the global advanced battery industry in 2008, a Deutsche Bank study shows that the United States currently contains upwards of 16 percent of the world’s lithium-‐ion battery manufacturing capacity and is projected to contain 40 percent of the capacity by 2015 (Executive Office of the President, 2010). In a business-‐as-‐usual PEV scenario, the U.S. market share for batteries will only be limited to 9 or 10 percent by 2017 (Freedonia Group, 2009), but rapid penetration of PEVs within the U.S. could allow battery market share to accelerate as well. The EVSE provider market faces a similar opportunity (See Figure 5).
Figure 5: Projected U.S. Charging Infrastructure Market Value (in Millions of U.S. Dollars) (Zpryme 2010)

21
Plug-‐in Electric Vehicle Deployment in the Northeast: A Market Overview and Literature Review September 2012
Local Air Quality Failure to attain air pollutant standards as set by the U.S. Environmental Protection Agency (EPA) is a threat to public health throughout the United States. Efforts by EPA and others in implementing the Clean Air Act, including vehicle emission standards, have mitigated health problems and saved millions of lives since 1970 (EPA, 2011). If an area does not meet the air quality standard for a particular pollutant, it is designated as a “nonattainment” area. Nonattainment areas must come into compliance within a window of time or risk losing federal funding, lawsuits, new source construction bans, or even federal takeover of air quality implementation from the state environmental agency. In particular, the standard for ground-‐level ozone, known commonly as smog, is the pollutant standard that most nonattainment areas in the Northeast fail to meet, although several counties are in nonattainment with other standards as well.
Ozone is formed from nitrogen oxides (NOX) and volatile organic compounds (VOCs). In the Northeast, vehicle emissions are the largest source for the chemical precursors to ozone. Vehicles, and particularly diesel vehicles, are also major sources of particulate matter. A large concentration of vehicles in a small area leads to a high concentration of pollutants. High population density amplifies the damages as more people are exposed to these pollutants.
Figure 6: Counties Designated Nonattainment for EPA Criteria Pollutants in 201112
As seen in Figure 6: Counties Designated Nonattainment for EPA Criteria Pollutants in 2011, a high number of counties in the Northeast have been designated as nonattainment, or out of compliance with regulatory requirements, for at least one pollutant. The vast majority of these areas are out of attainment with ozone requirements, while counties designated nonattainment for two or three requirements are generally out of attainment with particulate matter regulations as well. The Northeast, as a location with a high population density as well as high emissions, is especially in need of reductions in air emissions, including from vehicles.

22
Plug-‐in Electric Vehicle Deployment in the Northeast: A Market Overview and Literature Review September 2012
PEVs directly emit fewer pollutants than conventional vehicles, including smog (ozone) precursors and particulates. BEVs have no direct tailpipe emissions, although some emissions may be transferred to the areas around power plants due to increased electricity demand. 13 If the majority of generated electricity is from coal-‐fired power plants, PEV uses could actually worsen air quality in other areas. However, although the future is uncertain, the electric generation mix for the U.S. is shifting away from coal given recent trends in natural gas prices and environmental regulations.14 PEVs are generally beneficial for air quality, especially in the Northeast, and as long as coal plays a smaller role in the power mix, these air quality benefits will increase over time.
A NYSERDA PEV study simulated an aggressive PEV deployment scenario in the Northeast under, in which PEVs would comprise about 15 percent of the total fleet by 2025 and 50 percent by 2035. The base scenario was one in which the majority of vehicles were HEVs as opposed to PEVs (NYSERDA and EPRI, 2011). The study, which focused on New York but also looked at neighboring states, found that PEVs decreased ozone levels, with larger benefits for high-‐density areas. PEV deployment also could lead to a statewide reduction in both small and large particulate matter. However, improvements were not uniform and there was potential for drastic emission improvements in local neighborhood “hot spots.” Increased emissions would be concentrated in areas that generate the additional power needed to charge the vehicles.
Other studies show that PEVs will rarely have a negative effect on air quality. A study conducted in Dallas, Houston, Austin, and San Antonio, Texas, showed that the removal of vehicular emissions outweighed the incremental pollution from electricity generation. This result was robust under several different charging scenarios (Thompson, Carey, Allen, & Webber, 2011).
To put the Texas study into context for the TCI region, 39.5 percent of electricity in Texas was generated by coal power plants in 2010. In 2010, ISONE, which provides power to all New England states, had only 11.2 percent of its electricity come from coal plants. NYISO, the New York interconnection, had only 6 percent of its electricity come from coal plants. PJM, the interconnection that serves the Mid-‐Atlantic states, has a coal share of approximately 45 percent, but over 60 percent of its future project queue will be renewable energy. In fact, all three interconnections in the region have plans to increase the share of renewable energy production.15 As such, the net air quality benefits of PEVs are expected to increase as the electricity grid in the Northeast transitions to lower-‐carbon energy sources.
Figure 7: Percentage Difference in Ozone Level Between Base Case and PEV Case
4th highest day of 8-‐hr Average O3 (ppbv), Base Case 2030 Percentage Difference in 4th Highest day of 8-‐hr average O3 PHEV-‐Base 2030
Note: These estimates are conservative as they assume a high penetration of HEVs as the base case—nearly 50 percent of all vehicles would be HEVs by 2025. Indeed, many counties currently in nonattainment would be in attainment even in the base case in which the majority of vehicles were HEVs. Pollutant concentrations in counties on the map in which the percentage of pollutant increase is positive still fall below current concentration levels.

23
Plug-‐in Electric Vehicle Deployment in the Northeast: A Market Overview and Literature Review September 2012
Echoing these results, EPRI and NRDC (2007) recently completed a two-‐phase study that showed that 61 percent of the U.S. population would see decreased ozone levels and 1 percent of the population would see increased ozone levels as a result of a “medium” PHEV deployment of 50 percent of new car sales and 40 percent of total on-‐road vehicles by 2035 (EPRI & NRDC, 2007). The same study finds that particulate matter increased by 10 percent as compared to scenarios in which hybrid vehicles were dominant, although this assumes that coal generation also grows by a large amount (EPRI & NRDC, 2007; University of Vermont Transportation Research Center, 2010).
The Pacific Northwest National Laboratory found somewhat similar results. Using the assumption that 73 percent of the energy required to power the national fleet came from electricity and the fuel mix for electricity generation today, VOC and NOX could be reduced by 93 percent and 98 percent respectively. Carbon monoxide would be reduced by 31 percent. On the other hand, particulate matter emissions less than 10 microns in diameter would increase by 18 percent (Kintner-‐Meyer, Schneider, & Pratt, 2007).
If natural gas displaces coal and/or renewable energy displaces fossil fuel generation sources, particulate matter will likely decrease as well. New England and New York especially would see minimal increases in particulate matter since very little of their power comes from coal. PEVs may have negligible air quality impacts in the short term because of low penetration rates (see Section 3). However, a deep market penetration of PEVs as well as continued plans to maintain and expand renewable energy projects may result in significant positive air quality impacts. Such impacts will be amplified in high-‐density areas along the Northeast corridor, according to the EPRI-‐NYSERDA study. PEVs may prove to be an effective long-‐term strategy for decreasing emissions in high-‐density areas, especially when coupled with low-‐emitting electricity sources.
Global Climate Change Many policy makers see the need to address climate change and its effects as a growing priority. TCI has listed climate change as one of its priorities in its declaration of intent. Both the U.S. Department of Defense and the National Research Council (NRC) have identified global climate change as a serious threat. The NRC indicates “there is a strong, credible body of evidence, based on multiple lines of research, documenting that climate is changing and that these changes are in large part caused by human activities” (NRC, 2010). Temperature increases bring potentially harmful changes including drought, heavy rainfall, rising sea levels, and sea-‐ice loss. Areas along the Northeast and Mid-‐Atlantic coast are especially threatened by sea-‐level rise, but all of these effects could seriously threaten ecosystems, public health, and economic growth (USGCRP 2009). Climate change is also one of the key factors that may spark or exacerbate future conflicts (DOD 2010).
International discussions have centered on the goal of stabilization levels of 450 or 550 parts per million (ppm) carbon dioxide (CO2) equivalent in the atmosphere. A 450 ppm level corresponds to a 2 degree Celsius increase in average global temperatures while 550 ppm corresponds to a 3 degree Celsius increase (C2ES, 2010). This level corresponds to an average global per-‐capita emissions of 2 metric tons of CO2 equivalent by 2050. The U.S. level is currently at 23.5 metric tons of CO2 equivalent per capita.

24
Plug-‐in Electric Vehicle Deployment in the Northeast: A Market Overview and Literature Review September 2012
Table 5: Greenhouse Gas Abatement Goals in the Northeast16
Entity Target Notes and Source
Connecticut 10 percent below 1990 levels by 2020 75-‐85 percent below 2001 levels in the long term
House Bill 5600
District of Columbia
30 percent below 2006 levels by 2020, and 80 percent below 2006 levels by 2050.
Draft Climate Action Plan
Maine 10 percent below 1990 levels by 2020, and 75-‐80 percent below 2003 levels in the long term
Act to Provide Leadership in Addressing the Threat of Climate Change17
Maryland 25 percent below 2006 levels by 2020
Greenhouse Gas Emissions Reduction Act of 2009
Massachusetts At least 10 percent below 1990 levels by 2020 80 percent below 1990 levels by 2050
2008 Global Warming Solutions Act
New Hampshire
20 percent below 1990 levels by 2025 80 percent below 1990 levels by 2050
Climate Change Action Plan
New Jersey 1990 levels by 2020 80 percent below 2006 levels by 2050
Global Warming Response Act of 200718
New York 80 percent below 1990 levels by 2050
Executive Order No. 24
Pennsylvania 30 percent below 2000 levels by 2020.
Climate Change Action Plan.
Rhode Island 10 percent below 1990 levels by 2020
Climate Change Action Plan
Vermont 25 percent below 1990 levels by 2012; 50 percent by 2028; and if practical, 75 percent by 2050
Report and Recommendations of the Governor’s Commission on Climate Change
The transportation sector accounted for approximately 27 percent of the nation’s GHG emissions in 2009— the second largest proportion out of any end-‐use sector. The U.S. transportation system also used 26.5 quadrillion BTUs in 2009—only two nations use more energy than this amount in their entire economies. New England’s transportation system produces more carbon dioxide pollution than any other part of the region’s economy. Moreover, all but 3 percent of the energy that powers transportation in the United States is obtained by burning fossil fuels, and all but 6 percent of it is derived from petroleum.19

25
Plug-‐in Electric Vehicle Deployment in the Northeast: A Market Overview and Literature Review September 2012
In response to the need to curb emissions and in the absence of any federal policy, many states, including all those in TCI,n have committed to reducing carbon emissions below a certain level. To reach these targets, cutting emissions in transportation will be necessary.
The transportation sector is a significant source of potential GHG abatement as it is the second-‐largest GHG emitter of any end-‐use sector. Although increased vehicle efficiency may be the key factor behind reducing GHGs, low-‐carbon fuels and zero emission vehicles (ZEVs) may also play a large part in reducing emissions (AASHTO 2010). Similar to the discussion on air quality, earlier debate on the relationship between PEVs and GHG emissions centered around whether PEVs would actually reduce emissions or simply shift emissions from the tailpipe to the smokestack. Preliminary studies show that a transition to PEVs on a national scale has significant GHG abatement potential. The Pacific Northwest National Laboratory, for example, showed that well-‐to-‐wheels GHG emissions of a national fleet in which 73 percent of the energy was derived from electricity were reduced by 27 percent, assuming a high percentage of the electricity would be from coal plants (Kintner-‐Meyer, Schneider, & Pratt, 2007). Increased deployment of PEVs could increase GHG emissions in certain areas, but most studies show that PEVs will generate lower levels of emissions with the national average fuel mix. In the long run, PEVs could decrease GHGs by an even greater amount if the fuel mix for generating electricity shifts towards low-‐carbon sources.
Although the future is uncertain, the nation’s power mix is currently shifting away from coal (EIA, 2011). Nine of the twelve TCI jurisdictions participate in the Regional Greenhouse Gas Initiative (RGGI), which places a declining cap on carbon dioxide emissions from the power sector.o Under RGGI, CO2 emissions from electricity generation will be reduced by at least ten percent from 2009 levels by 2018. The next page highlights the carbon abatement potential of electric cars as compared to hybrid and conventional cars.
Estimates vary on how much transportation GHG abatement would cost. An EIA study of an economy-‐wide cap-‐and-‐trade system showed that a carbon price that rises from $20 per ton of carbon dioxide in 2012 to $65 per ton in 2030 reduces transportation emissions by only 5 percent, but electric utility sector emissions fall by 60 percent. In contrast, other analyses have claimed emission reductions of 12 percent (Creyts, Derkach, Nyquist, Ostrowski, & Stephenson, 2007) to 50 percent compared to projected levels in 2030, at costs of less than $50 per ton of CO2 (Greene, David; Schafer, Andreas, 2003). Finally, a study of the global transportation system by McKinsey estimated that transportation GHG abatement from current levels ranges from negative 17 Euros (-‐22 dollars) to negative 3 Euros (-‐3.9 dollars) per ton of carbon. These low values were based on a finding that vehicle efficiency and the deployment of less carbon-‐intensive transportation technologies would save money regardless of the negative effects of climate change (McKinsey & Co., 2009).
In sum, increased GHG emissions in the Northeast and Mid-‐Atlantic from PEV adoption are highly unlikely and cost estimates vary. Emission reductions are likely to accelerate in the future as renewable energy and natural gas take a larger share of the power mix. Currently, emission reductions will be large for the NEISO (New England states) and NYISO (New York) interconnections. For the states residing within the PJM interconnection (Pennsylvania, New Jersey, Maryland, and DC), carbon emissions reductions from PEVs may be smaller than New England reductions when compared to a high penetration of HEVs because of the high current prevalence of coal generation. However, PJM plans have 60 percent of new power capacity come from renewable sources. 20
n The District of Columbia’s greenhouse gas reduction targets are stipulated in a draft Climate Change Action plan, but the plan has not been finalized. o RGGI is a cooperative effort among the states of Connecticut, Delaware, Maine, Maryland, Massachusetts, New Hampshire, New York, Rhode Island, and Vermont.

26
Plug-‐in Electric Vehicle Deployment in the Northeast: A Market Overview and Literature Review September 2012
Figure 8: Change in Carbon Emissions when Switching from PHEV to ICEV or HEV
Percentage change in carbon emissions when switching from PHEVs to ICEVs or HEVs, taken from Hines et al (2010). [1]A assumed charging with electricity generated from coal power plants while [1]B assumed that the electricity was generated from combined cycle natural gas. [10], [5]A,[8] and [11] all used the national average generating mix while [5]B & [6] used regional averages for CA and New England respectively. Taken from (Farmer, Hines, Dowds, & Blumsack, 2010) Figure 9: Energy Consumption by Grid Interconnections in TCI Region
ISONY (2011)
PJM (2012)
ISONE
Aggregate coal consumption in the US is roughly 45 percent according to 2010 data from the Edison Electric Institute. Note that all three interconnections are aggressively expanding the renewable portfolio and slowly phasing out coal.

27
Plug-‐in Electric Vehicle Deployment in the Northeast: A Market Overview and Literature Review September 2012
5. PEV Deployment: Barriers and Options
Challenges to PEV deployment can roughly be separated into three categories:
• Vehicle appeal: PEVs appeal to consumers due to lower operating and maintenance costs, the opportunity to contribute to environmental benefits and energy security, and first-‐to-‐own and status benefits. However, upfront cost is likely one of the largest barriers to widespread PEV adoption. PEVs currently have a higher purchase price than conventional vehicles of similar size. Battery costs are the greatest component of a PEV’s price but have been decreasing per unit of energy for some time and can continue to do so if manufacturers achieve additional technological breakthroughs and increasing economies of scale. Given high upfront costs, PEV growth may be encouraged by emphasizing the total value proposition, such as fuel cost savings over the lifetime of the vehicle as well as environmental benefits. Finally, “range anxiety” or the fear of running out of energy while driving is a commonly cited reason why consumers may be reluctant to purchase BEVs and in general, consumers are uncertain about PEV technology. Policy options include the short-‐term subsidization of PEVs and EVSE through both financial and non-‐financial mechanisms. Consumer education is also needed to publicize the total value proposition of PEVs and to ease range anxiety.
• Charging build-‐out and finance: At the very least, PEV users must have one charging location available, although increased availability of EVSE is likely to spur PEV adoption. The optimal locations, numbers, and deliverable power of charging will differ from area to area. Moreover, the process of installing EVSE must be clarified for a variety of locations, but especially for multi-‐family dwellings. Stakeholders must determine the balance between private and public investments in charging infrastructure. Analyses of optimal EVSE placement as well as coordination among PEV stakeholders in EVSE build-‐out could be of help.
• Impacts on the electrical grid and transportation funds: Although regional impacts will likely be negligible for many years given projected PEV penetration rates (NYSERDA and EPRI, 2011), unmanaged charging and high PEV penetrations in specific areas could negatively affect some local distribution systems. Moreover, both state and federal transportation departments must identify a funding mechanism for PEV drivers because of the shortfall between transportation infrastructure expenditures and revenues. This shortfall may be significantly exacerbated if electric vehicles become a sizable portion of the vehicle fleet.
Addressing each of these issues would facilitate the acceleration of PEV deployment.
Vehicle Appeal
Capital Cost Reductions Needed for Vehicles One of the primary obstacles preventing PEVs from becoming competitive with conventional vehicles is their high initial cost. For example, the 2012 Chevrolet Volt PHEV and Nissan LEAF BEV cost about $31,645 and $27,700 respectively, even after the $7,500 discount from the federal income tax credit (see inset). According to the Columbia University Earth Institute, a conventional vehicle with similar characteristics costs around $22,500 while HEVs are around $26,000 without any subsidy (Columbia University, 2010).
The new Ford Focus Electric will provide the first direct comparison between an EV and ICE vehicle of the same model. However, direct comparisons between most PEVs and other vehicles are difficult. For example, although the Chevy Volt uses the same chassis as a $17,000 Chevy Cruze, the driving experience of a PEV compared to a conventional vehicle or HEV is markedly different; p the Volt, for example, has the same torque as a Ford Mustang, which is 45 percent higher than a Cruze .21 Also of note is that the average price of a new car sold
p While the Volt shares the 1.4-‐L turbo-‐four Ecotec engine with the Chevrolet Cruze, the Volt delivers much more in terms of handling and performance. Moreover, reviewers have claimed the electric drive gives a much smoother driving experience. http://www.caranddriver.com/comparisons/2011-‐chevrolet-‐volt-‐page-‐2

28
Plug-‐in Electric Vehicle Deployment in the Northeast: A Market Overview and Literature Review September 2012
(after discounts) in 2011 was nearly $30,000.22 The price of a LEAF after the income tax credit is below $30,000 while the Volt is only slightly above this number, although the LEAF and the Volt are more expensive than new conventional cars of similar size.
Still, consumers perceive upfront cost to be a significant barrier, especially if the benefits and differences of electric drive are not understood. As seen in Figure 10: Major Factors Influencing New Vehicle Purchase Decision from Three Groups: Overall Group, Likely to Purchase EV Group, and Not Likely to Purchase EV Group (Zpryme 2010), bringing these costs down is crucial.
Figure 10: Major Factors Influencing New Vehicle Purchase Decision from Three Groups: Overall Group, Likely to Purchase EV Group, and Not Likely to Purchase EV Group (Zpryme 2010)
Even though PEVs may cost less than conventional vehicles over the vehicle’s lifetime, since electrical miles are cheaper than petroleum miles, consumers discount future fuel savings at 20 percent—i.e., saving $1,000 of gasoline in the next year is perceived as only saving $800 in the present—while a discount rate pegged to nominal Treasury interest rates would be closer to 4 percent (Greene & Plotkin, 2011). Lower maintenance costs are also expected because the drivetrains of PEVs require much less maintenance than conventional drivetrains. Electric motors are simpler and have fewer moving parts than a modern internal combustion engine.23
Fleet operators are much more aware of operating costs and are willing to pay 10-‐14 percent more than consumers are for an electric or hybrid vehicle (EDTA, 2011). However, fleets often have separate budgets dealing with operating and initial capital costs; thus, potential fuel and other operating cost savings do not necessarily factor into the initial cost-‐benefit analysis for determining fleet purchases. Several actions can be taken to make PEVs more attractive to fleet operators. For tax-‐exempt entities that do not qualify for the $7,500 income tax credit, the auto dealer can claim the tax credit instead and lower the price of the vehicle accordingly. Auto dealers
The Basics of the Federal Tax Credit The federal income tax credit for PEVs was created by the 2008 Energy Improvement and Extension Act. The credit consists of an initial $2,500 for any PEV plus $417 for each kWh of battery capacity up to $5,000 for light duty vehicles. Therefore, the total credit is capped at $7,500. Medium-‐duty and heavy-‐duty vehicles are capped from $10,000 up to $15,000 depending on the weight of the vehicle. After any manufacturer reaches 200,000 in cumulative PEV sales, a phase-‐out period begins in which the subsidy is ramped down to 50 percent of its initial value, then 25 percent, and finally the elimination of the tax credit. Currently, both Congress and the Administration are proposing mechanisms that allow the customer to obtain an instant cash rebate as opposed to a tax credit (IRS, 2009).

29
Plug-‐in Electric Vehicle Deployment in the Northeast: A Market Overview and Literature Review September 2012
must disclose in writing to tax-‐exempt fleet operators that they intend to claim the credit so that the fleet operator may negotiate for passed-‐on savings.24 The Palm Beach Sheriff’s County Department, for example, was able to realize savings in this way.25
Energy Service Companies (ESCOs), which use energy savings to pay for upfront efficiency investments, may also translate to PEV procurement for fleets—PEV retrofitters have partnered with ESCOs in the past.26 Battery leasing is another possibility that greatly lowers the upfront cost of the vehicle, translating some upfront costs into operational costs. GE is exploring this option.27
The majority of the higher cost of a PEV stems from the cost of the battery system. Currently, the price of PEV lithium-‐ion batteries is highly uncertain since auto manufacturers do not disclose the price of the battery. The National Research Council estimates that current battery costs range between $500 and $1,500 per kWh, with $875 per kWh as the most probable value and $625 per kWh as an optimistic value (NAS, 2010). News articles in late 2011 report costs as low as $400 per kWh28 of total energy or nameplate capacity or $800 per kWh more commonly (BCG, 2010). Nissan gave a cost that is slightly less than $750 per kWh in mid-‐201029, whereas public statements from the Department of Energy in early 2012 gave an estimate of $600 per kWh (DOE, 2011b), which was corroborated by industry (Ener1, 2010). Assuming a cost of $600 per kWh, a PHEV battery with a 40-‐mile range and a capacity of 16 kWh could cost almost $9,000 without looking at labor and engineering costs. q A BEV battery with a 100-‐mile range and a capacity of 24 kWh could cost over $14,400.r30
Without any subsidies, some studies show that PEVs may not become cost-‐competitive with conventional vehicles until battery costs reach $300 per kWh (MIT, 2010). s The DOE has set a price target of $350 per kWh (DOE, 2010) whereas the U.S. Advanced Battery Consortium has set a cost target of $250 per kWh.
Figure 11: Components of the Unit Cost of a Battery Pack (Argonne National Laboratory, 2011)
q The usable battery capacity is only a fraction of the total capacity for PEVs because of conversion inefficiencies and safety reasons. r Actual battery costs are tightly guarded by auto manufacturers and may be as high as $1000/kWh or more because of the developing nature of the industry as well as various incidental expenses. For example, in 2010, the National Research Council used an estimate of $1,750 per useable kWh while EPRI believes that $1,100 per useable kWh is closer to the mark. sBased on 2008 average gasoline price of $3.21 per gallon.
Materials, 46%
Purchased Items, 17%
Depreciajon, 10%
Labor, 6%
General, Sales, Admin, 5%
Profit, 7%
R&D, 5%
Variable Overhead, 4%

30
Plug-‐in Electric Vehicle Deployment in the Northeast: A Market Overview and Literature Review September 2012
Prices for large-‐format automotive-‐grade batteriest are expected to drop, especially if manufacturers are able to achieve economies of scale. The magnitude of this drop is highly uncertain and depends on both technological progress and scale of production. Importantly, almost 72 percent of the costs of battery production (materials, purchased items, labor, and variable overhead) are considered variable costs. Thus, battery marginal costs may decrease as PEV production scales up (see Figure 11). Broad improvements in manufacturing and other variable expenses could potentially drive costs below $300 per kWh for PHEVs and $200 per kWh for BEVs, as seen in Table 6 (Santini, Gallagher, & Nelson, 2010). A BCG study echoed these results and estimated that only about 25 percent of the battery cost, mainly standard parts and raw materials, will be fixed and remain independent of scale (BCG, 2010).
Table 6: Predicted Energy Capacity and Cost of Lithium-‐Ion Battery Packs for PEVs Given Scaled Production (Argonne National Laboratory, 2011)*
Electric drive range (miles)
Total Energy (kWh)
Useable Energy** (kWh)
Total Cost ($)
Total Energy Cost ($/kWh)
PHEV 20 10.3 7.2 2,058 200 EREV*** 20 9.6 6.7 2,741 285 EREV 40 18.7 13.1 3,604 193 BEV 100 33.3 25 4,848 146 *Assuming a production rate of 100,000 per year. Cost is for manufacturing, not the retail price. ** PEVs do not use the system’s total battery capacity to ensure a long usable life. *** EREV or extended range electric vehicle is an electric drive vehicle that contains an ICE to charge the battery system when its energy is depleted (e.g., Chevrolet Volt). An electric motor converts ICE energy to power the wheels. An example PHEV is the 2012 Toyota Plug-‐in Prius, which can use an ICE to power the wheels.
The U.S. Department of Energy has invested heavily in U.S. battery production capacity—projected to be 40 percent of the world’s capacity by 2015—but price cuts may not result until production increases significantly. DOE estimates that if a battery plant expands production from 10,000 to 100,000 units per year, it can reduce battery costs by 30 to 40 percent (DOE, 2010). In addition to economies of scale, the price of PEV batteries is expected to drop due to learning curve improvements such as decreased cost of battery materials, increased manufacturing expertise, and advancements in battery design (BCG, 2010).
Consumer home-‐use lithium ion batteries like those found in laptops may serve as an example of what could happen to the automotive lithium ion battery. These batteries fell from $2,000 to $250 per kWh in 15 years (Ener1, 2010; BCG, 2010).u
However, similar to present cost estimates, future cost decreases for batteries also remain highly uncertain. BCG estimates the cost that original equipment manufacturers (OEMs) pay for batteries will decrease by 60 to 65 percent by 2020. Batteries have the potential to reach $500 per kWh by 2015 (BCG, 2010) but prices will remain above $250 per kWh through 2020. According to other estimates, the cost of batteries will in fact drop lower. Pike Research estimates that costs will be at $470 per kWh by 2015. To further highlight the uncertainty, Envia, a battery researcher funded in part by DOE’s ARPA-‐E program and GM, unveiled a high-‐density $125/kWh battery that could allow for 300 miles per charge, though it would take 3 years to take the battery to market.31
In the case of PHEVs, the cost challenge is further complicated by the fact that they require a battery pack as well as an ICE and associated components (see Figure 1). The ICE system in a PHEV, including the drivetrain and fuel tank, can add $4,000 per vehicle. However, PHEVs require less energy capacity from the battery—and therefore a lower-‐cost battery pack—than BEVs, so the addition of the ICE system does not necessarily make them less economically competitive.
t A large-‐format automotive battery pack consists of a number of battery cells connected together to form modules. Several modules are connected to form the battery pack, which also contains a cooling mechanism and other controls. u Vehicle batteries must meet significantly stricter requirements than consumer batteries in the areas of safety and lifespan.

31
Plug-‐in Electric Vehicle Deployment in the Northeast: A Market Overview and Literature Review September 2012
Capturing and Presenting the Total Value Proposition: Total Cost of Ownership and Non-‐Monetary Values While bringing down battery costs will be important to driving down the initial cost of PEVs, stakeholders could also incorporate the total cost of ownership (TCO) through fuel cost savings and expected maintenance savings. The value proposition of a PEV can also be bolstered by its environmental benefits and “first-‐to-‐own” status benefits. The challenge is finding the most effective and efficient ways to promote the consideration of factors besides initial cost.
Overall, the price of electricity in the Northeast is high relative to the rest of the nation—New England states have average prices ranging from $0.13 to $0.20 per kWh. Connecticut and New York had the second and third highest average electricity prices in the nation in 2010, at $0.1739 and $0.1631 per kWh. States in the PJM interconnection to the west and south of New York generally have prices that range from $0.09 to $0.12 per kWh.32 Gasoline prices, on the other hand, vary to a lesser degree. In 2011, gasoline prices varied approximately 20 percent across the nation not including Hawaii and Alaska. Prices averaged about $3.56 per gallon nationally throughout 2011.33
However, even in Connecticut and New York, the price of electric miles are usually a fraction of gasoline or diesel miles. As seen in the graph below, developed by the Department of Energy’s Office of Energy Efficiency and Renewable Energy, at retail gasoline prices of about $3.50 per gallon and an electricity price of about $0.10 per kWh, the cost of an electric mile for a BEV that can travel 3 miles per kWh (such as the LEAF) is only a quarter or a fifth of the cost of a gasoline mile traveled by a 22 mpg gasoline-‐powered vehicle. When compared with hybrids, a PEV electric mile is about half the cost of an HEV mile. Importantly, these electric miles do not include a potential road user fee equivalent to the federal and state gasoline taxes, which may make electric miles more expensive than they are currently (EERE, 2005).
Figure 12: Energy Cost Per Mile and Efficiency Cost Per Mile for PEVs Compared to Other Vehicles

32
Plug-‐in Electric Vehicle Deployment in the Northeast: A Market Overview and Literature Review September 2012
Figure 13: Relative Annual Fuel Cost Savings from Switching to PEVs Based on Estimated Gasoline Prices in July 2008 (Lidicker, Lipman, & Shaheen, 2010); Average Retail Price of Electricity (EIA, 2012)

33
Plug-‐in Electric Vehicle Deployment in the Northeast: A Market Overview and Literature Review September 2012
A study by the Harvard Kennedy School showed that a gasoline price of $4.50 per gallon, when combined with up front vehicle costs, would make PHEVs and BEVs cheaper than conventional vehicles. Moreover, under a scenario in which gasoline is $6 per gallon and electricity is $0.15 per kWh, the TCO of HEVs, PHEVs, and BEVs would be $2,411, $1,886, and $6,059 less than a conventional vehicle respectively. The Harvard study noted that consumers may ignore any fuel savings past the three-‐ or four-‐year time horizon because they may be uncertain about new products like PEVs. If this is the case, mass PEV adoption may not be expected unless gasoline prices reach $6 per gallon instead of $4.50 per gallon or upfront PEV costs fall substantially (Lee & Lovellette, 2011). Figure 14 shows a breakdown of TCO and payback time in three Northeastern municipalities.
Figure 14: Payback Period for EV Premium in New York City, Boston, and Philadelphia (Columbia University, 2010)
New York City – Flat Rate $0.27/kWh
Comparison to Hybrid Vehicle:
EV Premium: $3,330
Comparison to Conventional Vehicle: EV Premium: $6,560
Electricity Price
Cost per Gallon Gasoline
Miles Driven per Day
Cost Savings per Year
Payback Period (Years)
Cost Savings per Year
Payback Period (Years)
$0.27 $3.50 40 $255.18 13.05 $1,567.15 4.19 $0.135 $3.50 40 $728.22 4.57 $2,040.19 3.22 $0.0675 $3.50 40 $964.74 3.45 $2,276.71 2.88
$0.27 $4.00 40 $398.32 8.36 $1,898.97 3.45 $0.135 $4.00 40 $871.36 3.82 $2,372.01 2.77 $0.0675 $4.00 40 $1,107.88 3.01 $2,608.53 2.51
$0.27 $2.50 40 ($31.09) N/A $903.51 7.26 $0.135 $2.50 40 $441.95 7.53 $1,376.55 4.77 $0.0675 $2.50 40 $678.47 4.91 $1,613.07 4.07
$0.135 $3.50 20 $463.76 7.18 $1,115.34 5.88 $0.135 $3.50 40 $728.22 4.57 $2,040.19 3.22 $0.135 $3.50 80 $1,257.14 2.65 $3,889.87 1.69
Boston – Flat Rate $0.07718/kWh
Comparison to Hybrid Vehicle:
EV Premium: $3,330
Comparison to Conventional Vehicle: EV Premium: $6,560
Electricity Price
Cost per Gallon Gasoline
Miles Driven per Day
Cost Savings per Year
Payback Period (Years)
Cost Savings per Year
Payback Period (Years)
$0.15882 $3.50 40 $644.76 5.16 $1,956.72 3.35 $0.07941 $3.50 40 $923.01 3.61 $2,234.97 2.94
$0.15882 $4.00 40 $787.89 4.23 $2,288.54 2.87 $0.07941 $4.00 40 $1,066.15 3.12 $2,566.79 2.56
$0.15882 $2.50 40 $358.48 9.29 $1,293.09 5.07 $0.07941 $2.50 40 $636.73 5.23 $1,571.34 4.17
$0.15882 $3.50 20 $422.03 7.89 $1,073.61 6.11 $0.15882 $3.50 40 $644.76 5.16 $1,956.72 3.35 $0.15882 $3.50 80 $1,090.21 3.05 $3,722.94 1.76

34
Plug-‐in Electric Vehicle Deployment in the Northeast: A Market Overview and Literature Review September 2012
Philadelphia – Flat Rate $0.0999/kWh
Comparison to Hybrid Vehicle:
EV Premium: $3,330
Comparison to Conventional Vehicle: EV Premium: $6,560
Electricity Price
Cost per Gallon Gasoline
Miles Driven per Day
Cost Savings per Year
Payback Period (Years)
Cost Savings per Year
Payback Period (Years)
$0.0999 $3.50 40 $851.21 3.91 $2,163.18 3.03 $0.050 $3.50 40 $1,026.06 3.25 $2,338.03 2.81
$0.0999 $4.00 40 $994.35 3.35 $2,495.00 2.63 $0.050 $4.00 40 $1,169.20 2.85 $2,669.85 2.46
$0.0999 $2.50 40 $564.94 5.89 $1,499.54 4.37 $0.050 $2.50 40 $739.79 4.50 $1,674.39 3.92
$0.0999 $3.50 20 $525.26 6.34 $1,176.84 5.57 $0.0999 $3.50 40 $851.21 3.91 $2,163.18 3.03 $0.0999 $3.50 80 $1,503.12 2.22 $4,135.86 1.59
TCO can be driven even lower with changes in consumer behavior. Many but not all utilities in the TCI region have different rate structures—known as time-‐variant rates—with respect to season and time of day. In the Northeast and Mid-‐Atlantic, electricity generation is most expensive during the summer because of air conditioning. It is slightly cheaper during the winter and cheapest in spring and fall. However, seasonal differences are much smaller than daily price differentials. As seen in the Orange & Rockland34 pricing structure for the northwestern suburbs of New York City, peak rates can range as high as $0.2171 per kWh while off-‐peak rates are as low as $0.01398 per kWh. Several utilities are experimenting with variable peak pricing (VPP) that allows for real-‐time data on prices instead of discrete pricing bins.
Figure 15: Orange and Rockland Utility Time-‐Variant Structure
On the other hand, other utilities like those serving certain parts of Philadelphia do not offer any daily time-‐variant rates. As of 2008, the Federal Energy Regulatory Commission (FERC) estimated that only five percent of customers in the nation are on some form of time-‐based rate or incentive-‐based program (FERC, 2008). States in the TCI Network have some of the smallest penetrations of time-‐variant use.
In 2010, in response to the Energy Independence and Security Act of 2007, FERC wrote a national action plan on demand response in order to decrease peak consumption. This plan encourages more time-‐variant rate structures to encourage off-‐peak PEV charging, which minimizes impacts on the grid and allows for lower TCO.

35
Plug-‐in Electric Vehicle Deployment in the Northeast: A Market Overview and Literature Review September 2012
To examine the effect of time-‐variant rates on PEVs, the Columbia Earth Institute analyzed the payback period of a 2011 LEAF as compared to hybrid electric and gasoline vehicles. Charging at average NYC ConEdison electricity rates of $0.27 per kWhv results in a payback period of 13.05 years whereas charging at special EV off-‐peak and time-‐variant rates results in a payback period of 3.45 years. Tables on Boston and Philadelphia are also included below. These three cities represent the three interconnections (NYISO, NEISO, and PJM) that include all participants in TCI (Columbia University, 2010).
Other benefits can further increase the attractiveness of PEVs. Discounted parking, HOV lane access, vehicle inspection waivers, or remote charging using a specialized truck from AAA all provide indirect economic benefits and can increase the attractiveness of PEVs. Fleet vehicles can give PEVs a “proof of concept” to improve consumer confidence as a fleet is often driven around the city. Moreover, PEVs could be given a publicity boost if fleet vehicles are equipped with distinctive stickers or paint patterns. Several early PEV adopters had large, distinctive stickers placed on the PEV so others could begin to recognize these cars as PEVs (Columbia University, 2010).
The personal value of a PEV is higher in places where a premium is placed on environmentally friendly behaviors. In a study of hybrids, economists found that people in areas with high environmental sentiment like Boulder, Colorado, were willing to pay $1,876 to $7,187 more for a Toyota Prius than people in areas with low environmental sentiment. The Prius was especially prized because of its distinctive styling (Sexton & Sexton, 2010).
Publicizing the non-‐monetary value proposition could have great effect. McKinsey’s study on New York City, for example, showed that PEV growth in the next few years would be driven by “green” early adopters who are relatively indifferent to monetary incentives. For these adopters, publicizing and implementing actions that allow them to minimize their carbon footprint—for example, by offering “green” electricity services for PEV charging—may be the most cost-‐effective public policy. Although the effect of different policy options is likely to vary by location, publicizing the non-‐monetary benefits of PEVs can also be an extremely effective way to present the PEV value proposition to wealthier customers (City of New York, 2010).
Consumer Uncertainty and BEV Range Anxiety “Range anxiety,” is a common consumer concern about BEVs, defined as the fear that a vehicle may leave a driver stranded because it runs out of fuel before reaching its destination. However, studies show that most trips are within PEV driving ranges. According to the National Household Travel Survey, 85 percent of drivers commute fewer than 50 miles per day, 78 percent of drivers commute fewer than 40 miles per day, and the majority of drivers commute fewer than 20 miles per day (Hu & Reuscher, 2004). To provide a comparison, the maximum range of the 2011 Nissan LEAF is 100 miles while a practical range is closer to 70 miles. As most charging occurs at home, a charging pattern for a consumer would be to charge overnight and commute during the day, potentially allowing for daily travel needs to be satisfied without any need for public charging infrastructure (Columbia University, 2010).
Still, even though most commuters would not need more than a 70-‐mile range, many consumers are concerned about the limited range of BEVs (Accenture, 2011; Kintner-‐Meyer, Schneider, & Pratt, 2007). Even though drivers may rarely drive beyond 75 miles per day, a survey by Deloitte showed that 63 percent of respondents expect BEV ranges of 300 miles on a single charge. Presently, such a driving range is either infeasible or will likely drive BEV costs far beyond what is affordable for the majority of consumers (Deloitte, 2011). Tesla Motor’s Model S has a range of 160 miles when fully charged with an acceleration of 0 to 60 mph in 5.6 seconds, but retails at a base price of $57,400—nearly $20,000 more expensive than other manufacturers’ PEVs.
Range anxiety is heightened in the Northeast because of cold weather conditions, inclines, and stop-‐and-‐go traffic. Cold weather brings down range—a scenario in 14-‐degree F weather and stop-‐and-‐go traffic limited the LEAF’s range to 62 miles. To address this issue, Nissan plans to sell a cold-‐weather battery protection package with the LEAF. It is also important to note that this range is still within the daily trip distance for most Americans.
vThis value includes fixed monthly service fees that would be charged regardless of PEV use.

36
Plug-‐in Electric Vehicle Deployment in the Northeast: A Market Overview and Literature Review September 2012
PHEVs overcome this range anxiety altogether, as they are capable of running fully on gasoline once the battery is fully discharged (Benecchi, Mattila, Syed, & Shamsuddin, 2010). Cold weather still affects the range of a PHEV, such as the Volt, whose electric range can dip to 20 to 25 miles in freezing weather, but gasoline is available as a backup. For this reason, Volts were a more popular choice among consumers surveyed in an Accenture study, who rank the battery range of BEVs as the number one reason to choose a PHEV over a BEV (Accenture, 2011).
The installation of public charging infrastructure can also help reduce range concerns and spur BEV sales, especially as a second car. A trial program by the Tokyo Electric Power Company (TEPCO) showed that after the installation of a DC fast charging station, drivers were much more confident about their cars and allowed batteries to deplete much further (Aoki, 2010). The amount of public charging infrastructure needed, however, is still unknown, and estimates vary widely.
Figure 16: Impact of the Strategic Installation of One Quick-‐Charging Station in Addition to One Existing Quick-‐Charging Station (Aoki, 2010)
Note: State of charge (SOC) is the amount of energy in the battery before charging.
Some studies estimate that as few as one public charging station per 100 PEVs would be sufficient. In that case, the majority of PEV charging would take place at private residences (Benecchi, Mattila, Syed, & Shamsuddin, 2010). A McKinsey study on New York City estimates that the use of public money to fund extensive EVSE build-‐out is not an effective public policy. This is because early adopters in New York City may be more likely to adjust their driving behaviors to find a charger due to their attitudes regarding status and the environment that are more important than cost considerations. As such, early adopters may not demand a network of convenient public chargers.
Range anxiety begins to dissipate as drivers become accustomed to BEVs. A study by the UK Technology Strategy Board of 340 BEV drivers found that range anxiety dropped by 35 percent after 3 months of driving a BEV—100 percent of drivers surveyed stated that they were worried about getting to their destinations before purchasing a BEV but that number dropped to 65 percent after three months. A joint study by BMW and University of California at Davis found that drivers thought that the BMW Mini-‐E met 90 percent of their driving needs. Furthermore, 71 percent of these respondents said they are now more likely to purchase a BEV than they were a year ago while only 9 percent said they are less likely (Turrentine, Garas, Lentz, & Woodjack, 2011).
Without a major breakthrough in battery technologyw, batteries will place technical limits on the driving range of most BEVs at approximately 160 to 190 miles between charges (BCG, 2010). The specific energy densityx of today’s lithium-‐ion batteries is only 1 percent that of gasoline, which limits range because large—and therefore heavy—battery systems are needed.y Future lithium-‐ion batteries will likely employ advanced technology and materials
w Envia Systems, a battery research firm funded by DOE’s ARPA-‐E program and GM, recently unveiled a battery with an energy density of over 400 Wh/kg and projected costs of $125/kWh. However, the battery will not be brought to market for another 4 to 5 years and details are still unclear. xEnergy per unit mass.. y Since the system efficiency of a PEV is much higher than a gasoline-‐based system, the energy density of a battery does not have to match gasoline to achieve comparable range.

37
Plug-‐in Electric Vehicle Deployment in the Northeast: A Market Overview and Literature Review September 2012
that will increase energy density and lower cost (DOE, 2011b). Technological breakthroughs with new battery chemistries such as lithium-‐air would also allow BEVs to attain a range equal to internal combustion engine vehicles (Greene & Plotkin, 2011). However, over time conventional vehicle technology will also advance since the system-‐level energy density for conventional vehicles can improve significantly through efficiency improvements (see Table 7).
For the near term, range anxiety can be combated through public education and EVSE provision, as ranges are unlikely to improve significantly. Rental cars, car-‐sharing, fleet rentals, and trial periods all allow consumers to gain exposure to PEVs and experiment with PEV ranges, as the California’s PEV Regional Coordinating Councils point out (Association of Bay Area Governments 2011). As another example, Enterprise Rent-‐A-‐Car plans to unveil 500 Nissan LEAFs at select Enterprise locations nationwide.35
Table 7: “Tank to Wheel” Energy Density Comparison (EPA, 2008; Crabtree et al., 2008; Girishkumar, McCloskey, Luntz, Swanson, & Wilcke, 2010; Greene & Plotkin, 2011)
Vehicle Type Battery Energy Density (Wh/kg)
System Efficiency
System Level Energy Density (Wh/kg)
Conventional Vehicle (Gasoline) 13,000 21 percent 2,730*
TODAY
PEV (Lithium Ion Battery) 100-‐250 81 percent 81-‐203**
Conventional Vehicle (Gasoline hybrid) 13,000 42 percent 5,460***
FUTU
RE
PEV (Lithium Air Battery) 12,000 9 percent 1,100****
* Includes energy loss from internal combustion engine, standby/idle, driveline, and accessories. ** 10 percent energy loss from electric motor and 10 percent loss from battery charging. *** Assume doubling of efficiency through advanced drivetrains, engine shut-‐off when idle, regenerative braking, and more. **** Includes loss due to battery system, electric motor, and battery charging.
Summary and Policy Options As described above, PEVs face three major challenges related to vehicle appeal:
a. Capital costs: In 2012, most PEVs retail for more than $35,000 without a tax credit, whereas similarly-‐sized ICE vehicles are $20,000 or less. With a federal income tax credit up to $7,500, initial costs are lowered but still remain significantly above that of other vehicles. Without upfront cost reductions, PEVs’ appeal may be limited. However, battery costs have the potential to drastically lower as production scales up. Since costs are dependent on scaling, increased demand now may bring costs down in the future.
b. Capturing the total value proposition: Because capital costs for PEVs may remain high in the near future, stakeholders could find ways to present the total value proposition of PEVs. Fuel and potential maintenance costs are much cheaper for PEVs than for ICEs. Clarifying annual savings from lower fuel and maintenance costs as well as the non-‐monetary benefits of PEVs could help accelerate PEV growth in the initial years, bringing costs down in the long run. However, potential consumers may not fully account for these savings. Non-‐monetary benefits, primarily conveyed through non-‐monetary incentives and the “green” image of PEVs, can also offset the high capital costs of PEVs.
c. Range anxiety in BEVs and consumer uncertainty: Mainstream consumers are often uncertain and wary about using new technology. For PEVs, a primary source of uncertainty is range anxiety. Drivers may have to adjust their driving behavior to adjust to PEV use. This issue primarily affects BEVs, although PHEV drivers wishing to maximize their electric miles traveled may also be affected. Evidence shows that most trips are within the range of today’s BEVs, but having readily accessible chargers and PEV education campaigns may alleviate range anxiety and general uncertainty.
In order to increase the attractiveness of PEVs, both financial and non-‐financial incentives could be offered. The table below highlights several options that increase the attractiveness of PEVs. Although non-‐financial incentives like HOV access do not directly bring down capital costs or combat range anxiety, they often provide indirect economic benefits and increase the worth of PEVs. Other policies such as public fleet composition standards, research and development, and encouraging innovative finance mechanisms also work towards increasing PEVs’ overall appeal. Finally, each of these policies works towards increasing PEV purchases, which addresses all three of the above challenges simultaneously.

38
Plug-‐in Electric Vehicle Deployment in the Northeast: A Market Overview and Literature Review September 2012
Table 8: Menu of Actions and Policy Options for Increasing PEV Appeal to Consumers (C2ES, 2012)
= Viable Action or Policy Option
Policies Challenge addressed Level of Government Example/Comments High
initial costsz
Total value prop.
Aware-‐ness, range
Fed. State Local/ Private
Increasing Demand Fleet purchases General Electric is committed to purchasing
25,000 Chevrolet Volts.36 Increased PEV purchases lowers PEV costs over the long run and increases exposure and awareness.
Rental fleet purchases
Enterprise is committed to purchasing electric vehicles for rental including 500 Nissan LEAFs.37
Consumer Education and Demographic-‐Targeted Policies Consumer education about PEV technology and charging
DOE awarded community planning grants totaling $8.5 million and will help education consumers and share results on PEV deployment.38
Green charging policies
A McKinsey study in New York City shows coupling electric vehicles with charging from renewable energy sources maximizes the number of new PEV purchasers per public dollar spent.39
Direct Financial Purchase Incentives Purchase incentives (tax credit, rebate, etc.)
Maryland offers a $2,500 tax credit in addition to the Federal credit. It is limited to one per individual and ten per fleet.40
Public infrastructure incentives
Maryland offers a tax credit up to 20 percent of the EVSE cost.41
Private infrastructure incentives
ECOtality offers home EVSE at no cost in select states in the South and the West Coast, partially funded by a federal grant.42
Indirect Financial and TVP Incentives Reduced bridge and road tolls
New York State offers 10 percent EZ Pass discounts for HEVs and PEVs under the Green Pass Discount Plan.43
Reduced vehicle registration fees
Washington DC offers a reduced registration fee for PEVs.44
Discounted parking The City of New Haven offers free parking on all city streets for registered HEVs and alternative fuel vehicles.45
Reduced electricity rates for charging
Virginia Dominion Power provides a PEV charging rate reduction.46
HOV access Of TCI states, MD, NJ, and NY allow HOV lane exemptions for PEVs.
Towing and mobile charging assurances for stranded PEVs
AAA has introduced special “EV charger trucks, which can charge a stranded PEV.47
Exemption from vehicle inspection
Maryland exempts PEVs from vehicle emission inspections.48
Gasoline tax PEVs users do not have to pay a user fee/fuel tax on electric miles traveled in most states.
z Refers specifically to the potential to bring down the retail price of PEVs by increasing production. As referred to in Section 5, increased production and efficiencies of scale may lower costs by a significant amount.
39
Plug-‐in Electric Vehicle Deployment in the Northeast: A Market Overview and Literature Review September 2012
Standards and Mandates Fuel Economy and Greenhouse Gas Standards
2012-‐2016 CAFE-‐EPA federal vehicle standards.49
Carbon Price or Low-‐Carbon Fuel Standard
California has a low-‐carbon fuel standard that will promote PEVs.50
Zero Emission Vehicle (ZEV) Mandate
California’s ZEV Program will require automakers to sell some ZEVs like PEVs in the state.51
Government fleet purchase mandates
Connecticut gives a price preference for up to 10 percent for the purchase of alternative fuel vehicles and their refueling equipment.52
R&D Funding Technological research
ARPA-‐E battery research grants.53 NYSERDA research grants.54
Consumer and driver behavior research
UC Davis has conducted several studies on PEV driver behavior.55
Finance mechanisms and business models Vehicle leasing over initial purchase
BMW launched its ActiveE model on a lease-‐only basis for $499 per month.56
Free one-‐month trial lease
A McKinsey study cited this option as being effective in attracting consumers, but costly to the entity sponsoring the trial.57
As seen in the table above, a significant number of incentives already exist that bring down the cost of PEVs and EVSE. The federal vehicle tax credit is the largest one, bringing down the cost of passenger PEVs by up to $7,500. Some states, like Maryland, have an additional vehicle credit. Although the federal EVSE subsidy was phased out in 2011,aa58 state subsidies to EVSE still exist. These direct subsidies to EVSE purchase also bring down upfront costs.
Consumer education can play a significant yet relatively low-‐cost role in increasing PEV attractiveness. For early adopters, the total value proposition runs beyond the upfront costs of purchasing a PEV. The PEV value proposition also involves saving money on fuel over the life of the vehicle as well as the value conferred from being the first to own a PEV, environmental benefits, and projected image (Tuttle & Baldick, 2010). Numerous calculators, including those from Project Get Ready, PEV manufacturers, and the DOE, give consumers information for calculating the payback period, although this information is highly dependent on individual driving habits and the region. Moreover, utilities can offer special rate structures that allow lower rates and incentivize off-‐peak charging (see Section 4 for more). Other actions, such as offering renewable energy charging for electric vehicles, can further emphasize and elaborate PEV appeal.
The start of a consumer education campaign can be coupled with temporary financial incentives as well. For example, a vehicle launch in an area can be coupled with a free 30-‐day trial lease period (McKinsey, 2011), although a free trial period would be relatively costly. New York City, for example, offered free charging at specific locations for a limited time.
In addition to publicizing the benefits of PEVs, consumer education efforts could focus on clarifying the facts about PEV technology. For instance, many consumers are still unaware of how HEVs differ from a conventional vehicle, even though HEVs have been on the road for more than a decade (C2ES, 2012). Consumers could be given information on how PEVs work, what distinguishes them from conventional vehicles, and what the differences are between PHEVs and BEVs.
aa The tax credit for charging infrastructure expired on 12/31/11. The tax credit was 30 percent of the cost of the infrastructure up to $1,000 for individuals and $30,000 for businesses.

40
Plug-‐in Electric Vehicle Deployment in the Northeast: A Market Overview and Literature Review September 2012
Leasing or financing for vehicles can be structured to avoid high initial costs. Fuel cost savings and reduced maintenance costs, which occur over time, can balance out monthly vehicle payments to make PEV monthly costs roughly similar to conventional vehicle monthly costs (Becker, Sidhu, & Tenderich, 2009). Energy Service Companies or ESCOs, which primarily operate in electricity generation, work to lower initial capital costs with an agreement to recoup the money out of operational savings later on; creating such an agreement with electric vehicles may help lower the upfront cost of a vehicle.59 Moreover, from the perspective of utilities, implementing time-‐variant rate structures not only helps to increase fuel cost savings, but also to maintain grid reliability.bb
Charging Build-‐Out and Finance In order for PEVs to become feasible in a given area, drivers must have access to at least one charger. For many PEV drivers, the “first charger” will be located in a personal garage at home. Charging usually takes several hours at a minimum, and residential EVSE allows for a complete charge that is both convenient and readily accessible (Project Get Ready & ETEC, 2011).
Figure 97: Charging Infrastructure Approaches (C2ES, 2012)
Various stakeholders have emphasized that home EVSE will be more important than commercial or public charging (C2ES, 2012; EPRI, 2010). An EPRI study showed that 95 percent of customers prefer home charging. Most PEV purchases come with a portable Level 1 AC charger that is “plug-‐and-‐play.” Level 1 AC charging does not require any installation because standard household outlets are also at 120 V. Thus, virtually all single-‐family households with garages have sufficient power for Level 1 AC. Level 1 AC also has minimal impact on the grid and is equivalent to a portable heater. However, Level 1 AC takes up to 10 hours to fully charge the Volt’s 16 kWh battery pack and over 20 hours to charge the LEAF’s 24 kWh pack. While the 2012 Plug-‐in Toyota Prius can be charged in three hours, most light-‐and medium-‐duty truck PEVs will take over 20 hours to fully charge with a Level 1 charger.
The charging level needed at home depends on the miles traveled per day. While Level 1 home EVSE may work for many consumers, others will likely require higher powered charging. Level 2 AC will likely be necessary for many BEV owners and desirable for PHEVs with battery packs larger than 16 kWh.cc,dd Level 2 EVSE is likely also desirable for electric fleets, which may require quick charging times. The Electric Drive Transportation Association (EDTA) recommends that fleet operators consider a Fleet Recharge Management System (FRMS), which is an integrated computerized charging system that can optimize charging sequences and times for multiple vehicles. This automated sequencing avoids overloading the electricity distribution system and minimizes electricity demand charges (EDTA, 2011).
bb More studies on the effects of price differentials and time variant-‐structures on the total cost of ownership are needed (see section 5). ccFor example, the Fisker Karma has a 22.6 kWh battery pack with a 2.0L engine. ddCharging time can also improved using DC fast charging, which can charge a LEAF to 80 percent in under 30 minutes, but these chargers cost over $10,000 and can require extensive permitting and inspections because of their high power.

41
Plug-‐in Electric Vehicle Deployment in the Northeast: A Market Overview and Literature Review September 2012
A significant number of potential PEV drivers do not have access to a personal garage, and will be unable to obtain charging at home. This is an especially important problem in the Northeast, where many potential PEV drivers live in multi-‐unit dwellings with shared parking or rely on street parking.
The absence of a personal garage adds several logistical difficulties to the problem of EVSE installation. In these cases, publicly accessible charging or charging installed in shared parking areas may be required. With the presence of such charging near workplaces, “workplace charging” can serve to complement or even potentially substitute for home charging. Workplace charging has been identified, along with home charging, as a priority location for charging (C2ES, 2012). If consumers cannot obtain an adequate charge at home, they can potentially charge at a shared parking complex designated for their workplace, or a publicly accessible parking space. However, workplace charging is dependent on financing and build-‐out from entities other than the consumer. A full build-‐out of public “destination” charging stations and is generally considered a lower priority than home and workplace charging (C2ES, 2012).
EVSE Permitting and Inspection Process Many potential individual or fleet PEV drivers may be unaware of the process for obtaining Level 2 EVSE. Although dealers or manufacturers may help consumers or fleet purchasers through the process at the point of sale, confusion prior to the point of sale may be a barrier to purchase. Moreover, differing processes between municipalities or long, complex processes may further hinder PEV deployment. A lack of coordination between the PEV manufacturer, electricians in the region, utilities, and the local government may encumber EVSE purchase and installation for the consumer. In order to clarify the process, Raleigh, North Carolina, and Atlanta, Georgia, as well as several other cities and states have committed to following a standardized, expedited process (see flowchart below) for EVSE installation, which is similar to the typical process for installing any new 240 V plug: Identify, Assess, Permit, Install, Inspect, and Integrate.
Before purchasing a PEV, the customer first identifies the need for EVSE as well as a local or PEV manufacturer-‐sponsored electrician in the area that can help with identification and assessment. During these initial stages, the customer could consider notifying the utility about the intention to purchase a PEV, as it may be crucial for utilities to monitor power demands and ensure the stability of the grid. However, customers may not know to do so.
Notifying the utility is especially important if customers are installing Level 2 EVSE, which can add 3.3 to 6.6 kW of power demand to the grid (about 5 kW at peak demand). Utility notification could be made mandatory in order to ensure grid stability. For example, Maryland enacted a law allowing the Motor Vehicle Administration to share information about new PEV purchases with electrical utilities. However, some customers may have privacy concerns about utility notification, so care should be taken to ensure that sensitive information is masked (C2ES, 2012). Utility notification could also occur during the time of purchase, electrician visits, or the electrical Level 2 EVSE permit application process.
After identifying the need for EVSE, the customer asks the electrician to assess the work that must be done. The electrician assesses whether the house contains or can support a 240 V outlet with a 30 to 40 amp (A) circuit breaker.ee Individuals may have an unused connection in their circuit panel to create a new outlet for the Level 2 EVSE. If the consumer already has an unused 240 V outlet (a dryer outlet for example), no new outlet is required. Another common scenario is one in which the house contains an unused 30 A circuit breaker, in which case the electrician can simply install another outlet and wire the breaker to the EVSE. The most time-‐consuming scenario occurs when the available power capacity in a neighborhood is inadequate, and the utility must upgrade the local transformer.60
Fleet owners usually must contact the utility because of the large increase in spot power at a centralized charging station, similar to the most time-‐consuming scenario for home EVSE. The utility may have to upgrade the local transformer and ensure that wiring to the charging stations is possible. As the Rhode Island PEV assessment attests, review of a complex project will take several weeks longer than a simple residential EVSE installation (EEI, 2011).
ee Circuit breaker requirements for installing EVSE can be determined using the formula: current = power divided by voltage (I = P / V). For example, a LEAF may charge at 3.3 kW at 240 V, and 3.3 kW/ 240 V = 13.75 A, although other PEVs can carry 6.6 kW charging capabilities.

42
Plug-‐in Electric Vehicle Deployment in the Northeast: A Market Overview and Literature Review September 2012
Figure 108: General Flowchart for Obtaining EVSE (Project Get Ready & ETEC, 2011)

43
Plug-‐in Electric Vehicle Deployment in the Northeast: A Market Overview and Literature Review September 2012
The next step—a city permit—can be a hurdle in rapidly obtaining EVSE. A permit is required so that the city knows that installation has been approved by a certified electrician. Obtaining a city permit in the TCI region may take several days to several months, although the typical wait time is three days to six weeks.ff By considering the installation of residential EVSE as “minor work,” New Jersey’s governmental body for codes and regulations allows the electrical contractor to install EVSE upon verbal notification of the local code enforcement agency. The permit application must be filed within 5 days of the verbal notification.61 PEV manufacturers have teamed up with many different cities to allow for a streamlined permitting process (City of Atlanta, 2011).
In most localities, upon seeing the city permit, the electrician installs the EVSE and either the customer or the electrician asks the utility to activate power for the newly installed EVSE. With an expedited process, the entire installation can be done in 2 days, assuming no electricity service upgrades are necessary. Raleigh, for example, created a “fast-‐track” approval plan that requires the consumer to wait only for an hour. Other cities may create permitting processes that allow the permit request to be sent over the internet instead of a physical visit or require the electrician rather than the customer to send the permit request. Permitting costs also differ between cities; for example, a permit in Westbrook, Maine, costs $35; in New Hampshire, the cost varies between $25 and $75; in Onondaga County, New York, cost is $300 per location; in Vermont, the fee can vary between $75 and $400.gg Waiving the permit fee may be one possible option to reduce costs for the PEV consumer. Because the process for obtaining EVSE involves several steps as well as multiple entities, customers may be intimidated. In an attempt to streamline and standardize the process, PEV manufacturers have teamed up with electricians and EVSE providers.
Installation may be especially intimidating in dense, old cities in the Northeast, which face special problems during the inspections and permitting process. Old homes and apartments may need additional electrical wiring from the street or additional space in the electrical panel, which can add significant costs and time. Similar to permitting costs, installation costs may also vary widely depending on the nature of the installation as well as the state utility regulatory policy. These upgrades mean that the utility as well as the city may become more involved. Coordination between the utility, manufacturer, electricians, and the city is important.
Generally, while in-‐house upgrades such as an additional outlet or additions to the electrical panel may be paid for by the customer, distribution infrastructure upgrades (e.g., wiring or transformers) have traditionally been paid for by the local utilities and municipalities. To recover the cost of responding to new loads in a way that is equitably distributed among customers, utilities and utility regulators rely upon a well-‐established set of rules included in utility tariffs. These rules look at the demand required and thus do not distinguish between the uses of comparable electrical loads (C2ES, 2012). For example, in the past many utilities have paid for service extension and upgrades to support high-‐power demands such as air conditioning or hot tubs in order to add new consumer uses. Customers were added even if the cost of doing so exceeded the incremental benefit as long as expected net present value of future utility revenues remained positive and more customers were likely to be added in the future. For example, if a new transformer upgrade was needed for an air conditioning “early adopter” to have service, this upgrade was justified on the grounds that additional customers would also require an upgrade in the future. If incremental service extension exceeded a certain cost level, then customers in some states installing the additional electric load paid for the difference. In some states, instead of the customers paying, utilities either folded the cost of upgrade into the rate base or paid out of company profits (C2ES, 2012).
Although minor distribution upgrades are usually paid for by utilities, utility payment for upgrades is not universal. In California, Rule 15 states that an upgrade of equipment that serves multiple customers is a utility expense and is borne by the ratepayer base. However, if the upgrade serves only one customer, that customer has to pay a certain amount. This issue is more significant for fleet owners, who may have to contribute a significant amount to a transformer upgrade if regulators see fleet charging equipment as only serving one customer, i.e., the fleet owner.62 The extent to which fleet owners will have to pay for distribution upgrade costs on top of EVSE costs will depend on the utility.
ff Results of TCI Clean Cities Questionnaire, administered under the Department of Energy EV Readiness Planning Grant. gg Results of TCI Clean Cities Questionnaire, administered under the Department of Energy EV Readiness Planning Grant.

44
Plug-‐in Electric Vehicle Deployment in the Northeast: A Market Overview and Literature Review September 2012
Various building codes can be modified to encourage new homes or those undergoing significant renovations to be built “pre-‐wired”— with all necessary panels and wiring in place—for EVSE in parking facilities (City of New York, 2010). San Francisco, for example, has adopted building codes that require all new homes and offices to come pre-‐wired for electric car chargers (City of San Francisco, 2010). A New Jersey state bill proposed that charging service be provided to at least 5 percent of all parking spaces at new shopping centers.63
Fleet EVSE is likely to require a large increase in power demand in a localized area, which means that the utility must assess and perhaps upgrade the local transformer. Greater involvement of the utility in the EVSE installation process for fleets is necessary in order to maintain grid reliability, but a simplified process would still be desirable (Project Get Ready & ETEC, 2011).
If customers—commercial builders and fleet operators in particular—have to pay for a transformer upgrade, they are faced with another financial barrier to obtaining a PEV. Uncertainty about whether a transformer upgrade is needed may also confuse potential customers and deter PEV market growth. Still, even though the cost burden on utilities and municipalities will be minimal in the short run, utilities and municipalities must understand the cost requirements of widespread PEV adoption (C2ES, 2012).
Closely associated with the “who pays” question for electrical wiring and transformer upgrades, customers may require a new meter in order to access PEV time-‐variant (off-‐peak vs. peak) pricing. The cost burden of this new meter can be borne either by the customer or the utility, as seen in the EPRI survey in Figure 19. However, some utilities can offer time-‐variant rates without a new meter.
Figure 19: Survey on Payment for the Installation of a New Meter: Who Owns and Provides the Meter Socket Installed at the Customer’s Home (EPRI Infrastructure Working Council, 2011)
Residential Consumer Charging
EVSE Purchase Process Coordination between auto manufacturers, EVSE providers, and local public authorities allows for the creation of a standardized yet cost-‐effective process that satisfies consumers. Manufacturer partnerships that currently offer full service level 2 EVSE installation plans include:
• Ford and Best Buy: This effort represents an integrated process for the vehicle purchase (Ford Focus BEV) and the installation of a home charger provided by Best Buy’s Geek Squad (and third party electrical contractors). The home charger provided by EVSE manufacturer Leviton is removable. Ford estimates charging equipment and installation costs of around $1,500.
• General Motors and SPX: General Motors is partnering with SPX to offer a home charging system for $490 and approximately $1,500 for the installation, although installation costs vary widely depending on the home wiring. Since a Level 1 charger can recharge the PHEV Chevrolet Volt overnight, a Level 2 charger is not necessarily required.
• Nissan and AeroVironment: For Nissan’s LEAF, the company teamed with AeroVironment to provide home EVSE. Nissan charges $2,000 for a typical installation (C2ES, 2012).

45
Plug-‐in Electric Vehicle Deployment in the Northeast: A Market Overview and Literature Review September 2012
Not every customer will be interested in making use of a standardized EVSE installation process. The standardization of EVSE installation led some LEAF drivers to opt out of the AeroVironment purchase process in 2011 in order to have more choice in EVSE installation. In Nissan’s case, customers were searching for cheaper options. For example, a PEV consumer can spend almost $2,000 (AeroVironment, 2011)64 for the typical installation of a Level 2 AC charger from the Nissan-‐AeroVironment partnership. While the charging dock itself only costs $800 to $900 including shipping and delivery, the permitting, inspections, and installation process can cost over $1,00065. Moreover, many mainstream EVSE are wall-‐mounted and thus cannot be moved from place to place. The permanence of Level 2 AC docks thus prevents consumers from taking their chargers with them if they move. To overcome this problem, Ford is partnering with Best Buy to install portable home charging stations for the Focus BEV in 2012.66
Some consumers have turned to third parties to purchase Level 2 AC equipment. Currently, Nissan customers are automatically signed up to purchase Nissan-‐sponsored EVSE and are strongly encouraged to enroll in the EVSE process when they put a deposit down for a vehicle. To access different EVSE, consumers may attempt to purchase EVSE from an independent party while asking an independent electrician to conduct the assessment. Other consumers may purchase the Nissan EVSE and only opt out of the assessment by the electrician. Still others may sign up for a “service plan” like NRG Energy’s eVgo, in which a fee is paid monthly to access an entire network of chargers, including one that is typically installed at home for free.
Early experience in 2011 showed that consumers generally saved some money on EVSE by opting out of a manufacturer-‐provided full-‐chain process.67 This may not always be true as manufacturer EVSE policies evolve and come into competition with third-‐party providers. According to Plug-‐in Michigan, costs for third-‐party installations can range from $490 to $3,000 depending on the EVSE provider. Some PEV owners or consumers seeking to save money have attempted to install the equipment themselves. Such attempts include converting the portable Level I AC charging into Level 2 AC charging. These conversions pose dangers, especially if the installation or conversion is not ULhh certified. Moreover, attempting to self-‐install the EVSE without notifying the utility may create problems for local grid stability later on. In contrast, UL-‐certified installations such as the GE Wattstation, which costs roughly $1,000 and can be bought at many retail stores, provides consumers with a reliable third-‐party option.
Finally, PEV service providers are collecting data on EVSE use to better understand driver behavior. Consumers may be concerned that data being collected could be used to identify an individual driver so care must be taken to mask identifiable information (C2ES, 2012).
In sum, PEV manufacturers must create a process that is easy to understand without limiting choice. Uncertainty in EVSE installation wards potential consumers away. According to an interview with Plug-‐In America founders, uncertainty surrounding EVSE installation contributes to the media and public perception that EVs are complicated and untested. Auto manufacturers can potentially simplify the process without limiting choice. For example, manufactures can nudge customers towards a full-‐chain EVSE installation plan, thereby offering a simple solution that minimizes the complexity of the process. At the same time, by giving customers the choice to opt out of the installation, manufacturers also do not have to sacrifice freedom of choice.68
Multi-‐family Dwelling Considerations Consumers should ensure that a “first charger” (a charger that is reliably available to the driver) can be installed at an accessible location before a PEV is purchased (Project Get Ready & ETEC, 2011). Many homes, particularly those in multi-‐unit dwellings or areas reliant on street parking, may not include a personal garage. These homes are numerous in high-‐density areas in the Northeast, and these high-‐density areas might also be where PEVs have the highest early-‐stage appeal (McKinsey, 2011).
These challenges are primarily related to the cost and ownership of the EVSE. Condominiums and rental properties may share a master electricity meter and may not be set up to support additional meters without significant cost. Potential PEV drivers may have to negotiate with others in their housing complex to install EVSE and charge their PEVs. PEV drivers must first examine if they can have EVSE in the residential lot of the multi-‐family dwelling, as some co-‐ops and condo associations could decide to restrict EVSE installations. Other tenants and residents may be hostile towards charging because of the potential that the association will incur costs and that the parking
hhUnderwriters Laboratory creates many electronic safety standards.

46
Plug-‐in Electric Vehicle Deployment in the Northeast: A Market Overview and Literature Review September 2012
space will become permanently “reserved” for the PEV owner. If charging cannot be provided on the residential lot, it will be necessary for the PEV driver to charge in public or semi-‐public areasii such as parking garages and parking lots.
Although owners will have access to Level 1 AC charging as long as a 120 V outlet is accessible, outlets might not be readily available near parking spots for those living in multi-‐family dwellings. Even if a charging location does exist, the chargers themselves may be unplugged or even stolen during use because Level 1 chargers are portable— a full charge from Level I AC for most PEVs requires leaving the charger out overnight at a minimum.
Figure 20: Challenges in Installing Chargers for Multi-‐Family Dwellings (SFEnvironment, 2011)
Physical Challenges • Availability of capacity in the electrical panel • Availability of space for additional meters in the meter rooms • Distances between utility meters, parking spaces and unit electrical panels
Cost of Installation and Operation
• Restrictive facility configuration (master meter, remote parking, etc.) • Cost allocation to residents (based on usage, equipment, parking, shared service areas) • Inability to take advantage of off-‐peak charging rates • Home Owners Association fees structures
Codes, Covenants and Legalities
• Differences in ownership • Difference between who makes the investment and who reaps the benefit • Agreement between property owners and residents/renters • Deeded parking spaces assigned to individual residents
The process of obtaining a Level 2 AC charger differs with respect to whether the residence is a condominium or a rental property. For condominiums with parking facilities, PEV drivers in cooperation with their homeowners associations or co-‐owners can potentially determine where, how, and when charging can take place, especially if an enclosed, private garage is available. In this case, the PEV adopter would have to coordinate EVSE installation with the condominium association. If the private lot is located outdoors, a series of Project Get Ready utility guides recommend that a permanent, outdoor-‐rated EVSE installation be available to prevent vandalism, theft, and depreciation from weather (Project Get Ready & ETEC, 2011). If the PEV driver owns the parking spot, the PEV driver may have to pay for EVSE installation and go through the permitting and inspection process (Peterson D. , 2011).
If parking is located off the residential lot in a “common area,” consumers will have to negotiate with the parking lot owners (see next sub-‐section), which places them in the same position as renters. Renters are dependent on their property owners to provide charging if they rent a parking spot. The lot owner may be required to go through the permitting and inspections process, which makes it more unlikely that the lot owner will want to install EVSE for the PEV owner. Moreover, not only should the logistics and legal issues of building EVSE be thought through, but parties must consider what would happen if the PEV owner moves—for example, whether installed EVSE can be moved with the owner. In that case, the EVSE may have to be disabled (EEI, 2011).
Certain multi-‐family dwellings also may not physically be able to support Level 2 AC charging because of a lack of capacity in the electrical panel; the availability of space for additional meters; or the distance between the meter, parking space, and unit electrical panels. The experience of obtaining EVSE for multi-‐family dwellings will vary widely. According to Plug in America, obtaining a charger may be unique for each PEV driver even within the same housing complex.69 Ultimately, if PEV drivers cannot access a charger on their proprietary or leased residential lot, then they may have to look to publicly accessible charging.
Workplace, Publicly Accessible and Commercial Charging In the absence of home EVSE, potential PEV drivers will have to rely on other locations for charging, including the workplace, parking lots, garages, or special curbside stations. For example, roughly 50 percent of all vehicles in
iiEVSE installations that may be used by multiple owners in a particular area including charging provided in housing complex lots, pay garages, and workplaces. Also of note is that we define “public” charging to mean areas that are generally accessible by the public. These locations may be privately owned. This definition is not to be confused with “public investment” which is investment in charging infrastructure paid for by taxpayer or utility payer dollars.

47
Plug-‐in Electric Vehicle Deployment in the Northeast: A Market Overview and Literature Review September 2012
New York City park in public parking lots or on the street (Columbia University, 2010). In this scenario, workplace charging at employee-‐designated parking lots or charging at publicly accessible parking complexes may be required so that consumers can charge on a consistent basis.
Table 9: EVSE Power Levels Feasible in Various Locations (C2ES, 2012)
Site AC Level 1* AC Level 2** DC Level 2***
Single Family Home
Multi-‐Unit Dwelling
Commercial Property
Workplace
Curbside
Private Rest Stop
Carpool Lots
Public Parking
Popular Destinations
*Level 1 AC means low-‐power 1.2 kW. **Level 2AC means power levels up to 6.6 kW in commercial locations and 3.3 kW in residential locations. ***Level 2 DC refers to fast charging at typically 50 kW.
The process of installing EVSE in public or shared locations follows the same basic flowchart as residential EVSE installation, except the PEV driver may not be the property owner, who is often the key to the process. Similar to the case of a fleet PEV owner, a large set of charging docks or the absence of wiring within public areas would require direct contact with the utility in order to accommodate the increase in electricity demand. Potential additional upgrades, installations, and inspections will lead to higher costs in order to upgrade service.70 This is particularly true for “DC fast chargers,” which are only feasible in publicly accessible locations or large parking complexes where drivers only stay a short time because of their high capital need and power requirements. Nissan and its partner Sumitomo are marketing “DC fast charger” units to gasoline stations and restaurants among other businesses at a cost of around $10,000 each, but these may end up costing several times that amount once the costs of installation, from potential service upgrades to permitting processes, are included.71
Many PEV drivers have cited workplace chargingjj during the daytime as the second-‐preferred charging location, although charging at night is best for grid reliability (C2ES, 2012). The reliability of workplace charging depends heavily on the degree to which the PEV owner can access and reserve the parking space near the charger. A typical workday is eight hours long, which allows for an adequate charge for PHEVs if the charger is Level 1 AC; PHEV drivers will need only home or workplace charging (C2ES, 2012).
Some potential early adopters, such as city dwellers in multi-‐family dwellings, may not have the option to charge while at home. Current literature and available information does not adequately address the willingness of consumers to consider PEVs without access to home charging. For this group, guaranteed workplace charging could act as an adequate substitute for home charging depending on the driver’s travel needs (e.g., if the vehicle is only used for work commuting). Although the number of likely PEV consumers that fall within this category is unclear, it may be worth exploring depending on land use, travel patterns, and other factors.
PEV owners seeking workplace charging are more likely to acquire charger access if they have significant sway with the property owner or a supportive workplace. The PEV owner and the workplace property owner could potentially negotiate a dedicated parking spot near an outdoor-‐rated outlet on the workplace propertykk (Project Get Ready & ETEC, 2011). However, if work takes place in a large complex with many other owners or users, ownership and cost issues become significant; in this way, challenges associated with workplace charging are similar to those of negotiating with homeowners associations in multi-‐family dwelling charging.
jj Functionally, workplace charging denotes any reliable charging mechanism that can take place while a consumer is at work and can include any location nearby the workplace. Practically, reserved, reliable “workplace” charging is more likely to take place at a workplace lot. kk Outdoor-‐rated outlets must meet standards that are required for safety reasons.

48
Plug-‐in Electric Vehicle Deployment in the Northeast: A Market Overview and Literature Review September 2012
In addition to the workplace, other potential locations for charging include publicly accessible locations such as parking garages (e.g., downtown garages) or shopping mall lots. These chargers are not ideal “first chargers” for PEV drivers, as charging outlets are unlikely to be reserved and thus become unreliable for daily use. They are better for secondary charging or “destination” charging, in which the car charges while the consumer does other activities (EEI, 2011). Certain locations may be more suitable than others. For example, workplace charging, intermodal transit hubs (e.g., airports and train stations), downtown parking garages, and shopping malls can potentially attract high traffic and are popular destinations in which PEV drivers may park for several hours at a time; these locations guarantee that the PEV driver can engage in other activities while waiting for the car to charge. One difficulty in installing fully public “destination charging” stations regards who should pay for such EVSE and the proper incentive to getting EVSE built.
Besides the challenge of financing public “destination chargers,” publicly accessible charging is also encumbered by the question as to whether these spots are “reserved” for PEV drivers, as well as how to prevent non-‐PEVs from parking in charging locations. Local ordinances sometimes allow non-‐plug-‐in electric vehicles to be towed or fined if found in charging spots, but many locations are only just encountering PEVs for the first time.72
Several states have regulated whether conventional vehicles can park in parking spots with public charging. For example, in 2011 California passed AB 475, which mandated that any car in an electric charging parking space must be “connected” to the charger or risk towing. PEV stakeholder groups were largely against the bill because the law ends the widespread practice of “plug-‐sharing” in which PEV drivers wrote notes on their windshield to indicate the time in which their PEV could be unplugged and the plug could be transferred. With the new bill, the second PEV driver risks getting the first consumer’s car towed if he unplugs the charger from the car in the “designated” parking space. Moreover, instead of potentially serving several parking spaces, a public charger effectively serves a single space.73
Bill supporters argue that as PEVs ramp up, standardized, simplified regulations are needed to make PEV parking understandable. A small population of PEV owners allows for impromptu note-‐writing and plug-‐sharing, but hundreds of thousands of PEV drivers may make such practices unsustainable. Still, lawmakers have proposed revisiting the issue in the coming years. Other states will likely need to explore this issue in the near future.74
Another potential site for charging is at rest stops along highways, which would allow BEVs to travel between cities. Whereas public rest stops generally may not be used for commercial purposes, a high number of grandfathered rest stations and toll roads in the Northeast afford an opportunity for building charging stations in rest stops. For example, the Pennsylvania Department of Environmental Protection awarded $1 million to Car Charging Group LLC to install both AC Level 2 and DC fast-‐charging stations at 17 turnpike service plazas.75 Charging stations can also be built just off the highway, which is what the West Coast Green Highway is doing.76
However, the ratio of charging time to driving time for trips, even with DC fast charging, poses a challenge. BEVs traveling at highway speeds over long distances could spend about one third of the trip waiting to charge (assuming 60 mph, DC fast charging that provides 20 kWh in 25 minutes, and PEVs traveling 3 miles per kWh) (C2ES, 2012).
Finally, in contrast to workplace, garage complex, or destination charging, curbside charging may be a last resort in terms of both provision and use, especially in highly dense urban areas (Columbia University, 2010). Installing curbside charging infrastructure may be costly because of the additional electric infrastructure and wiring required, and determining EVSE siting may prove infeasible. Curbside charging infrastructure also may be the most time-‐consuming to build because it is located mostly on public lands and must satisfy various building and municipal codes (Project Get Ready & ETEC, 2011). Also, a mechanism for ensuring that the curbside charger can be relied upon and reserved may be hard to develop.

49
Plug-‐in Electric Vehicle Deployment in the Northeast: A Market Overview and Literature Review September 2012
Table 10: Residential EVSE Provision without a Personal Parking Spot
Advantages Disadvantages Comments and Examples
Co-‐ownership over residential lot
PEV driver owns EVSE location and has more say over logistics behind charging
Potential for shared costs of EVSE finance and charging
Lack of space or outlets
Requires coordination with co-‐owners
At-‐house and in-‐lot parking
Rental agreement
Potential for shared costs in the finance of EVSE
Lack of space or outlets
EVSE may become useless after PEV-‐owning renter leaves, leading to reluctance from landlord to install EVSE
Private garages requiring membership, parking in housing complex garages
May serve many different PEV owners and popularize PEVs
Must work through permitting with garage owner
Lack of support from garage owner may hinder EVSE access
May be fewer EV charging stations than EVs
Threat of vandalism and theft
Coulomb Technologies builds a $2,000 ChargePoint station whose initial capital cost is jointly financed. Afterwards, it gives 80 percent of the monthly subscription fee to garage owner, though the garage owner must pay for the electricity.
Garages and parking lots accessible by the general public
Many cities and states are currently funding charging stations for free for demonstration purposes.
May serve many different PEV owners and popularize PEVs
Threat of vandalism and theft
Uses public funding and taxpayer dollars
May not be best “first EV charger” choice
Can connect cities and encourage longer BEV trips
The Philadelphia Convention Center recently installed eight EV charging stations with two outlets each in its garage through private funding.
Curbside parking Widely accessible and visible Threat of vandalism and theft
Extensive permitting required from city; relatively expensive
Cords may fail local safety standards for “tripping hazards”
Oregon built an “Electric Avenue” near Portland State University, which contains seven electric charging stations allowing for curbside charging.
Sources: C2ES, 2012; Columbia Earth Institute, 2011; Project Get Ready, 2011.
Standards Uniform vehicle charging standards are crucial if PEVs are to gain wide acceptance. These standards include technological standards such as those for plug connectors (e.g., the J1772 connector, see Section 1) and interconnections with the electrical grid, as well as local building codes for signage and accessibility.ll 77
Setting PEV charging standards involves many different bodies to deal with vehicles, dispensing, and infrastructure, as seen in the figure below. These standard-‐making bodies includes the SAE, the National Institute of Standards and Technology (NIST), the American National Standards Institute (ANSI), the International Code Council (ICC), Underwriter Laboratories (UL), the National Electrical Code (NEC), the International Association of Electrical Inspectors (IAEI), the National Electrical Contractors Association (NECA), and the Institute of Electrical and Electronics Engineers (IEEE) (C2ES, 2012).
ll The FHWA has given interim approval for optional use of an Alternative Electric Vehicle Charging General Service Symbol Sign.

50
Plug-‐in Electric Vehicle Deployment in the Northeast: A Market Overview and Literature Review September 2012
Figure 21: Key Entities in PEV and EVSE-‐Related Standards (DOE: National Renewable Energy Laboratory (NREL), 2011)
Public charging may require different standards than residential charging. Both Project Get Ready and the Edison Electric Institute (EEI) also note that many states and cities lack firm siting, accessibility, safety, signage, and other standards for publicly accessible and shared charging (EEI, 2011, Project Get Ready & ETEC, 2011).mm State Public Utility Commissions (PUCs)—entities that are in charge of setting utility regulations—and state and local governments can ensure that a uniform set of standards is developed for EVSE (C2ES, 2012).
Financing Charging Infrastructure Financing EVSE will require two types of companies or entities: those willing to provide EVSE charging and those willing to pay for EVSE build-‐out. The former group consists of those looking to build an electric vehicle charging network, such as EVSE manufacturers. In addition to the EVSE manufacturers with formal partnerships with PEV manufacturers, several EVSE providers have already entered the market (C2ES, 2012):
• Coulomb Technologies: Coulomb operates the ChargePoint Network of EVSE. In addition to its private, residential installations, Coulomb sells ChargePoint stations to commercial and public entities. The company offers Level 1, Level 2, and DC fast chargers.nn EVSE owners (the commercial and public entities that purchase the ChargePoint stations) set the price for using the station and Coulomb does not charge for electricity but rather for use of the equipment. Coulomb received a grant of $15 million from the American Recovery and Reinvestment Act (ARRA) to deploy its network in select locations nationwide.
Highlighted locations: On July 22, 2011, Coulomb Technologies announced the construction of 150 electric vehicle charging stations in Boston, Massachusetts, to complement its ChargePoint Network in other Northeastern cities including New York, Baltimore, and Washington, DC.
mmPGR gives a number of different recommendations for each of these issues. nn No specifications were available for Coulomb’s DC fast chargers at the time of this writing.

51
Plug-‐in Electric Vehicle Deployment in the Northeast: A Market Overview and Literature Review September 2012
• NRG Energy and eVgo: NRG Energy’s eVgo program charges a monthly fee to subscribers, relying on this income base to build a comprehensive network of commercial and residential EVSE. The company is offering three subscription plans ranging from $49 to $89 per month with no upfront cost to install home EVSE. For plans that include electricity usage, the eVgo charging system is in part relying on fuel (i.e., electricity) price certainty to build a customer base. AeroVironment will provide the EVSE for eVgo.
Highlighted locations: NRG Energy, a wholesale electric generation company headquartered in New Jersey, had built over 30 public charging stations in the Houston and Dallas/Fort Worth areas as of December 2011.78
• ECOtality: ECOtality operates the Blink Network of EVSE. Like Coulomb Technologies, the company installs both residential and commercial EVSE. ECOtality offers Level 2 chargers and DC fast chargers (using the CHAdeMO compliant connector). Its plan allows anyone to use a publicly available station, but provides discounts and other benefits to Blink Network members. Also like Coulomb, ECOtality formed a public-‐private partnership after receiving a grant of over $100 million from ARRA to deploy its network in select cities nationwide.
Highlighted locations: Blink contains over 10 public charging stations in Rome, NY, and over 30 stations in Tennessee. Blink has nearly a thousand public and residential stations in western states. By late 2012, it plans to install over 14,000 public and residential charging stations in the U.S.
• 350Green: The company installs publicly available Level 2 and DC fast chargers but does not provide home EVSE. 350Green offers (unspecified) pricing plans including a pay-‐per-‐use plan and a monthly subscription plan that provides access to its network. The model offered by 350Green does not install home EVSE.
Highlighted location: 350Green has built several charging stations in Washington, DC.79
Some battery providers have also entered the market. Better Place has a business model to own the battery inside a PEV. To prevent long charge times, Better Place intends to use robotic battery swap stations to exchange a depleted battery with a fully-‐charged one. By removing the cost of the most expensive component of a PEV, the company can make PEVs’ upfront costs competitive with conventional vehicles today. Charging a per-‐mile fee similar to cellular per-‐minute rate plans, Better Place hopes to change the way people look at PEVs and the automobile itself. Not only do they plan to have an EVSE network, they also intend to install robotic battery swapping stations to make “fill-‐ups” convenient. Better Place is currently developing a San Francisco and San Jose electric taxi program in conjunction with the U.S. Department of Transportation and the Bay Area Metropolitan Transportation Commission. Better Place is also spearheading large PEV deployment efforts in Israel and the Netherlands. Projects in these countries incorporate robotic battery swap stations.
Crucially, state regulators must decide whether these EVSE providers should be regulated as utilities, which must abide by various standards and rules for rate setting and the sale of electricity. If EVSE providers are regulated as utilities, the private sector may have difficulty entering the charging market. California’s public utility commission has determined that providing PEV charging “services” is not the same as selling and buying electricity—an activity only utilities can engage in—and thus EVSE providers are not subject to regulation as a public utility. Maryland also enacted a law excluding EVSE providers from regulation as utilities. However, the California PUC has made it clear that it can still regulate EVSE service providers in other ways besides classifying them as “utilities” in order to ensure the environmental performance and integrity of the electrical grid.80
In addition to the decision not to classify EVSE providers as utilities, many states are in the process of determining which entities can enter PEV charging markets. Utilities may have inherent advantages in providing charging, including information on prime charging spots, large capitalizations to pay for charging, and guaranteed revenues from other sales. In contrast, private entities can build out networks without relying on public rate bases, and also believe that they can foster more innovation and efficiency in charging.
52
Plug-‐in Electric Vehicle Deployment in the Northeast: A Market Overview and Literature Review September 2012
California has ruled that utilities will not be permitted to own EVSE unless a utility can demonstrate that it will be the only possible provider in a certain area. In contrast, other states may choose to allow utility involvement in providing charging services. For example, Oregon is considering whether to allow utilities to provide charging services if the cost of these services is not included in their electricity rate increase claims. Utilities could also be asked to establish unregulated affiliates, which are subject to the same regulations and competition as other third-‐party providers (C2ES, 2012).
While several EVSE providers have entered the market, they must also partner with public or private entities to provide charging in a particular location. For most home EVSE, the buyer of the EVSE will simply be the consumer. Finding buyers for publicly accessible and commercial charging may be a much greater challenge. Private entities must have some incentive to install publicly accessible chargers, which usually cost about $2,000 per unit with installation fees (AeroVironment, 2011).
Currently, financing of charging networks has generally occurred in three ways: broad public investments, partnerships across corporate stores, or public-‐private partnerships in order to deploy in a specific geographic area. So far, much public charging has been the result of public investment, primarily through stimulus funding from the American Recovery and Reinvestment Act (ARRA), DOE Clean Cities grants, and DOT TIGER grants. For example, Coulomb Technologies is spending $37 million on its ChargePoint network that will be deployed in over 15 cities including Washington, DC, and New York City, of which $15 million is funded by the American Recovery and Reinvestment Act. The Department of Energy provided $8.5 million through its Clean Cities Electric Vehicle Community Readiness Program for cities and states to explore PEV deployment. Within the TCI region, NYSERDA (in collaboration with TCI), the Delaware Valley Regional Planning Commission, and New York City Lower Hudson Valley Clean Communities received DOE grants. TCI’s DOE grant is being used to support a variety of planning activities, including the production of this report. Northwest Oregon received a grant of $2.7 million in TIGER funds for over 20 DC fast-‐charging stations along key corridors (C2ES, 2012).
Public investment can be further divided into public money from governments, such as the investments above, and spending by utilities. Utilities consist of public or private entities that buy and sell electricity to end-‐use consumers, and do not include entities like NRG Energy, which is a wholesale electricity generation company. Utilities may also have a large interest in EVSE build-‐out.
Although public investment in charging may be needed to jumpstart PEV growth, taxpayer dollars and utility ratebases must be managed wisely. In an era of fiscal constraint, public investments are closely scrutinized and negative media coverage can harm the PEV market.81 If viable private models exist, extensive public investment in public charging may be unnecessary. However, short-‐term public investment in charging stations may be particularly warranted in the following situations (C2ES, 2012):
• Public demonstration programs: Local governments will likely drive public demonstration programs. In the early stages of PEV deployment, publicly accessible EVSE can be a low-‐cost way of promoting PEV technology, testing innovative charging technologies and configurations, raising awareness, collecting data, and gaining valuable experience. Local governments could prioritize locations that will offer high visibility and a high chance of use.
• Cities with many multi-‐unit dwellings: Local governments may consider investing in publicly available EVSE to support residents of multi-‐unit dwellings. In cities where the majority of residents live in multi-‐unit dwellings, support for PEVs can be difficult. In these places, local governments may consider public investments in EVSE to accommodate PEV drivers and overcome challenges related to condominium association policies or the actions of rental property owners.
• Destination Charging: Popular destinations such as parks, museums, or stadiums may be suitable locations to install public EVSE, since drivers typically spend long periods of time at these locations. In some cases, this could enable travel by BEVs between cities.

53
Plug-‐in Electric Vehicle Deployment in the Northeast: A Market Overview and Literature Review September 2012
These exceptions assume that a viable private business model for EVSE build-‐out exists, which is uncertain now because many of the larger network developers are funded by federal grants. If no viable private model for providing EVSE exists, then financing EVSE may require public-‐private partnerships or more cooperative models within the private sector (see below).
Another popular mechanism of finance is through corporate chains and fleets. Wal-‐Mart, Walgreens, Ikea, and Best Buy plan to install publicly available charging stations. Walgreens plans to offer EVSE at retail locations across the country, and plans to include one DC fast charger and one Level 2 AC charger at each location. These corporate chain build-‐outs complement efforts from corporations like GE and FedEx. These companies plan to have large electric fleets, which would require large amounts of charging infrastructure within their facilities.
Finally, financing can be provided by partnerships between local firms and EVSE providers in order to deploy an EVSE network in a specific area. Whereas nationwide corporate build-‐outs may emphasize EVSE across a corporate chain and public grants may focus on providing purely public infrastructure, these partnerships can focus on a specific geographic area to attain a network density that may be difficult to build otherwise. EVSE network build-‐out can be coordinated between the municipal government, private entities, and EVSE providers to make sure that key locations in a city or a region contain charging stations.
Summary and Policy Actions Providing charging options to accelerate PEV deployment will be a challenging task and will require the coordination of multiple entities. The converse is also true—coordinated policy could expand charging options and accelerate PEV deployment. Streamlining and simplifying the process of obtaining home EVSE, likely to be the most common charging option, can lower barriers to PEV purchase. Additionally, determining and sharing research on the optimal build-‐out of workplace, or publicly-‐accessible charging in dense cities can ensure PEV drivers have access to charging stations. The firm establishment of standards and regulations for EVSE, from the decision on whether EVSE providers should be regulated as utilities to the creation of standards that ensure all new homes are EVSE-‐ready, can also reduce uncertainty in the EVSE market. Finally, the finance of EVSE can occur in several different ways and may involve both public and private entities. Table 11 gives a summary of the entities involved in coordinating action for charging build-‐out.
Table 11: Summary of Primary Entities, Responsibilities, and Potential Actions for Charger Deployment
Section Primary Entity
Responsibilities Potential Actions
PEV driver Identifies access to charging before PEV purchase
Spearheads permitting and EVSE installation process.
Auto dealer or Automaker
Ensures that customer has access to adequate charging while offering EVSE purchase options
Notifies utility of PEV purchase. Works with local governments and utilities to plan PEV roll-‐out. Conducts PEV ride and drive events.
Utility
Ensures grid reliability, including upgrading grid infrastructure such as transformers wherever necessary; Should be notified of Level 2 charger installation
Works with local electric permitting authority and auto manufacturer to create expedited process.
Local building authority/ electricity permitting authority
Assigns permits for electrical upgrades, including EVSE permits
May create expedited process to quicken installation. Works with utility to approve large increases in electricity demand. Notifies utility while assigning the permit.
a. Permitting, Inspections, Installation Process for Charging
State permitting authority
Creates minimum statewide electric standards and rules, including any electric standards related to EVSE installation
May collaborate and create guidance for local authorities in EVSE permitting.

54
Plug-‐in Electric Vehicle Deployment in the Northeast: A Market Overview and Literature Review September 2012
PEV driver
Selects and purchases EVSE May negotiate with other homeowners for designated parking spot and charger installation in multi-‐family dwellings.
Homeowner’s Association
Must approve of EVSE installation in multi-‐family dwellings
May drive the installation of EVSE in multi-‐family dwellings.
Auto dealer/ Automaker
Ensures that customer has access to adequate charging
May offer full-‐chain EVSE process.
Third-‐party EVSE
Offers diverse options and choices for EVSE installation.
b. Residential Charging Build-out Rules
Local governments/state legislatures
Ensures consistency among current rules and standards, including examining whether the city can accommodate PEVs
May pass laws or ordinances encouraging either local or statewide accommodation of PEVs, including requiring new buildings to come pre-‐equipped for Level 2 AC installation.
PEV driver Identifies access to charging before PEV purchase
Works with workplace or lot owners to determine possible charging solutions.
Workplace parking lot owner
Must represent interests of all owners while deciding whether or not to pursue EVSE charging installation
Participates and drives the installation of EVSE for PEV drivers. Sets up potential rules for use of charging station parking spots.
c. Workplace and Public Charging Build-out
Local/state governments
Passes rules and develops guidance to accommodate PEVs, such as how public chargers and their parking spaces can be used
May finance local build-‐out of EVSE or commission research on optimum EVSE buildout locations.
Public utility commissions
Ensures grid reliability; issues rules and standards for utilities, including whether utilities can own EVSE
State governments/ legislatures
Ensures that state is aware of and can accommodate technologies with statewide impacts such as PEVs
May work with other PEV stakeholders to create guidance and act as a resource for local governments.
State standards/ permitting body
Creates minimum statewide standards and rules for allowing EVSE installation, which are adopted by local authorities.
d. Electrical Standards
Various electrical standards bodies
Establishes standards for technology, safety, use, and more
EVSE providers
Provides and manufactures charging stations Work with grant-‐making authorities to determine public charging solutions.
Corporations Finance public charging stations at stores.
Grant-‐making bodies
Ensures effective investments, including those that balance public and private funding for charging
Finance charging build-‐out and research. Establish public-‐private partnerships for charging deployment.
e. Financing Charging Build-Out
Public utility commissions
Ensures grid reliability; issues rules and standards for utilities, including whether EVSE service providers can be regulated as utilities, and who should pay for service upgrades
Clarifies rules on V2G technologies and rates for electricity buyback. Recommends time-‐variant pricing.

55
Plug-‐in Electric Vehicle Deployment in the Northeast: A Market Overview and Literature Review September 2012
As seen in Table 11, many entities are involved in the deployment of charging infrastructure. As such, the establishment of a single “one-‐stop shop” that knows the EVSE installation process from every angle may be extremely useful (Plug-‐in America, 2011). The primary entity driving these efforts could be a non-‐profit PEV deployment initiative with buy-‐in from various PEV stakeholders or an initiative within the local government. This entity could explain local building codes, the location of publicly-‐accessible chargers, the permitting process, electrician listings, charging solutions for multi-‐family dwellings, and more to potential PEV drivers.
Feedback and communication among utilities, city government, and consumers may help streamline the inspection and permitting process, as seen in the coordinated efforts of Project Get Ready participants including New York City, Raleigh, and the state of Rhode Island. Con Edison, New York City, and other PEV stakeholders each have designated PEV web pages that link to partnership pages. Con Edison, New York City, and McKinsey and Co. created an in-‐depth study of electric vehicle deployment in the city. Relevant entities may work together to shorten or simplify a process such as a lengthy city permitting process.
Education and communication are especially important for multi-‐family dwellings, where the cost and process of EVSE installation will vary. Outreach to homeowners’ associations by PEV roll-‐out initiatives can help. For example, the San Francisco Department of the Environment, Coulomb’s ChargePoint initiative, and several other entities conducted a workshop on chargers in multi-‐family dwellings.82
One mechanism for creating diverse public-‐private partnerships for PEV deployment is through the DOE Clean Cities Coalitions (CCCs). Led by Clean Cities Coordinators, the mission of these grassroots groups is to reduce petroleum use in their local community. Several Clean Cities Coalitions have completed PEV feasibility reports and are engaging with utilities, auto-‐dealers, and municipalities to create cohesive local deployment initiatives. For example, the Greater Washington Region CCC is working with Metropolitan Washington Council of Governments, as well as PEPCO, Dominion Power, ECOtality, the Electric Drive Transportation Association, to develop a PEV plan for greater Washington, DC (Greater Washington Region Clean Cities Coalition, 2011).
State agencies and public policymakers can also play an active role at a higher level in helping to accelerate the deployment of PEVs. Legislation or statewide guidance can streamline the process so that all PEV drivers across a state have similar experiences in purchasing, driving, and charging a PEV. For example, California has passed several pieces of legislation on PEVs, from streamlined parking ordinances to the status of EVSE service providers. As another example, Executive Order 08-‐24 in Oregon was signed in 2008 to establish one set of design, installation, permitting, and inspection standards across the state. Within agencies, long-‐range transportation plans, which states and metropolitan planning organizations are required to write in order to receive federal transportation funding, can incorporate provisions for PEV deployment. State implementation plans (SIPs), which are required by the Clean Air Act for ozone nonattainment areas, can also incorporate PEVs as part of a plan to reduce ozone nonattainment.
The role of utilities in charging also needs to be better understood. (Maryland EV Infrastructure Council, 2012). Innovation and efficiency without using public dollars or ratebases are desirable, but building out an extensive EVSE network may require public dollars (C2ES, 2012); results from different state regulations regarding utility involvement in charging will give a better idea of ways to balance the two. Clear lines of communication and authority can be established between EVSE providers and utilities. Balancing experimentation with different business models with the regulation of EVSE providers will help with EVSE build-‐out while ensuring electrical grid reliability.
In the future, these problems could be avoided by mandating that new multi-‐family dwellings or new households are pre-‐wired to accommodate EVSE. Policies at the city level can mandate that all new residential construction come pre-‐wired for Level 2 charging. Statewide legislation can streamline these standards even further, so that customers can continue to charge if they move to a new in-‐state location.
Finally, the process and finance of building publicly-‐accessible EVSE must be tackled. Local governments can first team up with researchers to identify the most promising areas for EVSE. The Columbia Earth Institute, for example, used geographic information system mapping to locate key public and private garages in New York City in locations with high PEV potential. Partnerships can be formed between researchers in government or academia with charging providers and PEV deployment initiatives within the city government.

56
Plug-‐in Electric Vehicle Deployment in the Northeast: A Market Overview and Literature Review September 2012
Impacts on the Grid and Transportation Funds
Grid Impacts PEVs are unlikely to have large effects on the regional-‐level grid. The Northeast Power Coordination Council (New York and the six New England States) estimates that if the current light-‐duty vehicle fleet were to run on electricity, 80 percent of its energy requirements could be met by the regional electrical grid. In contrast, only 23 percent of the energy requirements of the current light-‐duty vehicle fleet in the California and Southern Nevada region could be met by the regional grid, but this estimate is still much greater than estimated PEV composition of national or regional fleets for the next decade (Hadley & Tsevotka, 2008).
Figure 22: Power Requirements and Potential Impact of Electric Vehicles (MIT, 2011)
High PEV penetration does have the potential to put significant new burdens on a local distribution system that is facing high loads. Although Level 1 AC charging would increase the burden by only 1.5 kW, Level 2 AC charging can reach 19.2 kW. Most PEV on-‐board chargers will not contain charging circuitry that supports anything above 6.6 kW in the near future. To provide some context, the average home uses about 4.5 kW during peak hours (see Figure 22: Power Requirements and Potential Impact of Electric Vehicles (MIT, 2011)), but less than 1.3 kW on average83.

57
Plug-‐in Electric Vehicle Deployment in the Northeast: A Market Overview and Literature Review September 2012
Any impacts will primarily affect “step-‐down” transformers (EPRI, 2011). A typical transformer serves about twenty houses (NREL, 2011) so PEV adoption by a single household immediately affects the other houses sharing the transformer. A series of studies by the University of Vermont found that PEVs could accelerate transformer aging by adding this additional load. As a result of adding two PHEVs to a local Vermont circuit, the study found that transformers aged the equivalent of an additional 0.136 years each year. A typical transformer lifetime is about 17 years (Farmer, Hines, Dowds, & Blumsack, 2010).
As mentioned previously, utilities have incorporated air conditioning and home washer/dryers—loads that are close to 3.3 kW—without major issues, so utilities should be able to adapt to the new loads from electric cars as well. In fact, PEVs could increase the rate base and revenues, and thus benefit utilities and potentially even lower electricity rates if more off-‐peak electricity is consumed. Still, benefits to utilities depend on their ability to adapt to high PEV penetration.
The biggest risk may be from an influx of PEVs in a small area, especially if too many PEVs charge from the same transformer at the same time. Fleets may be less of a problem to the grid than the aggregation of individual PEVs because fleet EVSE build-‐out often involves negotiation between the PEV fleet operator and the utility for distribution system upgrades, which is necessary because of the large increase in demand in a concentrated area. The utility may then decide to build a high-‐capacity transformer specifically for the fleet. On the other hand, without utility notification, added load from PEVs may be difficult to differentiate from other household electricity loads.
While it may be difficult and even undesirable to stop geographic clustering of PEVs, the temporal clustering of EVSE can be ameliorated through managed charging. A study conducted by the University of California-‐Berkeley found that unmanaged charging—or charging that would occur during peak hours as consumers get home from work—would increase peak electricity demand by over 5 percent with a moderate PEV market penetration level of ten percent. This higher peak demand would last 3.5 hours if consumers have access to only residential charging infrastructure, and two hours if consumers have access to both residential and non-‐residential charging infrastructure (DeForest, et al., 2009).
EPRI and Con Edison carried out an extensive study on behalf of NYSERDA to examine the effects of PEVs on New York State. They examined two New York City area circuits—the Don Bosco circuit, an “average” urban circuit expected to have relatively high vehicle penetration, and the “worst case” Yorkville circuit, Con Edison’s largest and most heavily loaded circuit. Taking the Don Bosco circuit as representative of most circuits in the Northeast, EPRI concluded that a ten percent PEV annual market penetration by 2015 would have minimal effects on most circuits. Moreover, future PEV growth would be tempered by gradual utility upgrades and learning. In the heavily overloaded Yorkville circuit, however, network transformer overload occurred to a significant degree, but managed charging drastically reduced load. At 90 percent of the peak demand, the circuit could accommodate 9,350 vehicles, but at 100 percent of the peak, the circuit could only accommodate 2,800 vehicles. Without any managed charging, the number of vehicles the grid could accommodate dropped by more than 70 percent (EPRI, 2011). Thus moving charging off-‐peak would accommodate many more vehicles.
Encouraging charging during off-‐peak periods greatly expands the carrying capacity for electric vehicles. According to FERC, states in the TCI region have some of the highest general peak reduction potentials if time-‐variant rate structures or other incentives to reduce peak demand consumption are implemented. As seen in Figure 23, the Northeast Power Coordinating Council (NPCC) (New England and New York) and ReliabilityFirst Corporation RFC (Mid-‐Atlantic and Midwestern states) have potential peak demand reductions more than quadruple current peak reductions from demand response.oo
Many utilities are beginning to experiment with creating regulations and building the infrastructure necessary to make time-‐variant structures viable, but several regulatory barriers exist. FERC cites the disconnect between retail pricing and wholesale markets, incentives for utilities to increase demand as much as possible, low-‐cost revenue recovery potentials for acquiring necessary metering and data management technologies, and technical barriers to integrating “smart grid” technology with incompatible infrastructure (FERC 2008).
oo NPCC and RFC are two of eight regional entities that work with North America Electric Reliability Corporation (NERC) to improve the reliability of the bulk power system. The members of the regional entities come from all segments of the electric industry, and account for virtually all the electricity supplied in the United States.

58
Plug-‐in Electric Vehicle Deployment in the Northeast: A Market Overview and Literature Review September 2012
Figure 23: Demand Response Potential Versus Actual Deployed Demand Response Resources by Region
Impacts on Transportation Funds Reliance on motor fuel taxes varies significantly by state in the Northeast, and also varies significantly over time. For example, in 2009 New Hampshire relied on the motor fuel tax for 60 percent of its transportation funds while New Jersey only got 16 percent of its funds from motor fuel taxes that year, and in 2010, the percent of funds received from motor fuel taxes in New Jersey doubled.84 Five of the 12 TCI jurisdictions rely on motor fuel taxes more than the national average. Tolling, appropriations from general funds, property taxes, bonds, and other methods make up the remaining funding sources.85
The federal fuels tax on gasoline is currently 18.4 cents per gallon. As of July 2012, Mid-‐Atlantic state taxes average 32.0cents per gallon while Northeast taxes average 29.6 cents per gallon, leading to average total taxes of 50.4 and 48.0 cents per gallon, respectively. In July, New York and Connecticut had the second and fourth highest combined state and federal gasoline taxes in the nation—at 67.7 and 63.4 cents per gallon, respectively. New Jersey and New Hampshire had the lowest combined state and federal gasoline taxes in the TCI region at 32.9 and 38cents, respectively.86

59
Plug-‐in Electric Vehicle Deployment in the Northeast: A Market Overview and Literature Review September 2012
Figure 24: Combined Federal and State Gasoline Taxes, as of July 201287
Because Congress has failed to raise the gasoline tax to keep up with inflation, and fuel efficiency has increased, gasoline tax revenue has been insufficient to adequately maintain roads for some time (Pew Center on Global Climate Change, 2011). The nominal value of the federal fuel tax has remained constant since 1993. With inflation, the federal fuels tax has lost nearly half of its value (C2ES, 2011). Moreover, the decoupling of the growth in fuel use and vehicle miles traveled began in the late 1970s and has accelerated in recent years due primarily to improved vehicle fuel efficiency (Greene, 2011). Whereas the federal motor fuels tax was enough to sustain the Federal Highways Trust Fund for most of its existence, it required $8 billion, $7 billion, and $19.5 billion transfer from the general revenue fund in 2008, 2009, and 2010, respectively (Pew Center for Global Climate Change, 2011). In the future, shortfalls within the highways fund may translate into maintenance problems in states. Pennsylvania had 4,338 structurally deficient National Highway System bridges in 2010—the third most in the country—and funding is a significant barrier in bringing these bridges to a state of good repair.88
The threat of further losses in funding due to gasoline and diesel use displacement by alternative vehicles like PEVs looms large for transportation agencies. Notably, a general reform of transportation funding is needed, rather than one that specifically targets PEVs or alternative-‐fueled vehicles (AFVs). Although the loss in funding from PEVs in the short term is likely to be negligible,89 considering that vehicle penetration is likely to remain below five percent for at least a decade, some states with substantial PEV adoption could see an impact sooner (see Section 3). To make up for the revenue shortfall, states have proposed methods such as road user fees. These fees affect all vehicles, but also allow recouping funds from PEV drivers by assessing a tax on PEV owners based on miles driven per year or a fixed charge. Less funding loss comes from PHEVs, which can also run on motor fuel and pay the motor fuel tax accordingly.pp As of September 2011, Pennsylvania was the only state with a tax on electricity used to power vehicles. PEV drivers self-‐report by filling out taxes and remitting payment at the end of the year at the rate of 0.0093 dollars per kWh.90
pp However, some PHEVs can use battery-‐electric and ICE power simultaneously, reducing the dollars per mile the vehicle owner is contributing to the transportation system.

60
Plug-‐in Electric Vehicle Deployment in the Northeast: A Market Overview and Literature Review September 2012
PEV advocates have resisted these measures because they feel that additional fees may add another barrier to PEV adoption. In addition, privacy advocates resist methods that require mileage-‐measuring devices to be installed in vehicles. There are ways to track mileage, however, such as annual mileage readings, without using personally identifiable information like vehicle location. Opponents of these fees also argue that the existing method of basing the tax on energy use is still acceptable so long as the tax is raised over time to reflect improved fleet efficiency and inflation. However, raising the gas tax has repeatedly failed to gain widespread political support for two decades.
Summary and Possible Solutions Although PEVs are forecasted to have minimal impact in the short term, widespread PEV deployment in the future may have impacts on both the electrical grid and state transportation funding. Table 12 summarizes issues and provides potential solutions to these impacts.
Table 12: Summary of Potential Impacts and Solutions
Impact Summary Description Potential solutions
Utility notification: Notification of a PEV purchase allows utility monitoring of PEV charging. Managed charging: Managed charging through time-‐variant rates encourages off-‐peak charging Burden on local
electric grids
High penetration of PEVs may affect neighborhood-‐level electric distribution networks, although regional grids should be able to handle PEV growth. Smart-‐grid integration: PEVs could become fully
integrated with the electric grid through V2G-‐related technologies. Toll roads and bridges: PEVs are not exempt from tolls and bridges. Self-‐reported fuel tax forms: PEV drivers could fill out tax forms in which they pay taxes based on electricity use. Pennsylvania has such a form for all alternative fuel vehicles. Utility taxation: PEV charging could be metered separately and taxed accordingly, although this may be unlikely in the short-‐term.
State transportation tax
High penetrations of PEVs may affect state transportation funds, although states must explore new means of obtaining infrastructure funds regardless of PEV penetration.
Road user fee: Monitors on vehicles could measure vehicle miles. Oregon has carried out an extensive vehicle miles traveled (VMT) pilot project. More recent VMT pilot projects have occurred in Nevada and Minnesota.91
Electricity problems will primarily relate to local delivery within a neighborhood as opposed to regional power generation and transmission. To prevent local neighborhood transmission problems, customers could be encouraged to notify their utility of a Level 2 EVSE installation. The EVSE installation process as set forth by Project Get Ready typically contains three points at which utilities can be notified—PEV purchase, initial assessment by the electrical contractor, and the final inspection by an electrician. If at least one of these notification points were mandatory, the utility could monitor and learn from changes in local electricity demand due to PEVs.
The electric utility can coordinate with local PEV stakeholders to examine areas that have high potential PEV demand but that also need upgrades to transformers and wiring. The utility may also need to increase local monitoring for a short time. Watching an “at-‐risk” area with both stressed distribution networks and high PEV penetrations may be prudent during a PEV growth phase.
One of the strongest preventative measures for minimizing risk to the electrical grid is to introduce time-‐variant rates, which also have the potential to decrease the total cost of ownership of EVs. Although most utilities do not yet have time-‐variant rates, many are beginning to explore and introduce demand management and time-‐variant rates, catalyzed in part by the aging grid as well as the Federal Energy Regulatory Commission’s National Action Plan on Demand Response (FERC, 2010). By introducing lower electricity rates and encouraging consumers to charge off-‐peak, additional electricity demand from PEVs does not have to occur during peak hours.

61
Plug-‐in Electric Vehicle Deployment in the Northeast: A Market Overview and Literature Review September 2012
Currently, many different time-‐variant structures exist and little is known about the effect of these structures in encouraging consumers to charge during off-‐peak periods. Utilities may charge special PEV rates with particularly high peak rates and low off-‐peak rates. Some utilities in California give three time-‐of-‐use (TOU) options92: a standard house TOU rate, a TOU rate for a whole-‐house equipped with solar, and a second meter for a special PEV TOU rate, which comes with the additional cost of installing a meter. Customers who purchase an ECOtality installation also get an ECOtality TOU rate, which is not available otherwise. As PEV penetration grows, utilities could share information and best practices on the most effective TOU rates. A table of different rates as well as a table demonstrating different management techniques can be found at the end of this section. Given that many utilities are just beginning to experiment with demand management, different regions may implement combinations of the demand management options presented in the table.
As noted above, several barriers hinder the widespread implementation of time-‐variant rates. Barriers such as the installation of smart meters,qq inadequate information tracking systems, aging or incompatible infrastructure, and the coupling of utility revenues with electricity use all contribute to some degree (FERC, 2010). However, these barriers can be overcome. Vermont, for example, is implementing two-‐way communications across many meters, advanced sensors, and an integrated real-‐time communications and data collection network. The state is partnering with IBM to build over 1000 miles of fiber optic cables dedicated to real-‐time communication within the grid.93
Early “smart grid” investments set up the infrastructure for V2G technologies, which may be present in future generations of electric vehicles. V2G is a two-‐way communications system between the vehicle and the grid. V2G allows for the sale of excess power from the car’s battery in times of high demand for electricity; V2G technologies charge the car in times of excess electricity supply. Since vehicles are parked an average of 95 percent of the time, V2G technologies hold great potential to maintain grid reliability and offer financial benefits to both utilities and consumers. The value for utilities could be up to $4,000 per year per car.94
While V2G technology exists on a demonstration basis, it has yet to be integrated with the electric grid at a large scale and may be several years away from widespread commercial availability. Research and development of V2G by utilities may accelerate adoption of V2G technologies. Delaware recently passed legislation that allows for V2G in an attempt to foster its further development, and the University of Delaware is leading research in this area. U.S. entities conducting V2G research or demonstration projects include Pacific Gas & Electric Co., Xcel Energy, and DOE’s National Renewable Energy Laboratory (NREL).
Finally, both states and the federal government may have to examine ways in which transportation funding sources can become sustainable. Early implementation of taxes could be on a self-‐reporting basis, such as that found in Pennsylvania, although high taxes may dissuade potential PEV buyers. In the short-‐term, even if the absence of an AFV or PEV tax creates a negligible impact on state revenues, public perceptions of tax inequity may reduce support for PEVs. Eventually, regardless of the presence of PEVs, legislators at both the state and federal level will need to devise a new mechanism for continuing to fund state and federal transportation infrastructure.
qq Smart meters are electrical meters that record consumption of energy and communicates that information on a regular basis back to the utility.

62
Plug-‐in Electric Vehicle Deployment in the Northeast: A Market Overview and Literature Review September 2012
Table 13: Time-‐Variant Structures
Types of Time-‐Variant Structures
Description Advantages Disadvantages
Same rates PEVs are charged at the same electricity price as electricity for the entire house
Avoids establishing any rate structure precedent that customers come to expect, especially if the rate structure has unknown and potentially damaging effects Does not require installation of second meter
Does not encourage PEV use in off-‐peak periods as much as high-‐differential rates
Whole-‐house TOU
PEV high differential rates
PEVs and the entire house get charged a whole-‐house PEV-‐only rate for PEV adopters—usually a high differential price with especially high peak and low off-‐peak rates
Simple and cheap for utility and customer to operate if impacts on the electrical grid will be negligible Does not require installation of second meter
Widespread adoption creates a new peak at lower rate Peak charging that may be desirable at peak times such as cooking stoves and ovens becomes significantly expensive
Fixed fee/fixed fee off-‐peak
PEV owners pay a flat fee per month to get access to unlimited charging. One potential hybrid model is to charge a flat fee only for off-‐peak charging.
Simple to use Does not necessarily require an additional meter
Does not encourage PEV use in off-‐peak periods
Two-‐meter house with high-‐differential pricing
Off-‐peak rates are especially low while peak rates are especially high
Encourages off-‐peak charging and helps grid stability
Must install a second meter, which may be expensive for the utility or the customer
Sub-‐metering off PEV charging circuit with high-‐differential pricing
Same as a two-‐meter house except the PEV charging circuit is sub-‐metered and simply subtracted from main meter use
Appropriate for multi-‐family dwellings; cheaper for utilities; allows for differential pricing
Master meters are owned and maintained by utility but sub-‐meters are owned and operated by user—less incentive to install sub-‐meter from leased buildings
Demand response (can be combined with options above)
Utility enters contract with user to control power flow to vehicle; during high demand period, power is diverted
Especially useful for local grids that may be near 100 percent capacity
Can inconvenience PEV drivers if battery is not charged when needed
Source: EEI, 2011

63
Plug-‐in Electric Vehicle Deployment in the Northeast: A Market Overview and Literature Review September 2012
6. Potential Next Steps PEV deployment requires action from several different entities and across many different categories. C2ES’ PEV Action Plan (C2ES, 2012) contains a table of recommendations that preceding sections of this literature review have addressed. These recommendations cut across vehicle appeal challenges, EVSE build-‐out issues, and potential adverse impacts. Table 14: Potential Stakeholder Actions from the PEV Dialogue Group’s PEV Action Plan (C2ES, 2012)
Objective Category
Objective Expected Leaders
Action
Address high upfront cost Electric Utilities, Other Businesses, NGOs
Provide consumer web tools that educate consumers on the value proposition of PEVs including the total cost of ownership (TCO) compared to other vehicles
Consum
er
Education
Bridge technology information gap
Electric Utilities, Other Businesses, Government
Increase PEV publicity and customer knowledge of PEV technology through online tools, increased publicity, and enhanced stakeholder collaboration
Harmonize regulatory action Electric Utilities, Other Businesses, Government, NGOs
Regu
latory
Environm
ent
Define and clarify rules and regulations for use of and payment for infrastructure
Electric Utilities, Other Businesses, Government, NGOs
Create a consistent regulatory framework nationwide that protects the reliability of the grid, minimizes cost to the electricity distribution system, supports transportation electrification, and provide consistent treatment between PEVs and loads with comparable power requirements within each rate class. Assess a broad set of existing models to use and pay for infrastructure, share knowledge, and identify best practices.
PEV Roll-‐
out
Define vehicle and fuel purchase process
Electric Utilities, Other Businesses, Government, NGOs
Work with all relevant public and private players to facilitate the introduction of PEVs in a geographic area
Accelerate sustainable private sector investment in charging infrastructure
Businesses, NGOs
Public and
Private
Investmen
ts
Balance efficiency and equity Government, Electric Utilities, NGOs
Assess PEV suitability; estimate charging equipment &infrastructure needs; estimate the extent of public investment in EVSE needed
The up-‐front costs of vehicles and uncertainty about the capabilities of PEV technology significantly dampen vehicle appeal. Up-‐front costs can be gradually driven down through the scale-‐up of PEVs, which depends on consumer acceptance. Consumers must be educated about the total value proposition of PEVs, including the fuel cost savings over the life time of the vehicle, environmental and energy security benefits, and more. Indeed, many studies have shown that the PEV total value proposition extends far beyond cost. Addressing range anxiety and misinformation about PEV capabilities can also encourage consumers to consider PEVs. Finally, continuing both financial and non-‐financial incentives from governments, manufacturers, and other entities will increase the worth of PEVs.
Charging build-‐out poses another significant challenge. The process of acquiring home EVSE can be daunting for consumers. Working to educate consumers and expedite the permitting process may lower PEV purchase barriers. Moreover, many high-‐PEV-‐potential areas in the Northeast like New York City are dominated by multi-‐family dwellings, increasing the difficulty of acquiring EVSE. Streamlining and simplifying EVSE installation while encouraging innovation and consumer choice can help encourage PEV growth. Regulatory action, especially designating EVSE providers as a “service” rather than a “utility,” can also encourage the development of private markets.

64
Plug-‐in Electric Vehicle Deployment in the Northeast: A Market Overview and Literature Review September 2012
Without home EVSE, workplace or publicly accessible charging may be crucial. Determining the most needed places to site EVSE is a first step towards maximizing efficiency. Determining ways in which public and private entities could work together to build out and finance charging infrastructure could also help increase the probability of PEV purchase while reducing range anxiety.
Utilities and state transportation agencies can prepare themselves to absorb PEVs into the existing electricity and transportation systems. Although adverse impacts will be negligible in the short run, partnerships and coordination between utilities and other PEV stakeholders will allow identification of locations where PEV potential is highest to prepare for any future impacts. Time variant charging and eventually V2G technologies can be encouraged through flexible rate structures. Additionally, state governments can explore ways to ensure that PEV driving does not adversely affect transportation funds.
As electric vehicles are integrated into the auto market, coordinated action is needed to surmount various challenges. Over the coming years, stakeholders within TCI could help PEVs achieve widespread acceptance. Stakeholders can share knowledge and devise policy solutions to provide adequate charging solutions; share best practices on regulatory rulings; educate and bring more awareness of PEVs to consumers; and examine and prepare for the ways in which PEVs may impact both the electric grid and state transportation funds.
The Northeast Electric Vehicle Network is reaching out to various PEV stakeholders, collaborating with the private sector, utilities, and local governments to reduce barriers to PEV deployment in the TCI region. The network is also serving as a resource for best practices and a forum for stakeholders to share ideas on how to promote PEVs.

65
Plug-‐in Electric Vehicle Deployment in the Northeast: A Market Overview and Literature Review September 2012
Appendix A: PEV Deployment Partnerships
Research, Advocacy, and National Policy Groups: • Electric Power Research Institute (EPRI): EPRI conducts research and development relating to the generation,
delivery, and use of electricity for the benefit of the public. EPRI has conducted several technical studies on electric vehicles at the national and state levels, including market forecasts, utility impacts, PEV feasibility, and more.
• Electric Drive Transportation Association (EDTA) and GoElectricDrive.com: EDTA is a U.S. industry association dedicated to the promotion of electric drive vehicles. It conducts conferences, advocacy, public education, and the sharing of best practices among PEV stakeholders. It also hosts the website for GoElectricDrive, a coalition comprised of automakers, utilities, battery and component manufacturers, associations, and government entities dedicated to promoting the electric drive industry. GoElectricDrive’s website is also a hub for information on PEVs covering a wide range of topics for consumers.
• Edison Electric Institute (EEI): EEI is the association of U.S. Shareholder-‐Owned Electric Companies.95 EEI has committed to move forward aggressively to create the infrastructure necessary to support full-‐scale PEV commercialization and PEV deployment.
• Electrification Coalition: The Coalition is a nonpartisan business-‐led group that promotes policies and actions that will accelerate PEV adoption. The Electrification Coalition published the Electrification Roadmap, which outlines a national path towards transportation electrification.
• The U.S. Department of Energy’s Vehicle Technologies Program Alternative Fuels and Advanced Vehicle Data Center and FuelEconomy.gov websites: Sponsored by DOE’s Clean Cities program and produced by the National Renewable Energy Laboratory and Oak Ridge National Laboratory, these websites are comprehensive online resources for transportation-‐related information and tools including PEVs. The sites help consumers and fleets learn about petroleum-‐reduction technologies.
Facilitators of deployment initiatives in the TCI region: • Northeast Electric Vehicle Network (Transportation Climate Initiative): The Northeast Electric Vehicle Network was
launched in October 2011 and is supported in part by a one-‐million-‐dollar Department of Energy grant to the New York State Energy Research and Development Authority and TCI. The network is a collaborative effort between the Departments of Transportation, Energy, and the Environment in Connecticut, Delaware, District of Columbia, Maryland, Massachusetts, New Hampshire, New Jersey, New York, Pennsylvania, Rhode Island, and Vermont, and involves additional public and private partners. The Network aims to accelerate PEV deployment in the Northeast and Mid-‐Atlantic, and is facilitated by the Georgetown Climate Center.
• The U.S. Department of Energy’s Clean Cities Coalitions: The Clean Cities program includes over 80 Coalitions from across the country. Led by Clean Cities Coordinators, the mission of these grassroots groups is to reduce petroleum use in their local communities. Many Clean Cities Coalitions have completed PEV feasibility studies and are engaging with utilities, local auto-‐dealers, and municipalities to create a cohesive local deployment initiative. The Clean Cities program also hosts the National Clean Fleets Partnership, which includes 14 corporations that have electrified their fleets. The initiative provides fleets with resources, expertise, and support to incorporate fuel-‐saving and alternative fuels.
• Regional Electric Vehicle Initiative (REVI): REVI is a coalition of electric utilities in the Northeast U.S. seeking to share information and best practices regarding a regional approach to PEV deployment. Utilities include Northeast Utilities, NSTAR, United Illuminating Company, Connecticut Municipal Electric Energy Cooperative, and Massachusetts Municipal Wholesale Electric Company. REVI works closely with EDTA, EPRI, and EEI.
• Project Get Ready (PGR): Project Get Ready is a nationwide PEV readiness initiative that shares best practices and promotes PEV education with local PGR charters. They have written numerous readiness guides for local governments, including several in the TCI region. PGR acts as a facilitator for PEV deployment, working one-‐on-‐one with municipalities and serving as a central resource for PEV deployment in the area.

66
Plug-‐in Electric Vehicle Deployment in the Northeast: A Market Overview and Literature Review September 2012
Appendix B: Existing Government Incentives in TCI Jurisdictions
Incentives Laws, regulations, and planning
CT Connecticut Clean Fuel Program: provides funding to municipalities and public agencies with alternative fuel vehicles.
Parking incentive: New Haven offers free parking for HEVs and AFVs on all city streets
EV Infrastructure Council: In 2009 the council was mandated to coordinate interagency strategies to prepare for EV adoption
Alternative fuel vehicle acquisition requirements: 100 percent of new state vehicles must be HEV, PEVs, or capable of using alternative fuel unless the purchase compromises public needs.
School bus emissions reduction: Full-‐size school buses must have specific emissions control systems, which alternative fuel vehicles including PEVs contain.
DE V2G energy credit: Customers with one grid-‐integrated PEV will be credited for energy discharged to the grid from the EV’s battery at same rate customer pays to charge the battery.
Alternative Fuel Tax Exemption: Taxes imposed on AFVs used in official vehicles for the U.S. government or any Delaware state governmental agency are waived.
State agency energy plan: All state agencies must have reduced petroleum consumption by 25 percent and VMT by 15 percent from 2008 levels by the end of 2012
Alternative fuel vehicle acquisition: All new light-‐duty purchases must be HEVs, AFVs, or low-‐emission vehicles unless the purchase compromises public needs.
DC PEV incentives: Vehicles with USEPA-‐estimated fuel economy of at least 40 miles per gallon are exempt from the excise tax.
EVSE incentives: ECOtality offers free home EVSE and covers most of the installation cost in the DC metropolitan area. Coulomb also offers free EVSE for those interested in installing publicly accessible EVSE.
Driving restriction exemption: Clean fuel vehicles that are members of fleets with at least ten vehicles are exempt from time-‐of-‐day and day-‐of-‐week restrictions in ozone nonattainment areas.
Reduced registration fees: A new motor vehicle with a U.S. EPA estimated average city fuel economy of at least 40 miles per gallon is eligible for a reduced vehicle registration fee of $36.
Alternative fuel vehicle acquisition: Fleets that operate at least ten vehicles in an ozone nonattainment area must ensure that 70 percent of newly purchased light-‐duty and 50 percent of non-‐light-‐duty vehicles are clean fuel vehicles. The draft DC Climate Action Plan also aims to convert 65 percent of the city’s utility vehicles to PEVs by the end of 2012.
ME Insurance credit or refund: An insurer may credit or refund any portion of the premium charged for an insurance policy on EVs.
Transportation Efficiency Fund: The non-‐lapsing fund is managed by the Maine Department of Transportation to increase energy efficiency and reduce reliance on fossil fuels within the state's transportation system. Funding may be used for zero emission vehicles and other alternative fuel vehicles.
Smart grid: Maine has adopted a policy to promote the development, implementation, availablility, and use of smart grid technology, which includes the goal of integrating advanced electric storage and peak-‐reduction technologies, such as PEVs, into the electric system.
Alternative energy for transportation: By December 1, 2012, the Maine Office of Energy Independence and Security (Office) must develop a plan with the overall goal of reducing petroleum consumption in the state by at least 30 percent and 50 percent, based on 2007 levels, by 2030 and 2050, and must prioritize using alternative energy sources for transportation.

67
Plug-‐in Electric Vehicle Deployment in the Northeast: A Market Overview and Literature Review September 2012
MD PEV incentives: Qualified PEVs received up to $2,000 against the imposed excise tax, limited to one vehicle per individual and ten per business entity.
EVSE incentives: Qualified EVSE receives an income tax credit equal to 20 percent of its cost, limited to one EVSE per individual and 30 per business. Additionally ECOtality and ChargePoint incentives apply to the greater DC metropolitan area (see DC).
HOV lane exemption: PEVs may operate in Maryland HOV lanes regardless of number of occupants.
Testing exemption: Qualified HEVs are exempt from mandatory emissions and inspection requirements.
Maryland Electric Vehicle Infrastructure Council: The Council, with staff support from MDOT, was tasked with developing an action plan, coordinating statewide standards, developing policies that target fleet purchases, and submitting a final report to the governor. An interim report was delivered to the Governor on January 1, 2012.
EVSE Regulation: Maryland passed a law excluding EVSE providers from regulation as utilities.
Utility Notification: Maryland passed a law allowing the Motor Vehicle Administration to share PEV purchase information with utilities to ensure grid reliability.
Encouragement of off-peak charging: The Maryland Public Service Commission must establish a pilot program with at least two electric companies for PEVs to be charged during off-‐peak hours by June 30, 2013.
MA EVSE incentives: The Department of Energy Resources gives funding to local governments to fund installation of publicly available EVSE. As of May 2011, funding is not yet available.
Alternative fuel vehicle acquisition: The Commonwealth of Massachusetts must purchase HEVs or AFVs at the rate of five percent annually for all new motor vehicle purchases so that at least 50 percent of state vehicles will be HEVs or AFVs by 2018. Vehicles must also purchase the most economical, fuel-‐efficient and low-‐emission vehicles appropriate.
NH EVSE and PEV incentives: The NH Department of Environmental Services and the Granite State Clean Cities Coalition provided competitive cost reimbursement to EVSE and PEV projects in ozone nonattainment areas on an application basis. The program ended on September 30, 2011.
Alternative fuel vehicle acquisition: All new vehicle purchases by state agencies and departments must have a fuel economy of at least 27.5 mpg for passenger vehicles and 20 mpg for light-‐duty trucks.
NJ HOV exemption: Qualified HEVs and PEVs can travel in HOV lanes between Interchange 11 and 14 of the New Jersey Turnpike.
PEV incentives: All zero emissions vehicles, including PEVs, are exempt from state sales and use tax.
EVSE Incentives: Coulomb Technologies offers free EVSE not including installation costs to potential “high use” areas within the NYC metropolitan area, if it is publicly accessible.
Alternative fuel bus acquisition: All buses purchased by the New Jersey Transit Corporation must be equipped with improved pollution controls, which AFVs including PEVs contain.
NY NYSERDA Programs: NYSERDA and NYCDOT fund the NYC fleet alternative fuel program, which provides 50 percent of the incremental cost of new fleet light-‐duty PEVs and natural gas vehicles, and 80 percent of the incremental cost for new or converted medium-‐ and heavy-‐duty PEVs, natural gas vehicles, or HEVs in NYC. All school buses in the state of New York are reimbursed for 100 percent of incremental cost of new alternative fuel school buses. NYSERDA’s New York State Clean Cities Sharing Network provides technical assistance and relevant information regarding PEVs to any entity, including businesses, fleet managers, and local governments. NYSERDA also has a research arm.
Alternative fuel fleet acquisition: All new light-‐duty vehicles that state agencies and other affected entities procure must be AFVs or HEVs, with the exception of specialty, police, or emergency vehicles.

68
Plug-‐in Electric Vehicle Deployment in the Northeast: A Market Overview and Literature Review September 2012
PEV incentives: Long Island Power Authority offers a $500 mail-‐in rebate for qualifying PEV and HEV purchases.
EVSE incentive: Coulomb Technologies offers free EVSE not including installation costs to potential “high use” areas within the NYC metropolitan area, if the EVSE is made publicly accessible. Additionally, NYSERDA and NYCDOT may provide up to 50 percent of EVSE purchase and installation costs for fleets.
HOV exemption: Eligible PEVs and HEVs may use Long Island Expressway HOV lanes.
PA Alternative Fuels Incentive Grant (AFIG) Program: AFIG provides financial assistance and information on alternative fuels infrastructure and alternative fuel vehicles (AFVs). In support of AFVs and related infrastructure, AFIG provides approximately $4 to $5 million annually as part of a competitive solicitation.
PEV incentives: AFIG also offers rebates to residential consumers for the purchase of new qualifying AFVs. PEVs can qualify for rebates of up to $3,500.
Alternative fuels tax: Alternative fuels for vehicles used on public highways are taxed at a rate determined on Gasoline Gallon-‐equivalent basis.
RI PEV incentives: The town of Warren allows for a tax exemption of $100 for PEVs among other vehicles.
Alternative fuel vehicle acquisition: At least 75 percent of all new state motor vehicles must be AFVs while remaining 25 percent must be HEVs without compromising public safety.
VT State Agency Energy Plan Transportation Requirements: The Energy Plan is modified each year and incorporates the suggestions of the Climate Neutral Working Group.
PEV incentives: Vermont provides some tax credits for AFV manufacturers or AFV-‐related businesses.
Alternative fuel vehicle acquisition: As per the Energy Plan, The Vermont Department of Buildings and General Services must use HEVs and PEVs in its fleet. All state agencies and departments must purchase the most fuel-‐efficient vehicles possible.

69
Plug-‐in Electric Vehicle Deployment in the Northeast: A Market Overview and Literature Review September 2012
Bibliography AASHTO. (2010). Real Transportation Solutions for Greenhouse Gas Emissions. Washington, DC: American Association of State Highway and Transportation Officials.
Accenture. (2011). Plug-‐in electric vehicles: Changing perceptions, hedging bets. Accenture.
ACEEE. (2010). Plug-‐in Electric Vehicles: Penetration and Grid Impacts. Washington, DC: Amiercan Council for an Energy Efficient Economy.
AeroVironment. (2011). EV Charging Primer. EV Solutions.
Aoki, H. (2010, October 22). The Standardization of electric mobility towards CO2 Reduction. Tokyo, Japan: Tokyo Electric Power Company.
Argonne National Laboratory. (2011). Modeling the Performance and Cost of Lithium-‐Ion Batteries for Electric-‐Drive Vehicles. Chicago: U.S. Department of Energy.
Association of Bay Area Governments. (2011). "Ready Set Charge California." San Francisco.
BCG. (2010). Batteries for Electric Cars: Challenges, Opportunities, and the Outlook to 2020. Detroit, MI: Boston Consulting Group.
Becker, T. A., Sidhu, I., & Tenderich, B. (2009). Electric Vehicles in the United States: A New Model with Forecasts to 2030. Berkeley, California: Center for Entrepreneurship & Technology, University of California—Berkeley.
Benecchi, A., Mattila, M., Syed, N., & Shamsuddin. (2010). Electric Vehicles in America: The question is no longer “whether” they will come, but “how fast” and “where first”. Detroit, Michigan: Roland Berger Strategy Consultants.
C2ES. (2012). PEV Action Plan. Arlington: Center for Climate and Energy Solutions.
C2ES. (2012) Advanced Research Projects Agency -‐ Energy (ARPA-‐E): Innovation through Grant-‐Making. Arlington, VA: Center for Climate and Energy Solutions.
C2ES. (2012) Clean Cities Plug-‐In Electric Vehicle Community Readiness Partners Discussion Group. Arlington, VA: Center for Climate and Energy Solutions. Retrieved from:http://www.c2es.org/docUploads/workshop_handout.pdf
California PEV Collaborative. (2010). Taking Charge: Establishing California Leadership In The Plug-‐In Electric Vehicle Marketplace. California Plug-‐in Electric Vehicle Collaborative.
CAR. (2011). Deployment Rollout Estimate of Electric Vehicles: 2011-‐2015. Ann Arbor, MI: Center for Automotive Research.
City of Atlanta. (2011). Electric Vehicle Deployment: Municipal Best Practices Study. Atlanta: City of Atlanta Mayor's Office of Sustainability.
City of New York. (2010). PLANYC: Exploring Electric Vehicle Adoption in New York City. New York City: City of New York.
City of San Francisco. (2010). San Francisco Electric Vehicle Program Summary. San Francisco.
Columbia University. (2010). Enhancing the Feasibility of Electric Vehicles in New York City. New York City: Columbia University Press.
Crabtree et al. (2008). Energy Future: Think Efficiency. College Park, MD: American Physical Society.
Creyts, J., Derkach, A., Nyquist, S., Ostrowski, K., & Stephenson, J. (2007). Reducing U.S. Greenhouse Gas Emissions: How Much at What Cost? McKinsey and Co.
DeForest, N., Funk, J., Lorimer, A., Ur, B., Sidhu, I., Kaminsky, P., et al. (2009). Impact of Widespread Electric Vehicle Adoption on the Electrical Utility Business—Threats and Opportunities. Berkeley, California: Center for Etrepreneurship & Technology, University of California-‐Berkeley.
Deloitte. (2011). Gaining Traction: Will Consumers ride the electric vehicle wave? Deloitte Global Services Ltd.
DOD. (2010). Quadrennial Defense Review. Washington, DC: U.S. Department of Defense.
DOE. (2011a). One Million Electric Vehicles By 2015: February 2011 Status Report. Washington, DC: U.S. Department of Energy.
DOE. (2011b, April 19). Secretary Chu Announces New Funding and Partnership with Google to Promote Electric Vehicles. Retrieved May 3, 2011, from Office of Energy Efficiency & Renewable Energy: http://www.energy.gov/news/10280.htm.

70
Plug-‐in Electric Vehicle Deployment in the Northeast: A Market Overview and Literature Review September 2012
DOE. (2010). The Recovery Act: Transforming America’s Transportation Sector, Batteries and Electric Vehicles. Washington, DC: U.S. Department of Energy.
DOE: NREL. (2011). Electric Vehicle and Infrastructure Codes and Standards Chart. Golden, Colorado: U.S. Department of Energy.
Dow et al. (25-‐29 July 2010). A Novel Approach for Evaluating the Impact of Electric Vehicles on the Power Distribution System. Power and Energy Society General Meeting, 2010 IEEE (pp. 1 -‐ 6). Minneapolis, MN: IEEE.
EDTA. (2011). Medium-‐Heavy Duty Electric Vehicles. Retrieved from http://www.electricdrive.org/index.php?ht=d/sp/i/10468/pid/10468.
EEI. (2011). The Utility Guide to Plug-‐in Electric Vehicle Readiness. Edison Electric Institute.
EERE. (2005, November 7). Comparing Energy Costs per Mile for Electric and Gasoline Vehicles. Retrieved December 2011, from Advanced Vechicle TEsting Activity: http://www1.eere.energy.gov/vehiclesandfuels/avta/light_duty/fsev/fsev_gas_elec2.html.
EIA. (2010). EIA Annual Energy Outlook.
EIA. (2011). World Oil Price Variations and Associated Events. Retrieved from http://www.eia.doe.gov/emeu/cabs/AOMC/Overview.html.
Electrification Coalition. (2009). Electrification Roadmap: Revolutionizing Transportation and Achieving Energy Security. Electrification Coalition.
Ener1. (2010). 10-‐K: Annual report pursuant to section 13 and 15(d). New York, New York: Ener1, Inc. Produced for the United States Securities and Exchange Commission.
EPA. (2008). EPA Staff Technical Report: Cost and Effectiveness Estimates of Technologies Used to Reduce Light-‐duty Vehicle Carbon Dioxide Emissions. Washington, DC: U.S. Environmental Protection Agency.
EPA. (2005). Sources of Hydrocarbon and NOx Emissions in New England. Retrieved from United States Environmental Protection Agency Region 1: New England: http://www.epa.gov/region1/airquality/piechart.html.
EPA. (2011). The Benefits and Costs of the Clean Air Act from 1990 to 2020. Washington, D.C: United States Environmental Protection Agency.
EPRI. (2010). Characterizing Consumers' Interest in and Infrastructure Expectations for Electric Vehicles: Research Design and Survey Results. Electric Power Research Institute.
EPRI & NRDC. (2007). Environmental Assessment of Plug-‐in Electric Vehicles. Electric Power Research Institute; Natural Resources Defense Council.
EPRI Infrastructure Working Council. (2011). Utility PEV Rates and Second Meter Installation. EPRI Infrastructure Working Council Public Meeting. Electric Power Research Institute.
Executive Office of the President. (2010). The Recovery Act: Transforming the American Economy Through Innovation. Washington, DC: Office of the President of the United Sates.
Farmer, C., Hines, P., Dowds, J., & Blumsack, S. (2010). Modeling the Impact of Increasing PHEV Loads on the Distribution. Proceedings of the 43rd Hawaii International Conference on System Sciences. Honolulu.
FERC. (2008). Assessment of Demand Response and Advanced Metering. Washington, DC: Federal Energy Regulatory Commission.
FERC. (2010). National Action Plan on Demand Response. Washington, DC: Federal Energy Regulatory Commission.
Freedonia Group. (2009). Batteries. Cleveland.
General Electric. (2011). Developing an EV Ecosystem Strategy. GE EV Experience Tour. Vienna, Virginia: General Electric.
Girishkumar, G., McCloskey, B., Luntz, A. C., Swanson, S., & Wilcke, W. (2010). Lithium-‐Air Battery: Promise and Challenges. The Journal of Physical Chemistry Letters , 2193-‐2203.
Goodman, C. (2008, October). Takeoff and Descent of Airline Employment. Monthly Labor Review .
Greater Washington Region Clean Cities Coalition. (2011). Plug-‐in Electric Vehicle Feasibility Study. Clean Cities Coalitions.
Green Fleet Magazine. (2011, October 11). What is the Future of All-‐Electric Medium-‐Duty Trucks? Retrieved from Green Fleet: http://www.greenfleetmagazine.com/article/50689/what-‐is-‐the-‐future-‐of-‐all-‐electric-‐medium-‐duty-‐trucks.
Greene, D. L., & Hopson, J. L. (2010). The Costs of Oil Dependence, 2009. Oak Ridge National Laboratory Memorandum.

71
Plug-‐in Electric Vehicle Deployment in the Northeast: A Market Overview and Literature Review September 2012
Greene, D. (2011). What is greener than a VMT tax? The case for an indexed energy user fee to finance U.S. surface transportation. Transportation Research Part D: Transport and Environment.
Greene, D., & Plotkin, S. (2011). Reducing Greenhouse Gas Emissions from U.S. Transportation. Arlington, Virginia: Pew Center on Global Climate Change.
Hadley, S. W., & Tsevotka, A. (2008). Potential Impacts of Plug-‐in Hybrid Electric Vehicles on Regional Power Generation. Oak Ridge, Tennessee: U.S. Department of Energy – Oak Ridge National Laboratory.
Hu, P. S., & Reuscher, T. R. (2004). Summary of Travel Trends: National Household Travel Survey. Washington, DC: U.S. Department of Transportation.
HybridCars. (2011). Electric Cars: A Definitive Guide. Retrieved from HybridCars: Auto Alternatives for the 21st Century: http://www.hybridcars.com/electric-‐car.
IEA. (2009). Technology Roadmap: Electric and plug-‐in hybrid electric vehicles. Paris, France: International Energy Agency.
Indiana University. (2011). Plug-‐in Electric Vehicles: A Practical Plan for Progress. Bloomington, IN: Indiana University.
IRS. (2009). Notice 2009-‐89: New Qualified Plug-‐in Electric Drive Motor Vehicle Credit. Washington, DC: IRS.
Kintner-‐Meyer, M., Schneider, K., & Pratt, R. (2007). Impacts Assessment of Plug-‐In Hybrid Vehicles on Electric Utilities and Regional U.S. Power Grids. Part 1: Technical Analysis. Pacific Northwest National Lab.
Kintner-‐Meyer, Michael; Schneider, Kevin; Pratt, Robert. (2007). Impacts Assessment of Plug-‐in Electric Vehicles on Electric Utilities and Regional U.S. Power Grids: Part I Technical Analysis. Pacific Northwest National Laboratory.
Knupfer, S. (2011). The fast lane to the adoption of electric cars. McKinsey Quarterly.
Lee, H., & Lovellette, G. (2011). Will Electric Cars Transform the U.S. Vehicle Market? An Analysis of Key Determinants. Cambridge: Harvard Kennedy School.
Letendre, S., Denholm, P., & Lilienthal, P. (2006). Plug-‐in hybrid and all-‐electric vehicles: new load or new resource. Public Utilities Fortnightly, 144, 28-‐37.
Lidicker, J. R., Lipman, T. E., & Shaheen, S. A. (2010). Economic Assessment of Electric-‐Drive Vehicle Operation in California and the United States. Davis, California: Institute of Transportation Studies, University of California – Davis.
Massachusetts Department of Energy Resources. (2011). Installation Guide for Electric Vehicle Supply Equipment (EVSE). Boston: Massachusetts Department of Energy Resources.
McKinsey & Co. (2009). Pathways to a Low-‐Carbon Economy. McKinsey & Co.
McKinsey. (2011, February). The fast lane to the adoption of electric cars . McKinsey Quarterly .
MIT. (2010). Electrification of the Transportation System. Cambridge, MA: MIT.
MIT. (2011). The Future of the ELectric Grid. MIT.
Narich et al. (2011). Changing the game: Plug-‐in electric vehicle pilots. Accenture.
NAS. (2010). Transitions to Alternative Transportation Technologies – Plug-‐in Electric Vehicles. Washington, DC: The National Academies Press.
National Resarch Council. (2010). Transitions to Alternative Transportation Technologies-‐-‐Plug-‐in Hybrid Electric Vehicles . The National Academies Press.
Nemry, F., Leduc, G., & Munoz, A. (2009). Plug-‐in Hybrid and Battery-‐Electric Vehicles: State of the research and development and comparative analysis of energy and cost efficiency. Luxembourg: Institute for Prospective Technological Studies, European Commission Joint Research Centre.
New England Public Policy Center. (2006). Transportation and Freight Movement Issues in New England. Boston: Boston Federal Reserve Bank.
NRC. (2010). Advancing the Science of Climate Change. Washington, DC: National Academies Press.
NYSERDA and EPRI. (2011). Transportation Electrification in New York State. NYSERDA. NYSERDA.
Peterson, D. (2011). Addressing Challenges to Electric Vehicle Charging in Multifamily Residential Buildings. Los Angeles: UCLA Luskin School for Public Affairs.
Peterson, S., & Whitacre, J. (2009). Vehicle to Grid Systems. Washington, DC: Carnegie Mellon University.

72
Plug-‐in Electric Vehicle Deployment in the Northeast: A Market Overview and Literature Review September 2012
Pew Center on Global Climate Change. (2005). Climate Change 101: Science and Impacts.
Pew Center on Global Climate Change. (2011, July). Plug-‐in Electric Vehicles: Literature Review. Retrieved from http://www.c2es.org/docUploads/PEV-‐Literature-‐Review.pdf.
Pew Center for Global Climate Change. (2011). Primer on Federal Surface Transportation Authorization and the Highway Trust Fund. Arlington: Pew Center for Global Climate Change.
Pike Research. (2011). Electric Vehicle Geographic Forecasts. Pike Research.
Pike Research. (2011). Electric Vehicle Market Forecasts. Pike Research.
Project Get Ready & ETEC. (2011). Plug-‐In Vehicle Strategic Planning/Feasibility Study. Project Get Ready.
Rhode Island Clean Cities Coalition. (2011). Plug-‐in Vehicle Strategic Planning/Feasibility Study. Clean Cities Coalition.
SAE International. (2011, April). SAE International Standards Work, Including Communications Protocols and Connectors, Fast Charge, Batteries. Retrieved from SAE International: http://publicaa.ansi.org/sites/apdl/Documents/Meetings%20and%20Events/EDV%20Workshop/Presentations/Pokrzywa-‐ANSI-‐EDV-‐0411.pdf.
SAE. (2011). SAE Charging Configurations and Ratings Terminology. Retrieved May 26, 2011, from Society of Automotive Engineers: http://www.sae.org/smartgrid/chargingspeeds.pdf.
Santini, D. J., Gallagher, K. G., & Nelson, P. A. (2010). Modeling of Manufacturing Costs of Lithium-‐Ion Batteries for HEVs, PHEVs, and EVs. Argonne, Illinois: Argonne National Laboratory.
Sexton, S., & Sexton, A. (2010). Conspicuous Conservation: The Prius Effect and Willingness to Pay for Environmental Bona-‐Fides. DRAFT .
SFEnvironment. (2011). EV Chargers in Multifamily Buildings. MultiCharge SF: An SFE Initiative, Bringing EV Charging to Multifamily Buildings in San Francisco. San Francisco.
Thompson, T., Carey, K., Allen, D., & Webber, M. (2011). Air quality impacts of plug-‐in electric vehicles in Texas: evaluating three battery charging scenarios. Environmental Research Letters, 6, 11.
TMC. (2010, October 7). Press Release: Worldwide ‘Prius’ Sales Top 2-‐million Mark. Retrieved May 17, 2011, from Toyota Motor Corporation (TMC): http://www2.toyota.co.jp/en/news/10/10/1007.html
Touchstone Energy. (2010). Energy Managers' Quarterly: Plug-‐In Electric Vehicles for Fleets. ESource.
Turrentine, T. S., Garas, D., Lentz, A., & Woodjack, J. (2011). The UC Davis MINI E Consumer Study. Davis: Institute of Transportation Studies at UC Davis.
Tuttle, D. P., & Baldick, R. (2010). The Evolution of Plug-‐in Electric Vehicle-‐Grid Interactions. Austin, Texas: Department of Electrical and Computer Engineering, The University of Texas at Austin.
University of Vermont Transportation Research Center. (2010). Can Electric Vehicles Meet Vermont's Travel Demand.
University of Vermont Transportation Research Center. (2010). Plug-‐in Hybrid Electric Vehicle Research Project: Phase Two Report. Burlington, VT: Transportation Research Center.
US EIA. (2011). Table 57, Annual Energy Outlook 2011. US EIA.
USDOE: EERE. (2011). Executive Order 13514: Federal Leadership in Environmental, Energy, and Economic Performance. Washington, DC: USDOE.
USDOT BTS. (2010). Table 1-‐11: Number of U.S. Aircraft, Vehicles, Vessels, and Other Conveyances. Retrieved from http://www.bts.gov/publications/national_transportation_statistics/html/table_01_11.html
USGCRP. Global Climate Change Impacts in the United States. Washington, DC: United States Global Change Research Program, 2009.
Wial, H. (2010). For Car Country, Could the Mourning Become Electric? Brookings Institution.
Zpryme. (2010). The Electric Vehicle Study. Zpryme Research and Consulting.

73
Plug-‐in Electric Vehicle Deployment in the Northeast: A Market Overview and Literature Review September 2012
1 http://www.greencarreports.com/news/1073585_2012-‐toyota-‐prius-‐plug-‐in-‐parsing-‐the-‐epa-‐efficiency-‐sticker 2 Plug-‐in America Vehicle Tracker: http://www.pluginamerica.org/vehicles 3 http://techcrunch.com/2011/01/28/zero-‐motorcycles-‐raise-‐2million/ 4 http://www.gizmag.com/sikorsky-‐project-‐firefly/15993/ 5 http://www.nytimes.com/2011/08/28/automobiles/electric-‐car-‐makers-‐quest-‐one-‐plug-‐to-‐charge-‐them-‐all.html?pagewanted=all 6 http://wheels.blogs.nytimes.com/2011/10/26/bucking-‐trends-‐tesla-‐goes-‐it-‐alone-‐on-‐plug-‐design/ 7 http://www.greencarreports.com/news/1021405_california-‐hov-‐lane-‐stickers-‐for-‐hybrids-‐worth-‐1200-‐to-‐1500 8 http://www1.eere.energy.gov/vehiclesandfuels/facts/2010_fotw615.html 9 http://www1.eere.energy.gov/vehiclesandfuels/facts/2010_fotw632.html 10 Ibid. 11 https://lpo.energy.gov/?page_id=45 12http://epa.gov/oaqps001/greenbk/mapnpoll.html 13 http://www.evadc.org/pwrplnt.pdf 14 http://www.nytimes.com/2012/03/28/science/earth/epa-‐sets-‐greenhouse-‐emission-‐limits-‐on-‐new-‐power-‐plants.html 15http://www.ferc.gov/market-‐oversight/market-‐oversight.asp 16http://www.c2es.org/what_s_being_done/in_the_states/emissionstargets_map.cfm 17 http://janus.state.me.us/legis/ros/lom/lom121st/5pub201-‐250/pub201-‐250-‐44.htm 18 www.nj.gov/dep/sage/ce-‐gwr.html 19http://epa.gov/climatechange/emissions/usinventoryreport.html 20 http://www.pjm.com/about-‐pjm/renewable-‐dashboard.aspx 21 http://www.chevrolet.com/assets/pdf/en/overview/12_Volt_Spec_Sheet.pdf; http://www.ford.com/cars/mustang/specifications/ 22 http://www.nytimes.com/2011/05/21/business/21auto.html 23 http://www.afdc.energy.gov/afdc/vehicles/electric_maintenance.html 24 http://www.irs.gov/pub/irs-‐pdf/f8834.pdf 25 http://www.greenfleetmagazine.com/article/982/strategies-‐for-‐hybrid-‐vehicle-‐purchase-‐tax-‐incentives 26 http://www.calcars.org/calcars-‐news/1103.html 27 http://www.reuters.com/article/2011/09/30/us-‐ge-‐leasing-‐idUSTRE78T56220110930 28http://www.greentechmedia.com/articles/read/ev-‐batteries-‐dropping-‐rapidly-‐in-‐price/; http://ing.dk/artikel/109887-‐et-‐batteri-‐til-‐en-‐elbil-‐koster-‐60000-‐kroner 29http://www.green.autoblog.com/2010/05/15/nissan-‐leaf-‐profitable-‐by-‐year-‐three-‐battery-‐cost-‐closer-‐to-‐18/ 30 http://www.greencarreports.com/news/1042471_electric-‐drive-‐director-‐duvall-‐confirms-‐nrc-‐reports-‐overstated-‐cost-‐of-‐plug-‐ins-‐and-‐batteries 31 http://news.cnet.com/8301-‐11128_3-‐57384864-‐54/startup-‐envia-‐battery-‐promises-‐to-‐slash-‐ev-‐costs/ 32http://www.eia.gov/electricity/monthly/update/end_use.cfm 33http://www.api.org/aboutoilgas/gasoline/ 34http://www.oru.com/programsandservices/incentivesandrebates/timeofuse.html 35 http://www.cleanfleetreport.com/enterprise-‐rental-‐chevrolet-‐volt/ 36 http://www.ge.com/audio_video/ge/ecomagination/ge_to_buy_25000_electric_vehicles.html 37 http://www.autoobserver.com/2011/11/enterprise-‐expands-‐ev-‐rental-‐inventory.html 38 http://www1.eere.energy.gov/cleancities/electric_vehicle_projects.html 39 http://www.nyc.gov/html/om/pdf/2010/pr10_nyc_electric_vehicle_adoption_study.pdf 40 http://www.energy.state.md.us/Transportation/evse/index.html 41 http://www.energy.state.md.us/Transportation/evse/index.html 42 http://www.theevproject.com/index.php 43 http://www.thruway.ny.gov/ezpass/greentag.html 44 http://voices.yahoo.com/great-‐incentives-‐hybrid-‐electric-‐vehicles-‐dc-‐7516220.html 45 http://www.cityofnewhaven.com/TrafficParking/hybridparking.asp 46 http://www.dom.com/about/environment/electric-‐vehicle-‐pricing-‐plan.jsp

74
Plug-‐in Electric Vehicle Deployment in the Northeast: A Market Overview and Literature Review September 2012
47 http://green.autoblog.com/2011/07/20/plug-‐in-‐2011-‐aaa-‐range-‐anxiety-‐solution-‐electric-‐vehicle-‐assistance/ 48 http://www.afdc.energy.gov/afdc/laws/law/MD/5835 49 http://www.pewclimate.org/federal/executive/vehicle-‐standards 50 http://www.arb.ca.gov/fuels/lcfs/lcfs.htm 51 http://www.arb.ca.gov/msprog/zevprog/zevprog.htm 52 http://www.afdc.energy.gov/afdc/laws/law/CT/6069 53 http://arpa-‐e.energy.gov/ProgramsProjects/BEEST.aspx 54 http://www.nyserda.ny.gov/en/Funding-‐Opportunities/Current-‐Funding-‐Opportunities.aspx 55 http://phev.ucdavis.edu/publications/consumer-‐behaviors/ 56 http://green.autoblog.com/2011/07/25/bmw-‐gets-‐ready-‐to-‐lease-‐electric-‐vehicles-‐with-‐ing-‐purchase/ 57 http://www.nyc.gov/html/om/pdf/2010/pr10_nyc_electric_vehicle_adoption_study.pdf 58 http://www.pluginamerica.org/incentives 59 http://www.reeep.org/130/esco-‐model.htm 60http://www.youtube.com/watch?v=jvPLvsg9y2o 61 http://www.nj.gov/dep/oce/docs/ev-‐charging-‐stations.pdf 62 http://docs.cpuc.ca.gov/published/Final_decision/139969-‐07.htm 63 http://www.rpelawalert.com/2011/03/articles/development/proposed-‐legislation-‐will-‐require-‐shopping-‐center-‐developments-‐in-‐nj-‐to-‐provide-‐charging-‐stations-‐for-‐electric-‐vehicles/ 64http://evsolutions.avinc.com/uploads/products/AV_EV_Charging_Primer_bro_050610.pdf 65http://www.mynissanleaf.com/viewtopic.php?f=26&t=5540 66 http://www.ens-‐newswire.com/ens/oct2011/2011-‐10-‐11-‐091.html 67 Ibid. 68http://www.plugincars.com/wanted-‐fair-‐costs-‐home-‐charger-‐installations-‐106724.html 69http://www.pluginamerica.org/press-‐release/ev-‐charging-‐multifamily-‐housing 70http://www.youtube.com/watch?v=jvPLvsg9y2o 71 http://www.afdc.energy.gov/pdfs/51227.pdf 72 http://www.plugincars.com/gm-‐sponsors-‐bill-‐creates-‐problems-‐electric-‐car-‐charging-‐107641.html 73 http://www.autoobserver.com/2011/08/ev-‐charger-‐law-‐spawning-‐new-‐gm-‐image-‐woes.html 74 Ibid. 75http://www.businessweek.com/ap/financialnews/D9RL0ROO0.htm 76 http://www.westcoastgreenhighway.com/ 77 http://mutcd.fhwa.dot.gov/resources/interim_approval/ia13/index.htm 78https://www.evgonetwork.com/eVgo_Charging_Stations/ 79 http://350green.com/wp-‐content/uploads/2011/12/Pentagon-‐City-‐EV-‐Press-‐Release.pdf 80 http://www.eei.org/ourissues/EnergyEfficiency/Documents/EVReadinessGuide_web_final.pdf 81 E,g., http://green.autoblog.com/2011/12/20/electric-‐vehicle-‐charging-‐stations-‐sitting-‐unused-‐tennessee/ 82 http://www.youtube.com/watch?v=jvPLvsg9y2o 83 http://www.eia.gov/tools/faqs/faq.cfm?id=97&t=3 84 http://www.fhwa.dot.gov/policyinformation/statistics/2010/sf1.cfm 85 http://www.fhwa.dot.gov/policyinformation/statistics/2009/hf1.cfm 86 http://www.api.org/Oil-‐and-‐Natural-‐Gas-‐Overview/Industry-‐Economics/~/media/Files/Statistics/gasoline-‐diesel-‐summary.ashx 87 http://www.api.org/oil-‐and-‐natural-‐gas-‐overview/industry-‐economics/~/media/21EBD0B62EBA42B1965EE82EFFB6585D.ashx 88http://www.fhwa.dot.gov/bridge/nbi/defbr10.cfm 89 http://www.autoblog.com/2011/08/01/new-‐cafe-‐standards-‐will-‐result-‐in-‐65b-‐in-‐lost-‐revenue-‐for-‐road/ 90http://www.portal.state.pa.us/portal/server.pt/community/alternative_fuels_tax/14435 91 http://www.oregon.gov/ODOT/HWY/RUFPP/ruftf_reports.shtml 92 Plug-‐in America Panel: http://www.youtube.com/watch?v=jvPLvsg9y2o 93 http://asmarterplanet.com/blog/2012/01/flipping-‐the-‐smart-‐grid-‐switch-‐in-‐vermont.html

75
Plug-‐in Electric Vehicle Deployment in the Northeast: A Market Overview and Literature Review September 2012
94 http://www.cleanfleetreport.com/google-‐energy-‐v2g/ and http://www.udel.edu/PR/Messenger/07/01/V2G.html. For more technical details, please see http://www.udel.edu/V2G/resources/test-‐v2g-‐in-‐pjm-‐jan09.pdf 95 http://www.eei.org/whoweare/ourmembers/USElectricCompanies/Pages/default.aspx