a mass and energy balance stage model for cyclic distillation
TRANSCRIPT

General rights Copyright and moral rights for the publications made accessible in the public portal are retained by the authors and/or other copyright owners and it is a condition of accessing publications that users recognise and abide by the legal requirements associated with these rights.
Users may download and print one copy of any publication from the public portal for the purpose of private study or research.
You may not further distribute the material or use it for any profit-making activity or commercial gain
You may freely distribute the URL identifying the publication in the public portal If you believe that this document breaches copyright please contact us providing details, and we will remove access to the work immediately and investigate your claim.
Downloaded from orbit.dtu.dk on: Feb 11, 2022
A mass and energy balance stage model for cyclic distillation
Rasmussen, Jess Bjørn; Mansouri, Seyed Soheil; Zhang, Xiangping; Abildskov, Jens; Huusom, JakobKjøbsted
Published in:AIChE Journal
Link to article, DOI:10.1002/aic.16259
Publication date:2020
Document VersionPeer reviewed version
Link back to DTU Orbit
Citation (APA):Rasmussen, J. B., Mansouri, S. S., Zhang, X., Abildskov, J., & Huusom, J. K. (2020). A mass and energybalance stage model for cyclic distillation. AIChE Journal, 66(8), [e16259]. https://doi.org/10.1002/aic.16259

A mass and energy balance stage model for cyclicdistillationJess Bjørn Rasmussen1,2 | Seyed Soheil Mansouri1 |Xiangping Zhang2 | Jens Abildskov1 | Jakob KjøbstedHuusom11PROSYS, Department of Chemical and Biochemical Engineering, Technical University of Denmark, Søltofts Plads, Building 229,2800 Kgs. Lyngby, Denmark2ILC, Institute of Process Engineering, Chinese Academy of Sciences, No.1 Zhongguancun North 2nd Street, Haidan District, Beijing100190, P.R. China
CorrespondenceJakob Kjøbsted Huusom, PROSYS, Department of Chemical and Biochemical Engineering, Technical University of Denmark, SøltoftsPlads, Building 229, 2800 Kgs. Lyngby, DenmarkEmail: [email protected]
Funding informationThe authors received no specific funding for this work.
AbstractCyclic distillation is an emerging process intensification technology, which can improve the separation efficiencycompared to conventional distillation. Since most current models only account for the mass transfer, there is a lack
PROCESS SYSTEMS ENGINEERING
AIChE Journal DOI 10.1002/aic.16259
This article has been accepted for publication and undergone full peer review but has not been through the copyediting, typesetting, pagination and proofreading process, which may lead to differences between this version and the Version of Record. Please cite this article as doi: 10.1002/aic.16259© 2020 American Institute of Chemical Engineers (AIChE) Received: Jan 02, 2020; Revised: Mar 28, 2020; Accepted: May 04, 2020 This article is protected by copyright. All rights reserved.
Acc
epte
d A
rticl
e

2 Rasmussen et al.of a stage model for cyclic distillation processes, which includes considerations of both mass and energy transfer.Such a model is presented in this paper and using this model selected case studies, describing binary and multiplecomponent systems with both ideal and non-ideal liquid phases, are investigated. The presented stage model allowsfor the modelling of both mass and energy transfer for a cyclic distillation process and allows for multiple feedlocations as well as side draws. With the energy balances included the dynamic vapour flow rate can be described.This was shown to have a significant effect on the separation, especially for cases where the change in the vapourflow over the column height was high.
K E YWORD SCyclic distillation, Process intensification, Distillation modelling, Periodic cycled separation
IntroductionDistillation is a common fluid separation process in chemical and biochemical industry. It is often an expensive process,both in capital and operational cost due to low tray efficiencies and high energy requirements. In 2016 distillationprocesses alone accounted for approximately 8% of the total energy consumption in the U.S.1. Different processintensifications have been proposed in order to lower the cost and improve the separation efficiency of distillationprocesses2,3,4. One of these process intensifications is called cyclic distillation, sometimes also referred to as periodicdistillation or controlled/periodic cycling of distillation processes.
It has been shown that there are key benefits in operating a distillation process with this periodic cycling, insteadof the conventional way with continuous counter-current liquid and vapour flows. For example it could lead to eitherhigher capacity5, better degree of separation6 or reduced energy requirements7 dependent on the process, columnand stage design.| Development in cyclic distillation technologyIn 1936 Lewis investigated the tray efficiency in a distillation column for three different tray concepts assuming plugflow in the liquid phase8:
Acc
epte
d A
rticl
e
This article is protected by copyright. All rights reserved.

Rasmussen et al. 3• Case I: Inlet vapour is completely mixed.• Case II: Inlet vapour is not mixed and liquid moves across the tray in the same direction on all trays.• Case III: Inlet vapour is not mixed and liquid moves counter-currently on the trays.
The first Lewis case describes a tray immediately above the reboiler (or the bottom tray in a absorption or strip-per column), where the vapour has a uniform composition. The third Lewis case describes a tray in a conventionaldistillation column and it was later shown that a tray operated with periodic cycling is analogous to Lewis case II9.Lewis calculated the tray efficiencies for different scenarios. When the point efficiency, Epoi nt , and the ratio of theequilibrium and operational slopes were equal to one, he found that with a tray efficiency for the third case equalto Et r ay/Epoi nt = 1.5, the tray efficiency for the second Lewis case would be Et r ay/Epoi nt = 2.0, with the efficiency for caseI equal to Et r ay/Epoi nt = 1.728. I.e. according to Lewis, a tray in a conventional distillation column has the lowest trayefficiency, and a tray similar to a tray in a cyclic distillation column has the highest tray efficiency of the three caseshe investigated. With higher tray efficiencies in cyclic distillation the degree of separation is significantly improvedcompared to conventional distillation. This means a cyclic distillation column could be an improvement in terms ofhigher capacity, lower energy requirements, better separation performance and/or smaller columns with the samedegree of separation.
In the early 1960's controlled cycling of a distillation process was proposed by Cannon et al.5,10,11. They werethe first to realise the benefits of cyclic distillation and that the second Lewis case tray could be realised with cyclicoperation. In 1967 early pilot-scale experimentswere conducted by Schrodt et al.12. For these pilot-scale experimentsthey used ordinary sieve trays. While they reported a high degree of separation as expected, they also noticed issueswith non-uniform liquid draining for large columns (more than 12 trays). The problem they encountered with thedraining was that some of the trays would drain completely before other trays. This meant back-mixing of the liquidholdups could not be avoided.
Since the early 1960’s cyclic distillation have been extensively studied in lab-scale, pilot-scale and with simplemodelling12,13,14,15,16. Different tray design and operations have been proposed, including step-wise draining, pres-sure manifolds and trays with inclined surfaces17,18,19. These tray designs were intended to solve the issue with
Acc
epte
d A
rticl
e
This article is protected by copyright. All rights reserved.

4 Rasmussen et al.non-uniform draining first reported by Schrodt et al.12. However, none of the proposed designs solved the problemsufficiently. Between 1990 and 2010 the number of publications on cyclic distillation is scarce. It was not until a newviable tray design was proposed in 2011 by Maleta et al.20 that the issues with non-uniform draining were solved forany number of stages. With this new tray design that allows full-scale distillation columns being operated in cyclicmode together with an increase in computational power, the interest in cyclic distillation was rekindled. Since 2011new papers have been published, focusing on the modelling, design and control of cyclic distillation processes as wellas on experimental work7,21,22,23,24,25,26. Due to the increase in computational power the complexity of the modelshas also increased. The first mass balance based models from the 20th century described stripping processes withassumptions of linear equilibrium, binary mixtures and saturated liquid feed7,13,14. The newer models are capable ofsimulating full distillation columns with non-linear equilibrium and multi-component mixtures. Despite the increasedcomplexity in the models, the current state-of-the-art model by Patruţ et al. is still only mass balance based and withassumption of saturated liquid feed6. Patruţ et al. also included a term for a stage dependent vapour flow rate basedon the heat of vaporisation on each stage, but not on the energy transfer. Nielsen et al. proposed a driving forcebased design algorithm for cyclic distillation including non-saturated liquid feed24. The first attempt to set up a massand energy balance model was presented by Andersen et al.21. The model by Andersen et al. includes the energybalance for all stages, but only with a single feed and no additional energy terms. The purpose of their model wasto describe the integrated column design, based on the method by Nielsen et al.24, and control configuration. Whileconsiderations of the energy transfer on each stage is included in the model, it does not give a general description ofthe process and while the time dependent vapour flow rate is mentioned, it is not explicitly presented.
For pilot scale or industrial applications there are currently two draining methods available: A simultaneous drain-ing, where all trays are drained to the tray below at the same time, and a sequential draining27,28, where the stagesare drained and filled one-by-one starting from the bottom and to the top of the column. The simultaneous drainingmethod is the most studied method and can be achieved with the Maleta trays20 as previously mentioned.
The Maleta tray contains a sluice chamber below the actual tray that collects the liquid holdup during the liquidflow period. When a new vapour flow period is initiated the sluice chamber opens in the bottom and closes in thetop, thus allowing the liquid holdups to drain to the stage below, but not further down and thereby avoid back-mixing.
Acc
epte
d A
rticl
e
This article is protected by copyright. All rights reserved.

Rasmussen et al. 5The sluice chambers are opened and closed by the pressure fluctuations from turning the vapour flow on and off. Thesequential draining can be achieved by using the COPS (Cyclically Operated Perforated Sheet) trays27. The COPStrays are opened and closed one by one, starting from the bottom, using pneumatics, which also means that with thesequential method of draining it is not necessary to interupt the vapour flow.
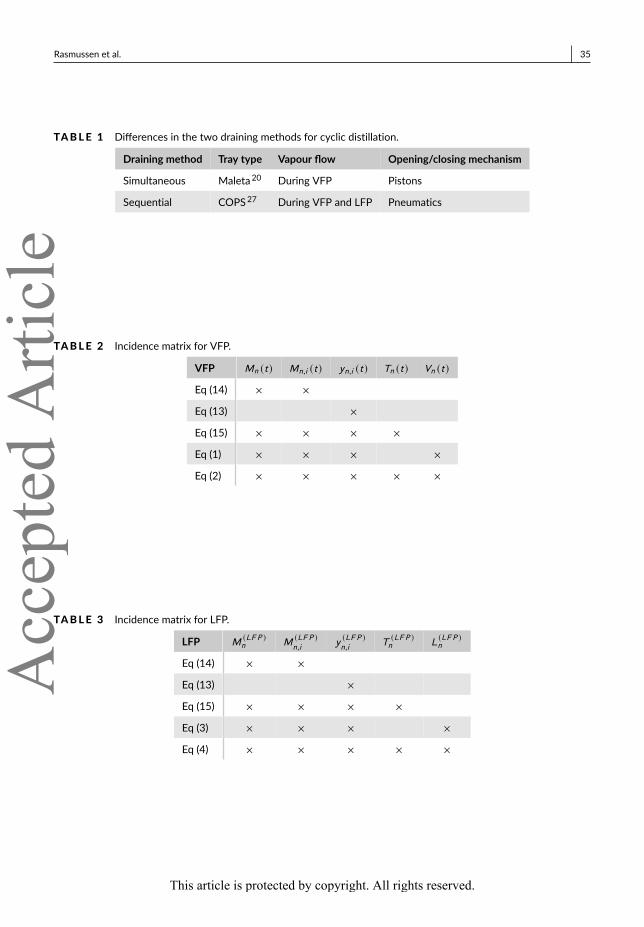
The difference in the two draining methods is summarised in Table 1 and Figure 1 shows how the simplified traysbehave during VFP and LFP when the trays are drained and filled.
[Table 1 about here.]
[Figure 1 about here.]
In general the current models available are all mainly intended for a conceptual short-cut design modelling andpreliminary studies of a cyclic distillation column, most of which do not describe the energy transfer between liquidand vapour. Hence, there is a lack of a energy and mass balance based stage model that can be used for rigoroussimulation. With the energy transfer included an expression for the time dependent vapour flow rate can be set up. Amore general stage model would further make it possible to include multiple feed and/or side draw locations as wellas incorporate energy terms for example from reaction or mixing.
The purpose of this paper is to develop a general stage model that can be used for rigorous simulation of a cyclicdistillation process by including both mass and energy balances in the model and possibility of multiple feed stages,side draw and additional energy at each stage. This model is for simultaneous drained cyclic distillation only, sincethis is the most mature technique and widely studied in literature. The proposed stage model will be equivalent tothe well-known MESH equation model for conventional distillation29.
The model presented in this work is versatile in the sense it can account for different scenarios, which previousmodels could not. For example, a column with multiple feed and side draws, a column where the vapour flow changessignificantly, high changes in stage temperature during VFP or when additional heat is added to a stage (or multiplestages).
This paper is organised with first a general description of a cyclic distillation process is given, followed by themodel development, where the proposedmodel is presented. Themodel implementation, analysis and possible model
Acc
epte
d A
rticl
e
This article is protected by copyright. All rights reserved.

6 Rasmussen et al.variations are then presented and discussed. For different case studies, the performance of the proposed modelis compared to the current state-of-the-art model. The performance of the two models is analysed in both quasi-stationary steady-state and open loop dynamic simulations. Finally, a discussion regarding the control of a cyclicdistillation process as well as discussion of the model limitations are given.
Process descriptionThe general principle in the cyclic operation of a distillation process is dividing the process in two periods that togetherconstitute a cycle: The vapour flow period (VFP) and the liquid flow period (LFP).
During the VFP the vapour flows up through the column, while the liquid holdups are kept stationary on the trays.It is in this period the actual separation takes place. After the VFP the LFP is initiated and the liquid holdup on eachtray is drained to the tray below. Reflux and liquid feed are also added to the column during the LFP and productsare removed. During VFP it is necessary to keep the vapour velocity above the weeping limit to avoid liquid draining.Furthermore, during the LFP it is important to avoid back-mixing of the liquids by ensuring the liquid on a tray isdrained to the tray below without mixing with the liquid on this tray.
In a cyclic distillation process there is no stationary steady-state, since the phasemovements are separated, whichalso means the process is inherently dynamic. It is, however, possible to reach a quasi-stationary steady-state, wherethe compositions, liquid holdups and temperatures on each tray are repeated during each cycle.
Model developmentIn the following section the equations for a mass and energy balance stage model for cyclic distillation with simulta-neous draining, e.g. by use of Maleta trays20, is presented. This model is equivalent to the MESH equation model29.The basis of the model development is the mass balance model by Patruţ et al.6, but further includes considerationsof energy transfer inspired by the work by Andersen et al.21.
The objective of the model development is to be able to describe different phenomena in a cyclic distillation
Acc
epte
d A
rticl
e
This article is protected by copyright. All rights reserved.

Rasmussen et al. 7process, such as the combined mass and energy transfer. Both the mass and energy transfer on each tray, as wellas disturbances can be described with the developed model and it is thus an equivalent to the well-known MESHequation model for cyclic distillation. The proposed model do not incorporate momentum balances and thus neitherdynamic nor static pressure effects. The reason is that sufficient data and details of the tray design to justify thisdevelopment is currently not available.| AssumptionsThe following assumptions are made to simplify the model development:
• Equilibrium between vapour exiting a tray and the liquid holdup on the tray.• No back-mixing of liquid holdups.• Liquid feed and reflux is added during LFP. Vapour feed is added during VFP.• Negligible vapour holdup.• Constant pressure (negligible pressure drop).• The displacement of liquid holdups is instantaneous during LFP.• Side draws are removed during LFP.• Mass and heat transfer between phases only occurs during VFP.• No heat of mixing.• Negligible heat loss.
One of the main assumptions here is that vapour feed is only introduced during the VFP and liquid feed onlyduring the LFP. For saturated liquid or vapour feeds, this is not an issue. However, if a high pressure liquid feedis introduced to a low pressure column, flash will occur after the feed enters the column and there would be bothvapour and liquid flows at the same time. With the assumption of separated phase flows, it is not possible to simulatea simultaneous vapour and liquid feed. Therefore, it is assumed that the flashed vapour and the liquid is separatedbefore it is introduced to the column, so that the liquid feed can be introduced during LFP and the flashed vapourduring VFP. By assuming this it is possible to model the flash of the liquid feed, however, it is only reasonable for
Acc
epte
d A
rticl
e
This article is protected by copyright. All rights reserved.

8 Rasmussen et al.small amounts of flashed vapour. Generally, for a cyclic distillation process flashing of the feed is undesired, due tothe separation of phase flows. Similar for a mixed feed with both liquid and vapour, e.g. a feed between the bubbleand dew point, the vapour fraction of the feed is introduced during VFP and the liquid part of feed during LFP.
The remaining assumptions listed are often used for model development of both cyclic and conventional distilla-tion6,30.| Balance equationsA general tray n in the cyclic distillation column with simultaneous draining is depicted in Figure 2 for both the vapourflow period and the liquid flow period with corresponding inlets and outlets. This depiction is equivalent to a MESHstage in conventional columns, with the assumption of constant pressure (i.e. no pressure drop). During the VFP thevapour flow, compositions, temperatures and energies to the stage are all time dependent, whereas the liquid flowperiod is a discrete event, meaning the liquid holdups, compositions, temperatures and side draws are only dependenton the state variables after VFP.
For the model development the following variables are used: molar holdup of component i in stage n : Mn,i , totalmolar holdup in stage n : Mn , vapour flow rate from stage n : Vn , liquid and vapour composition of component i atstage n : xn,i and yn,i respectively. The liquid enthalpy at stage n is denoted: hn and the vapour enthalpy is denoted:Hn . Any additional energy added to a stage is denoted Qn and any side draw Sn .
[Figure 2 about here.]
During the VFP, shown in Figure 2, there is only vapour flow and during LFP there is only liquid flow. Energy isonly added to the stage during VFP and side draws are only removed during LFP.
During the VFP the mass and energy balances for tray n = 2, ...,NT − 1, counted from the top down, and compo-nent i = 1, ...,NC are:VFP mole balance
dMn,i (t )dt =Vn+1 (t )yn+1,i (t ) −Vn (t )yn,i (t ) +V Fn+1 (t )yFn+1,i (t ) (1)
Acc
epte
d A
rticl
e
This article is protected by copyright. All rights reserved.
Rasmussen et al. 9With the initial conditions Mn,i (0) = M 0
n,ifor i = 1, ...,NC .
VFP energy balance
dMn (t )hn (t )dt =Vn+1 (t )Hn+1 (t ) −Vn (t )Hn (t ) +V Fn+1 (t )HFn+1 (t ) + Qn (t ) (2)
With the initial conditions hn (0) = h0n . This energy balance is used to describe the time dependent vapour flow rate.During the liquid flow period the mass and energy balances for tray n = 2, ...,NT −1 and component i = 1, ...,NC
are:LFP mole balance
M(LF P )n,i
= M (V F P )n−1,i +M F
n−1,i − Snx(V F P )n,i
(3)
The superscripts (LFP) and (VFP) denotes the end of the liquid flow and the vapour flow period respectively. Thismeans the two variables M (LF P )
n,iand M (V F P )
n,iare the values of the stage holdups after the liquid and vapour flow
periods respectively.Tray n = 2 is a special case since the liquid inlet is equal to the reflux, L, from the reboiler M (V F P )
1,i= Lx (V F P )
1,i.
LFP energy balance
M(LF P )n h
(LF P )n = MV LF P )
n−1 h(V F P )n−1 +M F
n−1hFn−1 − Snh
SDn (4)
| Reboiler and condenserThe reboiler and condenser are special cases, however, the model equations can be written in a similar fashion whereV1 =VNT +1 = 0. During the VFP the model equations, with the assumptions of no feed, for the condenser (n = 1) andreboiler (n = NT ) and components i = 1, ...,NC can be written:
Acc
epte
d A
rticl
e
This article is protected by copyright. All rights reserved.

10 Rasmussen et al.VFP mole balances for n = 1 and n = NT
dM1,i (t )dt =V2 (t )y2,i (t ) (5)dMNT ,i (t )dt = −VNT (t )yNT ,i (t ) (6)
With the initial conditions M1,i (0) = M 01,i
and MNT ,i (0) = M 0NT ,i
for i = 1, ...,NC .VFP energy balances for n = 1 and n = NT
dM1 (t )h1 (t )dt =V2 (t )H2 (t ) + Q1 (t ) (7)dMNT (t )hNT (t )dt = −VNT (t )HNT (t ) + QNT (t ) (8)
With the initial conditions h1 (0) = h01 and hNT (0) = h0NT . The condenser and reboiler duties are denoted as Q1 (t ) =QC (t ) and QNT (t ) = QR (t ) respectively.LFP mole balances for n = 1 and n = NT
M(LF P )1,i
= M (V F P )1,i
− (D + L) x (V F P )1,i
(9)M(LF P )NT ,i
= M (V F P )NT ,i
+M (V F P )NT −1,i − Bx
(V F P )NT ,i
(10)
LFP energy balances for n = 1 and n = NT
M(LF P )1 h
(LF P )1 = h (V F P )1
(M(V F P )1 − (D + L)
) (11)M(LF P )NT
h(LF P )NT
= M (V F P )NT1
h(V F P )NT −1 + h (V F P )
NT
(M(V F P )NT
− B) (12)
Here the distillate is denoted D, the reflux L and the bottom product flow rate B.
Acc
epte
d A
rticl
e
This article is protected by copyright. All rights reserved.

Rasmussen et al. 11
| Summation and equilibrium equationsAs for the MESH equations29, it is necessary to ensure that the vapour and liquid mole fractions sum up to one andthat equilibrium is reached on each stage for each component. The summation equations for the vapour and the liquidphase for stage n = 1, ...,NT are:
NC∑i=1
yn,i − 1 = 0 (13)NC∑i=1
xn,i − 1 = 0 (14)
The phase equilibrium equation for component i = 1, ...,NC and stage n = 1, ...,NT is:
yn,i − Kn,i xn,i = 0 (15)
Where Kn,i is the separation factor.These equations are required during both VFP and LFP. With the mass and energy balances, as well as the sum-
mation and equilibrium equations, an equivalent model to the MESH equation model can be set up.| Constitutive equationsFor any given application of the presented model, pure component parameters and mixture specific relations arenecessary. The constitutive equations for these used in this work are presented below.| Vapour-liquid equilibriumWith the assumption of ideal vapour phase the modified Raoult's law can be used to find the relation between thevapour and liquid compositions.
yn,i P = xn,i Psatn,i γn,i (16)
Acc
epte
d A
rticl
e
This article is protected by copyright. All rights reserved.

12 Rasmussen et al.Equation (16) is a special case of equation (15), where the vapour phase is assumed ideal and the liquid phase can bedescribed with the activity coefficients. Hence, the separation factor will be defined as: Kn,i = P sat
n,iγn,i/P . The activity
coefficient for the liquid phase can be determined by a suitable activity coefficient model. For an ideal liquid it followsthat γn,i = 1. A commonly used activity coefficient model for a mixture with a single liquid phase is the Wilsonequation31,32. The vapour pressure must be determined from a vapour pressure equation.| EnthalpiesThe enthalpy can be found from a reference enthalpy, temperature and the specific heat capacity. In the followingit is assumed that the specific heat capacity, CV
P ,i, is temperature independent. With the assumption of temperature
independent specific heat capacity the vapour enthalpy of component i on stage n can be written as:
Hn,i (t ) = H ◦i +∫ Tn (t )
Tr ef
CVP ,i dT = h◦i + CVP ,i (Tn (t ) −Tr ef ) (17)
The proposedmass and energy balancemodel can be implementedwith a generalCVP ,i
expression. For the case studiesin this paper temperature independent specific heat capacities were used. Furthermore, the reference enthalpy ischosen arbitrarily, here assumed to be zero, and the reference temperature is chosen to be Tr ef = 298 K. The valuesof the reference enthalpy, and corresponding reference temperature, can be chosen arbitrarily since it cancel out inthe energy balances. In the following the reference enthalpy, H ◦
i= 0, is inserted in the general expressions for the
enthalpies. The summation of the component contributions gives the vapour phase enthalpy for stage n , denotedHn (t ) .
Hn (t ) =NC∑i=1
yn,i (t )(CVP ,i (Tn (t ) −Tb,i )
) (18)
As the heat of mixing is neglected. The liquid enthalpy can found as the vapour enthalpy of component i at boilingpoint minus the heat of vaporisation4,33.
hn (t ) =NC∑i=1
xn,i (t )(CVP ,i (Tn (t ) −Tr ef ) − ∆H
◦v ap,i
) (19)
Acc
epte
d A
rticl
e
This article is protected by copyright. All rights reserved.

Rasmussen et al. 13
| Tray hydraulicsThe vapour flow rates throughout the column height can be found from the energy balance during the VFP in equation(2). Inserting the terms for enthalpies and the mass balances gives:
Vn (t ) =1
g (n, n, t )
[Vn+1 (t )g (n, n + 1, t ) +V Fn+1 (t )g
F (n, n + 1, t ) −Mn (t )NC∑i=1
xn,i (t )CVP ,idTn (t )dt + Qn
](20)
Which consists of terms regarding the inlet vapour flow from below, the vapour feed (if any), the liquid holdup enthalpyand the energy added (or removed) to the stage. It should be noted that this vapour flow rate is time dependent,since it depends on the equilibrium composition and temperature and the change in these over time. The expressiong (na , nb , t ) , in units of J/mol, describes the difference in the vapour enthalpy Hnb (t ) and the liquid enthalpy hna (t )and is defined as:
g (na , nb , t ) = Hnb (t ) − hna (t ) +Mna (t )[−Tna (t )M 2na (t )
NC∑i=1
CVP ,i
(Mna (t )ynb ,i (t ) −Mna ,i (t )
)+NC∑i=1
CVP ,iTr ef + ∆H
◦v ap,i
Mn2a(t )
(Mna (t )ynb ,i (t ) −Mna ,i (t )
)] (21)
Here na and nb can either be equal, and thus describe the same stage, or nb = na + 1 in which case g (na , nb , t )describes the enthalpy difference between the liquid holdup and the inlet vapour to stage na .
A similar expression for the vapour flow rate can be set up for the reboiler.
VNT (t ) =QB (t ) −MNT (t )
∑NCi=1 xNT ,i (t )C
VP ,i
dTNT (t )dtg (NT ,NT , t ) (22)
The total condenser has a vapour flow rate of zero. The temperature derivative, dTn (t )/dt , is found from the modifiedRaoult's law in equation (16). For any given mixture, 1 − ∑NC
i=1 yn,i = 0. This can be rewritten with the modifiedRaoult's law, and can be defined as a function f . In the following it is assumed the function f is only dependent on
Acc
epte
d A
rticl
e
This article is protected by copyright. All rights reserved.

14 Rasmussen et al.the temperature and component holdups on the tray n .
f = 1 −NC∑i=1
xn,i γn,iP satn,i
P= 0 (23)
Here the function f is dependent on the liquid holdup of all components and the tray temperature. The derivative off with regards to time, with the assumption of f only being dependent on temperature and component holdups, canbe written:
df (t )dt =
∂f (t )∂Tn (t )
dTn (t )dt +NC∑i=1
∂f (t )∂Mn,i (t )
dMn,i (t )dt = 0 (24)
From this the derivative dTn (t )/dt can be isolated. The derivative dMn,i (t )/dt can be found from the mole balance (equation(1)) and the terms ∂f (t )/∂Tn (t ) and ∂f (t )/∂Mn,i (t ) from themodified Raoult's law in equation (16), when the activity coefficientmodel is known.
The liquid flow for tray n is the same as the holdup on tray n − 1 after a VFP, with the addition of any liquid feedand removal of any side draws. This is what is also shown in the mole balance during the LFP in equation (3).| DutiesThe required condenser and reboiler duties can be found from the differences in vapour and liquid enthalpies:
QC (t ) =V2 (t ) (H2 (t ) − h1 (t )) (25)QR (t ) =
M 0NT· BR
tV F P(HNT (t ) − hNT (t )) (26)
The condenser is a total condenser, meaning all the inlet vapour condenses, whereas the reboiler is a partial reboiler,meaning only a fraction of the holdup is reboiled. This fraction is defined by the boilup ratio, BR , which is a measureof the average vapour flow from the reboiler during VFP.
Acc
epte
d A
rticl
e
This article is protected by copyright. All rights reserved.

Rasmussen et al. 15
| Periodicity conditionTo ensure a quasi-stationary steady-state is reached the following two conditions must be satisfied, where Mn (t ) isthe total molar holdup in stage n at time t .
L = M1 (tV F P ) −M1 (0) − D (27)B = MNT (tV F P ) +MNT −1 (tV F P ) −MNT (0) (28)
These two relations will ensure the total liquid holdups in the condenser and reboiler respectively are the same aftereach LFP. With the implementation of these periodicity conditions, it is assumed the condenser and reboiler holdupsare perfectly controlled by the reflux and bottom product flow rate respectively.| HoldupsThe sum of component holdups for a given stage is the total molar holdup, Mn (t ) :
Mn (t ) =NC∑i=1
Mn,i (t ) (29)
Furthermore, the component holdup is equal to the product of the total holdup and the liquid molar fraction.
Mn,i (t ) = Mn (t )xn,i (t ) (30)
| Feed stagesIt is assumed that all the liquid feed is added during the LFP to tray n and is, along with the holdup on tray n , drainedto tray n + 1 before the next vapour flow period. Any vapour feed that is added to the column is added during theentirety of VFP. The vapour is added above the liquid holdup on tray n so the vapour feed mixes with the vapour fromtray n .
If the feed temperature is above the bubble point, a flash calculation with known column pressure and feedenthalpy can be made. This is done to find the amount of liquid that is flashed and the respective temperature
Acc
epte
d A
rticl
e
This article is protected by copyright. All rights reserved.

16 Rasmussen et al.and compositions in the vapour and liquid phases. The flashing of feed is described previously. If the liquid feedis subcooled, i.e. below dew point, cold liquid will enter the column. When this cold feed mixes with the feed trayholdup, the stage temperature is decreased below bubble point. No mass transfer will occur when a tray temperatureis below the bubble point, but the liquid is heated by the rising vapour until the bubble point is reached.| Temperature deviationsAs mentioned above, the feed temperatures can deviate from bubble point. However, the tray (or stage) temperaturesfor the liquid holdup might also deviate from the bubble point. If the tray temperature is too high, flash of the liquidwill occur. It is assumed this will happen during LFP, after the mixing in the feed stages and reboiler has occurred. Onthe other hand if the temperature is too low, then no mass transfer will occur and the liquid holdup must be heatedby the vapour coming from the stage below. This is assumed to occur during the VFP, since no vapour flow is presentduring the LFP. The tray and column material are assumed to not have any effect on the liquid holdup temperature. Ifthe stage temperature is too low, it follows that the vapour flow period must be long enough, in order to ensure theliquid holdup is heated to the bubble point before mass transfer can occur.| Model implementation, framework and analysisBoth the mass balance model by Patruţ6 and the proposed mass and energy balance model have been implementedin MATLAB®. The model framework is shown in Figure 3.
[Figure 3 about here.]
In step 1-2 the problem is defined and the relevant properties for the given species and mixture is found inliterature or in a database. As part of the problem definition, the model complexity is also defined (see Table 4). Instep 3, the column is designed and the number of trays, initial conditions, feed location(s) and side draw(s) are specified.The cyclic distillation specific parameters, time periods for the VFP and LFP, as well as number of cycles simulated arechosen in step 4 and the rigorous dynamic model is solved. If the results are not satisfactory, the model parametersmust be reevaluated. First it is evaluated whether the number of cycles or VFP and LFP times are too high or low. Ifthis is not the case, then column design is verified, and finally the choice of VLE model and pure component/binaryinteraction parameters can be reconsidered.
Acc
epte
d A
rticl
e
This article is protected by copyright. All rights reserved.

Rasmussen et al. 17In the implementation of the models, the VFP and LFP are conveniently solved separately. One way to do this is
to solve the VFP first, with suitable initial values. After this the algebraic equations for LFP can be solved, since thestates after the LFP depend on the states after VFP. With the values after the LFP as initial values a new VFP can besolved and so forth any number of cycles can be simulated.
A model analysis, as described by Cameron and Gani34, is carried out for a single stage both in VFP and LFP.This model analysis is necessary to perform in order to ensure that the developed model is possible to solve. Theseparation factor, Kn,i , is in this analysis treated as a parameter, since the explicit temperature dependency is onlyknown, when the appropriate VLE model has been selected.
The developed model for the vapour flow period contains NV F Peqs = 3 + 2NC equations for a single stage, (1)-(2),(13)-(15). There are a total of NV F Pv ar = 10+4NC variables during VFP, which gives the following number of degrees offreedom: NV F P
DoF= 7+ 2NC . In addition to the variables shown in Figure 2, the stage pressure, total holdup, individual
holdups and duration of VFP are also variables. The feed and inlet variables, as well as the duration of VFP and thestage pressure are specified. This leaves the following variables to be calculated at each time step for stage n andcomponent i : Mn (t ),Mn,i (t ), yn,i (t ),Vn (t ),Tn (t ) . The liquid composition of the individual components can be foundfrom the component holdups. The incidence matrix for the VFP is shown in Table 2.
[Table 2 about here.]
A degree of freedom analysis can also be done for the LFP. There are N LF Peqs = 3 + 2NC equations, (3)-(4), (13)-(15), for the LFP and N LF Pv ar s = 10 + 4NC variables, which gives the following number of degrees of freedom: N LF PDoF =
7 + 2NC . The feed and inlet variables, as well as the duration of LFP and the stage pressure are specified, leavingthe following variables to be calculated: M (LF P )n ,M
(LF P )n,i
, y(LF P )n,i
,T(LF P )n , L
(LF P )n . Since the entire stage is completely
drained during the LFP it follows that M (LF P )n = L (LF P )n tLF P . The incidence matrix for the LFP is shown in Table 2.
[Table 3 about here.]
A total molar holdup balance can be used by summation of the component holdups in equation (1) for the VFPor equation (3) for the LFP. This can substitute either equation (14) or (13).
Acc
epte
d A
rticl
e
This article is protected by copyright. All rights reserved.

18 Rasmussen et al.For a cyclic distillation columnwithNT stages andNC components there areNT (3+2NC ) equations to be solved
for both the VFP and the LFP, with NT (10 + 4NC ) variables each. This leaves a total of 2NT (7 + 2NC ) variables thatneeds to be specified and 2NT (3+2NC ) variables that can be calculated for each cycle, in order to be able to simulateany numbers of cycles.
The two incidence matrices do not have lower tri-diagonal forms, which means the model equations can not besolved sequentially34. The model must therefore be solved simultaneously and thus the differential equations and thealgebraic constraints constitutes a DAE system of equations. This DAE system is not specific to cyclic distillation, but isgenerally seen in dynamic distillation processes aswell as other complex chemical processes, where theODEs describethe mass and energy balances and algebraic constraints describe the VLE. It is possible to simplify this DAE system toan ODE system by solving the algebraic constraints at each time step from the current states4,30,35,36. The solving ofthe ODE system is as follows: Initially for time t = 0, the values of Tn (0) , Mn,i (0) , Mn (0) and xn,i (0) are known fromthe initial conditions. The vapour flow rate and vapour compositions can then be calculated for t = 0 using equations(15) and (20). Then the ODEs, equations (1)-(2), are calculated and for the next time step the algebraic equations canbe solved again. With this simplification, by separating the ODEs from the algebraic constraints, a certain level ofuncertainty is allowed in the solving for each time step. However, as long as the time steps are reasonably small, thisshould not give any significant deviations compared to solving the DAE system.| Model variationsThe above energy and mass balance model is a general description that can be used for many applications. Table 4show the features of the full model compared to some of the simplified alternatives. The developed model in Table 4can readily be reduced to themass balancemodel, proposed by Patruţ6, by removing the energy balances, vapour feedterms and set the vapour flow rate constant. By removing the possibility of additional feed/side draws and energy tothe stage and assume all stages are always at bubble point, the proposedmodel reduces to the currently available massand energy balance model by Andersen et al.21. All the models are capable of handling multi-component mixtureswith nonlinear equilibrium.
[Table 4 about here.]
In the developed model it is possible to include an extra energy term Qn (equation (2)). This energy term could be
Acc
epte
d A
rticl
e
This article is protected by copyright. All rights reserved.

Rasmussen et al. 19used to describe heat-integration, heat of mixing, reaction energy or any combination of these, which existing modelsare not developed for.
Case studiesIn this section, case studies are performed with the intention to investigate the difference between the simple massbalance model and the proposed mass and energy balance model. Examples from Patruţ et al.6 have been usedfor comparing the two models. The chosen case studies from Patruţ et al. are: Ideal mixtures of benzene/tolueneand benzene/toluene/o-xylene, and a non-ideal mixture of ethanol/n-pentanol. Furthermore, a non-ideal mixtureof ethanol/methanol/water has also been analysed. The non-ideal mixtures are described by the Wilson activitycoefficient model, with the binary interaction parameters found in Aspen Plus.
With the chosen case studies, both ideal and non-ideal binary and ternary mixtures will be investigated. All thesimulation parameters for the case studies are shown in Table 5.
[Table 5 about here.]
There are currently no results, either from experimental studies or simulation software, available in literature forcyclic distillation with the tray design by Maleta et al.20, which can be used for validating the proposed model. In2019 an experimental study with Maleta trays for a pilot scale cyclic stripper column for ethanol purification withair was presented25. However, this work is focused on a stripping process for removal of impurities and is thereforenot applicable as a case for comparison for the cyclic distillation models discussed in this paper. Furthermore, thecyclic distillation process is not possible to simulate with existing tools in commercial simulation software. As thereare no experimental data available from literature, or commercial simulations, for cyclic distillation it was decided toinvestigate the proposed model with the cases in Table 5. Three of the four cases that are analysed in this paper havepreviously been studied in another cyclic distillation modelling work by Patruţ et al.6.
The chosen case studies, summarised in Table 5, are analysed in terms of differences between the mass balancemodel and the mass and energy balance model. First the differences in the cyclic behaviour is investigated for the
Acc
epte
d A
rticl
e
This article is protected by copyright. All rights reserved.

20 Rasmussen et al.case of benzene/tolene. Figure 4 shows 10 cycles for the benzene/toluene mixture, when using the mass model (lightgrey) and the proposed mass and energy balance model (dark grey).
[Figure 4 about here.]
In Figure 4 the quasi-stationary steady-state can be seen as the identical repeating cycles. There is a clear differ-ence in the mass and the mass and energy balance models, for example the mass and energy balance model predictshigher purity top and bottom products. There is, however, no trend in the magnitude of change in the compositionover the VFP over time, where the simple mass balance model predicts a higher change in the composition in stage4, it predicts a lower change in stage 7.
The main reason for this difference between the two models is the vapour flow rate. For the mass balancemodel it is assumed the vapour flow rates are constant over the period, shown in Table 5. Whereas the flow ratesare time dependent for the proposed mass and energy balance model. The vapour flow rate is dependent on thestage temperature as well as the liquid and vapour phase compositions. When the vapour flows up through a columnand interact with the liquid holdups the two phases reaches an equilibrium, where there will be a transfer of molesbetween the phases. The time dependent vapour flow rate for the proposed model changes with the time derivativeof the stage temperature, which in turn depends on the change in composition and equilibrium. It follows that a timedependent vapour flow rate will be more important for long vapour flow periods, since for a short VFP the change inVn (t ) will be low. Furthermore, a mixture with high differences in volatility will experience a higher degree of masstransfer between the vapour and liquid phases. In general large temperature changes over a cycle would result in largechanges in the vapour flow rate. This will in turn also mean a high degree of change in composition and temperatureover time, and therefore a time dependent vapour flow rate is necessary for high fidelity simulations.
The differences in the mass and the mass and energy balance models are further investigated in the followingcomparisons between the quasi-stationary steady-states for the simple mass balance model and the full mass andenergy balance model for the four cases in Table 5. These comparisons are shown in Figure 5. Shown in the figure isthe molar composition of each stage after a VFP with the cycles in quasi-stationary steady-state.
[Figure 5 about here.]
Acc
epte
d A
rticl
e
This article is protected by copyright. All rights reserved.

Rasmussen et al. 21There is a clear difference between using a simple mass balance model and an extended model with both mass
and energy balances as is evident from the quasi-stationary steady-state plots in Figure 5. For the two binary cases themass and energy balance model shows a higher degree of separation than the mass balance model. This is due to thetime dependent vapour flow rate as mentioned previously. In both cases it seems the columns are over-dimensionedwhen using the mass and energy balance model. This means that by using the mass and energy balance model, with atime dependent vapour flow rate, fewer trays are needed for the same process compared to the prediction from themass balance model.
For the case with benzene/toluene/o-xylene there is also a clear difference between the two models. While thetop and bottom compositions are similar, the column profile is not. The mid-boiling component, toluene, is predictedby the mass balance model to have the highest composition at stage 13, while the mass and energy balance modelpredicts the highest composition at stage 12. This means if the mid-boiling component is desired to be removed as aside-product the two models would give two different optimal stages.
The last case, ethanol/methanol/water, does not seem to have any significant difference between the twomodels.The reason for this is the low vapour flow rate. For the mass balance it was set constant to 5 mol/s and for the massand energy balance it was found to be between 5.53 mol/s and 5.73 mol/s, on average for all stages around 5.57mol/s. Since the vapour flow rates are very similar for the two models, the difference between the results is minor.Hence for this case with small changes in the vapour flow rate, as mentioned previously, the mass balance model canbe used as a reasonable approximation. For comparison the vapour flow rate for the benzene/toluene case rangedfrom 37.49 mol/s to 45.17 mol/s over the stages, with an average of 41.20 mol/s. Here the time dependent vapourflow rate has a significant effect and the mass and energy balance should therefore be used. This can also be seen asthe high difference between the compositions for the two models in Figure 5.| Dynamic open loop disturbance responseFor the ethanol/methanol/water case in Table 5, with saturated liquid feed, the introduction of disturbances in thefeed composition are investigated. A ±5% change in the feed content of ethanol is introduced, while keeping themethanol feed composition constant. The condenser and reboiler content after each VFP for these disturbances andfor the quasi-stationary steady-state are shown in Figure 6 for the simple mass balance model and the mass and
Acc
epte
d A
rticl
e
This article is protected by copyright. All rights reserved.

22 Rasmussen et al.energy balance model.
[Figure 6 about here.]
Both models, despite different quasi-stationary steady-states, have comparable response to the changes in thefeed composition. The relative changes from the initial quasi-stationary steady-state to the new in ethanol composi-tion are summarised in Table 6.
[Table 6 about here.]
The relative changes and dynamic response in quasi-stationary steady-states are similar for both models. Thetwo models also showed similar quasi-stationary steady state profile as shown in the bottom plot in Figure 5. Thiswas due to the almost constant vapour flow rate for the mass and energy balance model. For the ±5 % disturbancesin the ethanol feed composition, with the mass and energy balance model, the vapour flow rate was almost constantwith a flow rate around 5.32 − 5.73 mol/s. Since the vapour flow rate was almost constant for the mass and energybalance model, it is as expected that the two models would show similar dynamic response as shown in Figure 6.
For the benzene/toluene case changes in the feed temperature have been investigated with the presented model.The composition of benzene in the top and bottom stage after VFP are shown in Figure 7 for the quasi-stationarysteady-state with saturated liquid feed (black) and a +5% (dark grey) and a -5% (light grey) change in the feed temper-ature.
[Figure 7 about here.]
When the feed temperature is increased to a value above the boiling point flashwill occur. Thismeans a fraction ofthe liquid will flash to vapour and will be introduced to the column during VFP as previously described. After the flasha new boiling point will be found. In this case for an equimolar benzene and toluene mixture at atmospheric pressurethe saturation temperature is 365.24 K and the temperature after a 5% increase followed by flash is 365.62 K. This is asmall change in temperature, however, the vapour feed goes from 0 mol/s to 1.89 mol/s over the 12 second durationof VFP. Increasing the feed temperature thus lowers the top concentration and increases the bottom concentrationof benzene. In this work it is assumed that the flashed feed can be separated, allowing the liquid to be introduced
Acc
epte
d A
rticl
e
This article is protected by copyright. All rights reserved.

Rasmussen et al. 23during LFP and the flashed vapour during VFP. When the feed is flashed only a fraction of the total feed is introducedas liquid (93.94%), which means less liquid holdup will be on the trays below the feed stage. The flashed vapour onthe other hand will mix with the vapour from the feed stage and rise. However, it was found the flashed vapour had alower composition of benzene than the vapour from below the feed location. This means a higher fraction of toluenewill be in the vapour from the feed stage to the condenser and thus lower the concentration of benzene.
After a 5% decrease in the feed temperature to 346.98 K, the composition of benzene changes drastically. Itappears that when the temperature is decreased, the separation of benzene and toluene is highly affected as well.When the feed temperature is below the boiling point, the feed stage temperature is also decreased to below theboiling point after mixing, this means there is no mass transfer occurring until the liquid is heated.
Operation and control of the cyclic distil lation processThe first studies for the control of a cyclic distillation process were made in the 20th century16,37,38. These earlystudies investigated the use of a variable period control, for which tV F P was made a manipulated variable to controlthe bottom product composition. More recently, Patruţ et al.6 suggested a control of the temperatures near thetop and bottom at the end of VFP. The reflux and vapour flow rate are then manipulated by used of discrete PI-controllers. Andersen et al.21 also presented a discrete PI-controller based on the work by Matsubara et al.37, withthe reboiler duty as the manipulated variable and bottom product concentration as controlled variable. All thesepreviously proposed controller configurations for cyclic distillation present simple control strategies based on themodels available at the time.
In order to develop a control strategy for the cyclic distillation process the manipulated and controlled variablesmust be identified39. The model presented by Patruţ et al.6 has the following manipulated variables: feed rate, topand bottom rates, reflux rate and the duration of the VFP and LFP. The proposed model has the same manipulatedvariables with the addition of the boilup rate. With the boilup rate as amanipulated variable it is possible tomanipulatethe vapour flow rate, which as shown previously in Figure 5 has a significant effect on the separation. There is alsothe possibility of side draws as well as multiple feed locations, which, if included, each present another manipulated
Acc
epte
d A
rticl
e
This article is protected by copyright. All rights reserved.

24 Rasmussen et al.variable. Furthermore, the mass and energy balance model can account for additional controlled variables, such asthe time dependent temperature of each stage. With the model presented in this paper the feed temperature can beincluded as a disturbance as shown in Figure 7. The detailed design ofa new controller configuration is in itself anextensive task and is best treated in a separate study.
Model limitationsThe proposed model is subject to some assumptions, one of which is the assumption of constant pressure in thecolumn or in other words no pressure drop in the column. Including the pressure drop over each tray would requireinformation about the column design specifications, i.e. the internals, the tray diameter and height of the liquid holdup.In a cyclic operation with simultaneous draining the pressure would equalise in the column during the LFP while thepressure profile will build up dynamically over the VFP. Hence the time constant and magnitude for this pressuredynamics in relation to the length of the VFP will in the end determine if pressure drop effects can be ignored. Alter-natively, a simpler method would be to set a specific static pressure drop per stage. In conventional distillation trays,with downcomers, the liquid height is limited by the weir height. In cyclic distillation trays there are no downcomers,and thus no physical limit on the height of the liquid, however, the pressure drop is still affected by the liquid level. Inthe cases mentioned in this paper, the assumption of no pressure drops physically means that it is assumed the liquidheight on the trays is low enough to not have a significant effect on the pressure drop over the tray. The assumptionof no pressure drop is often used in the modelling of columns, since the pressure drops are generally low. If pressuredrops were included, it wouldmake themodelling more realistic, however, it would also require a more comprehensivemodel to predict the pressure on each stage. With such a comprehensive process model it would also be possible toperform more realistic control studies30,40.
Another important assumption is the assumption of equilibrium trays. This means the vapour exiting a tray is inequilibrium with the liquid holdup. This is rarely the case and often a point efficiency less than unity is introducedto account for this. An assumption of point efficiency equal to one is suitable for modelling purposes to simplifythe implementation and calculations. When designing a column the assumption of equilibrium stages will most likely
Acc
epte
d A
rticl
e
This article is protected by copyright. All rights reserved.

Rasmussen et al. 25under-dimension the column and the desired separation is not achieved with the calculated number of equilibriumtrays41.
Despite the exclusion of pressure drop and non-equilibrium stages, the proposed model is still more widely appli-cable for different case studies for detailed simulation, design or control purposes than the existing models available.With the proposed model it is furthermore possible to directly add the effect of heats of reaction in the energy bal-ances, thereby making it possible to investigate reactive distillation cases.
With the energy balances included in the model it is possible to model the changes in the temperature over time,thus making it possible to use the actual temperatures, not necessarily the bubble point temperatures, as controlledvariables in a control configuration. The energy balances also allow changing the vapour flow rate by using the energyto the reboiler as a manipulated variable.
As mentioned previously the assumption of separate phase flow rates leads to an assumption of a flash of feedthat would be difficult to implement in real life. However, this assumption is necessary in order to able to simulate theprocess. As long as the amount of vapour that is released after the flash is small or the duration of the VFP is short,this assumption is reasonable.
ConclusionOperating a distillation process in cyclic mode has previously been shown to give higher throughput, higher separationperformance and reduced energy consumption in reboiler and condenser. The previous modelling work for cyclicdistillation have mainly been mass balance based for short-cut design purposes. Therefore, a stage model for massand energy transfer has been proposed, including considerations of how the vapour flow rate changes for each stageover time. It is a highly versatile model for cyclic distillation processes, with simultaneous draining of the trays, thatcan be used for many different cases with the possibility of multiple liquid and/or vapour feed and side draws.
Comparisons of the proposed mass and energy transfer model and the current mass transfer model for differentcases showed that for significant changes in the vapour flow rate over the column would lead to different columnprofile predictions, and therefore also different column designs. An example of this is the case of benzene/toluene,
Acc
epte
d A
rticl
e
This article is protected by copyright. All rights reserved.

26 Rasmussen et al.where the change in vapour flow rate was found to be significant, the proposed mass and energy balance modelpredicted that high purity products could be reached with fewer stages than predicted by the mass transfer model.On the other hand, for the ethanol/methanol/water case, where there was a small change in vapour flow rate, thecolumn profile predicted by the mass transfer and the mass and energy transfer models were similar.
The proposed mass and energy balance stage model can account for additional manipulated variables, of whichthe boilup rate is an important one. With the boilup rate as a manipulated variable it is possible to adjust the vapourflow rate, which as mentioned has a significant effect on the separation. Furthermore, the time dependent stage tem-peratures can be defined as controlled variables and the feed temperature as a disturbance, which was shown for thebenzene/toluene case. As for the quasi-stationary steady-state simulations, the dynamic responses to disturbancesshowed that the vapour flow rate is important. If there is no significant change in the vapour flow rate over the col-umn, then the dynamic responses for a change in the feed composition for the mass balance model and the proposedmodel were similar, as shown for the ethanol/methanol/water case.
[Table 7 about here.]
ACKNOWLEDGEMENTSThis paper is the results of a research project partially funded by the Sino-Danish Center for Education and Research(SDC).
List of Figures
1 Maleta tray (top)20 during (a) VFP, (b) draining to sluice chamber during LFP and (c) VFP with drainingfrom sluice chamber and filling of tray below. COPS tray (bottom)27 during (d) VFP, (e) draining of tray,(f) filling of tray. . . . . . . . . . . . . . . . . . . . . . . . . . . . . . . . . . . . . . . . . . . . . . . . . . . . 31
Acc
epte
d A
rticl
e
This article is protected by copyright. All rights reserved.

Rasmussen et al. 272 Inlets and outlets to stage n in a cyclic distillation column with simultaneous draining during VFP (top)
and LFP (bottom). . . . . . . . . . . . . . . . . . . . . . . . . . . . . . . . . . . . . . . . . . . . . . . . . . . 313 Model framework for the proposed cyclic distillation model. . . . . . . . . . . . . . . . . . . . . . . . . . 324 Stages in quasi-stationary steady-state formass balancemodel (light grey) andmass and energy balance
model (dark grey) for an ideal mixture of benzene/toluene. . . . . . . . . . . . . . . . . . . . . . . . . . . 325 Stage compositions after VFP for the cases in Table 5 for the mass balance model (light grey) and the
mass and energy balance model (dark grey) in quasi-stationary steady-state. . . . . . . . . . . . . . . . . 336 EtOH compositions in condenser (top) and reboiler (bottom) after VFP in quasi-stationary steady-state
(black) and for +5% (dark grey) and -5% (light grey) changes in the feed EtOH composition, using thesimple mass balance model (left) and the extended mass and energy balance model (right). . . . . . . . 34
7 Benzene composition in condenser (top) and reboiler (bottom) for saturated liquid feed (black), +5% infeed temperature (dark grey) and -5% in feed temperature (light grey). . . . . . . . . . . . . . . . . . . . 34
REFERENCES1. Sholl DS, Lively RP. Seven chemical separations to change the world. Nature News 2016;532:435–437.
2. Kiss AA. Advanced Distillation Technologies: Design, Control and Applications. (1st ed. Chichester, UK: John Wiley &Sons, Ltd; 2013.
3. Kiss AA. Distillation technology - still young and full of breakthrough opportunities. Journal of Chemical Technology andBiotechnology 2014;89:479–498.
4. Bisgaard T, Huusom JK, Abildskov J. Modeling and analysis of conventional and heat-integrated distillation columns.AIChE Journal 2015;61:4251–4263.
Acc
epte
d A
rticl
e
This article is protected by copyright. All rights reserved.

28 Rasmussen et al.5. Cannon MR. Controlled Cycling Improves Various Processes. Industrial & Engineering Chemistry 1961;53:629–629.
6. Patruţ C, Bîldea CS, Liţa I, Kiss AA. Cyclic distillation - Design, control and applications. Separation and PurificationTechnology 2014;125:326–336.
7. Bîldea CS, Patruţ C, Jørgensen SB, Abildskov J, Kiss AA. Cyclic distillation technology - Amini-review. Journal of ChemicalTechnology and Biotechnology 2016;91:1215–1223.
8. Lewis WK. Rectification of Binary mixtures. Industrial & Engineering Chemistry 1936;28:399–402.
9. Robinson RG, Engel AJ. An analysis of controlled cycling mass transfer operations. Industrial and Engineering Chemistry1967;59:22–29.
10. Mcwhirter JR, Cannon MR. Controlled Cycling Distillation:. . . in a Packed-Plate Column. Industrial and EngineeringChemistry 1961;53:632–634.
11. McWhirter JR, LloydWA. New look at distillation - 5. Controlled cycling in distillation and extraction. Chemical Engineer-ing Progress 1963;59:58–63.
12. Schrodt VN, Sommerfeld JT, Martin OR, Parisot PE, Chien HH. Plant-scale study of controlled cyclic distillation. ChemicalEngineering Science 1967;22:759–767.
13. Chien HH, Sommerfeld JT, Schrodt VN, Parisot PE. Study of Controlled Cyclic Distillation: II. Analytical Transient Solutionand Asymptotic Plate Efficiencies. Separation Science 1966;1:281–317.
14. Furzer IA. Periodic cycling of plate columns. Chemical Engineering Science 1973;28:296–299.
15. Furzer IA. Periodic cycling of plate columns: Mass transfer with nonideal liquid draining. AIChE Journal 1979;25:600–609.
16. Matsubara M, Nishimura Y, Watanabe N, Shimizu K. Periodic control of continuous distillation processes. ChemicalEngineering Science 1975;30:1075–1083.
17. Baron G, Wajc S, Lavie R. Stepwise periodic distillation. Chemical Engineering Science 1980;35:859–865.
Acc
epte
d A
rticl
e
This article is protected by copyright. All rights reserved.

Rasmussen et al. 2918. Furzer IA. Steady state flow distributions in a plate column fitted with a manifold. Chemical Engineering Science
1980;35:1291–1298.
19. Szonyi L, Furzer IA. Periodic cycling of distillation columns using a new tray design. AIChE Journal 1985;31:1707–1713.
20. Maleta VN, Kiss AA, Taran VM, Maleta BV. Understanding process intensification in cyclic distillation systems. ChemicalEngineering and Processing: Process Intensification 2011;50:655–664.
21. Andersen BB, Nielsen RF, Udugama IA, Papadakis E, Gernaey KV, Huusom JK, et al. Integrated Process Design andControl of Cyclic Distillation Columns. IFAC Advanced Control of Chemical Processes 2017;51:542–547.
22. Kiss AA, Maleta VN. Cyclic distillation technology - A new challenger in fluid separations. Chemical Engineering Trans-actions 2018;69:823–828.
23. Maleta BV, Shevchenko A, Bedryk O, Kiss AA. Pilot-scale studies of process intensification by cyclic distillation. AIChEJournal 2015;61:2581–2591.
24. Nielsen RF, Huusom JK, Abildskov J. Driving Force Based Design of Cyclic Distillation. Industrial and Engineering Chem-istry Research 2017;56:10833–10844.
25. Maleta B, Bedryk O, Shevchenko A, Kiss AA. Pilot-scale experimental studies on ethanol purification by cyclic stripping.AIChE Journal 2019;65:1–7.
26. Nielsen, Adem A R ; Álvarez, Elena Carrasquer; Carlsen, Niels F V ; Azizi, Haroon-U -R ; Jørgensen, Sten Bay; AbildskovJ. Analysis and Evaluation of Periodic Separations Using COPS Trays. Chemical Engineering Transactions 2018;69:6.
27. Toftegård B, Clausen CH, Jørgensen SB, Abildskov J. New Realization of Periodic Cycled Separation. Industrial & Engi-neering Chemistry Research 2016;55:1720–1730.
28. Wankat PC. Continuous Cyclic Distillation for Binary Solvent Exchange: The Batch Stack. Industrial and EngineeringChemistry Research 2018;57:16077–16083.
29. Wang JC, Henke GE. Tridiagonal Matrix for Distillation. Hydrocarbon Processing 1966;45:155–163.
Acc
epte
d A
rticl
e
This article is protected by copyright. All rights reserved.

30 Rasmussen et al.30. Skogestad S. Dynamics and control of distillation columns - A critical survey. Modeling, Identification and Control
1997;18:177–217.
31. Wilson GM. Vapor-Liquid Equilibrium. XI. A New Expression for the Excess Free Energy of Mixing. Journal of theAmerican Chemical Society 1964;86:127–130.
32. Taylor R, Koodman HA. Composition Derivatives of Activity Coefficient Models (For the Estimation of ThermodynamicFactors in Diffusion). Chemical Engineering Communications 1991;102:87–106.
33. Biegler L, Grossmann I, Westerberg A. Systematic Methods of Chemical Process Design. 1 ed. Pearson Education; 1997.
34. Cameron I, Gani R. Product and Process Modelling: A Case Study Approach. (1st ed. Oxford, UK: Elsevier Science &Technology Books; 2011.
35. Gani R, Ruiz CA, Cameron IT. A generalized model for distillation columns-I. Model description and applications. Com-puters and Chemical Engineering 1986;10:181–198.
36. Biegler LT, Damiano JJ, Blau GE. Nonlinear parameter estimation: A case study comparison. AIChE Journal 1986;32:29–45.
37. Matsubara M, Nishimura Y, Watanabe N, Onogi K. Relay feedback periodic control of plate columns. Chemical Engineer-ing Science 1982;37:753–758.
38. Dale EB, Furzer IA. Periodic cycling of plate columns. Control simulations and experiments. Chemical Engineering Science1978;33:905–911.
39. Skogestad S. Control structure design for complete chemical plants. Computers and Chemical Engineering 2004;28:219–234.
40. Mauricio-Iglesias M, Bisgaard T, Kristensen H, Gernaey KV, Abildskov J, Huusom JK. Pressure Control in DistillationColumns: A Model-Based Analysis. Industrial and Engineering Chemistry Research 2014;53:14776–14787.
41. Vishwakarma V, Schubert M, Hampel U. Assessment of separation efficiency modeling and visualization approachespertaining to flow and mixing patterns on distillation trays. Chemical Engineering Science 2018;185:182–208.
Acc
epte
d A
rticl
e
This article is protected by copyright. All rights reserved.

Rasmussen et al. 31
F IGURE 1 Maleta tray (top)20 during (a) VFP, (b) draining to sluice chamber during LFP and (c) VFP with drainingfrom sluice chamber and filling of tray below. COPS tray (bottom)27 during (d) VFP, (e) draining of tray, (f) filling oftray.
F IGURE 2 Inlets and outlets to stage n in a cyclic distillation column with simultaneous draining during VFP (top)and LFP (bottom).
Acc
epte
d A
rticl
e
This article is protected by copyright. All rights reserved.

32 Rasmussen et al.
F IGURE 3 Model framework for the proposed cyclic distillation model.
0 5 1098
98.5
99
99.5
100
0 5 1070
75
80
85
90
95
100
0 5 1045
50
55
60
0 5 100
0.5
1
1.5
2
F IGURE 4 Stages in quasi-stationary steady-state for mass balance model (light grey) and mass and energybalance model (dark grey) for an ideal mixture of benzene/toluene.
Acc
epte
d A
rticl
e
This article is protected by copyright. All rights reserved.

Rasmussen et al. 33
1 2 3 4 5 6 7 8 9 10 11 12 13 140
0.2
0.4
0.6
0.8
1
1 2 3 4 5 6 7 8 9 10 11 12 13 14 15 16 17 18 19 20 210
0.2
0.4
0.6
0.8
1
1 2 3 4 5 6 7 8 9 10 11 12 13 140
0.2
0.4
0.6
0.8
1
1 2 3 4 5 6 7 8 9 10 11 12 13 14 150
0.2
0.4
0.6
0.8
1
F IGURE 5 Stage compositions after VFP for the cases in Table 5 for the mass balance model (light grey) and themass and energy balance model (dark grey) in quasi-stationary steady-state.
Acc
epte
d A
rticl
e
This article is protected by copyright. All rights reserved.

34 Rasmussen et al.
F IGURE 6 EtOH compositions in condenser (top) and reboiler (bottom) after VFP in quasi-stationarysteady-state (black) and for +5% (dark grey) and -5% (light grey) changes in the feed EtOH composition, using thesimple mass balance model (left) and the extended mass and energy balance model (right).
F IGURE 7 Benzene composition in condenser (top) and reboiler (bottom) for saturated liquid feed (black), +5% infeed temperature (dark grey) and -5% in feed temperature (light grey).
Acc
epte
d A
rticl
e
This article is protected by copyright. All rights reserved.
Rasmussen et al. 35
TABLE 1 Differences in the two draining methods for cyclic distillation.Draining method Tray type Vapour flow Opening/closing mechanismSimultaneous Maleta20 During VFP PistonsSequential COPS27 During VFP and LFP Pneumatics
TABLE 2 Incidence matrix for VFP.VFP Mn (t ) Mn,i (t ) yn,i (t ) Tn (t ) Vn (t )
Eq (14) × ×
Eq (13) ×
Eq (15) × × × ×
Eq (1) × × × ×
Eq (2) × × × × ×
TABLE 3 Incidence matrix for LFP.LFP M
(LF P )n M
(LF P )n,i
y(LF P )n,i
T(LF P )n L
(LF P )n
Eq (14) × ×
Eq (13) ×
Eq (15) × × × ×
Eq (3) × × × ×
Eq (4) × × × × ×
Acc
epte
d A
rticl
e
This article is protected by copyright. All rights reserved.

36 Rasmussen et al.TABLE 4 Features of the general model and simplified versions.
Feature Full stage model Current massand energy bal-ance model21
Mass balance model6
Mass transfer Yes Yes YesHeat transfer Yes Yes NoTime dependentvapour flow ratebased on the energytransfer
Yes (Yes) No
Vapour feed Yes Yes NoMultiple feed Yes No NoSide draws Yes No NoAdditional energyterm
Yes No No
Tray temperaturesdifferent than boil-ing point
Yes No No
Subcooled feed Yes No NoTABLE 5 Simulation parameters for the case studies.Parameter Benzene/Toluene Ethanol/n-Pentanol Benzene/Toluene/
o-XyleneEthanol/Methanol/Water
Pressure (P ) 101.325 kPa 101.325 kPa 101.325 kPa 101.325 kPaNumber of trays (NT ) 14 21 14 15Feed location (NF ) 7 11 7 12Feed flow (M NF
F) 375 mol/cycle 833.33 mol/cycle 375 mol/cycle 200 mol/cycle
xF1 50 mol% 50 mol% 45 mol% 15 mol%xF2 50 mol% 50 mol% 45 mol% 5 mol%xF3 - - 10 mol% 80 mol%Constant vapour flow (V ) 36.83 mol/s 42.78 mol/s 29.17 mol/s 5 mol/sVFP duration (tV F P ) 12 s 25 s 12 s 25 sLFP duration (tLF P ) 3 s 5 s 3 s 5 sDistillate (D ) 187.5 mol/cycle 416.665 mol/cycle 187.5 mol/cycle 25 mol/cycleBoilup ratio (BR ) 0.09 0.12 0.08 0.07Condenser holdup (M 0
1 ) 5 kmol 10 kmol 5 kmol 2 kmolReboiler holdup (M 0
NT) 5 kmol 10 kmol 5 kmol 2 kmol
Acc
epte
d A
rticl
e
This article is protected by copyright. All rights reserved.

Rasmussen et al. 37
TABLE 6 Relative changes in composition of EtOH in condenser from quasi-stationary steady-state for changesin feed composition for the ethanol/methanol/water case.
Change in feed EtOH Simple model Extended model+5% 0.64% 0.62%-5% -0.69% -0.67%
TABLE 7
NomenclatureB bottoms (mol/cycle) Greek
BR boilup ratio γ activity coefficientCP specific heat capacity (J/(K mol)) Subscripts
D distillate (mol/cycle) i component IDh liquid enthalpy (J) n stage numberH vapour enthalpy (J/mol) Superscripts
∆H ◦v ap standard heat of vaporisation (J/mol) F feedK equilibrium constant L liquid phaseL reflux (mol/cycle) (LFP) end of LFPM molar holdup (mol) SD side drawN number of cycles V vapour phaseNC number of components (VFP) end of VFPNT number of trays 0 initial conditionP stage pressure (Pa)P sat saturation pressure (Pa)Q energy (J/s)S side draw (mol/cycle)t time (s)tLF P duration of LFP (s)tV F P duration of VFP (s)T temperature (K)Tb,i pure component boiling point (K)V vapour flow rate (mol/s)x liquid composition (mol/mol)y vapour composition (mol/mol)
Acc
epte
d A
rticl
e
This article is protected by copyright. All rights reserved.