a microfluidic approach to selection and enrichment … microfluidic approach to selection and...
TRANSCRIPT

A Microfluidic Approach to Selection and Enrichment
of Aptamers for Biomolecules and Cells
Jin Ho Kim
Submitted in partial fulfillment of the
requirements for the degree of
Doctor of Philosophy
in the Graduate School of Arts and Sciences
COLUMBIA UNIVERSITY
2013

© 2013
Jin Ho Kim
All rights reserved

ABSTRACT
A Microfluidic Approach to Selection and Enrichment of Aptamers for Biomolecules and Cells
Jin Ho Kim
This thesis presents microfluidic devices for the selection and amplification of nucleic
acids (aptamers) that bind to specific targets. Aptamers are very attractive molecules in many
biological applications due to their interesting properties including high target binding affinities
and stability. Using conventional platforms for aptamer generation (SELEX, systematic
evolution of ligands by exponential enrichment) is labor-intensive and time consuming.
Microfluidic devices have been developed to improve the aptamer enrichment efficiency.
However, aptamer generation using these devices is still inefficient because they require
complicated flow control components for sample and reagent handling and additional off-chip
processes.
We developed microfluidic SELEX platforms for rapid isolation of aptamers that possess
greatly simplified designs which enable easy chip fabrication and operation. The simplicity of
the devices is achieved by utilizing a combination of bead-based selection and amplification of
target binding nucleic acids, and gel-based electrokinetic transfer of nucleic acids. In the devices,
nucleic acids that bind to targets are isolated on target-functionalized microbeads or target cells
in a microchamber and electrokinetically transported to another chamber through a gel-filled
microchannel by an electric field. The strands are then hybridized onto reverse primers
immobilized on microbeads and amplified via polymerase chain reaction (PCR) using on-chip
temperature control. The amplified strands are separated from the beads and electrophoretically
transferred back into the selection chamber for subsequent SELEX rounds.

Using the devices, we demonstrated enrichment of target-binding nucleic acids against
human immunoglobulin E (IgE), the glucose-boronic acid complex, and MCF-7 cancer cells.
With the physical and functional integration allowed by the monolithic design realized in our
devices, the total process time for selection of aptamers was drastically reduced compared with
that required by conventional aptamer selection platforms. Moreover, the binding affinities of the
selected strands using our devices are comparable to those of aptamers obtained using the
conventional platforms.

i
Table of Contents
Acknowledgements ..........................................................................................................................v
List of Figures ................................................................................................................................ vi
Nomenclature ............................................................................................................................... xiv
List of Abbreviations .....................................................................................................................xv
Chapter 1. Introduction ....................................................................................................................1
1.1 Background ..................................................................................................................1
1.2 Protocols and Platforms for Aptamer Enrichment .......................................................4
1.2.1 Aptamer Isolation Method ...................................................................................4
1.2.2 Conventional SELEX Platforms for Aptamer Isolation ......................................5
1.2.3 Microfluidic Technology for Aptamer Isolation .................................................8
1.3 Scope of Thesis Research ...........................................................................................13
1.3.1 Objectives .........................................................................................................13
1.3.2 Specific Research Aims .....................................................................................15
1.3.3 Contribution of this Research ............................................................................17
Chapter 2. A Microfluidic Chip for Nucleic Acid Isolation and Enrichment ................................19
2.1 Introduction ................................................................................................................19
2.2 Principle, Design, and Fabrication .............................................................................21
2.2.1 Principle .............................................................................................................21
2.2.2 Design ................................................................................................................21

ii
2.2.3 Fabrication .........................................................................................................23
2.3 Experimental ..............................................................................................................25
2.3.1 Materials ............................................................................................................25
2.3.2 Experimental Setup ...........................................................................................26
2.3.3 Experimental Procedure ....................................................................................27
2.4 Results and Discussion ...............................................................................................29
2.4.1 Isolation of IgE-Binding ssDNA from a Randomized DNA Sample ...............29
2.4.2 Electrophoretic Transport of ssDNA through a Gel-Filled Microchannel ........32
2.4.3 Enrichment of IgE-Binding ssDNA ..................................................................35
2.5 Conclusions ................................................................................................................37
Chapter 3. A Microfluidic Chip for Studying Binding Interactions of Nucleic Acids with Cells .39
3.1 Introduction ................................................................................................................39
3.2 Design and Principle ..................................................................................................40
3.3 Experimental ..............................................................................................................42
3.3.1 Device Fabrication ............................................................................................42
3.3.2 Sample Preparation ............................................................................................43
3.3.3 Experimental Procedure ....................................................................................43
3.4 Results and Discussion ...............................................................................................44
3.5 Conclusions ................................................................................................................49
Chapter 4. Microfluidic Isolation and Amplification of Protein-Binding Nucleic Acids ..............50

iii
4.1 Introduction ................................................................................................................50
4.2 Principle and Design ..................................................................................................51
4.3 Experimental ..............................................................................................................53
4.3.1 Fabrication .........................................................................................................53
4.3.2 Experimental Procedure ....................................................................................53
4.4 Results and Discussion ...............................................................................................54
4.5 Conclusions ................................................................................................................57
Chapter 5. Microfluidic Selection and Enrichment of Biomolecule- and Cell-Binding Nucleic
Acids ..............................................................................................................................................58
5.1 Introduction ................................................................................................................58
5.2 Principle and Design ..................................................................................................59
5.3 Experimental ..............................................................................................................61
5.3.1 Device Fabrication ............................................................................................61
5.3.2 Sample Preparation ............................................................................................62
5.3.3 Experimental Procedure ....................................................................................63
5.4 Results and Discussion ...............................................................................................64
5.5 Conclusion ..................................................................................................................68
Chapter 6. Microfluidic SELEX for Isolation of Protein-, Small Molecule-, and Cell-Binding
Aptamers .......................................................................................................................................70
6.1 Introduction ................................................................................................................70

iv
6.2 Materials and Methods ...............................................................................................71
6.3 Results and Discussion ...............................................................................................73
6.3.1 Design and Experimental Procedure .................................................................73
6.3.2 Control of pH in the Chips ................................................................................76
6.3.3 Selection of Target-Binding Nucleic Acids ......................................................79
6.3.4 Transport and Capture of Nucleic Acids in the Chips .......................................82
6.3.5 Amplification of Nucleic Acids on Bead Surfaces ...........................................84
6.3.6 Transport of Amplified Nucleic Acids back in the Selection Chamber ............84
6.3.7 Multiple SELEX Rounds for Enrichment of Target-Binding Strands ..............87
6.3.8 Binding Affinity of Enriched Target-Binding Strands ......................................90
6.4 Conclusions ................................................................................................................93
Chapter 7. Conclusions ..................................................................................................................95
References ....................................................................................................................................101
Appendix ......................................................................................................................................109

v
Acknowledgements
I would like to express my deepest appreciation to all those who provided me the
possibility to complete this thesis. I would like to show my greatest appreciation to Professor
Qiao Lin for his guidance and continuous support in my Ph.D. research. A special gratitude I
give to Professor Milan Stojanovic for his insightful comments and encouragement. My sincere
thanks also go to Professor Richard Kessin, as well as Drs. Herbert Ennis, Renjun Pei, and
Kyung-Ae Yang for their enormous help on my research projects. Furthermore, I would like to
thank my wife, Bo, for her love, great patience, and support she has shown during the past years.
My parents, brother, sisters, and parents-in-law have given me their unequivocal support
throughout, as always, for which my mere expression of thank likewise does not suffice. I would
like to thank my lab members and the Mechanical Engineering department at Columbia
University for their help and support. Finally, I gratefully acknowledge financial support from
our funding agencies, the National Science Foundation and the National Institutes of Health.
vi
List of Figures
Chapter 1
Figure 1.1. (a) Schematic representation of aptamer A1 with its protein target thrombin and (b)
the secondary structure of aptamer DISS.1 with steroid DIS bound to the hydrophobic pocket.
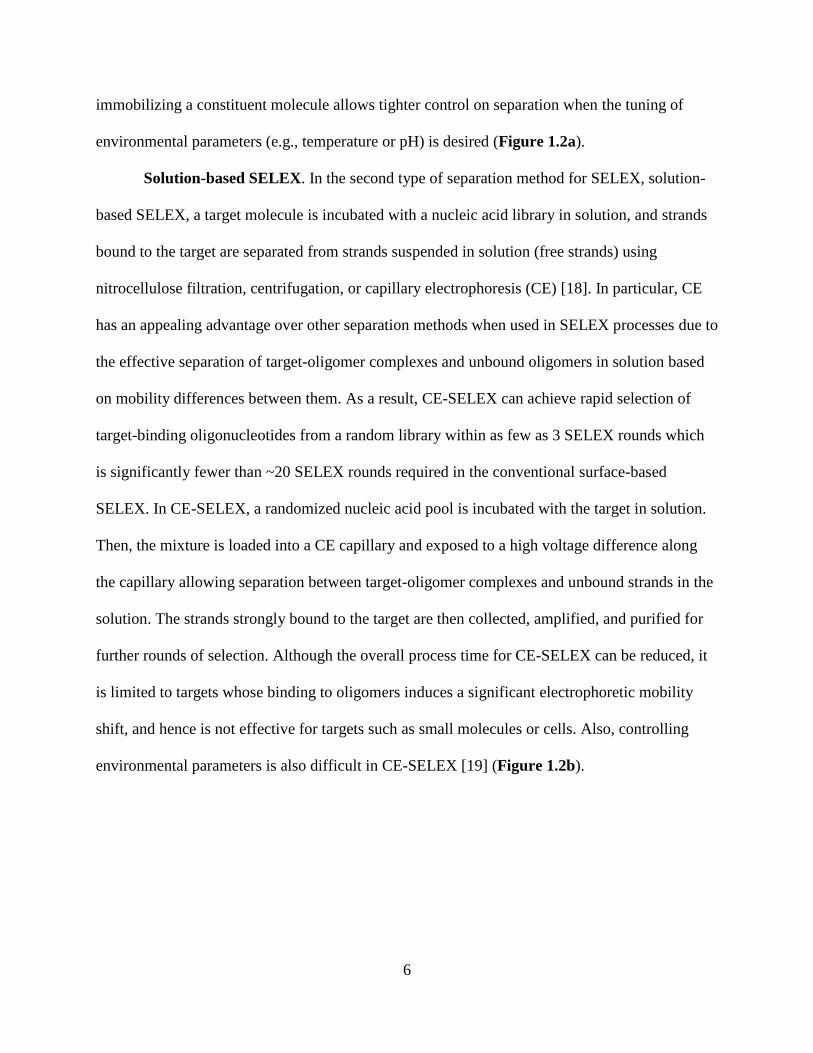
Figure 1.2. Schematic representation of (a) the conventional surface-based and (b) capillary
electrophoresis (CE)-based SELEX processes.
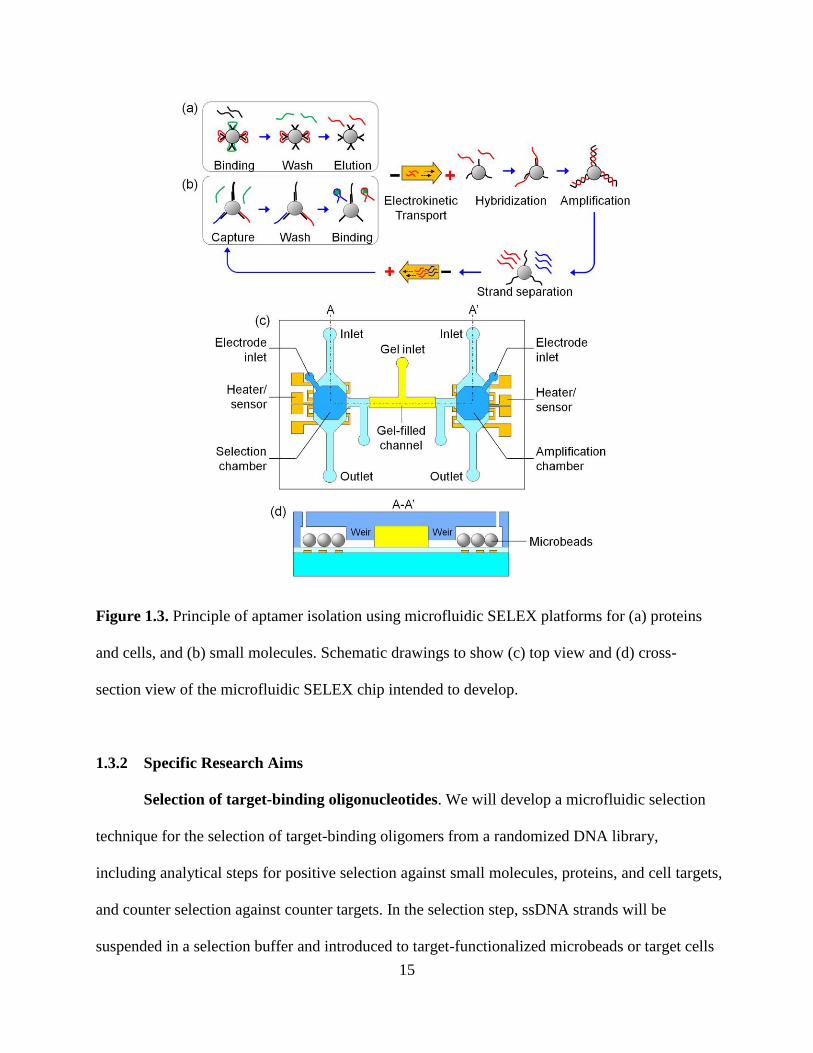
Figure 1.3. Principle of aptamer isolation using microfluidic SELEX platforms for (a) proteins
and cells, and (c) small molecules. Schematic drawings to show (c) top view and (d) cross-
section view of the microfluidic SELEX chip intended to develop.
Chapter 2
Figure 2.1. An illustration of isolation and enrichment of ssDNA in a microchip: (a) incubation
of target-functionalized beads with ssDNA mixture, (b) wash of the loosely bound ssDNA from
the beads, (c) elution of strongly bound ssDNA from the beads by heating, and (d)
electrophoretic transport of the eluted ssDNA to the enrichment chamber.
Figure 2.2. Schematic of the microchip for ssDNA isolation and enrichment.
Figure 2.3. Fabrication process for the microchip. (a-b) UV exposures on the 1st and 2nd SU-8
photoresist layers. (c) SU-8 mold developed. (d) Casting PDMS layer using the SU-8 mold. (e)
UV exposure on the positive photoresist on Au/Cr bilayer on a glass substrate. (f) Developing the
photoresist. (g) Etching the Au/Cr bilayer in etchants to realize the resistive heater. (h) Removing
the photoresist residue on the heater. (i) Deposition of SiO2 on the heater using PECVD. (j)
Packaged microchip with tubing and microchannel filled with agarose gel.

vii
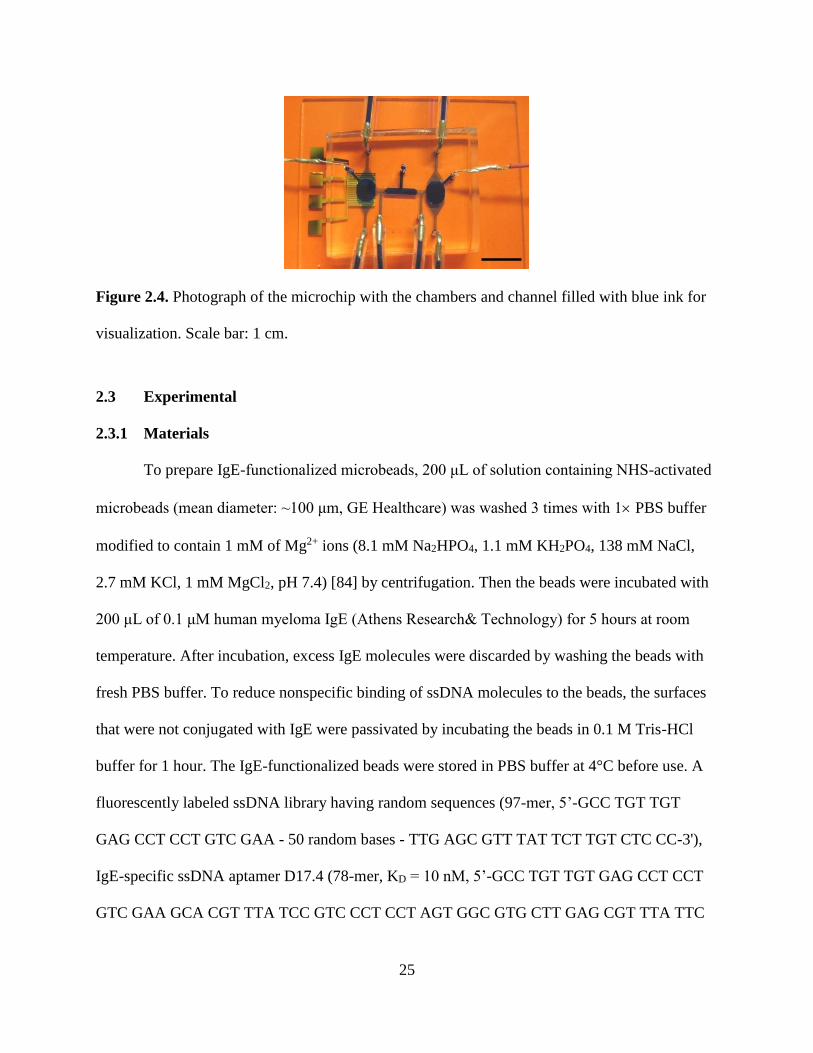
Figure 2.4. Photograph of the microchip with the chambers and channel filled with blue ink for
visualization. Scale bar: 1 cm.
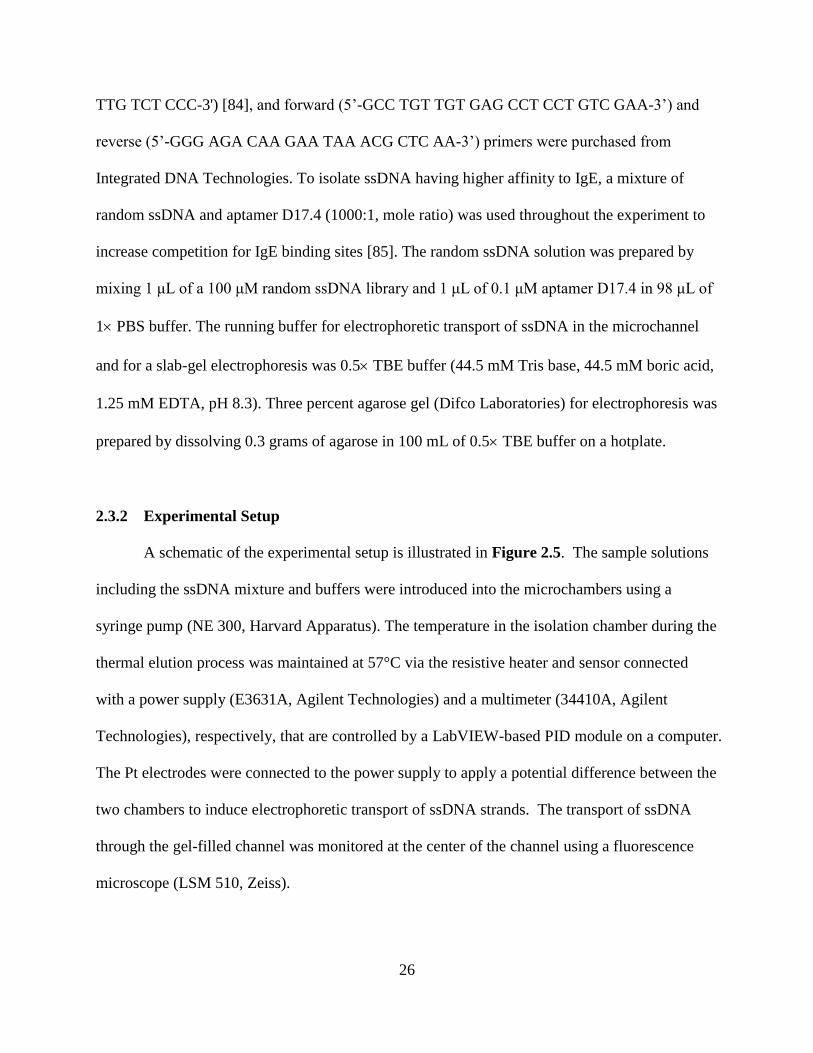
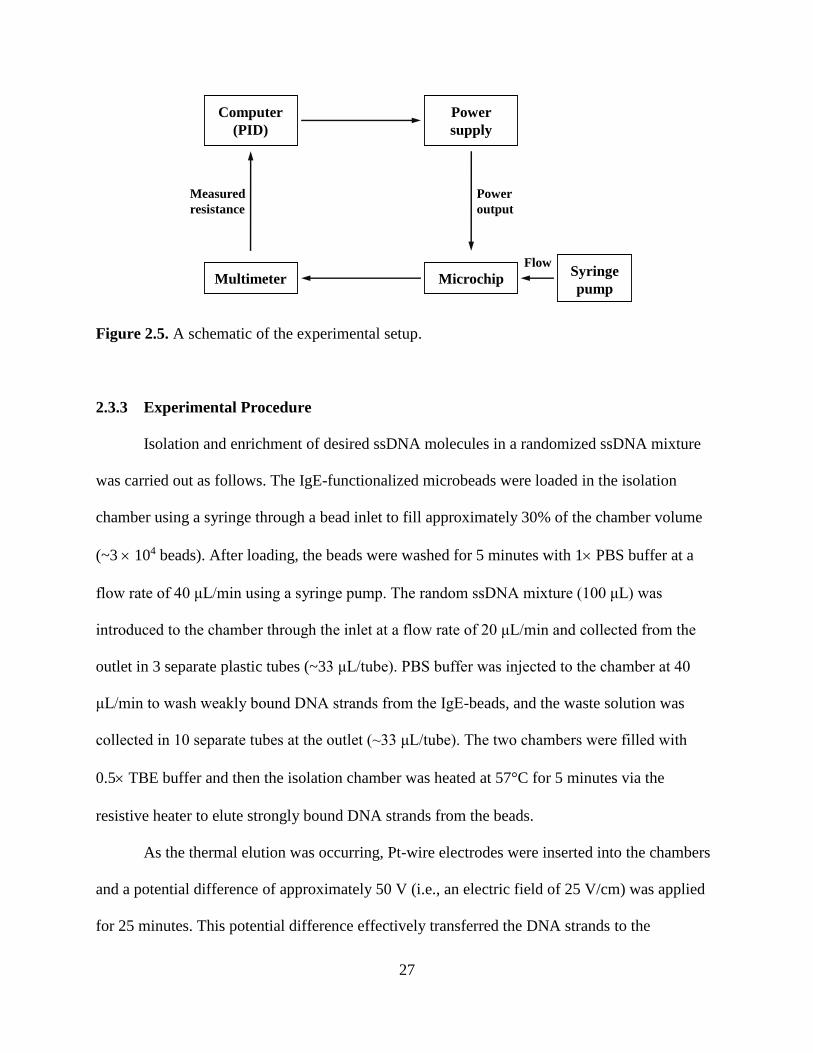
Figure 2.5. A schematic of the experimental setup.
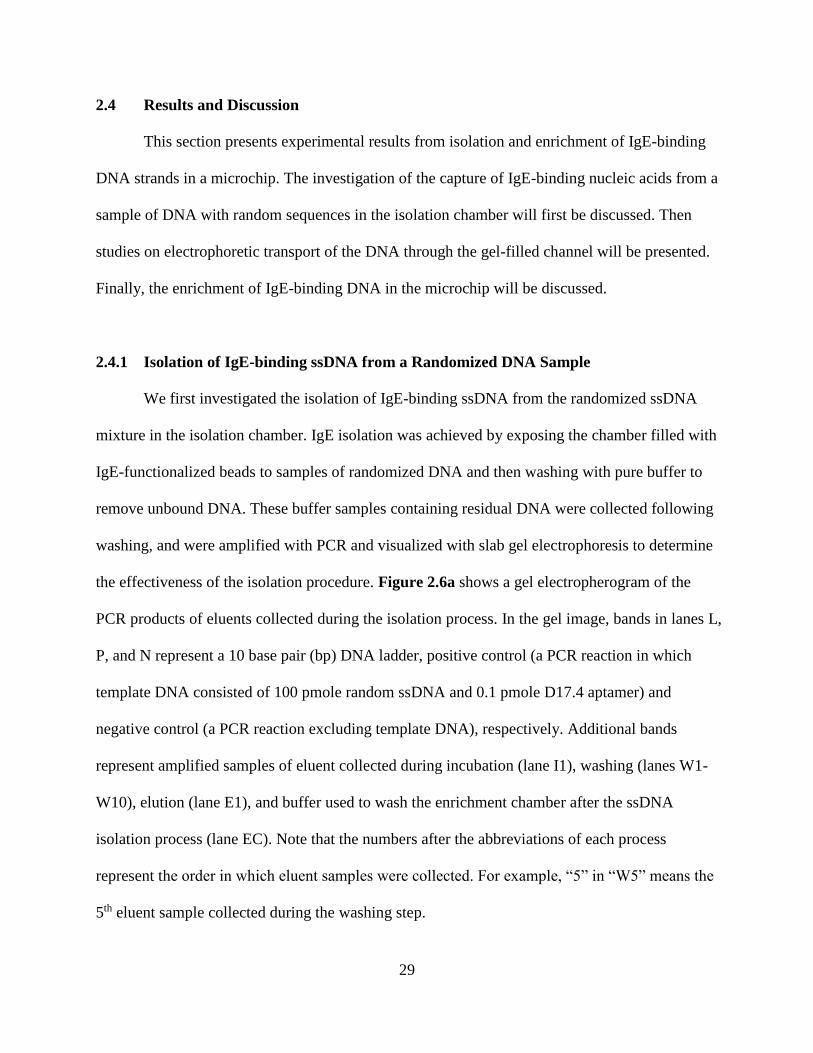
Figure 2.6. (a) Gel electropherogram of amplified eluents obtained during the isolation process.
(b) Bar graph depicting band intensity for lanes I1–E1. Lane L: 10 bp ladder; Lane P: positive
control; Lane N: negative control; Lane I1: incubation 1; Lane W1: wash 1; Lane W5: wash W5;
Lane W10: wash 10; Lane E1: elution 1; and Lane EC: amplified eluent from enrichment
chamber.
Figure 2.7. (a) Gel electropherogram of amplified eluents obtained during the control
experiment. (b) Bar graph depicting band intensity for lanes I1–E1. Lane L: 10 bp ladder; Lane
P: positive control; Lane N: negative control; Lane I1: incubation 1; Lane W1: wash 1; Lane W5:
wash 5; Lane W10: wash 10; Lane E1: elution 1; and Lane EC: amplified eluent from
enrichment chamber.
Figure 2.8. Electrophoresis of the ssDNA through the gel-filled microchannel using different
electrolytes. Lane L: 10 bp ladder and Lane P: positive control. Lanes PBS and TBE: eluents
collected from the enrichment chamber after electrophoresis using 1× PBS buffer and 0.5× TBE
buffer, respectively.
Figure 2.9. Electrophoretic transport of fluorescently labeled ssDNA through the gel under an
electric field of 25 V/cm at different times: (a) t = 0 min, (b) t = 10 min, (c) t = 20 min, and (d)
fluorescence intensity as a function of time monitored at the center of the gel-filled channel.
Scale bar: 100 μm.
Figure 2.10. Gel electropherogram of eluents obtained from the isolation and enrichment
chambers after one round of isolation and enrichment experiment. Lane L: 10 bp ladder; Lane P:

viii
positive control; Lane N: negative control; Lanes I1–I3: incubations 1–3; and LanesW1–W10:
washes 1–10. Lanes EC1–EC3 and IC1–IC3: eluents 1–3 from the enrichment chamber and the
isolation chamber, respectively, collected after completed processes.
Figure 2.11. (a) Gel electropherogram of eluents obtained from the enrichment chamber
following PCR amplification. (b) Bar graph depicting band intensities of the eluents. Lane L: 10
bp ladder; Lanes 1–3: eluents from the enrichment chamber after 1, 2, and 3 enrichment
processes, respectively. Error bars denote standard deviation of three independent experiments.
Chapter 3
Figure 3.1. Schematic of the microchip for investigation of binding interaction between nucleic
acids and cells.
Figure 3.2. (a) Photograph of the microchip filled with blue ink for visualization. Scanning
electron microscope images of (b) the microweir in the capture chamber with dimensions and (c)
the micropillars on the weir.
Figure 3.3. Principle of capture and isolation of cell-binding ssDNA in a microchip.
Figure 3.4. Micrographs of MCF-7 cells trapped by the weir in the capture chamber (a)
following a cell injection and (b) after a buffer wash.
Figure 3.5. Finite element simulation results. (a) Top view of the electric potential distribution in
the microchip and (b) an electric potential profile along the dotted line in the inset figure
showing cross-section at a weir structure.
Figure 3.6. Micrographs of MCF-7 cells in the capture chamber (a) before and (b) after 20
minutes of electrochemical cell lysis via hydroxide ions generated at the cathode.
ix
Figure 3.7. Bar graph depicting band intensity in gel electrophoresis of eluents obtained during
the capture process of ssDNA to cells. Inset: Gel electropherogram for (a) MCF-7 cells and (b)
negative control without cells. (Lanes W: wash, S: separation)
Figure 3.8. Fluorescence intensity of fluorescently labeled ssDNA obtained in the collection
chamber following different lengths of time for electrophoretic DNA transport on-chip.
Chapter 4
Figure 4.1. Illustration of ssDNA isolation and amplification using the microchip: (a) incubation,
(b) wash, (c) elution, (d) electrophoretic transport, (e) hybridization, (f) PCR amplification, and
(g) denaturation and release.
Figure 4.2. An image of the microchip. The chip is filled with red ink for visualization.
Figure 4.3. (a) Gel electropherogram of amplified eluents obtained from the isolation chamber.
(b) Band intensity of each lane. Lanes 1: positive, 2: negative, 3: incubation, 4-6: washes, 7:
elution, 8: wash from the PCR chamber.
Figure 4.4. Changes in fluorescence intensity of primer-coated microbeads in the PCR chamber
following capture of ssDNA.
Figure 4.5. Changes in fluorescence intensity of DNA-hybridized beads in the PCR chamber as
a function of the number of PCR cycles.
Chapter 5
Figure 5.1. Principle of nucleic acid isolation and amplification using the device for (a) small
molecules, and (b) target protein and cells.
Figure 5.2. Schematic of the microfluidic device with dimensions.
x
Figure 5.3. Photograph of the microfluidic device. Scale bar: 10 mm
Figure 5.4. Micrographs of (a) microbeads and (b) MCF-7 cells captured by the weir structures
in the isolation chamber. Scale bar: 500 μm.
Figure 5.5. Gel electropherograms of amplified eluents obtained during the ssDNA isolation
against (a) DCA, (b) human IgE protein, and (c) MCF-7 cells. (d) Bar graph depicting the band
intensities. (Lanes W: wash and E: elution)
Figure 5.6. Fluorescence measurements for determination of binding affinity of the isolated
DNA pool (10 pmole) to human IgE protein.
Figure 5.7. Changes in fluorescence intensity of DNA-hybridized beads after 20 cycles of PCR
in the amplification chamber. Inset: Fluorescence images of the beads before and after the
amplification.
Chapter 6
Figure 6.1. Overall experimental design and procedure. Schematics of microchips are shown for
aptamer enrichment (a) for protein and small molecule targets (Chip I), and (b) for cell targets
(Chip II). (c) Photograph of Chip I; the inset image shows beads retained in a chamber by a weir
structure. (d) Photograph of Chip II; the inset image shows cells retained in a chamber by a weir
structure. For visualization, the agarose gel was dyed with blue ink during melting.
Oligonucleotides are selected that bind to (e) proteins, (f) small molecules, and (g) cell targets in
the selection chambers of the chips. (h) Oligonucleotides are transferred by electrokinetic
transport through a gel-filled channel between the chambers. (i) The selected strands are
amplified by PCR on bead surfaces in the amplification chamber. (j) Experimental setup of
aptamer enrichment using the chips.
xi
Figure 6.2. Schematics of pH control in the chips during electrokinetic transfer of ssDNA
strands. Buffer is introduced into the chips (flow rate: 1 μL/min) to minimize the pH changes in
the chambers. In the experiment for protein targets, buffer is introduced into (a) the amplification
chamber and (b) the selection chamber through the supplementary inlets during transport of
DNA strands to the direction indicated by the dotted lines. In the experiment for small molecule
targets, (c) buffer is introduced into the amplification chamber while solution containing target
molecules is injected into the selection chamber during DNA transport into the amplification
chamber. (d) Buffer is introduced into the selection chamber through an inlet during DNA
transport into that chamber. In the experiment for cell targets, buffer flow is introduced into (e)
the amplification chamber and (f) the selection chamber through a supplementary inlet and the
chamber inlet during transport of DNA strands.
Figure 6.3. Gel electropherograms for selection of target-binding nucleic acids. (a) A gel image
of eluents obtained during selection of IgE-binding ssDNA and (b) a bar graph depicting the
relative band intensity in the gel image. As a control, bare beads were used for the selection
experiment. (c) A gel image of eluents obtained during selection of ssDNA that bind to glucose-
boronic acid complex and (d) a bar graph depicting the relative band intensity in the gel image.
(e) A gel image of eluents obtained during selection of ssDNA that bind to MCF-7 cells and (f) a
bar graph depicting the relative band intensity in the gel image. As a control, the selection
experiment was performed using a microchamber without a presence of target cells. All
experiments were performed more than 3 times using each target and representative gel images
are shown here. Lane W: wash; Lane E: elution; Lane C: counter selection.
Figure 6.4. Microchip characterizations for electrokinetic transfer and bead-based amplification
of target-binding strands. (a) Fluorescence intensity measurement at the center of the gel-filled
xii
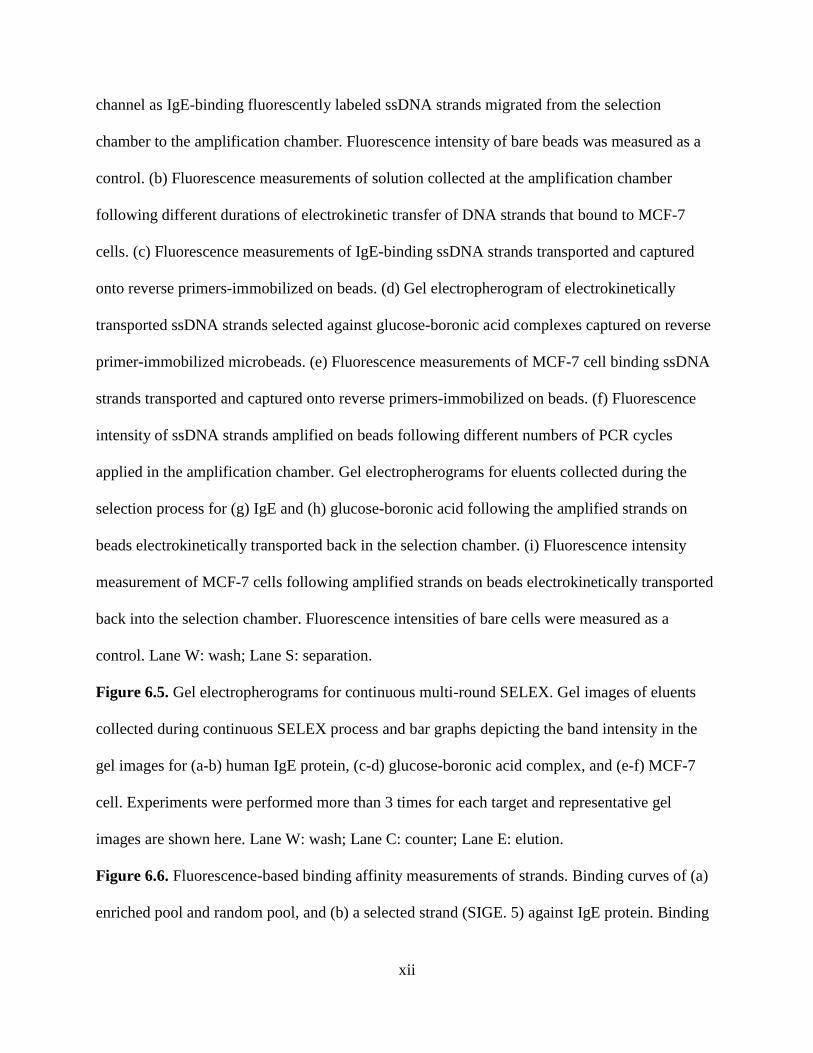
channel as IgE-binding fluorescently labeled ssDNA strands migrated from the selection
chamber to the amplification chamber. Fluorescence intensity of bare beads was measured as a
control. (b) Fluorescence measurements of solution collected at the amplification chamber
following different durations of electrokinetic transfer of DNA strands that bound to MCF-7
cells. (c) Fluorescence measurements of IgE-binding ssDNA strands transported and captured
onto reverse primers-immobilized on beads. (d) Gel electropherogram of electrokinetically
transported ssDNA strands selected against glucose-boronic acid complexes captured on reverse
primer-immobilized microbeads. (e) Fluorescence measurements of MCF-7 cell binding ssDNA
strands transported and captured onto reverse primers-immobilized on beads. (f) Fluorescence
intensity of ssDNA strands amplified on beads following different numbers of PCR cycles
applied in the amplification chamber. Gel electropherograms for eluents collected during the
selection process for (g) IgE and (h) glucose-boronic acid following the amplified strands on
beads electrokinetically transported back in the selection chamber. (i) Fluorescence intensity
measurement of MCF-7 cells following amplified strands on beads electrokinetically transported
back into the selection chamber. Fluorescence intensities of bare cells were measured as a
control. Lane W: wash; Lane S: separation.
Figure 6.5. Gel electropherograms for continuous multi-round SELEX. Gel images of eluents
collected during continuous SELEX process and bar graphs depicting the band intensity in the
gel images for (a-b) human IgE protein, (c-d) glucose-boronic acid complex, and (e-f) MCF-7
cell. Experiments were performed more than 3 times for each target and representative gel
images are shown here. Lane W: wash; Lane C: counter; Lane E: elution.
Figure 6.6. Fluorescence-based binding affinity measurements of strands. Binding curves of (a)
enriched pool and random pool, and (b) a selected strand (SIGE. 5) against IgE protein. Binding

xiii
curves of (c) enriched pool and random pool, and (d) a selected strand (SGB. 2) against glucose-
boronic acid complex. (e) Flow cytometry measurements of cells incubated with enriched pool
and random pool, and bare cells. (f) A binding curve of a selected strand (SMCF. 1) against
MCF-7 cells.

xiv
Nomenclature
V
E
μ
M
KD
Tf
NAf
T:NA
Velocity
Electric field
Electrophoretic mobility
Molar
Dissociation constant
Free target
Free nucleic acid
Target-nucleic acid complex
xv
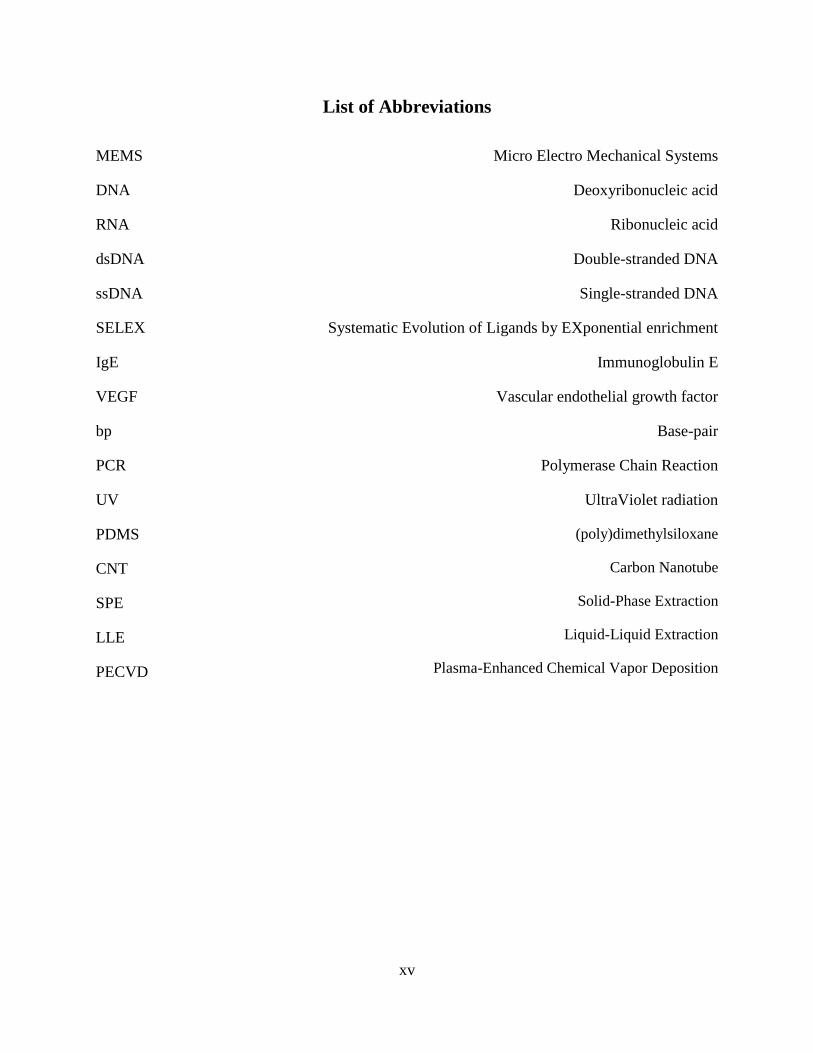
List of Abbreviations
MEMS
DNA
RNA
dsDNA
ssDNA
SELEX
IgE
VEGF
bp
PCR
UV
PDMS
CNT
SPE
LLE
PECVD
Micro Electro Mechanical Systems
Deoxyribonucleic acid
Ribonucleic acid
Double-stranded DNA
Single-stranded DNA
Systematic Evolution of Ligands by EXponential enrichment
Immunoglobulin E
Vascular endothelial growth factor
Base-pair
Polymerase Chain Reaction
UltraViolet radiation
(poly)dimethylsiloxane
Carbon Nanotube
Solid-Phase Extraction
Liquid-Liquid Extraction
Plasma-Enhanced Chemical Vapor Deposition
1
Chapter 1. Introduction
1.1 Background
Overview of aptamers. Aptamers are oligonucleotides (i.e., ssDNA or RNA) that bind to
small molecules or proteins with high affinity. Aptamers are isolated through an in vitro
selection and amplification procedure called systematic evolution of ligands by exponential
enrichment (SELEX), which is based on affinity selection and amplification of target-binding
oligonucleotides from large random libraries [1, 2]. Aptamers can be obtained for an extremely
broad spectrum of analytes with high affinity, can possess well controlled target selectivity, and
can bind to targets with predefined characteristics in equilibrium, kinetic, thermodynamic, and
stimuli responsive properties [3]. For example, aptamer binding in general exhibits strong
temperature dependence, as confirmed by our preliminary results. This is due to the thermal
sensitivity of secondary structures of nucleic acids which are believed to be a mechanism by
which aptamers interact with targets [4, 5]. The properties of aptamers are very attractive in
many biological applications, such as analyte purification in which one or more analytes are
isolated from a complex mixture [6], highly specific and sensitive detections of bioanalytes when
integrated into biosensors [7], and the modulation of specific functions of proteins through
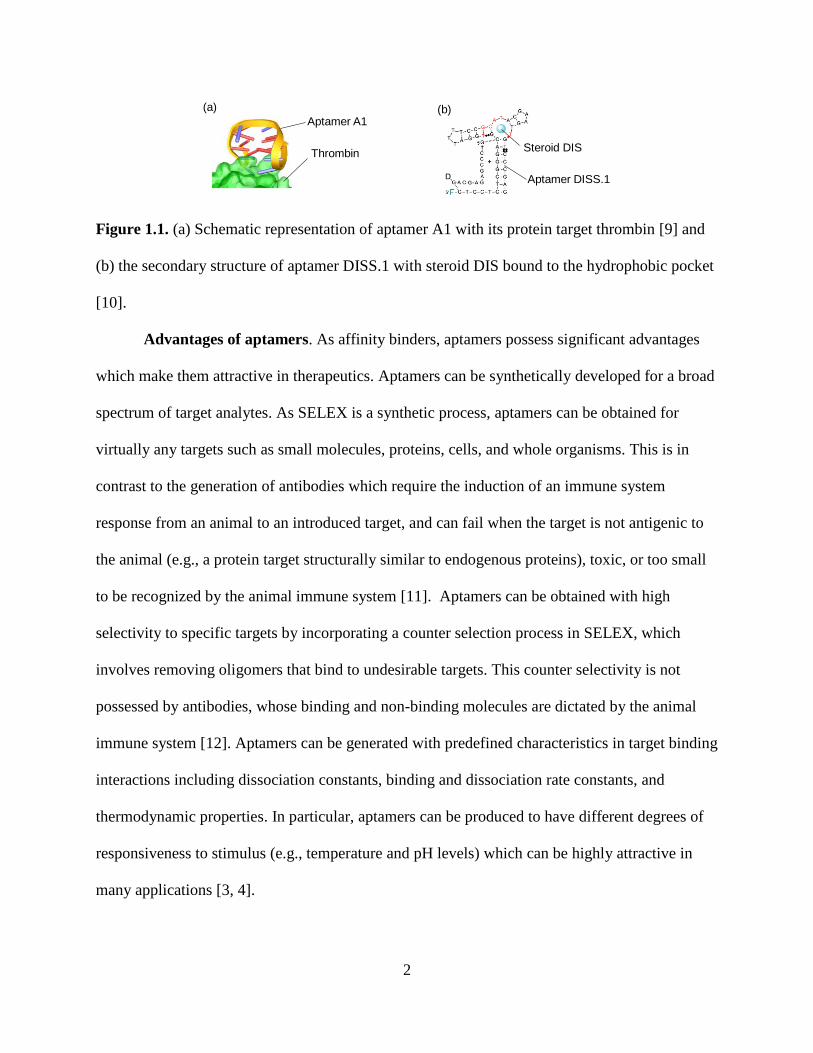
binding interactions [5, 8]. Figure 1.1 illustrates two examples of aptamers, one of which binds
to the protein thrombin [9] (Figure 1.1a) and the other to dehydroisoandrosterone 3-sulfate
sodium salt dihydrate (DIS, steroid hormone) [10] (Figure 1.1b).
2
Thrombin
Aptamer A1
Steroid DIS
Aptamer DISS.1
(a) (b)
Figure 1.1. (a) Schematic representation of aptamer A1 with its protein target thrombin [9] and
(b) the secondary structure of aptamer DISS.1 with steroid DIS bound to the hydrophobic pocket
[10].
Advantages of aptamers. As affinity binders, aptamers possess significant advantages
which make them attractive in therapeutics. Aptamers can be synthetically developed for a broad
spectrum of target analytes. As SELEX is a synthetic process, aptamers can be obtained for
virtually any targets such as small molecules, proteins, cells, and whole organisms. This is in
contrast to the generation of antibodies which require the induction of an immune system
response from an animal to an introduced target, and can fail when the target is not antigenic to
the animal (e.g., a protein target structurally similar to endogenous proteins), toxic, or too small
to be recognized by the animal immune system [11]. Aptamers can be obtained with high
selectivity to specific targets by incorporating a counter selection process in SELEX, which
involves removing oligomers that bind to undesirable targets. This counter selectivity is not
possessed by antibodies, whose binding and non-binding molecules are dictated by the animal
immune system [12]. Aptamers can be generated with predefined characteristics in target binding
interactions including dissociation constants, binding and dissociation rate constants, and
thermodynamic properties. In particular, aptamers can be produced to have different degrees of
responsiveness to stimulus (e.g., temperature and pH levels) which can be highly attractive in
many applications [3, 4].
3
Aptamers for analyte extraction. Because of their advantages mentioned above,
aptamers present relatively higher applicability than traditional affinity ligands such as
antibodies in various biological applications. In particular, aptamers can be integrated into
microfluidic chips to extract and purify target analytes from a complex mixture. Purification of
analytes in biological mixtures is an essential process in many biological assays for amplifying
relevant analytes before introduction into a subsequent quantitative analysis procedure. For
example, proteins are cultivated from biological tissue or cell lysates, and as such are typically
mixed with undesired particulates and cellular debris in addition to salts and reagents used for
lysis. Thus, purification of such proteins is generally necessary and often vital for
characterization of the structure, function and interactions of proteins. Solid phase extraction
(SPE) is a commonly used procedure for the purification of analytes, in which a target analyte is
captured from a liquid medium by a solid surface via hydrophobic or electrostatic interactions
between analytes and the solid phase. However, this method is inherently nonspecific in that in
addition to the target, impurities can be also retained in the solid phase. In contrast, alternative
SPE methods using specific affinity binding between target and ligand molecules do not suffer
from this problem. Thus, aptamers can be integrated into microfluidic chips for the purification
of analytes using affinity-based target extraction [13, 14].
Aptamers for target detection. Aptamers have been actively investigated for their usage
as receptors in applications involving highly sensitive detection of target analytes. Using carbon
nanotubes (CNTs) or graphene functionalized with aptamers, label-free detection of targets in
sample solutions was achieved by monitoring changes in the electrical signals upon capture of
targets to the aptamers on the sensor surfaces. Due to the extremely small size which is typically
in the range of several nanometers, aptamers posses great advantages over antibodies (length: ~
4
10-15 nm) for full exploitation of nanomaterials. It has been shown that aptamer-functionalized
graphene and CNTs can be used to specifically detect analytes such as human Immunoglobulin E
(IgE) [15] and thrombin [7], respectively, offering target-specific detection.
Aptamers for in vivo therapeutic applications. Aptamers can be used as therapeutic
agents to inhibit the activity of clinically significant proteins by disrupting their interactions with
other proteins in the human body [4]. For example, cell membrane receptors are comprised of
proteins which are susceptible to being activated or inactivated by interacting with ligands. By
binding to the receptors, aptamers can interrupt the receptor-ligand interaction in the
extracellular domain and result in the inhibition of intercellular responses such as disease-related
cellular activities [5]. One of the most prominent therapeutic aptamers is Macugen (or
Pegaptanib) which is a RNA aptamer directed against a protein called vascular endothelial
growth factor (VEGF) [16]. Macugen is an aptamer-based drug for the treatment of neovascular
age-related macular degeneration (AMD), a deterioration of the central portion of the retina,
which is caused by uncontrollable growth of blood vessels induced by VEGF. Macugen binds to
VEGF with high specificity and affinity, and inhibits it from binding to its cellular receptors
thereby disrupting the proliferative and vascular responses in endothelial cells and resulting in
the inhibition of vascular development of patients with AMD [17].
1.2 Protocols and Platforms for Aptamer Isolation
1.2.1 Aptamer Isolation Method
Aptamers are isolated through the in vitro SELEX procedure, which is based on an
affinity selection process, followed by the amplification of target-binding nucleic acids from
large random libraries. The SELEX procedure involves iterative cycles of in vitro selection and

5
amplification that mimic a Darwinian type process driving the selection towards optimized
structural motifs in oligomers for ligand binding. A SELEX process typically starts with
preparing a chemically synthesized random DNA library consisting of approximately 1013-1015
sequences in a solution. The randomized pool is incubated directly with the target. The strands
strongly bound to targets are subsequently partitioned from unbound and weakly bound strands,
and amplified via PCR. The resulting double-stranded sequences are separated into single-strand
sequences to be used for binding reactions with the target in the next SELEX round. By iterative
cycles of selection and amplification the initial random oligonucleotide pool is reduced to
relatively few sequence motifs with high binding affinity and specificity for the target. Negative
and counter selection steps can be incorporated in the SELEX process to improve specificity of
the oligonucleotides by removing undesirable strands. To effectively select oligonucleotides with
high binding affinity, stringent selection conditions such as stringent washing or reduced target
concentrations could be used in a SELEX process [18].
1.2.2 Conventional SELEX Platforms for Aptamer Isolation
Surface-based SELEX. During the isolation of aptamers from a large random nucleic
acid library, each round of SELEX involves separating target binding strands from non-binding
strands. Two general separation methods, surface-based and solution-based methods, are
typically used in this regard. In the first method, surface-based SELEX, targets are immobilized
onto a solid-phase extraction (SPE) material (e.g., agarose or magnetic beads). Binding
oligomers are captured by the immobilized targets on the bead surfaces, and then eluted
chemically, thermally, or with a target solution via competitive bindings. This method is most
generally applicable to a variety of targets including proteins, peptides, and cells. Additionally,
6
immobilizing a constituent molecule allows tighter control on separation when the tuning of
environmental parameters (e.g., temperature or pH) is desired (Figure 1.2a).
Solution-based SELEX. In the second type of separation method for SELEX, solution-
based SELEX, a target molecule is incubated with a nucleic acid library in solution, and strands
bound to the target are separated from strands suspended in solution (free strands) using
nitrocellulose filtration, centrifugation, or capillary electrophoresis (CE) [18]. In particular, CE
has an appealing advantage over other separation methods when used in SELEX processes due to
the effective separation of target-oligomer complexes and unbound oligomers in solution based
on mobility differences between them. As a result, CE-SELEX can achieve rapid selection of
target-binding oligonucleotides from a random library within as few as 3 SELEX rounds which
is significantly fewer than ~20 SELEX rounds required in the conventional surface-based
SELEX. In CE-SELEX, a randomized nucleic acid pool is incubated with the target in solution.
Then, the mixture is loaded into a CE capillary and exposed to a high voltage difference along
the capillary allowing separation between target-oligomer complexes and unbound strands in the
solution. The strands strongly bound to the target are then collected, amplified, and purified for
further rounds of selection. Although the overall process time for CE-SELEX can be reduced, it
is limited to targets whose binding to oligomers induces a significant electrophoretic mobility
shift, and hence is not effective for targets such as small molecules or cells. Also, controlling
environmental parameters is also difficult in CE-SELEX [19] (Figure 1.2b).
7
Figure 1.2. Schematic representation of (a) the conventional surface-based and (b) capillary
electrophoresis (CE)-based SELEX processes.
SELEX using robotic automation. Ellington and coworkers investigated an approach
which integrates SELEX procedures into a system using a modified robotic workstation for
manipulations of samples and reagents. Although this system did not employ microfluidic
technology, it demonstrated the potential for a SELEX process involving minimal human
intervention. The workstation was integrated with additional equipment such as a thermal cycler
for PCR amplification of nucleic acid strands, a magnetic bead separator for bead manipulation,
a vacuum filtration manifold for washing beads, and a Peltier cooler to control the temperature.
Using the integrated system, 12 selection rounds for target-binding oligomers were completed
within two days. Although, this system demonstrated rapid selection of aptamer candidate, it
requires a high equipment cost due to the multiple instruments needed for processes such as flow
and bead manipulations. In addition, large amounts of sample and reagents are required to
aptamer selection using the system due to the bulky system size. Therefore, a miniaturized
system which reduces sample consumption and equipment cost is highly desirable [20, 21] .
8
1.2.3 Microfluidic Technology for Aptamer Isolation
Benefits of microfluidic technology as applied to SELEX. There have been efforts to
employ microfluidic technology for rapid and automated aptamer isolation, primarily using
surface-based separation methods, to address issues in the conventional SELEX platforms
associated with the tedious and labor-intensive individual procedures. It is because microfluidic
technology can offer a high level of integration and miniaturization for SELEX by enabling the
integration of the individual essential SELEX steps on a single device with feature sizes
spanning submicrons to millimeters. Due to the miniaturized size, microfluidic SELEX devices
would enable generation of target-binding strands with greatly reduced sample consumption and
assay time. In addition, automation of SELEX process on microfluidic devices could be greatly
simplified owing to the integration of the essential SELEX processes in a single device.
Microfluidic SPE techniques for the capture of molecular analytes. Microfluidic
solid-phase extraction (SPE) has been investigated extensively to capture target analytes in a
solution with solid surfaces (e.g., microbeads) functionalized with molecules that can specifically
interact with the target [22-24]. In microfluidic SPE, a target analyte is captured on functional
surfaces while impurities and undesirable substances that may be present in the solution are
removed. Following analyte capture and purification processes, the analyte can be exposed to a
fresh solution with a specific pH or ionic strength that disrupts the analyte binding interaction
and releases it from the surface for further downstream analysis [25, 26]. Effective extraction of
analytes in solution has been demonstrated with SPE on microfluidic platforms. For example,
microchips that incorporate SPE using silica [26-28], polymer [29-31], and magnetic [32, 33]
beads were used to collect DNA strands in sample solutions through the adsorption of the strands
on the bead surfaces. In addition, a significantly enhanced enrichment of target molecules has
9
been achieved using microfluidic SPE incorporated with solid-surfaces functionalized with
target-binding molecules such as antibodies [34-36] or aptamers [37-39] by repeatedly
incubating the functional surface to the target solution. Because of its capability to effectively
extract target analytes, microfluidic SPE can be adapted for use in aptamer selection. Specifically,
microbeads can be functionalized with a target analyte which are then exposed to a randomized
oligomer library in a microfluidic device. While strands weakly bound to the target are removed
with buffer wash, strands strongly bound can be released into solution and collected for
additional processes required for aptamer generation such as amplification and purification of the
target-binding strands. This microfluidic surface-based capture method of aptamers can be
particularly useful for the effective generation of aptamers in microfluidic devices because it can
greatly simplify the SELEX on chip eliminating processes required to separate target-binding
strands in a random library. Specifically, microbeads can be functionalized with a target analyte
which will then be exposed to a randomized oligomer library in a microfluidic device. While
strands weakly binding to the target are removed with buffer wash, strongly bound strands can be
released into a solution and collected for further processes required for aptamer generation such
as amplification and purification of the target-binding strands.
Microfluidic PCR for amplification of DNA. Microfluidic PCR techniques have
demonstrated to amplify nucleic acids efficiently. In typical microfluidic PCR, DNA strands are
amplified in a stationary solution containing PCR reagents in a microchamber via thermocycling
[40-42]. Due to large surface-to-volume ratios, rapid heat transfer can occur in microfluidic PCR
realizing a significant reduction in the time required for PCR amplification. In addition,
miniaturization of microfluidic PCR devices leads to decreased sample and reagent consumption
necessary for PCR, and increased device portability and integration. Consequently, microfluidic
10
PCR has been widely studied for biomedical and bioanalytical applications [43-45].
Alternatively, PCR solutions can be continuously flowed over different temperature zones
necessary for DNA amplification in a device. The continuous-flow based PCR microdevices
demonstrated rapid DNA amplification due to very short solution heating and cooling times
during thermocycling [46-48]. Recently, surface-based PCR incorporated in microfluidic
platforms was demonstrated for the first time by our group. In our surface-based PCR device,
reverse-primer strands were directly attached onto microbeads to which DNA templates were
captured and amplified by PCR [49, 50]. We envision that our microfluidic PCR device could
find its utility in many biological applications because it does not require complicated
purification processes of the PCR product such as gel electrophoresis or column purification. In
particular, our surface-based microfluidic PCR would be well suited for microfluidic aptamer
selection and amplification since it offers flexibility in handling of DNA strands on-chip
eliminating tedious DNA purification procedures.
Microfluidic approaches to SELEX. The first microfluidic SELEX system was
reported by Hybarger et al. [51]. In the system, fused-silica microlines (i.e., capillary tubes)
functionalized with a protein target were used as reaction vessels and affinity surfaces for the
isolation of target-binding RNA strands. Samples and reagents were introduced into the
microlines in the system via a pressurized reservoir manifold and manipulated using external
valves and pumps controlled by a computer. A conventional thermal cycler was discretely
assembled and interfaced to the system for the amplification of target-binding strands.
Transcription and reverse transcription of the strands were also achieved in the silica microlines
to which reagents required for reactions were introduced by the computer manipulated flow
control instruments. This system demonstrated a drastic reduction in the need for manual sample
11
transfer between individual components during aptamer isolation process. However, the
requirement of extensive manual assembly implies that the system can be labor-intensive to
construct and have limited reliability. In addition, the large thermal mass of the conventional
PCR thermocycler and limited miniaturization inhibits further reduction in the overall selection
time.
Microfluidic devices to improve the selection of target-binding strands were developed
by Soh and coworkers [52, 53]. The devices prepared were capable of generating highly
localized magnetic field gradients via ferromagnetic patterns imbedded in microchannels
enabling precise manipulation of small numbers of magnetic beads. For aptamer isolation,
random DNA library was incubated with magnetic beads functionalized with a target. Following
the incubation, the bead sample and wash buffer were introduced into the device using
independently controlled syringe pumps. While the beads were guided by the combination of
hydrodynamic and magnetic forces, weak- and un-bound DNA strands to the target were
effectively removed and directed into waste outlets in the device. As a result of stringent wash
conditions provided during selection of strong binders to the target, rapid generations of DNA
aptamers with great binding affinities were realized after a single round of SELEX [54]. An
evaluation of the selected strands using the high-throughput DNA sequencing technology
confirmed that target-binding strands isolated can be identified within a few SELEX rounds (~3
rounds). The devices demonstrated efficient removal of weakly bound and unbound strands from
a target. However, the devices are limited in that most of the essential processes required for
SELEX such as PCR amplification, strand separation, and strand purification were performed
off-chip using conventional methods [55].
12
Kim and coworkers developed a microfluidic chip for the isolation of aptamer candidates
by effectively capturing target-binding strands from a random RNA library. Target proteins were
embedded into an array of sol-gels and integrated into the chip to which random RNA library
was introduced for the binding reaction. While weakly binding strands were washed, strong-
binders on the sol-gel were selectively released by applying heat to a specific gel using a
resistive heater integrated into the chip. The selected RNA strands using the chip following
multiple rounds of target-binder isolation showed comparable improvements in binding affinities
of the strands as the ones selected using the conventional SELEX method [56, 57]. While
demonstrating efficient isolation of nucleic acids that bind to the target, this device require
additional off-chip processes to select target-binding strands such as amplification and
purification of the isolated strands.
Lee and coworkers [58] developed microfluidic chips for the selection of target-binding
nucleic acids in which samples and reagents were pneumatically manipulated. Strands that
strongly bound to the target were isolated from a random oligonucleotides library on target-
functionalized magnetic beads retained by a magnetic force in a chamber. The target-binding
strands were then transferred into another chamber via suction-based flow manipulation in which
they were amplified in solution via thermocycling [59, 60]. Although rapid generations of
aptamer candidates against protein and cell targets were achieved, the devices possess limitations
to realize the complete processes of the aptamer generation on a device. For example, ssDNA
strands generated from dsDNA in a PCR product by heating the solution would quickly
hybridize back to form dsDNA at a lower temperature which could cause inefficient selection of
target-binding ssDNA in following SELEX rounds. In addition, chemical immobilization of
target cells on bead surfaces could cause stress-induced cell death which may result in the uptake
13
of oligonucleotides by dead cells and thus selection of non-specific strands. Furthermore, device
automation could be difficult to achieve due to the manual delivery of PCR reagents into the
amplification chamber using a micropipette [61, 62].
Our efforts on bead-based aptamer isolation. In parallel efforts, our group [63] has
also pursued the application of microfluidics to SELEX on a platform that uses bead-based
selection and PCR approaches to integrate selection, amplification, and collection of protein-
binding nucleic acids. In the method we developed, oligonucleotides that strongly bind to a target
were isolated using target-functionalized beads in a microchamber, hydrodynamically transferred
into another chamber in which the strands were captured and amplified on primer-coated beads.
The strands amplified were then released into a buffer solution and hydrodynamically transferred
back in the selection chamber for additional SELEX rounds. The device achieved the selection
and amplification of target-binding oligonucleotides without additional off-chip processes. This
device, however, still required a complicated flow handling component on-chip such as a
pneumatic valve which is required to hydrodynamically manipulate DNA strands between
different chambers. Aiming to simplify the device design, preparation, and operation, this thesis
uses an alternative method for the DNA manipulation on-chip that also incorporates the bead-
based selection and amplification approaches for enrichment of target-binding strands.
1.3 Scope of Thesis Research
1.3.1 Objectives
Objectives. The goal of this thesis research is to demonstrate a microfluidic platform
towards integrating and automating SELEX process for isolation of aptamers targeting
biomolecules and cells, by exploring the integration of key functions including the selection,
14
manipulation, and amplification of target-binding oligomers. Surface-based selection and
amplification techniques in a microchamber will be investigated to establish the key parameters
for later integration in a complete microfluidic SELEX system. In addition, the electrokinetic
transport of DNA strands between different functional chambers will be characterized in the
system. The surface-based selection and amplification, and the electrokinetic DNA transfer
techniques will be integrated to enable microfluidic SELEX (Figure 1.3a-b).
The microfluidic SELEX system will consist of two microchambers for selection and
amplification of target-binding oligomers, respectively. To retain target-functionalized beads or
target cells, each chamber will have a dam-like weir structure to which the beads or cells can be
captured while buffers can pass through during experiments. A resistive heater and temperature
sensor will be integrated into each chamber for temperature control during selection and
amplification of target-binding strands. The two chambers will be connected by a microchannel
filled with a gel to prevent cross-contamination while allowing the electrokinetic transfer of
DNA strands. An electric field will be generated between the chambers for electrokinetic transfer
of DNA strands using electrodes inserted into the chambers (Figure 1.3c-d).
15
Figure 1.3. Principle of aptamer isolation using microfluidic SELEX platforms for (a) proteins
and cells, and (b) small molecules. Schematic drawings to show (c) top view and (d) cross-
section view of the microfluidic SELEX chip intended to develop.
1.3.2 Specific Research Aims
Selection of target-binding oligonucleotides. We will develop a microfluidic selection
technique for the selection of target-binding oligomers from a randomized DNA library,
including analytical steps for positive selection against small molecules, proteins, and cell targets,
and counter selection against counter targets. In the selection step, ssDNA strands will be
suspended in a selection buffer and introduced to target-functionalized microbeads or target cells
16
retained in a chamber. Target-binding oligomers will be captured by the beads or cells, while
non-binding and weakly bound strands will be removed with buffer. Target-binding oligomers
will then be released from the target.
Electrokinetic transfer of target-binding oligonucleotides. We will also investigate
electrokinetic transfer of target-binding strands, which are negatively charged, between different
functional microchambers in a microchip. The chambers will be connected by a microchannel
filled with a gel which physically separates the chambers that contain different buffers, while
allowing electrophoresis of oligomers. The electric field required for electrophoresis will be
generated via platinum-wire electrodes each inserted into a buffer-filled well connected to the
appropriate chamber.
Amplification of electrokinetically transferred oligonucleotides. We will design and
fabricate the amplification platform, in which target-binding oligomers will be amplified via
PCR. In the PCR platform, copies of a primer matching an appropriate end of the DNA library
are immobilized on microbeads using streptavidin-biotin coupling. The PCR process starts with
the capture of the target-binding strands onto the primers on beads followed by the introduction
of PCR reagents. Thermal cycling of the chamber will then result in the amplification of the
captured strands on the bead surfaces. Upon its completion, the amplification process will result
in dsDNA, consisting of the amplified ssDNA hybridized to the complementary DNA strands
immobilized on the beads.
Microfluidic SELEX by combining the individual functional components. With the
key functional components developed, we will combine them to form an integrated microfluidic
SELEX system. The system will consist of microfluidic selection and amplification components.
In the system, target-binding oligomers will be selected in the selection component and

17
electrokinetically transferred into the amplification component for amplification via bead-based
PCR. The amplified ssDNA strands will be separated from the beads and electrokinetically
transferred back into the selection chamber for additional SELEX rounds. These processes will
be repeated to achieve continuous SELEX for aptamer isolation against various targets.
1.3.3 Contribution of this Research
On-chip selection of target-binding DNA oligomers. Selection of target-binding
nucleic acids from random DNA library was demonstrated for proteins, small molecules,
and cell targets using the surface-based microfluidic selection method. In the microfluidic
devices, protein-functionalized beads, random DNA-immobilized beads, and targets cells
were retained in chambers by integrated weir structures. While weakly-binding strands
were effectively removed, strands that specifically bind to the targets were isolated and
collected during selection process.
Electrokinetic transfer of target-binding oligomers on-chip. The target-binding
oligomers were electrokinetically transferred between different functional microchambers
connected by a microchannel filled with a gel. An electric field was generated on-chip by
wire electrodes connected to a power supply and inserted into each chambers. Migration
of the target-binding strands was manipulated by the electric field generated on-chip. No
visible damage was found in the gel during electrophoresis for an extended period of time
(e.g., 3 hours) demonstrating effective physical separation between the chambers by the
gel.
Bead-based PCR on-chip with integration of electrokinetic transfer. The strands
electrokinetically transferred into the amplification chamber were captured onto primers
coated on microbeads by hybridization. The captured strands were amplified on the bead
18
surfaces with a thermocycling reaction using an integrated heater and temperature sensor.
Amplification of the DNA strands on the beads was monitored by fluorescence intensity
measurements of the beads realized using fluorescently labeled primers for PCR on bead
surfaces. Significant increases in the fluorescence intensity of the beads were observed
indicating amplification of the captured strands on the bead surfaces.
Integration of selection and amplification by use of electrokinetic transfer.
Microfluidic selection and amplification of target-binding oligomers were integrated into
a single device achieved by the use of an electrokinetic DNA transfer method. Target-
binding strands were isolated on target-functionalized beads or cell targets in the
selection chamber. The isolated strands were electrokinetically transferred into the
amplification chamber and captured onto primers on beads and amplified via
thermocycling. The gel in the channel effectively prevented cross-contamination between
the two chambers by physically blocking undesirable substances entering from one to the
other chamber.
Demonstration of multi-round SELEX of aptamer candidates. Multi-round SELEX
of aptamer candidates was demonstrated for protein, small molecule, and cell targets
using the integrated microfluidic devices. Counter selection process was included to
improve specificity of the aptamer candidates to a target. Target-binding oligomers were
generated for each target within ~15 hours with high binding affinities that are
comparable to the aptamers isolated using conventional SELEX platforms.
19
Chapter 2. A Microfluidic Chip for Nucleic Acid Isolation and Enrichment
2.1 Introduction
In this chapter, we present a microfluidic chip that was initially developed to demonstrate
the isolation and enrichment of analytes in sample solutions. Target-binding nucleic acids mixed
in a randomized DNA library were used as model analytes, which were then isolated on bead
surfaces in a chamber and electrokinetically transferred into another chamber.
In bioanalytical assays, analytes of interest are often present in minute quantities and are
contaminated with impurities. Thus, sample preparation steps prior to analysis are essential for
improving the resolution of detection results [64, 65]. In particular, isolation and enrichment of
DNA molecules within dilute and complex samples can enable clinical detection of DNA
markers linked to disease and synthetic selection of analyte-specific molecules such as aptamers
[37, 66].
Microchip-based devices for sample enrichment have salient advantages over
conventional technology, such as reduced sample consumption and shortened assay times.
Consequently, many enrichment techniques have been implemented in microfluidic devices to
separate and enrich low-concentration biological molecules from complex samples [67-69]. For
example, solid-phase extraction (SPE) methods have been employed in microfluidic devices to
capture target analytes on a solid phase (e.g., microbeads) while impurities in the sample solution
are discarded [26, 70, 71]. Similarly, electrophoretic methods are utilized within microchips to
effectively concentrate charged molecules (e.g., DNA and protein molecules) by applying an
electric field [72, 73]. Liquid-liquid extraction (LLE) also has been used for sample
preconcentration on microchips by allowing analytes in an aqueous solution to be extracted into
a smaller volume of a water-immiscible solution [74-76].
20
However, existing devices are limited in their inability to isolate analytes specifically
from sample solutions. For example, SPE devices typically employ hydrophobic or electrostatic
interactions between analytes and the solid phase, which are inherently nonspecific[77].
Additionally, electrophoresis devices separate molecules based on mass-to-charge ratio, thus
requiring additional processes to isolate analytes of interest from a solution [78-80]. The limited
choice of biocompatible solvents for the extraction of biomolecules [81] and the extraction of
non-specific molecules [82] are the main drawbacks of LLE devices. In addition, many existing
microfluidic enrichment devices do not effectively separate enriched products from raw samples,
contaminating the product solution [73, 83].
Seeking to address these issues, we report on a microchip that effectively isolates and
enriches single-stranded DNA (ssDNA) molecules that bind to human immunoglobulin E (IgE)
protein using a combination of SPE and electrophoresis methods which can then be employed
into a bioanalytical purification microchip. In our device, ssDNA molecules are isolated via
specific capture onto microbeads functionalized with IgE in a microchamber and are
electrophoretically enriched in the other chamber. The two chambers (isolation and enrichment
chambers) are connected by a microchannel that is filled with agarose gel. Each chamber has an
inlet and an outlet for sample solutions and an inlet for microbeads and a platinum (Pt) wire
electrode. In the isolation chamber, microbeads are introduced and retained by a weir structure
during the capture of ssDNA strands. The resistive heater integrated under the chamber provides
heat to elute strongly bound ssDNA strands from the beads. The gel in the microchannel blocks
flows of undesirable samples across the two chambers while only ssDNA strands can be
transported with an applied potential difference. Results show that ssDNA strands that bind to
human IgE were captured from a mixture of random ssDNA using IgE-coated beads and then
21
released by heat in the isolation chamber. The IgE-binding ssDNA were enriched by repeatedly
transporting them to the enrichment chamber via electrophoresis. As a result, our microchip can
enhance the sensitivity of ssDNA detection in dilute and complex biological samples.
2.2 Principle, Design, and Fabrication
2.2.1 Principle
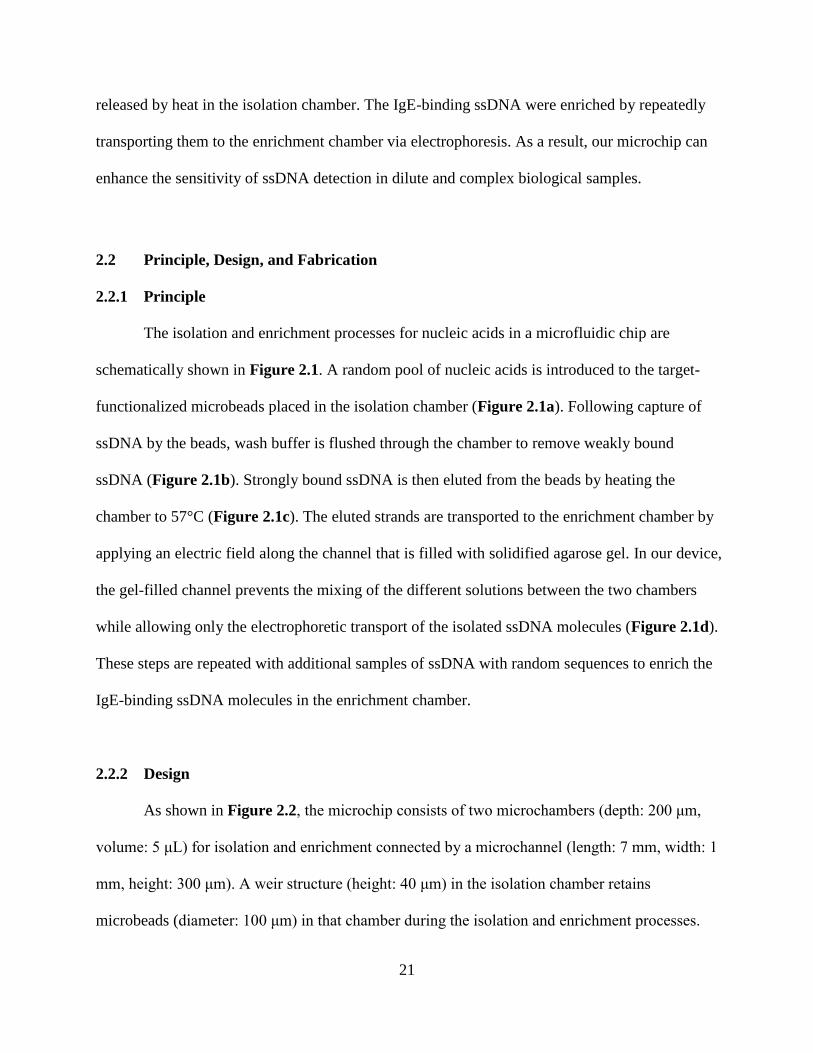
The isolation and enrichment processes for nucleic acids in a microfluidic chip are
schematically shown in Figure 2.1. A random pool of nucleic acids is introduced to the target-
functionalized microbeads placed in the isolation chamber (Figure 2.1a). Following capture of
ssDNA by the beads, wash buffer is flushed through the chamber to remove weakly bound
ssDNA (Figure 2.1b). Strongly bound ssDNA is then eluted from the beads by heating the
chamber to 57°C (Figure 2.1c). The eluted strands are transported to the enrichment chamber by
applying an electric field along the channel that is filled with solidified agarose gel. In our device,
the gel-filled channel prevents the mixing of the different solutions between the two chambers
while allowing only the electrophoretic transport of the isolated ssDNA molecules (Figure 2.1d).
These steps are repeated with additional samples of ssDNA with random sequences to enrich the
IgE-binding ssDNA molecules in the enrichment chamber.
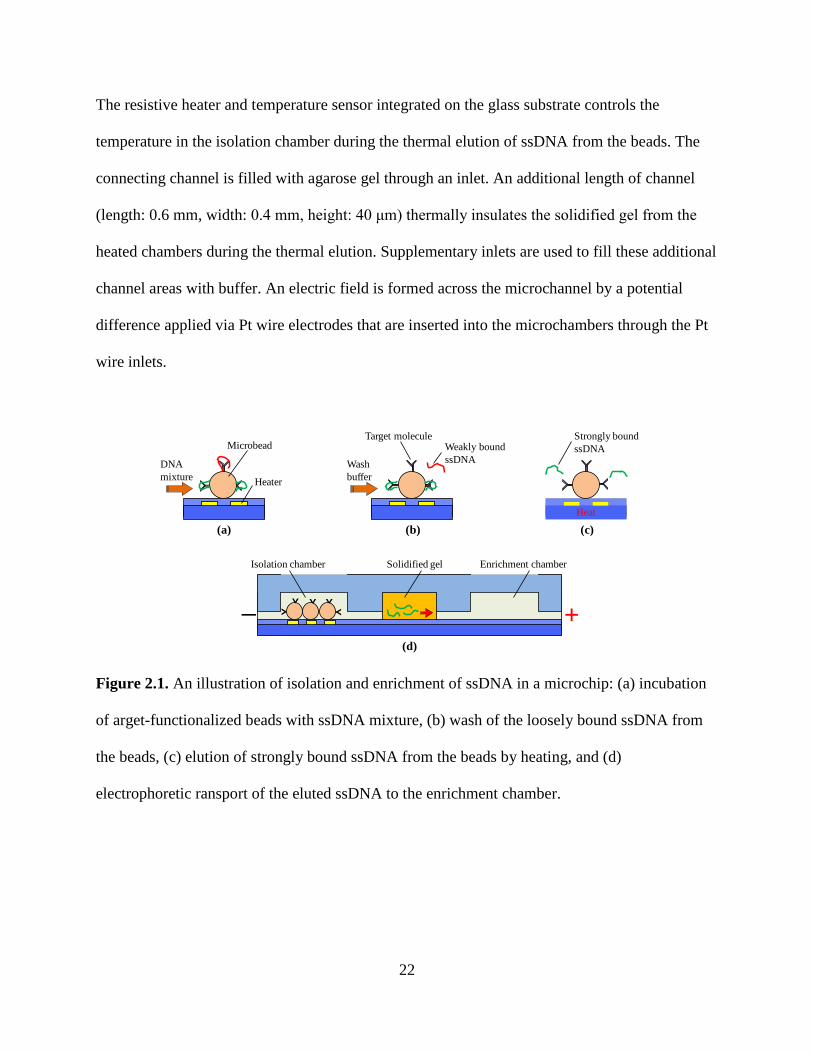
2.2.2 Design
As shown in Figure 2.2, the microchip consists of two microchambers (depth: 200 μm,
volume: 5 μL) for isolation and enrichment connected by a microchannel (length: 7 mm, width: 1
mm, height: 300 μm). A weir structure (height: 40 μm) in the isolation chamber retains
microbeads (diameter: 100 μm) in that chamber during the isolation and enrichment processes.
22
The resistive heater and temperature sensor integrated on the glass substrate controls the
temperature in the isolation chamber during the thermal elution of ssDNA from the beads. The
connecting channel is filled with agarose gel through an inlet. An additional length of channel
(length: 0.6 mm, width: 0.4 mm, height: 40 μm) thermally insulates the solidified gel from the
heated chambers during the thermal elution. Supplementary inlets are used to fill these additional
channel areas with buffer. An electric field is formed across the microchannel by a potential
difference applied via Pt wire electrodes that are inserted into the microchambers through the Pt
wire inlets.
− +
DNA
mixture
Heat
Target moleculeWeakly bound
ssDNA
Heater
Y Y Y
Y
Y
Enrichment chamber
Microbead
Isolation chamber Solidified gel
Strongly bound
ssDNA
(a) (b) (c)
(d)
Wash
buffer
Figure 2.1. An illustration of isolation and enrichment of ssDNA in a microchip: (a) incubation
of arget-functionalized beads with ssDNA mixture, (b) wash of the loosely bound ssDNA from
the beads, (c) elution of strongly bound ssDNA from the beads by heating, and (d)
electrophoretic ransport of the eluted ssDNA to the enrichment chamber.
23
7 mm
1 mm
0.4 mm
Gel inletPt wire inlet
Pt wire inlet
Resistive
heater
Sensor
Figure 2.2. Schematic of the microchip for ssDNA isolation and enrichment.
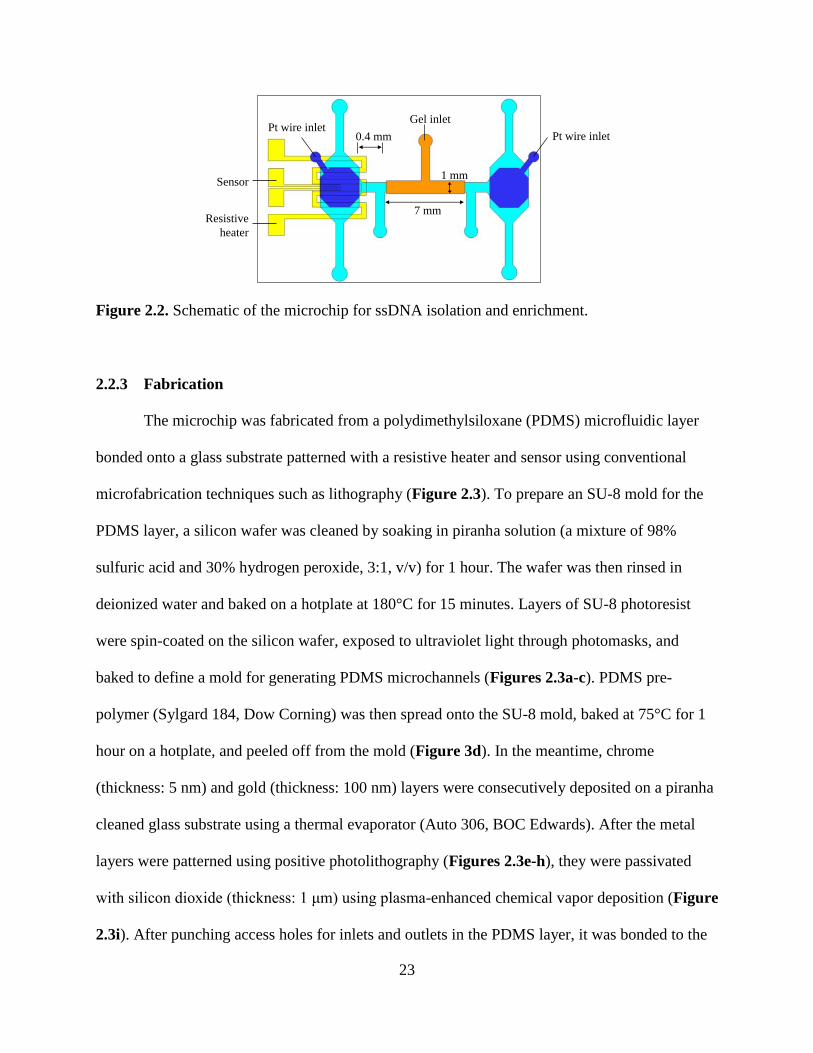
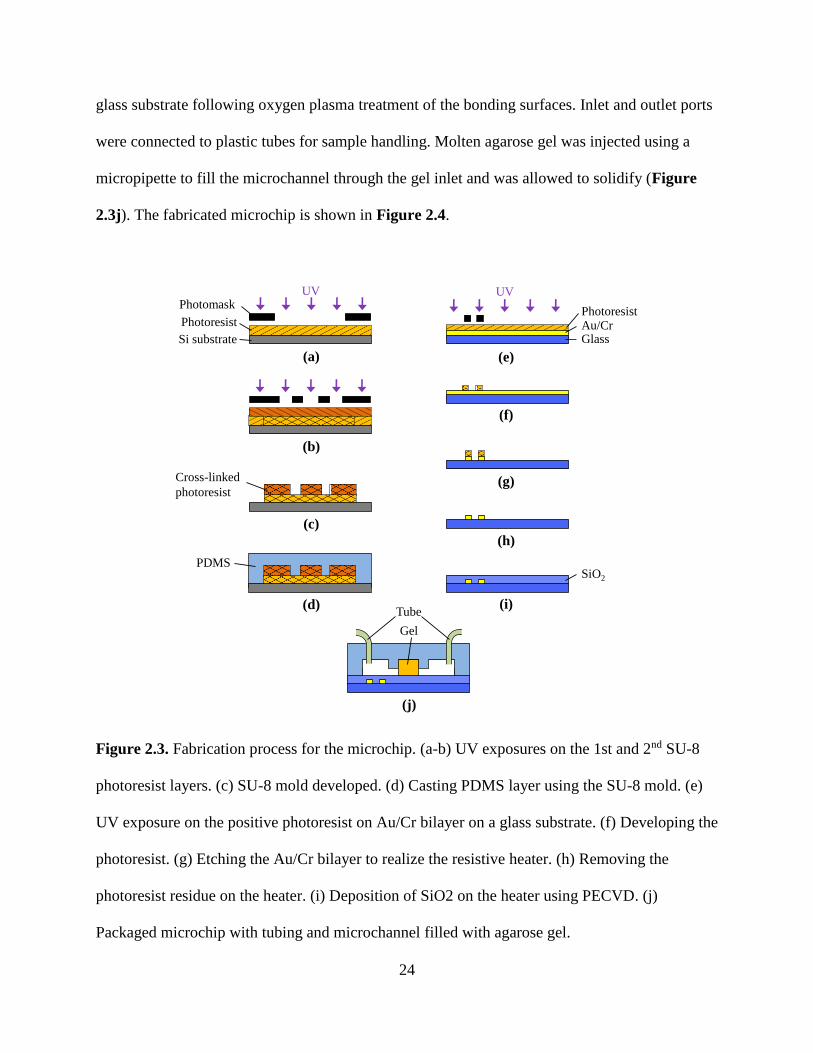
2.2.3 Fabrication
The microchip was fabricated from a polydimethylsiloxane (PDMS) microfluidic layer
bonded onto a glass substrate patterned with a resistive heater and sensor using conventional
microfabrication techniques such as lithography (Figure 2.3). To prepare an SU-8 mold for the
PDMS layer, a silicon wafer was cleaned by soaking in piranha solution (a mixture of 98%
sulfuric acid and 30% hydrogen peroxide, 3:1, v/v) for 1 hour. The wafer was then rinsed in
deionized water and baked on a hotplate at 180°C for 15 minutes. Layers of SU-8 photoresist
were spin-coated on the silicon wafer, exposed to ultraviolet light through photomasks, and
baked to define a mold for generating PDMS microchannels (Figures 2.3a-c). PDMS pre-
polymer (Sylgard 184, Dow Corning) was then spread onto the SU-8 mold, baked at 75°C for 1
hour on a hotplate, and peeled off from the mold (Figure 3d). In the meantime, chrome
(thickness: 5 nm) and gold (thickness: 100 nm) layers were consecutively deposited on a piranha
cleaned glass substrate using a thermal evaporator (Auto 306, BOC Edwards). After the metal
layers were patterned using positive photolithography (Figures 2.3e-h), they were passivated
with silicon dioxide (thickness: 1 μm) using plasma-enhanced chemical vapor deposition (Figure
2.3i). After punching access holes for inlets and outlets in the PDMS layer, it was bonded to the
24
glass substrate following oxygen plasma treatment of the bonding surfaces. Inlet and outlet ports
were connected to plastic tubes for sample handling. Molten agarose gel was injected using a
micropipette to fill the microchannel through the gel inlet and was allowed to solidify (Figure
2.3j). The fabricated microchip is shown in Figure 2.4.
UV
Cross-linked
photoresist
Gel
GlassAu/Cr Photoresist
UV
PDMS
Tube
(a)
(b)
(c)
(d)
(e)
(f)
(g)
(h)
(i)
(j)
SiO2
Si substrate
Photoresist
Photomask
Figure 2.3. Fabrication process for the microchip. (a-b) UV exposures on the 1st and 2nd SU-8
photoresist layers. (c) SU-8 mold developed. (d) Casting PDMS layer using the SU-8 mold. (e)
UV exposure on the positive photoresist on Au/Cr bilayer on a glass substrate. (f) Developing the
photoresist. (g) Etching the Au/Cr bilayer to realize the resistive heater. (h) Removing the
photoresist residue on the heater. (i) Deposition of SiO2 on the heater using PECVD. (j)
Packaged microchip with tubing and microchannel filled with agarose gel.
25
Figure 2.4. Photograph of the microchip with the chambers and channel filled with blue ink for
visualization. Scale bar: 1 cm.
2.3 Experimental
2.3.1 Materials
To prepare IgE-functionalized microbeads, 200 μL of solution containing NHS-activated
microbeads (mean diameter: ~100 μm, GE Healthcare) was washed 3 times with 1 PBS buffer
modified to contain 1 mM of Mg2+ ions (8.1 mM Na2HPO4, 1.1 mM KH2PO4, 138 mM NaCl,
2.7 mM KCl, 1 mM MgCl2, pH 7.4) [84] by centrifugation. Then the beads were incubated with
200 μL of 0.1 μM human myeloma IgE (Athens Research& Technology) for 5 hours at room
temperature. After incubation, excess IgE molecules were discarded by washing the beads with
fresh PBS buffer. To reduce nonspecific binding of ssDNA molecules to the beads, the surfaces
that were not conjugated with IgE were passivated by incubating the beads in 0.1 M Tris-HCl
buffer for 1 hour. The IgE-functionalized beads were stored in PBS buffer at 4°C before use. A
fluorescently labeled ssDNA library having random sequences (97-mer, 5’-GCC TGT TGT
GAG CCT CCT GTC GAA - 50 random bases - TTG AGC GTT TAT TCT TGT CTC CC-3'),
IgE-specific ssDNA aptamer D17.4 (78-mer, KD = 10 nM, 5’-GCC TGT TGT GAG CCT CCT
GTC GAA GCA CGT TTA TCC GTC CCT CCT AGT GGC GTG CTT GAG CGT TTA TTC
26
TTG TCT CCC-3') [84], and forward (5’-GCC TGT TGT GAG CCT CCT GTC GAA-3’) and
reverse (5’-GGG AGA CAA GAA TAA ACG CTC AA-3’) primers were purchased from
Integrated DNA Technologies. To isolate ssDNA having higher affinity to IgE, a mixture of
random ssDNA and aptamer D17.4 (1000:1, mole ratio) was used throughout the experiment to
increase competition for IgE binding sites [85]. The random ssDNA solution was prepared by
mixing 1 μL of a 100 μM random ssDNA library and 1 μL of 0.1 μM aptamer D17.4 in 98 μL of
1 PBS buffer. The running buffer for electrophoretic transport of ssDNA in the microchannel
and for a slab-gel electrophoresis was 0.5 TBE buffer (44.5 mM Tris base, 44.5 mM boric acid,
1.25 mM EDTA, pH 8.3). Three percent agarose gel (Difco Laboratories) for electrophoresis was
prepared by dissolving 0.3 grams of agarose in 100 mL of 0.5 TBE buffer on a hotplate.
2.3.2 Experimental Setup
A schematic of the experimental setup is illustrated in Figure 2.5. The sample solutions
including the ssDNA mixture and buffers were introduced into the microchambers using a
syringe pump (NE 300, Harvard Apparatus). The temperature in the isolation chamber during the
thermal elution process was maintained at 57°C via the resistive heater and sensor connected
with a power supply (E3631A, Agilent Technologies) and a multimeter (34410A, Agilent
Technologies), respectively, that are controlled by a LabVIEW-based PID module on a computer.
The Pt electrodes were connected to the power supply to apply a potential difference between the
two chambers to induce electrophoretic transport of ssDNA strands. The transport of ssDNA
through the gel-filled channel was monitored at the center of the channel using a fluorescence
microscope (LSM 510, Zeiss).
27
Multimeter
Power
supply
Computer
(PID)
Syringe
pumpMicrochip
Measured
resistance
Power
output
Flow
Figure 2.5. A schematic of the experimental setup.
2.3.3 Experimental Procedure
Isolation and enrichment of desired ssDNA molecules in a randomized ssDNA mixture
was carried out as follows. The IgE-functionalized microbeads were loaded in the isolation
chamber using a syringe through a bead inlet to fill approximately 30% of the chamber volume
(~3 104 beads). After loading, the beads were washed for 5 minutes with 1 PBS buffer at a
flow rate of 40 μL/min using a syringe pump. The random ssDNA mixture (100 μL) was
introduced to the chamber through the inlet at a flow rate of 20 μL/min and collected from the
outlet in 3 separate plastic tubes (~33 μL/tube). PBS buffer was injected to the chamber at 40
μL/min to wash weakly bound DNA strands from the IgE-beads, and the waste solution was
collected in 10 separate tubes at the outlet (~33 μL/tube). The two chambers were filled with
0.5 TBE buffer and then the isolation chamber was heated at 57°C for 5 minutes via the
resistive heater to elute strongly bound DNA strands from the beads.
As the thermal elution was occurring, Pt-wire electrodes were inserted into the chambers
and a potential difference of approximately 50 V (i.e., an electric field of 25 V/cm) was applied
for 25 minutes. This potential difference effectively transferred the DNA strands to the
28
enrichment chamber through the gel-filled channel via electrophoresis. To investigate a single
round of isolation and enrichment of ssDNA, the two chambers were flushed with PBS buffer as
eluents were collected in plastic tubes (~33 μL/tube). For multiple rounds of DNA enrichment,
the beads in the isolation chamber were discarded following elution and the chamber was
thoroughly washed with PBS buffer prior to the next round of the isolation and enrichment
processes to remove undesired DNA molecules that might remain. Fresh IgE-functionalized
beads were then introduced in the isolation chamber for the next round of DNA isolation and
enrichment.
To analyze the results from the experiment, representative eluent samples from each step
were amplified by polymerase chain reaction (PCR) using a thermal cycler (Mastercycler
Personal, Eppendorf). The PCR procedure included denaturation of DNA at 95°C for 3 minutes
followed by 20 cycles of amplification. Each cycle consisted of denaturation at 95°C for 15
seconds, annealing at 59°C for 30 seconds, and extension at 72°C for 45 seconds. Following the
amplification, 7 μL of PCR product was mixed with 7 μL of 2 DNA loading dye containing
bromophenol blue and xylene cyanol (Thermo Scientific) and loaded into each lane of a 3%
agarose gel. Electrophoresis was then carried out at 100 V for 30 minutes in 0.5 TBE buffer
using a slab gel apparatus (Mupid-exU, Advance). The gel was then stained with ethidium
bromide in deionized water for 5 minutes. The bands in the gel representing the concentration of
DNA in each eluent sample were visualized using a UV illuminator (AlphaImager 3400, Alpha
Innotech). A fluorescence microscope was used to monitor the electrophoretic transport of
ssDNA through the gel-filled channel. The intensities of gel-bands and fluorescence from images
obtained were analyzed using the ImageJ software (National Institutes of Health freeware).
29
2.4 Results and Discussion
This section presents experimental results from isolation and enrichment of IgE-binding
DNA strands in a microchip. The investigation of the capture of IgE-binding nucleic acids from a
sample of DNA with random sequences in the isolation chamber will first be discussed. Then
studies on electrophoretic transport of the DNA through the gel-filled channel will be presented.
Finally, the enrichment of IgE-binding DNA in the microchip will be discussed.
2.4.1 Isolation of IgE-binding ssDNA from a Randomized DNA Sample
We first investigated the isolation of IgE-binding ssDNA from the randomized ssDNA
mixture in the isolation chamber. IgE isolation was achieved by exposing the chamber filled with
IgE-functionalized beads to samples of randomized DNA and then washing with pure buffer to
remove unbound DNA. These buffer samples containing residual DNA were collected following
washing, and were amplified with PCR and visualized with slab gel electrophoresis to determine
the effectiveness of the isolation procedure. Figure 2.6a shows a gel electropherogram of the
PCR products of eluents collected during the isolation process. In the gel image, bands in lanes L,
P, and N represent a 10 base pair (bp) DNA ladder, positive control (a PCR reaction in which
template DNA consisted of 100 pmole random ssDNA and 0.1 pmole D17.4 aptamer) and
negative control (a PCR reaction excluding template DNA), respectively. Additional bands
represent amplified samples of eluent collected during incubation (lane I1), washing (lanes W1-
W10), elution (lane E1), and buffer used to wash the enrichment chamber after the ssDNA
isolation process (lane EC). Note that the numbers after the abbreviations of each process
represent the order in which eluent samples were collected. For example, “5” in “W5” means the
5th eluent sample collected during the washing step.
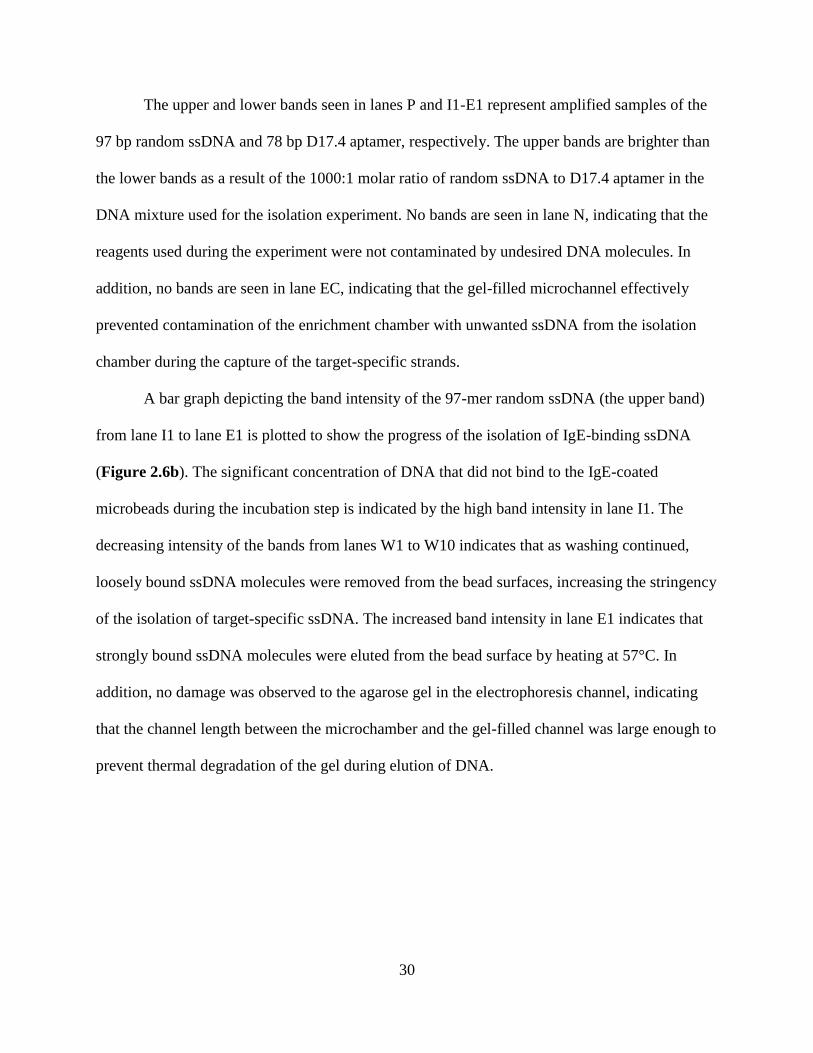
30
The upper and lower bands seen in lanes P and I1-E1 represent amplified samples of the
97 bp random ssDNA and 78 bp D17.4 aptamer, respectively. The upper bands are brighter than
the lower bands as a result of the 1000:1 molar ratio of random ssDNA to D17.4 aptamer in the
DNA mixture used for the isolation experiment. No bands are seen in lane N, indicating that the
reagents used during the experiment were not contaminated by undesired DNA molecules. In
addition, no bands are seen in lane EC, indicating that the gel-filled microchannel effectively
prevented contamination of the enrichment chamber with unwanted ssDNA from the isolation
chamber during the capture of the target-specific strands.
A bar graph depicting the band intensity of the 97-mer random ssDNA (the upper band)
from lane I1 to lane E1 is plotted to show the progress of the isolation of IgE-binding ssDNA
(Figure 2.6b). The significant concentration of DNA that did not bind to the IgE-coated
microbeads during the incubation step is indicated by the high band intensity in lane I1. The
decreasing intensity of the bands from lanes W1 to W10 indicates that as washing continued,
loosely bound ssDNA molecules were removed from the bead surfaces, increasing the stringency
of the isolation of target-specific ssDNA. The increased band intensity in lane E1 indicates that
strongly bound ssDNA molecules were eluted from the bead surface by heating at 57°C. In
addition, no damage was observed to the agarose gel in the electrophoresis channel, indicating
that the channel length between the microchamber and the gel-filled channel was large enough to
prevent thermal degradation of the gel during elution of DNA.
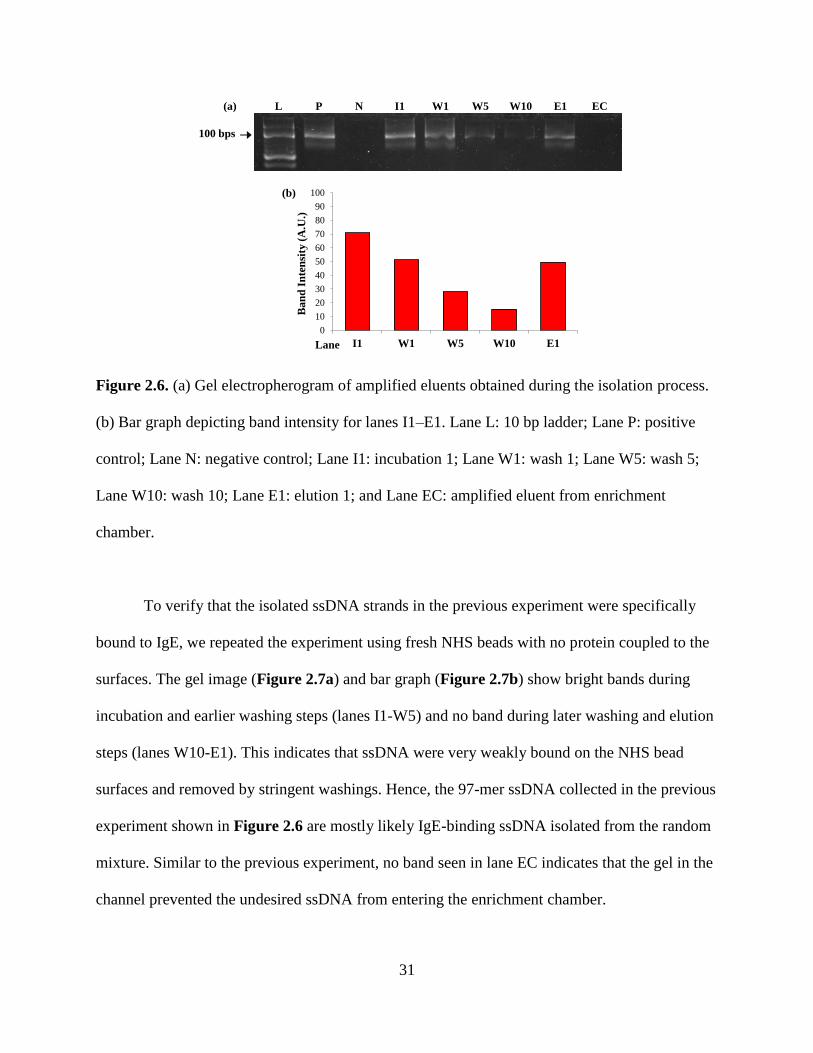
31
100 bps
Lane
L P N I1 W1 W5 W10 E1 EC
0
10
20
30
40
50
60
70
80
90
100
I1 W1 W5 W10 E1
Ba
nd
In
ten
sity
(A
.U.)
(a)
(b)
Figure 2.6. (a) Gel electropherogram of amplified eluents obtained during the isolation process.
(b) Bar graph depicting band intensity for lanes I1–E1. Lane L: 10 bp ladder; Lane P: positive
control; Lane N: negative control; Lane I1: incubation 1; Lane W1: wash 1; Lane W5: wash 5;
Lane W10: wash 10; Lane E1: elution 1; and Lane EC: amplified eluent from enrichment
chamber.
To verify that the isolated ssDNA strands in the previous experiment were specifically
bound to IgE, we repeated the experiment using fresh NHS beads with no protein coupled to the
surfaces. The gel image (Figure 2.7a) and bar graph (Figure 2.7b) show bright bands during
incubation and earlier washing steps (lanes I1-W5) and no band during later washing and elution
steps (lanes W10-E1). This indicates that ssDNA were very weakly bound on the NHS bead
surfaces and removed by stringent washings. Hence, the 97-mer ssDNA collected in the previous
experiment shown in Figure 2.6 are mostly likely IgE-binding ssDNA isolated from the random
mixture. Similar to the previous experiment, no band seen in lane EC indicates that the gel in the
channel prevented the undesired ssDNA from entering the enrichment chamber.
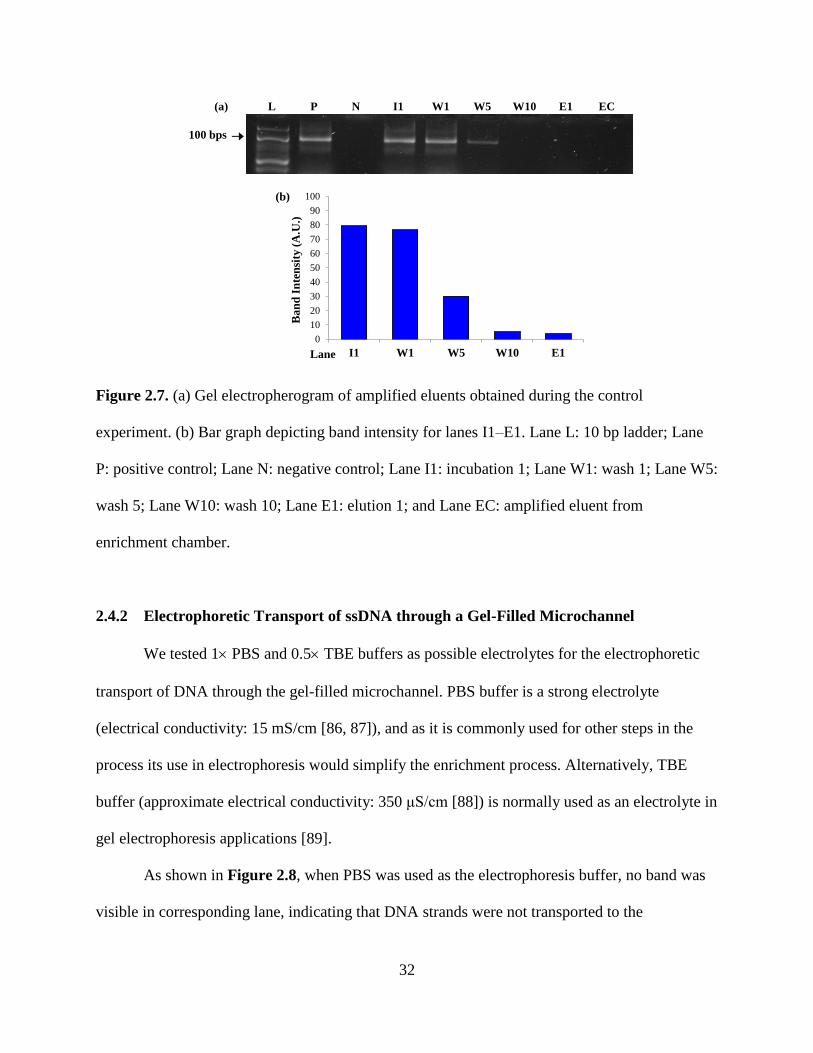
32
L P N I1 W1 W5 W10 E1 EC
Lane
100 bps
0
10
20
30
40
50
60
70
80
90
100
I1 W1 W5 W10 E1
Ba
nd
In
ten
sity
(A
.U.)
(a)
(b)
Figure 2.7. (a) Gel electropherogram of amplified eluents obtained during the control
experiment. (b) Bar graph depicting band intensity for lanes I1–E1. Lane L: 10 bp ladder; Lane
P: positive control; Lane N: negative control; Lane I1: incubation 1; Lane W1: wash 1; Lane W5:
wash 5; Lane W10: wash 10; Lane E1: elution 1; and Lane EC: amplified eluent from
enrichment chamber.
2.4.2 Electrophoretic Transport of ssDNA through a Gel-Filled Microchannel
We tested 1 PBS and 0.5 TBE buffers as possible electrolytes for the electrophoretic
transport of DNA through the gel-filled microchannel. PBS buffer is a strong electrolyte
(electrical conductivity: 15 mS/cm [86, 87]), and as it is commonly used for other steps in the
process its use in electrophoresis would simplify the enrichment process. Alternatively, TBE
buffer (approximate electrical conductivity: 350 μS/cm [88]) is normally used as an electrolyte in
gel electrophoresis applications [89].
As shown in Figure 2.8, when PBS was used as the electrophoresis buffer, no band was
visible in corresponding lane, indicating that DNA strands were not transported to the
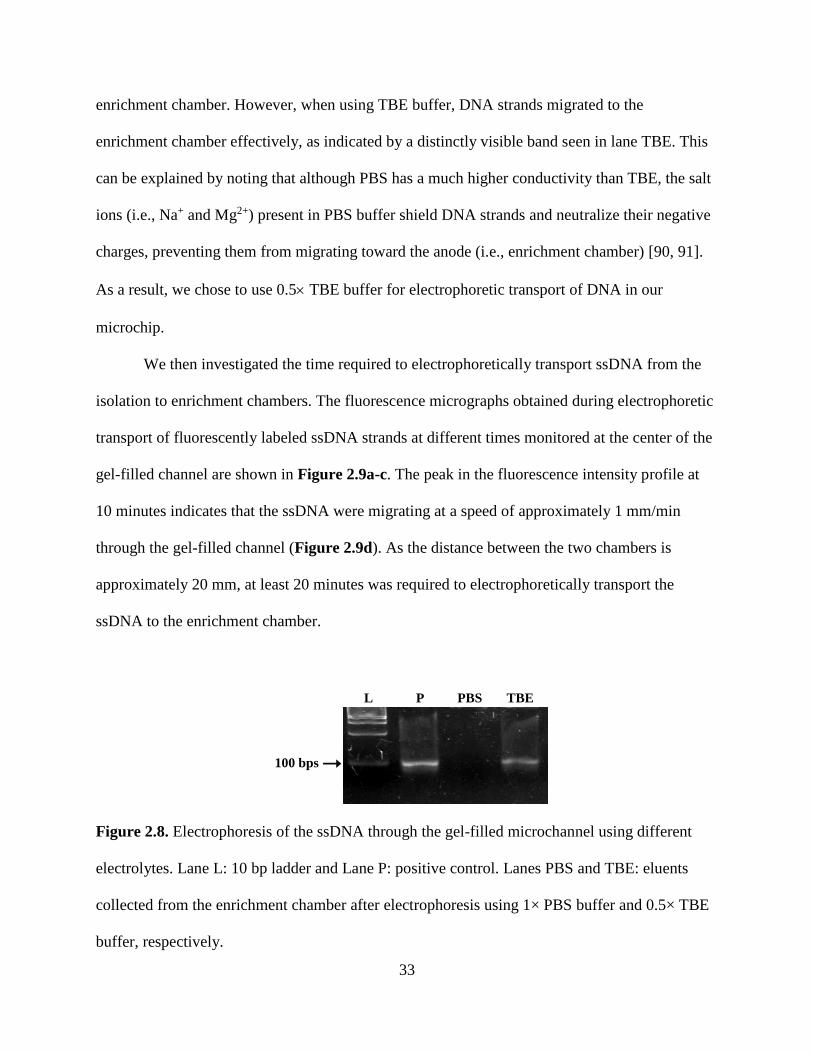
33
enrichment chamber. However, when using TBE buffer, DNA strands migrated to the
enrichment chamber effectively, as indicated by a distinctly visible band seen in lane TBE. This
can be explained by noting that although PBS has a much higher conductivity than TBE, the salt
ions (i.e., Na+ and Mg2+) present in PBS buffer shield DNA strands and neutralize their negative
charges, preventing them from migrating toward the anode (i.e., enrichment chamber) [90, 91].
As a result, we chose to use 0.5 TBE buffer for electrophoretic transport of DNA in our
microchip.
We then investigated the time required to electrophoretically transport ssDNA from the
isolation to enrichment chambers. The fluorescence micrographs obtained during electrophoretic
transport of fluorescently labeled ssDNA strands at different times monitored at the center of the
gel-filled channel are shown in Figure 2.9a-c. The peak in the fluorescence intensity profile at
10 minutes indicates that the ssDNA were migrating at a speed of approximately 1 mm/min
through the gel-filled channel (Figure 2.9d). As the distance between the two chambers is
approximately 20 mm, at least 20 minutes was required to electrophoretically transport the
ssDNA to the enrichment chamber.
PL
100 bps
PBS TBE
Figure 2.8. Electrophoresis of the ssDNA through the gel-filled microchannel using different
electrolytes. Lane L: 10 bp ladder and Lane P: positive control. Lanes PBS and TBE: eluents
collected from the enrichment chamber after electrophoresis using 1× PBS buffer and 0.5× TBE
buffer, respectively.
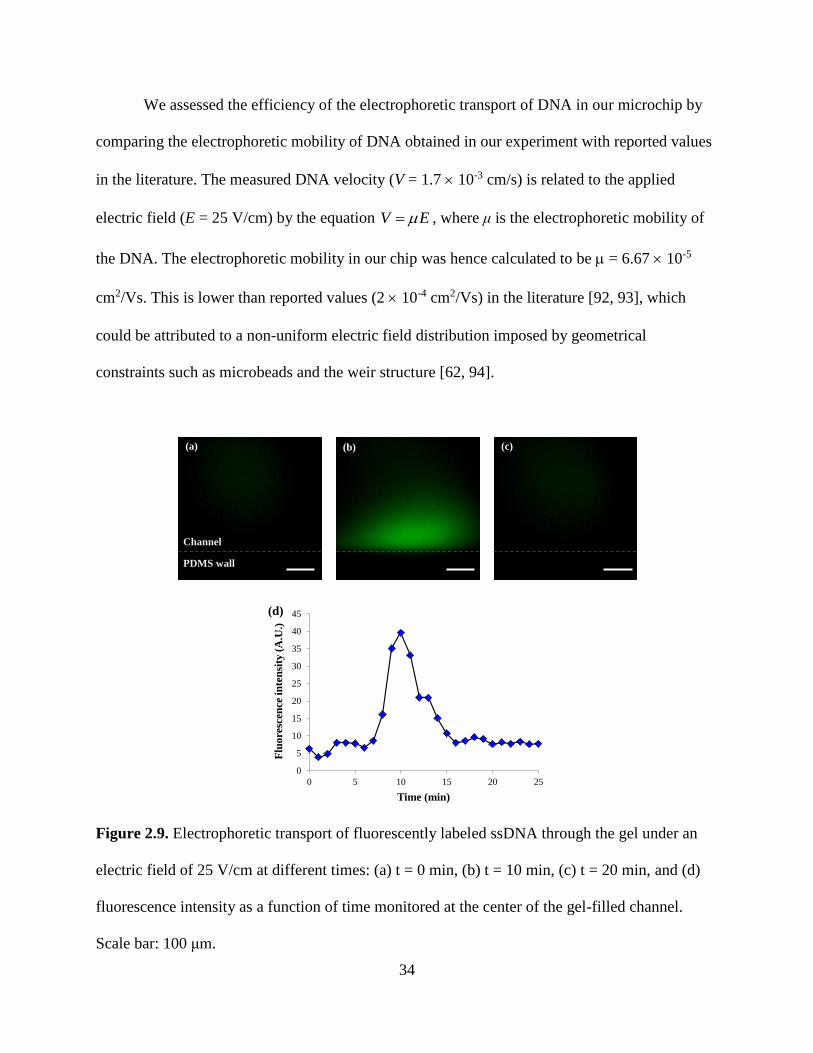
34
We assessed the efficiency of the electrophoretic transport of DNA in our microchip by
comparing the electrophoretic mobility of DNA obtained in our experiment with reported values
in the literature. The measured DNA velocity (V = 1.7 10-3 cm/s) is related to the applied
electric field (E = 25 V/cm) by the equation V E , where μ is the electrophoretic mobility of
the DNA. The electrophoretic mobility in our chip was hence calculated to be = 6.67 10-5
cm2/Vs. This is lower than reported values (2 10-4 cm2/Vs) in the literature [92, 93], which
could be attributed to a non-uniform electric field distribution imposed by geometrical
constraints such as microbeads and the weir structure [62, 94].
PDMS wall
Channel
(a) (b) (c)
0
5
10
15
20
25
30
35
40
45
0 5 10 15 20 25
Flu
ore
scen
ce i
nte
nsi
ty (
A.U
.)
Time (min)
(d)
Figure 2.9. Electrophoretic transport of fluorescently labeled ssDNA through the gel under an
electric field of 25 V/cm at different times: (a) t = 0 min, (b) t = 10 min, (c) t = 20 min, and (d)
fluorescence intensity as a function of time monitored at the center of the gel-filled channel.
Scale bar: 100 μm.
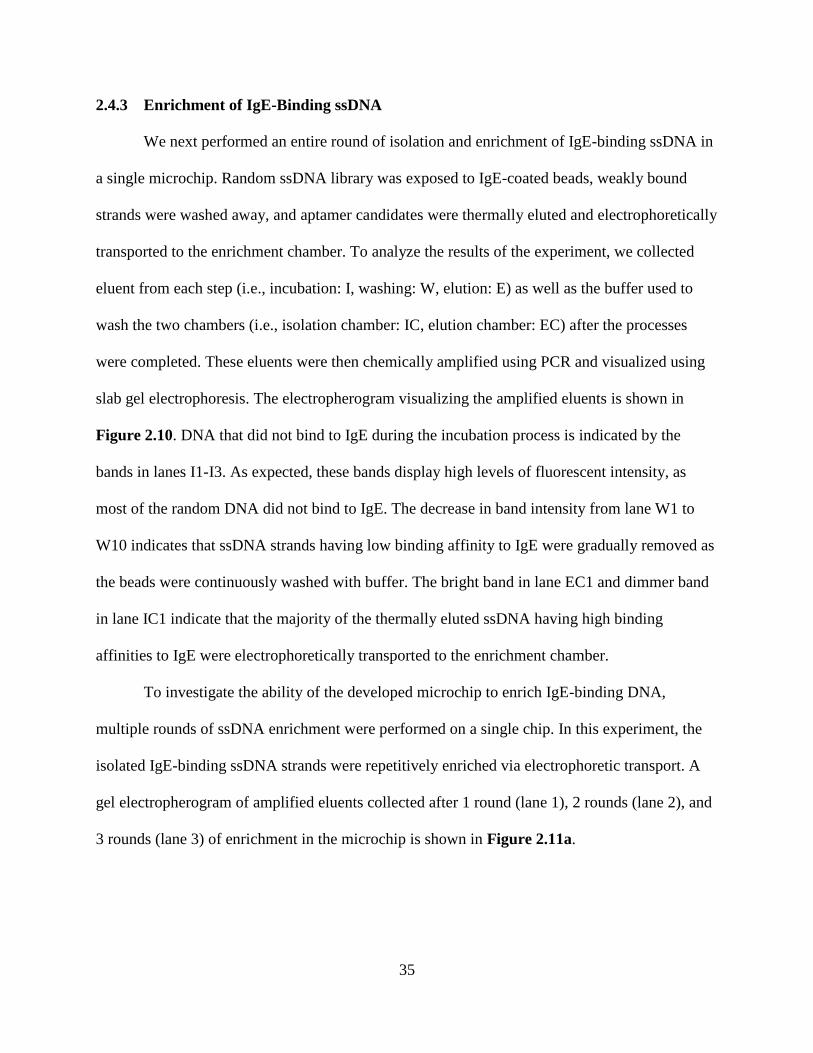
35
2.4.3 Enrichment of IgE-Binding ssDNA
We next performed an entire round of isolation and enrichment of IgE-binding ssDNA in
a single microchip. Random ssDNA library was exposed to IgE-coated beads, weakly bound
strands were washed away, and aptamer candidates were thermally eluted and electrophoretically
transported to the enrichment chamber. To analyze the results of the experiment, we collected
eluent from each step (i.e., incubation: I, washing: W, elution: E) as well as the buffer used to
wash the two chambers (i.e., isolation chamber: IC, elution chamber: EC) after the processes
were completed. These eluents were then chemically amplified using PCR and visualized using
slab gel electrophoresis. The electropherogram visualizing the amplified eluents is shown in
Figure 2.10. DNA that did not bind to IgE during the incubation process is indicated by the
bands in lanes I1-I3. As expected, these bands display high levels of fluorescent intensity, as
most of the random DNA did not bind to IgE. The decrease in band intensity from lane W1 to
W10 indicates that ssDNA strands having low binding affinity to IgE were gradually removed as
the beads were continuously washed with buffer. The bright band in lane EC1 and dimmer band
in lane IC1 indicate that the majority of the thermally eluted ssDNA having high binding
affinities to IgE were electrophoretically transported to the enrichment chamber.
To investigate the ability of the developed microchip to enrich IgE-binding DNA,
multiple rounds of ssDNA enrichment were performed on a single chip. In this experiment, the
isolated IgE-binding ssDNA strands were repetitively enriched via electrophoretic transport. A
gel electropherogram of amplified eluents collected after 1 round (lane 1), 2 rounds (lane 2), and
3 rounds (lane 3) of enrichment in the microchip is shown in Figure 2.11a.
36
P N I1 I2 I3 W1 W3 W5 W7
W10 EC2 EC3 IC1 IC2 IC3
100 bps
L
EC1
Figure 2.10. Gel electropherogram of eluents obtained from the isolation and enrichment
chambers after one round of isolation and enrichment experiment. Lane L: 10 bp ladder; Lane P:
positive control; Lane N: negative control; Lanes I1–I3: incubations 1–3; and LanesW1–W10:
washes 1–10. Lanes EC1–EC3 and IC1–IC3: eluents 1–3 from the enrichment chamber and the
isolation chamber, respectively, collected after completed processes.
As shown in Figure 2.11b, with an increasing number of enrichments a higher
concentration of DNA was detected in the enrichment chamber. The intensities of the bands for 2
and 3 rounds increase by approximately 72.1% and 153.3%, respectively, compared to the band
intensity for 1 round. For a given number of rounds, experiments were performed in triplicate,
which allowed calculation of standard deviations to assess the repeatability of DNA enrichment.
These standard deviations were found to be 5.50, 5.04, and 6.02 for 1, 2, and 3 rounds of
enrichment, respectively. The low standard deviations relative to the mean values indicate
consistency in DNA enrichment using our device. With the device repeatability determined from
these experiments, no intermediate band intensity from round to round was measured in multi-
round enrichment experiments. In addition, no damage to the gel-filled microchannel was
observed after the multiple rounds of enrichment. This indicates that further rounds of
electrophoresis can be conducted to continue enriching IgE-binding ssDNA strands in the
microchamber.
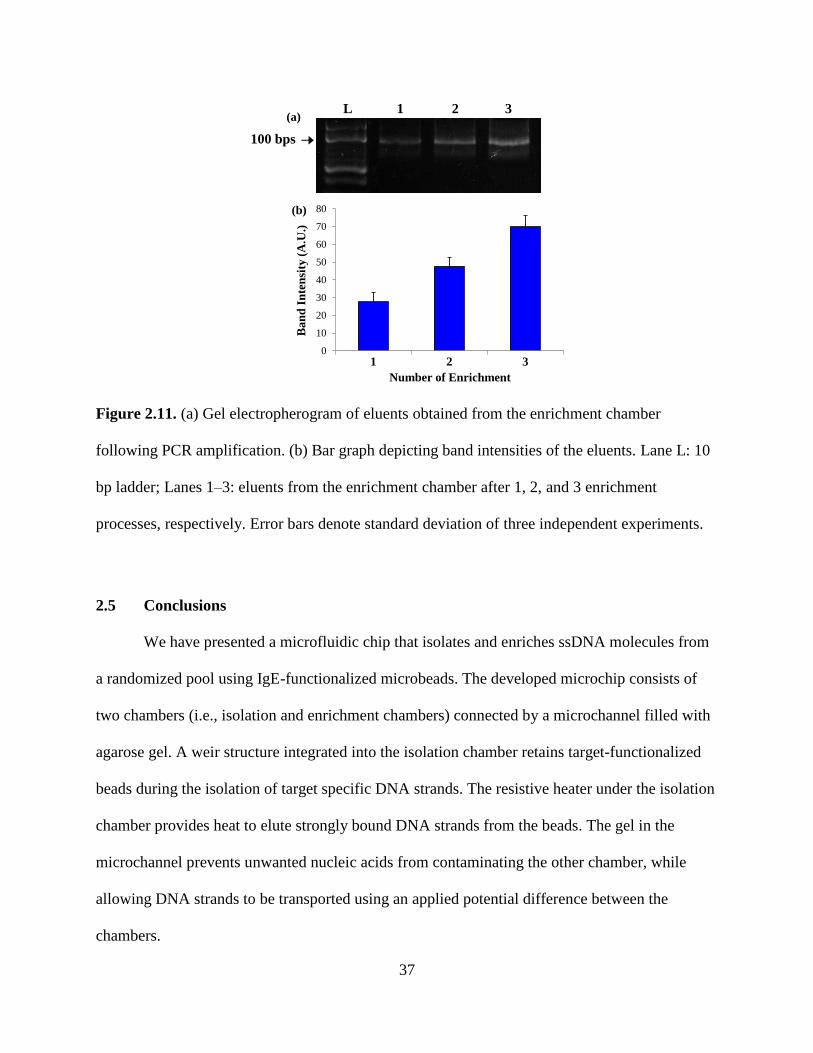
37
(a)L 1 2 3
100 bps
0
10
20
30
40
50
60
70
80
1 2 3
Ba
nd
In
ten
sity
(A
.U.)
Number of Enrichment
(b)
Figure 2.11. (a) Gel electropherogram of eluents obtained from the enrichment chamber
following PCR amplification. (b) Bar graph depicting band intensities of the eluents. Lane L: 10
bp ladder; Lanes 1–3: eluents from the enrichment chamber after 1, 2, and 3 enrichment
processes, respectively. Error bars denote standard deviation of three independent experiments.
2.5 Conclusions
We have presented a microfluidic chip that isolates and enriches ssDNA molecules from
a randomized pool using IgE-functionalized microbeads. The developed microchip consists of
two chambers (i.e., isolation and enrichment chambers) connected by a microchannel filled with
agarose gel. A weir structure integrated into the isolation chamber retains target-functionalized
beads during the isolation of target specific DNA strands. The resistive heater under the isolation
chamber provides heat to elute strongly bound DNA strands from the beads. The gel in the
microchannel prevents unwanted nucleic acids from contaminating the other chamber, while
allowing DNA strands to be transported using an applied potential difference between the
chambers.
38
Experimental results obtained using the chip have shown that ssDNA that strongly bind
to IgE were captured by IgE-functionalized beads in the isolation chamber. The isolated ssDNA
were then electrokinetically transferred through the gel-filled channel at a speed of
approximately 1 mm/min to the enrichment chamber. The IgE-binding ssDNA were repetitively
enriched in the chamber by increasing the number of the isolation and enrichment processes.
Thus, our device enables more efficient isolation and enrichment of nucleic acids than allowed
by existing devices that use either SPE or electrophoresis only. During the multiple rounds of
enrichment, the gel-filled channel effectively blocked flows of unwanted samples across the two
chambers without having thermal damage.
These preliminary results suggest that the device developed in this study can be
employed to fulfill the microfluidic aptamer generations against biological targets such as
proteins. For example, selection of strands that strongly bind to a target can be effectively
achieved using target-functionalized microbeads retained by a weir structure in a microchamber
while non- and weakly-binding strands can be removed with buffer wash. The target-binding
strands can be released from the beads and electrokinetically transferred into another chamber
for amplification through a channel filled with a gel.
39
Chapter 3. A Microfluidic Chip for Studying Binding Interactions of Nucleic
Acid with Cells
3.1 Introduction
In this chapter, we present a microfluidic device that will be used for investigation of
binding interactions of nucleic acids with cells. In the device, ssDNA are captured by cells, and
electrokinetically separated and isolated from the cells for subsequent analysis. This device could
be further improved for selection of oligonucleotides that bind to specific cell targets.
Binding interactions of nucleic acids and cells play crucial roles in many biological
processes, such as removal of circulating DNA released during cell death via binding to
receptors on surfaces of liver cells [95]. In addition to natural biological processes, nucleic acid-
based therapeutic techniques, in which nucleic acids are introduced into cells, require that
nucleic acids effectively interact with cell surfaces prior to internalization to trigger specific
cellular effects [96]. Nucleic acids such as aptamers [97] that bind to specific target cells have
important applications including cell detection and purification. Therefore, a platform for
investigation of binding interactions between nucleic acids and target cells can be useful in basic
biological sciences as well as clinical diagnostics and therapeutics.
To efficiently assess binding interactions of nucleic acids and target cells, microfluidic
devices have been employed to enable rapid processing times and reduced sample and reagent
consumption. For example, a microfluidic chip was developed in which target cells are
hydrodynamically trapped in a microchannel and interact with DNA molecules via
electroporation [98]. Rapid enrichment of target-binding nucleic acids (aptamers) was
demonstrated using a microfluidic chip integrated with components such as integrated pumps
and valves for sample and cell handling [60]. Although nucleic acids and target cells can be
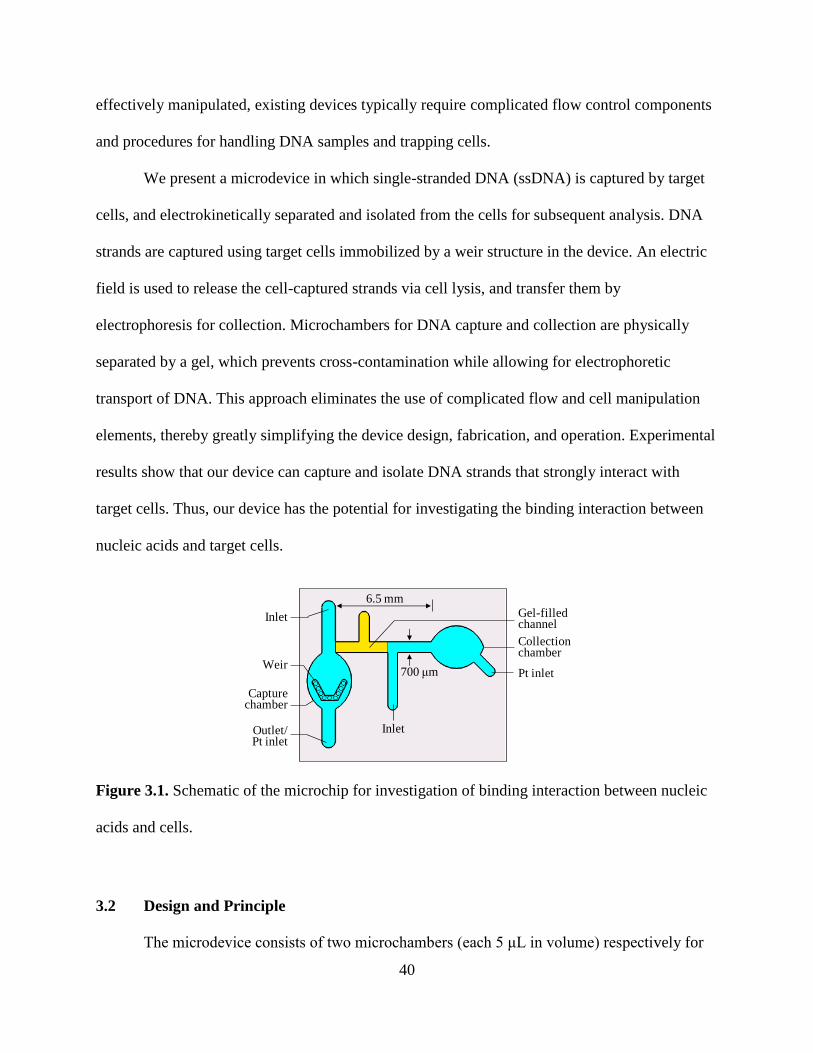
40
effectively manipulated, existing devices typically require complicated flow control components
and procedures for handling DNA samples and trapping cells.
We present a microdevice in which single-stranded DNA (ssDNA) is captured by target
cells, and electrokinetically separated and isolated from the cells for subsequent analysis. DNA
strands are captured using target cells immobilized by a weir structure in the device. An electric
field is used to release the cell-captured strands via cell lysis, and transfer them by
electrophoresis for collection. Microchambers for DNA capture and collection are physically
separated by a gel, which prevents cross-contamination while allowing for electrophoretic
transport of DNA. This approach eliminates the use of complicated flow and cell manipulation
elements, thereby greatly simplifying the device design, fabrication, and operation. Experimental
results show that our device can capture and isolate DNA strands that strongly interact with
target cells. Thus, our device has the potential for investigating the binding interaction between
nucleic acids and target cells.
Weir
Capturechamber
Collectionchamber
Gel-filled channel
InletOutlet/Pt inlet
Pt inlet
Inlet
700 μm
6.5 mm
Figure 3.1. Schematic of the microchip for investigation of binding interaction between nucleic
acids and cells.
3.2 Design and Principle
The microdevice consists of two microchambers (each 5 μL in volume) respectively for
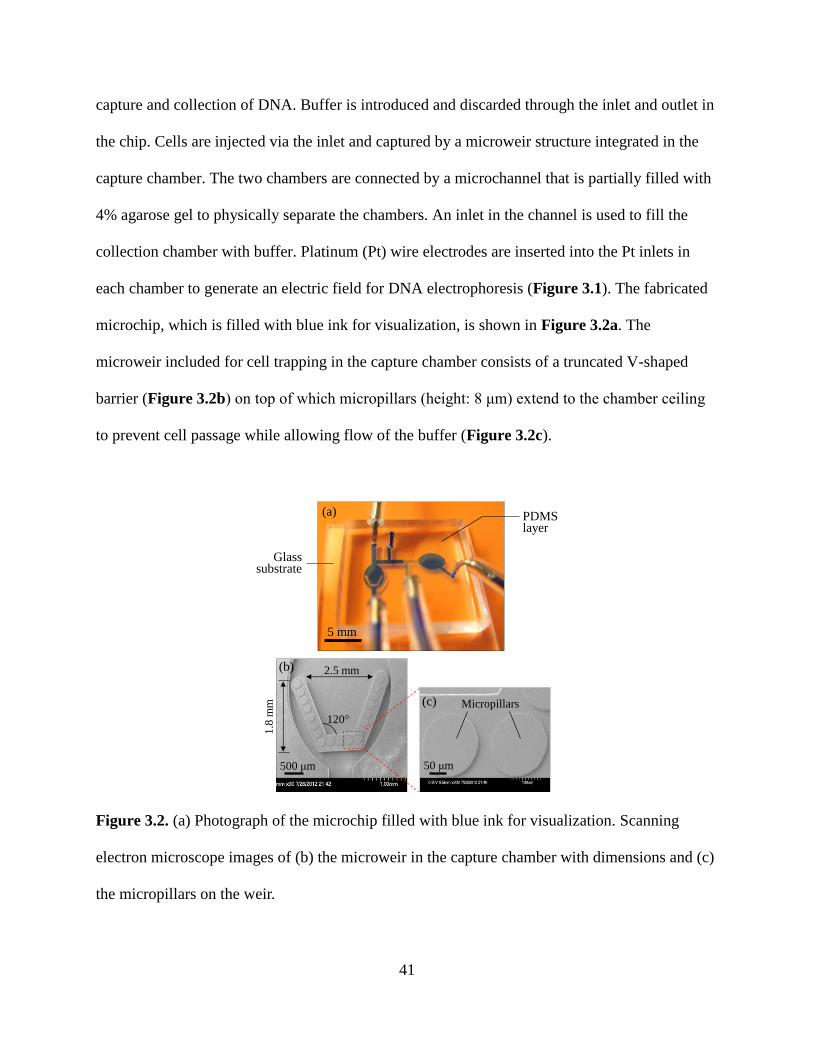
41
capture and collection of DNA. Buffer is introduced and discarded through the inlet and outlet in
the chip. Cells are injected via the inlet and captured by a microweir structure integrated in the
capture chamber. The two chambers are connected by a microchannel that is partially filled with
4% agarose gel to physically separate the chambers. An inlet in the channel is used to fill the
collection chamber with buffer. Platinum (Pt) wire electrodes are inserted into the Pt inlets in
each chamber to generate an electric field for DNA electrophoresis (Figure 3.1). The fabricated
microchip, which is filled with blue ink for visualization, is shown in Figure 3.2a. The
microweir included for cell trapping in the capture chamber consists of a truncated V-shaped
barrier (Figure 3.2b) on top of which micropillars (height: 8 μm) extend to the chamber ceiling
to prevent cell passage while allowing flow of the buffer (Figure 3.2c).
Micropillars
500 μm 50 μm
2.5 mm
1.8
mm
120
5 mm
(a)
(b)
PDMSlayer
Glasssubstrate
(c)
Figure 3.2. (a) Photograph of the microchip filled with blue ink for visualization. Scanning
electron microscope images of (b) the microweir in the capture chamber with dimensions and (c)
the micropillars on the weir.
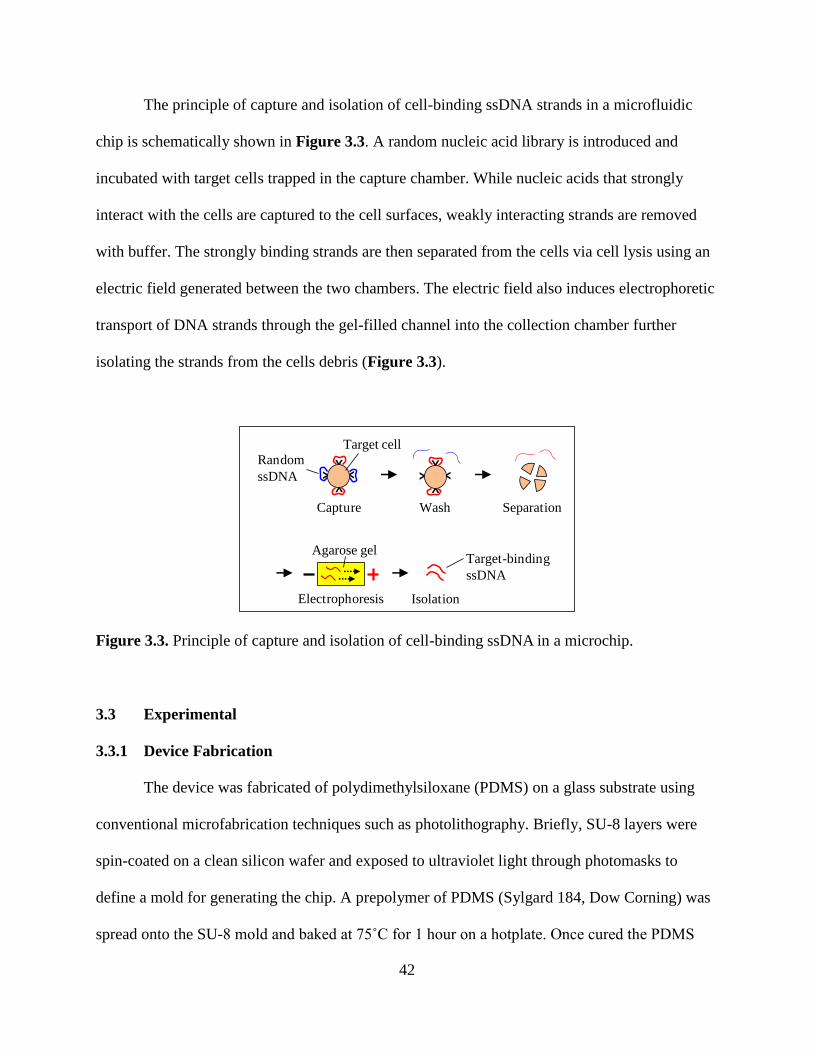
42
The principle of capture and isolation of cell-binding ssDNA strands in a microfluidic
chip is schematically shown in Figure 3.3. A random nucleic acid library is introduced and
incubated with target cells trapped in the capture chamber. While nucleic acids that strongly
interact with the cells are captured to the cell surfaces, weakly interacting strands are removed
with buffer. The strongly binding strands are then separated from the cells via cell lysis using an
electric field generated between the two chambers. The electric field also induces electrophoretic
transport of DNA strands through the gel-filled channel into the collection chamber further
isolating the strands from the cells debris (Figure 3.3).
Capture Wash
Y
Y Y
Y Y
Y Y
Y
Separation
Target cell
Random
ssDNA
Electrophoresis Isolation
Agarose gelTarget-binding
ssDNA
Figure 3.3. Principle of capture and isolation of cell-binding ssDNA in a microchip.
3.3 Experimental
3.3.1 Device Fabrication
The device was fabricated of polydimethylsiloxane (PDMS) on a glass substrate using
conventional microfabrication techniques such as photolithography. Briefly, SU-8 layers were
spin-coated on a clean silicon wafer and exposed to ultraviolet light through photomasks to
define a mold for generating the chip. A prepolymer of PDMS (Sylgard 184, Dow Corning) was
spread onto the SU-8 mold and baked at 75˚C for 1 hour on a hotplate. Once cured the PDMS
43
layer was removed from the mold, access holes for inlets and outlets were made via punching,
and the PDMS was then bonded to a glass substrate following oxygen plasma treatment of the
bonding surfaces. For sample handling, the inlets and outlets were connected to plastic tubes.
Finally, liquid 4% agarose gel was injected into the microchannel and allowed to solidify.
3.3.2 Sample Preparation
Target cells, MCF-7 breast cancer cells (American Type Culture Collection), were
cultured in an incubator, dissociated from the culture dish by trypsin treatment and suspended in
Dulbecco’s phosphate-buffered saline (DPBS, Sigma-Aldrich). A library of fluorescently labeled
87-mer ssDNA containing a 40 nt (nucleotide) random sequence (5’-GCC TGT TGT GAG CCT
CCT GTC GAA -N40- TTG AGC GTT TAT TCT TGT CTC CC-3'), forward (5’-GCC TGT
TGT GAG CCT CCT GTC GAA-3’) and reverse (5’-GGG AGA CAA GAA TAA ACG CTC
AA-3’) primers were purchased from Integrated DNA Technologies. The random DNA library
was prepared by dissolving 1 μL of 100 μM library DNA mixture in 99 μL of DPBS buffer.
HEPES buffer (14 mM HEPES, 50 mM MgCl2, pH 7.5) was used as an electrolyte for DNA
electrophoresis on-chip. Mixtures for polymerase chain reaction (PCR) were prepared following
the manufacturer’s recommendation (Promega).
3.3.3 Experimental Procedure
Capture and isolation experiments of ssDNA strands that strongly interact with MCF-7
cells were carried out as follows. MCF-7 cells in DPBS buffer were injected into the capture
chamber using a micropipette and trapped by the microweir integrated in the chamber. A
randomized ssDNA library (100 μL) was introduced into the chamber (5 μL/min) using a syringe
44
pump to induce binding interaction between DNA strands and the cells. Strands weakly bound to
the cells were removed by washing with DPBS buffer (10 μL/min) while the waste solutions
were collected at the outlet of the chamber. Following washing, both chambers were filled with
HEPES buffer and Pt electrodes were inserted into the Pt inlets (i.e., anode and cathode in the
collection and capture chambers, respectively) and 120 V of potential difference was applied for
20 minutes.
The microweir-based cell trapping process in the capture chamber is monitored using a
microscope. Eluents containing DNA strands were collected throughout the experiment and
amplified via PCR using a conventional thermocycler. The concentration of DNA in each eluent
was then evaluated using slab-gel electrophoresis by comparing the band intensities for each
eluent. A fluorescence spectrometer was used to quantify the amount of DNA in the solution
obtained following the electrophoretical transport of DNA from the capture chamber to the
collection chamber.
3.4 Results and Discussion
The device was tested for its ability to trap MCF-7 cells (mean diameter: 15 μm) using
the microweir in the capture chamber. MCF-7 cells suspended in 10 μL of DPBS buffer solution
(~106 cells/mL) were slowly injected into the chamber via micropipette. While the majority of
the injected cells were trapped, some of the cells escaped without being retained by the weir
(Figure 3.4a). Cells that were not trapped by the weir were washed away with fresh DPBS
buffer injected using a micropipette through the chamber inlet. More than 1,000 cells were
trapped in the chamber following the cell loading process (Figure 3.4b).
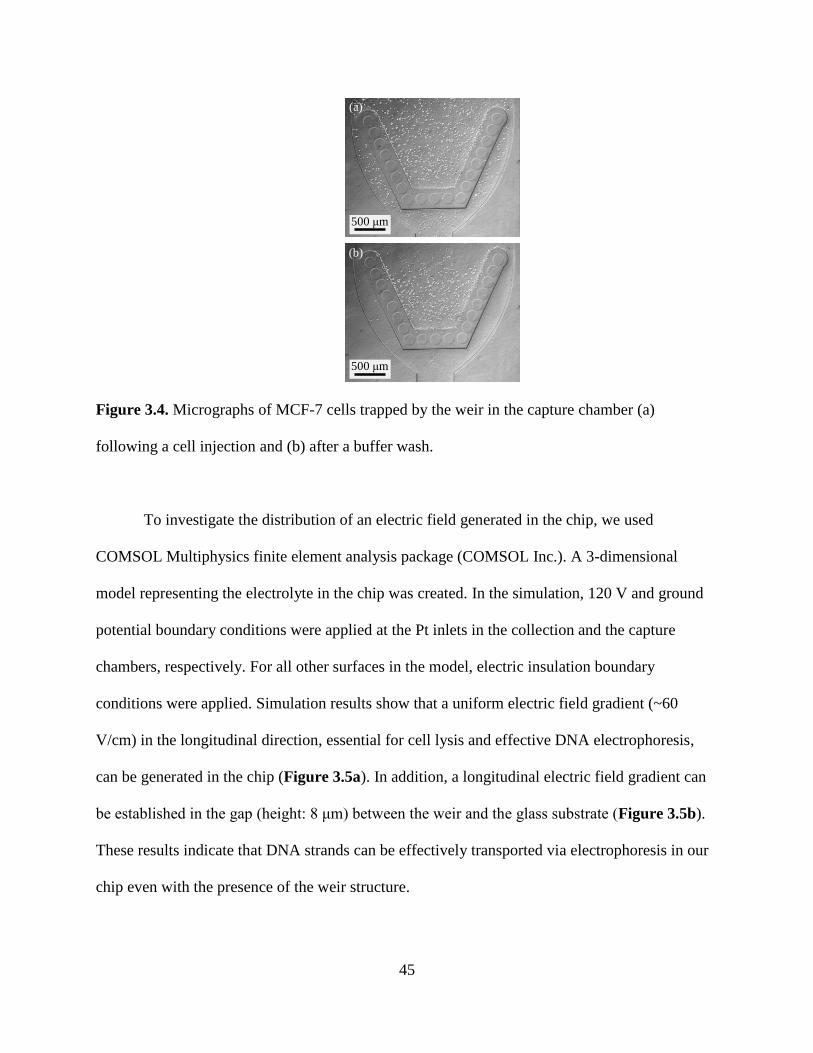
45
(a)
500 μm
(b)
500 μm
Figure 3.4. Micrographs of MCF-7 cells trapped by the weir in the capture chamber (a)
following a cell injection and (b) after a buffer wash.
To investigate the distribution of an electric field generated in the chip, we used
COMSOL Multiphysics finite element analysis package (COMSOL Inc.). A 3-dimensional
model representing the electrolyte in the chip was created. In the simulation, 120 V and ground
potential boundary conditions were applied at the Pt inlets in the collection and the capture
chambers, respectively. For all other surfaces in the model, electric insulation boundary
conditions were applied. Simulation results show that a uniform electric field gradient (~60
V/cm) in the longitudinal direction, essential for cell lysis and effective DNA electrophoresis,
can be generated in the chip (Figure 3.5a). In addition, a longitudinal electric field gradient can
be established in the gap (height: 8 μm) between the weir and the glass substrate (Figure 3.5b).
These results indicate that DNA strands can be effectively transported via electrophoresis in our
chip even with the presence of the weir structure.
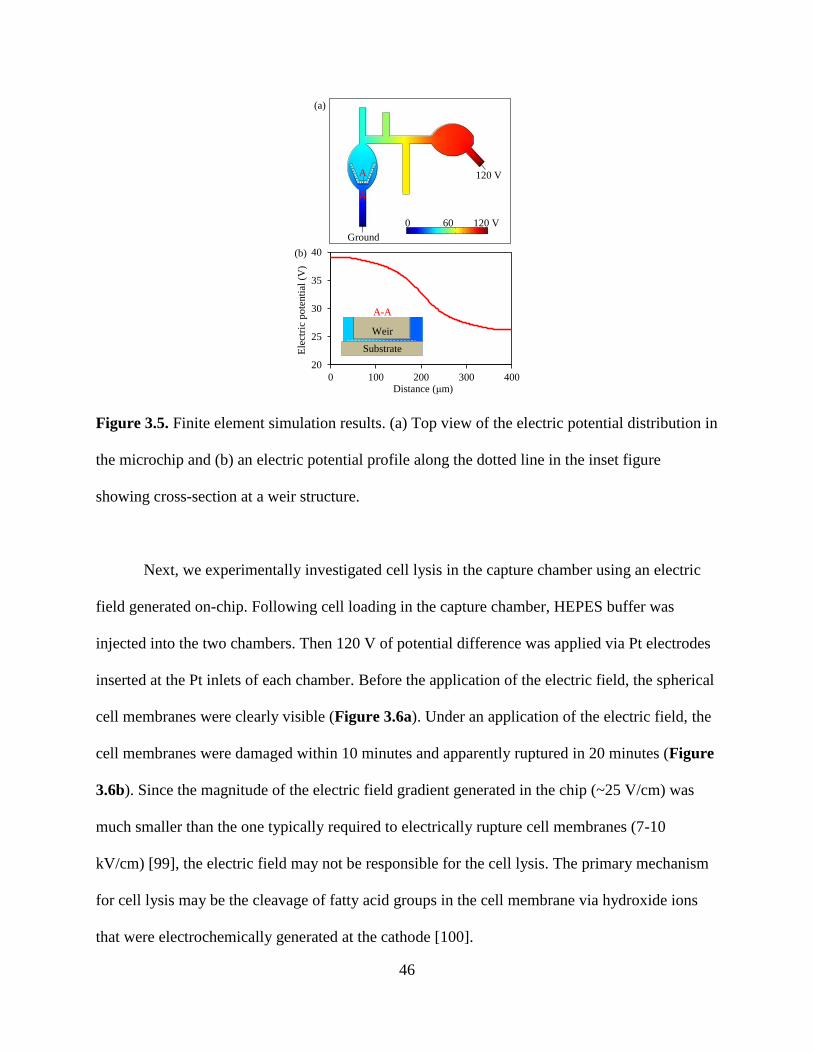
46
Ground
120 V
(a)
0 120 V60
20
25
30
35
40
0 100 200 300 400
Ele
ctri
c p
ote
nti
al (
V)
Distance (μm)
(b)
Weir
Substrate
A
A
A-A
Figure 3.5. Finite element simulation results. (a) Top view of the electric potential distribution in
the microchip and (b) an electric potential profile along the dotted line in the inset figure
showing cross-section at a weir structure.
Next, we experimentally investigated cell lysis in the capture chamber using an electric
field generated on-chip. Following cell loading in the capture chamber, HEPES buffer was
injected into the two chambers. Then 120 V of potential difference was applied via Pt electrodes
inserted at the Pt inlets of each chamber. Before the application of the electric field, the spherical
cell membranes were clearly visible (Figure 3.6a). Under an application of the electric field, the
cell membranes were damaged within 10 minutes and apparently ruptured in 20 minutes (Figure
3.6b). Since the magnitude of the electric field gradient generated in the chip (~25 V/cm) was
much smaller than the one typically required to electrically rupture cell membranes (7-10
kV/cm) [99], the electric field may not be responsible for the cell lysis. The primary mechanism
for cell lysis may be the cleavage of fatty acid groups in the cell membrane via hydroxide ions
that were electrochemically generated at the cathode [100].
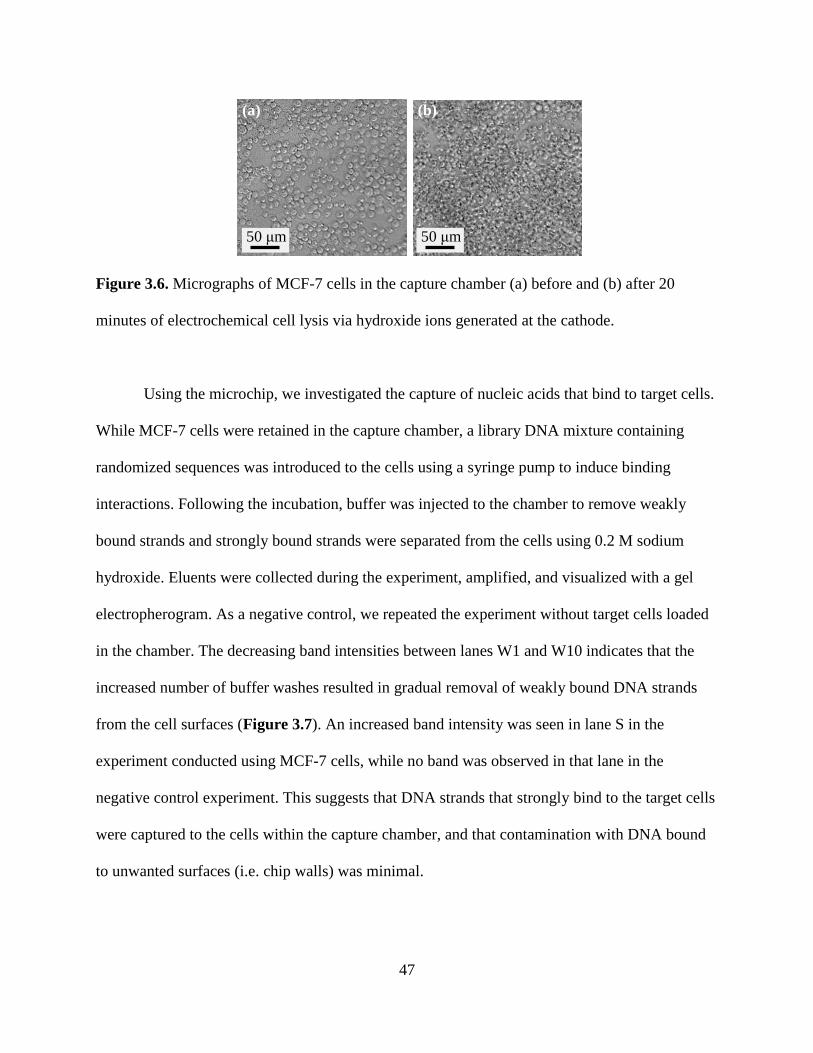
47
50 μm 50 μm
(b)(a)
Figure 3.6. Micrographs of MCF-7 cells in the capture chamber (a) before and (b) after 20
minutes of electrochemical cell lysis via hydroxide ions generated at the cathode.
Using the microchip, we investigated the capture of nucleic acids that bind to target cells.
While MCF-7 cells were retained in the capture chamber, a library DNA mixture containing
randomized sequences was introduced to the cells using a syringe pump to induce binding
interactions. Following the incubation, buffer was injected to the chamber to remove weakly
bound strands and strongly bound strands were separated from the cells using 0.2 M sodium
hydroxide. Eluents were collected during the experiment, amplified, and visualized with a gel
electropherogram. As a negative control, we repeated the experiment without target cells loaded
in the chamber. The decreasing band intensities between lanes W1 and W10 indicates that the
increased number of buffer washes resulted in gradual removal of weakly bound DNA strands
from the cell surfaces (Figure 3.7). An increased band intensity was seen in lane S in the
experiment conducted using MCF-7 cells, while no band was observed in that lane in the
negative control experiment. This suggests that DNA strands that strongly bind to the target cells
were captured to the cells within the capture chamber, and that contamination with DNA bound
to unwanted surfaces (i.e. chip walls) was minimal.
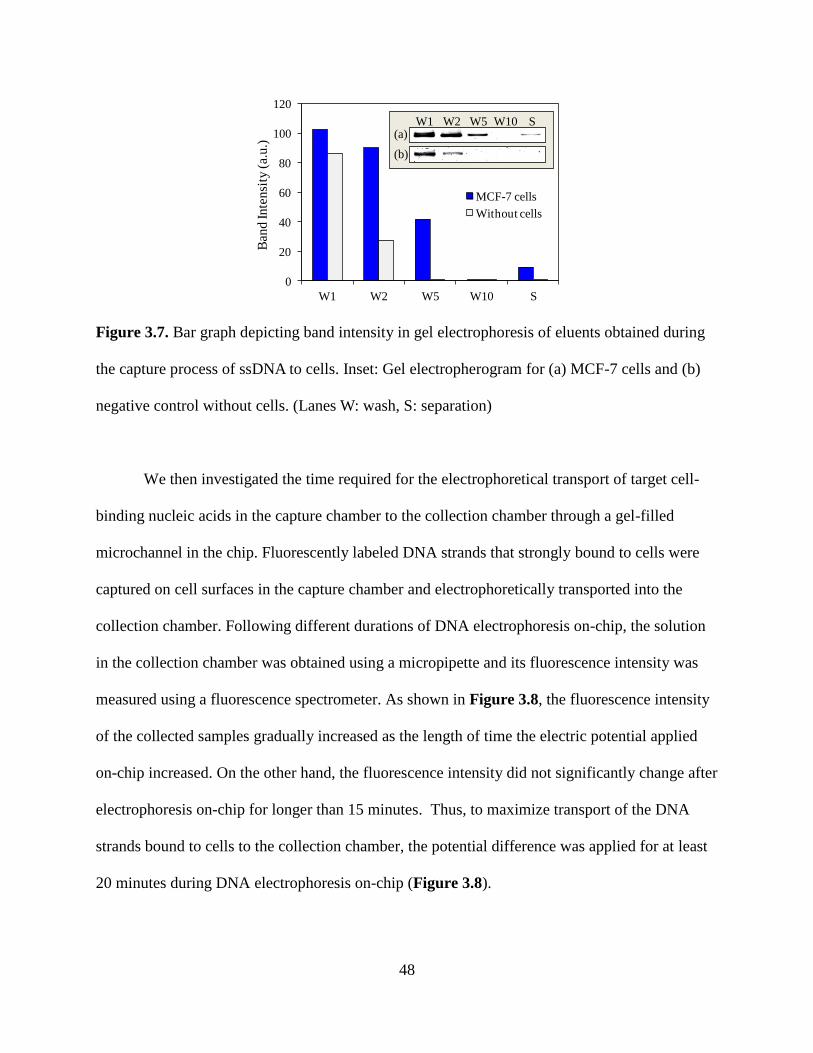
48
0
20
40
60
80
100
120
W1 W2 W5 W10 S
Ban
d Inte
nsi
ty (
a.u.)
MCF-7 cells
Without cells
W1 W2 W5 W10 S(a)
(b)
Figure 3.7. Bar graph depicting band intensity in gel electrophoresis of eluents obtained during
the capture process of ssDNA to cells. Inset: Gel electropherogram for (a) MCF-7 cells and (b)
negative control without cells. (Lanes W: wash, S: separation)
We then investigated the time required for the electrophoretical transport of target cell-
binding nucleic acids in the capture chamber to the collection chamber through a gel-filled
microchannel in the chip. Fluorescently labeled DNA strands that strongly bound to cells were
captured on cell surfaces in the capture chamber and electrophoretically transported into the
collection chamber. Following different durations of DNA electrophoresis on-chip, the solution
in the collection chamber was obtained using a micropipette and its fluorescence intensity was
measured using a fluorescence spectrometer. As shown in Figure 3.8, the fluorescence intensity
of the collected samples gradually increased as the length of time the electric potential applied
on-chip increased. On the other hand, the fluorescence intensity did not significantly change after
electrophoresis on-chip for longer than 15 minutes. Thus, to maximize transport of the DNA
strands bound to cells to the collection chamber, the potential difference was applied for at least
20 minutes during DNA electrophoresis on-chip (Figure 3.8).
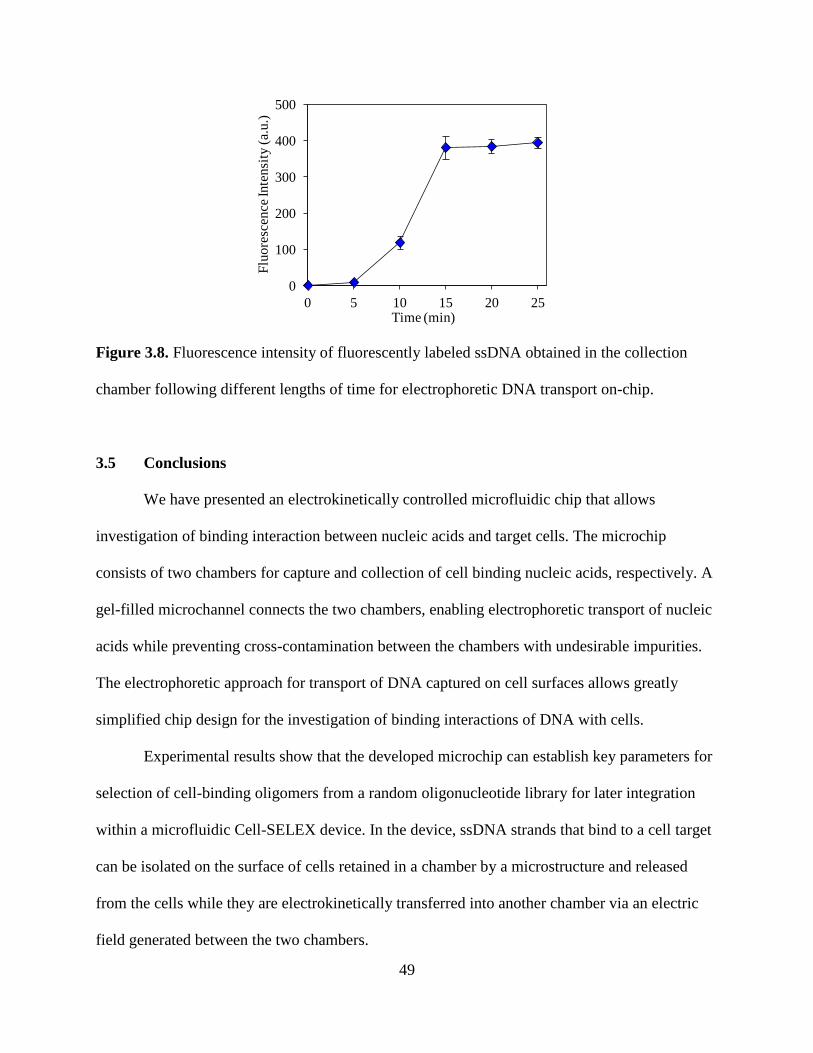
49
0
100
200
300
400
500
0 5 10 15 20 25
Flu
ore
scen
ce In
tensi
ty (
a.u.)
Time (min)
Figure 3.8. Fluorescence intensity of fluorescently labeled ssDNA obtained in the collection
chamber following different lengths of time for electrophoretic DNA transport on-chip.
3.5 Conclusions
We have presented an electrokinetically controlled microfluidic chip that allows
investigation of binding interaction between nucleic acids and target cells. The microchip
consists of two chambers for capture and collection of cell binding nucleic acids, respectively. A
gel-filled microchannel connects the two chambers, enabling electrophoretic transport of nucleic
acids while preventing cross-contamination between the chambers with undesirable impurities.
The electrophoretic approach for transport of DNA captured on cell surfaces allows greatly
simplified chip design for the investigation of binding interactions of DNA with cells.
Experimental results show that the developed microchip can establish key parameters for
selection of cell-binding oligomers from a random oligonucleotide library for later integration
within a microfluidic Cell-SELEX device. In the device, ssDNA strands that bind to a cell target
can be isolated on the surface of cells retained in a chamber by a microstructure and released
from the cells while they are electrokinetically transferred into another chamber via an electric
field generated between the two chambers.
50
Chapter 4. Microfluidic Isolation and Amplification of Protein-Binding
Nucleic Acids
4.1 Introduction
This chapter presents a microfluidic device that fully integrates solid-phase-based
isolation of protein-binding nucleic acids with amplification of the isolated nucleic acids by
polymerase chain reaction (PCR) on bead surfaces. In the device, DNA strands were
manipulated using electrokinetically based molecular manipulation method adapted from
preliminary devices.
Analytes in biological samples are often present in minute quantities and contaminated
with impurities in samples; it is thus of great interest to develop efficient methods and devices to
isolate and enrich such analytes. In particular, isolation and amplification of DNA molecules
have important applications to clinical detection of disease-related DNA markers [101] and
synthetic selection of analyte-specific nucleic acids such as aptamers [55, 58]. Recently,
microfluidic technology employing solid-phase extraction and electrophoretic separation has
been applied to improve enrichment efficiency. However, existing microfluidic devices still
typically require additional off-chip processes to isolate target-specific analytes from a solution.
We recently developed a microchip in which target-binding DNA can be isolated and enriched
by bead-based isolation and gel-based electrophoretic transport; however, the device was not yet
capable of integrated DNA amplification, which is needed for assays such as clinical detection of
DNA biomarkers [102] and binding affinity measurements [13].
We present a microfluidic chip that fully integrates solid-phase-based DNA isolation with
amplification of the isolated nucleic acids by polymerase chain reaction (PCR) using
electrokinetically based molecular manipulation. In the chip, target-binding single-stranded DNA
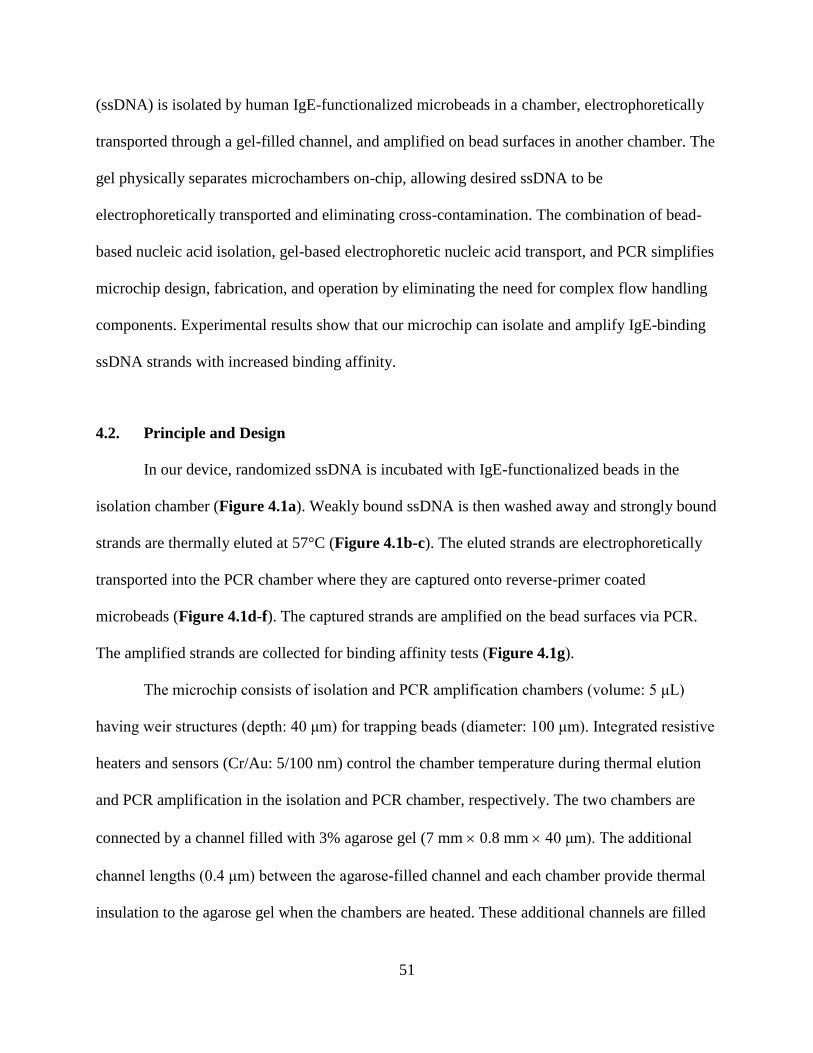
51
(ssDNA) is isolated by human IgE-functionalized microbeads in a chamber, electrophoretically
transported through a gel-filled channel, and amplified on bead surfaces in another chamber. The
gel physically separates microchambers on-chip, allowing desired ssDNA to be
electrophoretically transported and eliminating cross-contamination. The combination of bead-
based nucleic acid isolation, gel-based electrophoretic nucleic acid transport, and PCR simplifies
microchip design, fabrication, and operation by eliminating the need for complex flow handling
components. Experimental results show that our microchip can isolate and amplify IgE-binding
ssDNA strands with increased binding affinity.
4.2. Principle and Design
In our device, randomized ssDNA is incubated with IgE-functionalized beads in the
isolation chamber (Figure 4.1a). Weakly bound ssDNA is then washed away and strongly bound
strands are thermally eluted at 57°C (Figure 4.1b-c). The eluted strands are electrophoretically
transported into the PCR chamber where they are captured onto reverse-primer coated
microbeads (Figure 4.1d-f). The captured strands are amplified on the bead surfaces via PCR.
The amplified strands are collected for binding affinity tests (Figure 4.1g).
The microchip consists of isolation and PCR amplification chambers (volume: 5 μL)
having weir structures (depth: 40 μm) for trapping beads (diameter: 100 μm). Integrated resistive
heaters and sensors (Cr/Au: 5/100 nm) control the chamber temperature during thermal elution
and PCR amplification in the isolation and PCR chamber, respectively. The two chambers are
connected by a channel filled with 3% agarose gel (7 mm 0.8 mm 40 μm). The additional
channel lengths (0.4 μm) between the agarose-filled channel and each chamber provide thermal
insulation to the agarose gel when the chambers are heated. These additional channels are filled
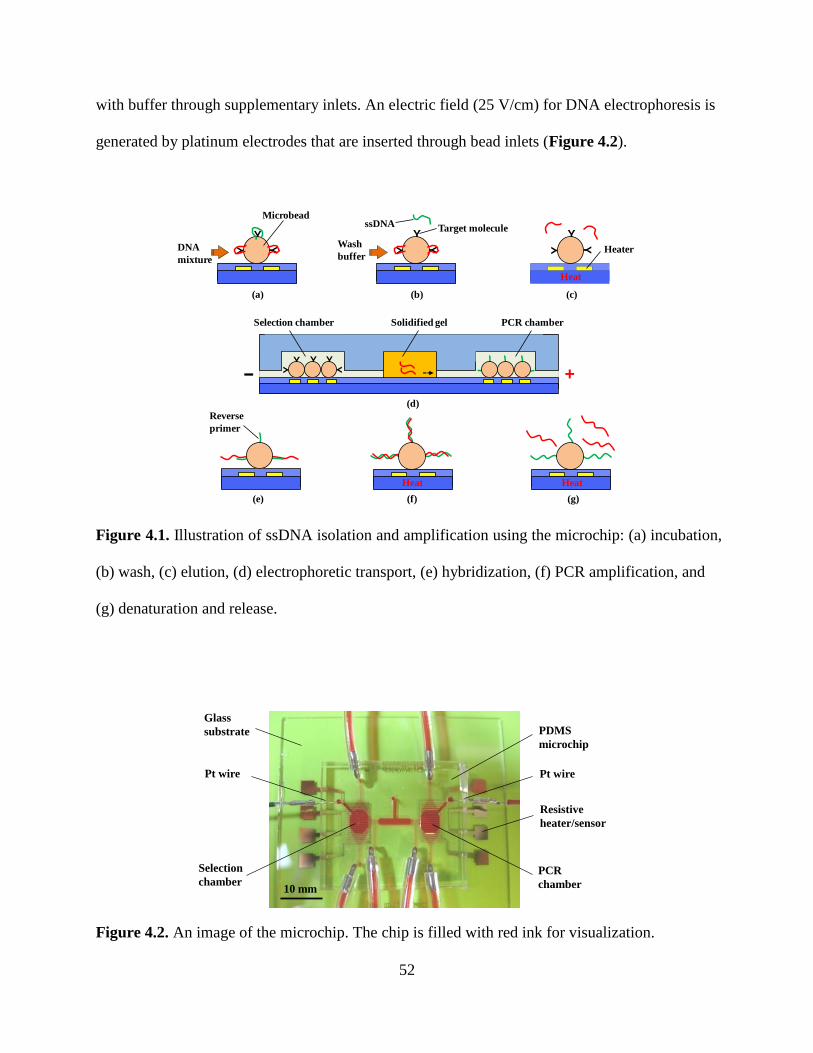
52
with buffer through supplementary inlets. An electric field (25 V/cm) for DNA electrophoresis is
generated by platinum electrodes that are inserted through bead inlets (Figure 4.2).
YYY
Y
− +
DNA
mixture
Wash
buffer
Heat
Heater
Selection chamber PCR chamber
Heat
Solidified gel
Target moleculessDNAMicrobead
Reverse
primer
Y
Y
Y
Y
Y
Y
Y
YY Y
Heat
(a) (b) (c)
(d)
(e) (f) (g)
Figure 4.1. Illustration of ssDNA isolation and amplification using the microchip: (a) incubation,
(b) wash, (c) elution, (d) electrophoretic transport, (e) hybridization, (f) PCR amplification, and
(g) denaturation and release.
10 mm
Pt wirePt wire
Glass
substrate
Selection
chamberPCR
chamber
PDMS
microchip
Resistive
heater/sensor
Figure 4.2. An image of the microchip. The chip is filled with red ink for visualization.
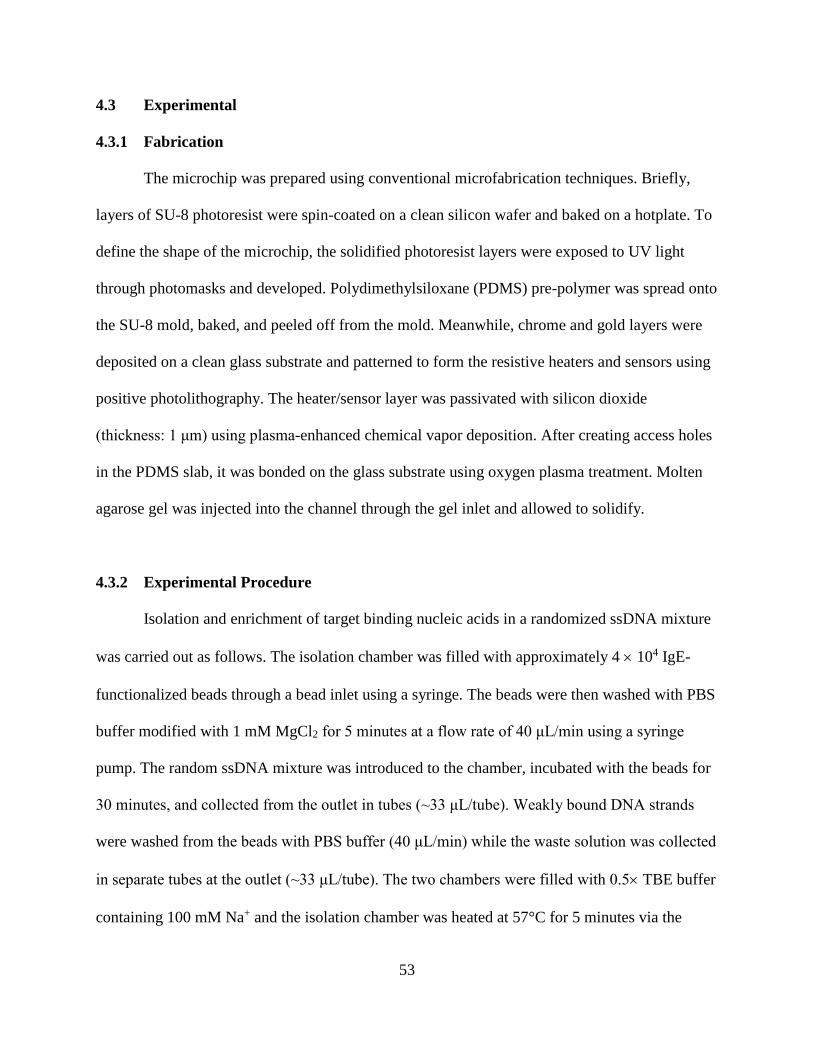
53
4.3 Experimental
4.3.1 Fabrication
The microchip was prepared using conventional microfabrication techniques. Briefly,
layers of SU-8 photoresist were spin-coated on a clean silicon wafer and baked on a hotplate. To
define the shape of the microchip, the solidified photoresist layers were exposed to UV light
through photomasks and developed. Polydimethylsiloxane (PDMS) pre-polymer was spread onto
the SU-8 mold, baked, and peeled off from the mold. Meanwhile, chrome and gold layers were
deposited on a clean glass substrate and patterned to form the resistive heaters and sensors using
positive photolithography. The heater/sensor layer was passivated with silicon dioxide
(thickness: 1 μm) using plasma-enhanced chemical vapor deposition. After creating access holes
in the PDMS slab, it was bonded on the glass substrate using oxygen plasma treatment. Molten
agarose gel was injected into the channel through the gel inlet and allowed to solidify.
4.3.2 Experimental Procedure
Isolation and enrichment of target binding nucleic acids in a randomized ssDNA mixture
was carried out as follows. The isolation chamber was filled with approximately 4 104 IgE-
functionalized beads through a bead inlet using a syringe. The beads were then washed with PBS
buffer modified with 1 mM MgCl2 for 5 minutes at a flow rate of 40 μL/min using a syringe
pump. The random ssDNA mixture was introduced to the chamber, incubated with the beads for
30 minutes, and collected from the outlet in tubes (~33 μL/tube). Weakly bound DNA strands
were washed from the beads with PBS buffer (40 μL/min) while the waste solution was collected
in separate tubes at the outlet (~33 μL/tube). The two chambers were filled with 0.5 TBE buffer
containing 100 mM Na+ and the isolation chamber was heated at 57°C for 5 minutes via the
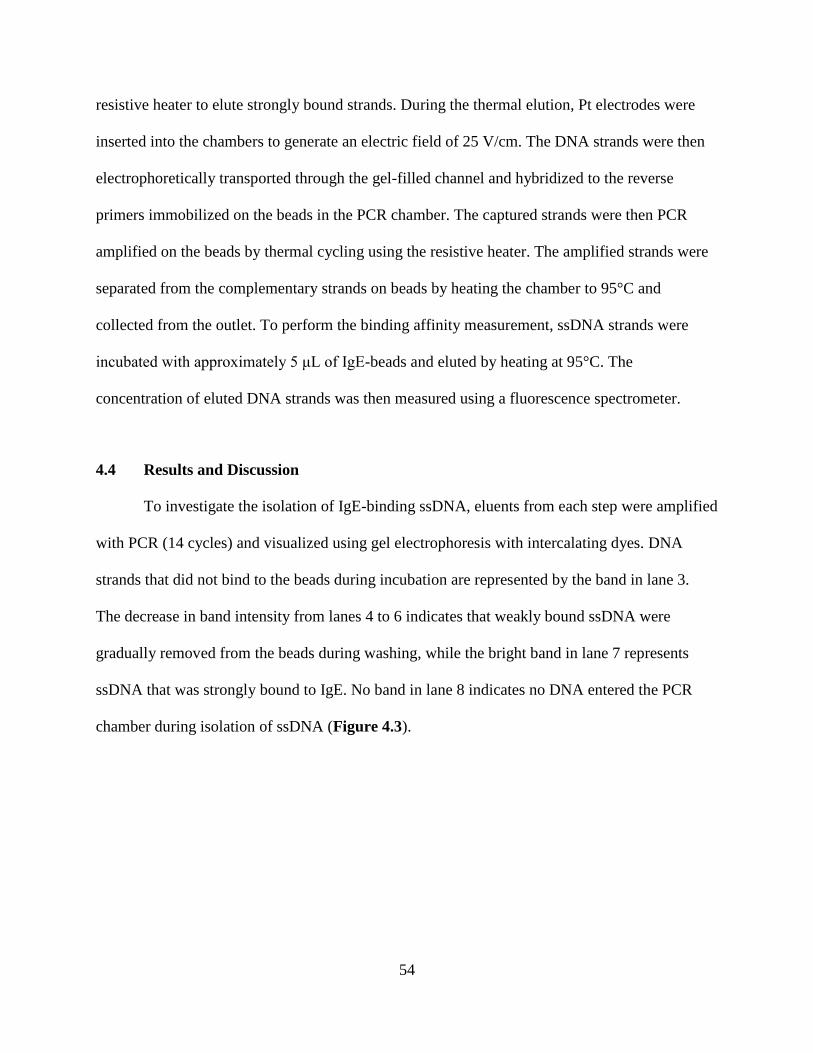
54
resistive heater to elute strongly bound strands. During the thermal elution, Pt electrodes were
inserted into the chambers to generate an electric field of 25 V/cm. The DNA strands were then
electrophoretically transported through the gel-filled channel and hybridized to the reverse
primers immobilized on the beads in the PCR chamber. The captured strands were then PCR
amplified on the beads by thermal cycling using the resistive heater. The amplified strands were
separated from the complementary strands on beads by heating the chamber to 95°C and
collected from the outlet. To perform the binding affinity measurement, ssDNA strands were
incubated with approximately 5 μL of IgE-beads and eluted by heating at 95°C. The
concentration of eluted DNA strands was then measured using a fluorescence spectrometer.
4.4 Results and Discussion
To investigate the isolation of IgE-binding ssDNA, eluents from each step were amplified
with PCR (14 cycles) and visualized using gel electrophoresis with intercalating dyes. DNA
strands that did not bind to the beads during incubation are represented by the band in lane 3.
The decrease in band intensity from lanes 4 to 6 indicates that weakly bound ssDNA were
gradually removed from the beads during washing, while the bright band in lane 7 represents
ssDNA that was strongly bound to IgE. No band in lane 8 indicates no DNA entered the PCR
chamber during isolation of ssDNA (Figure 4.3).
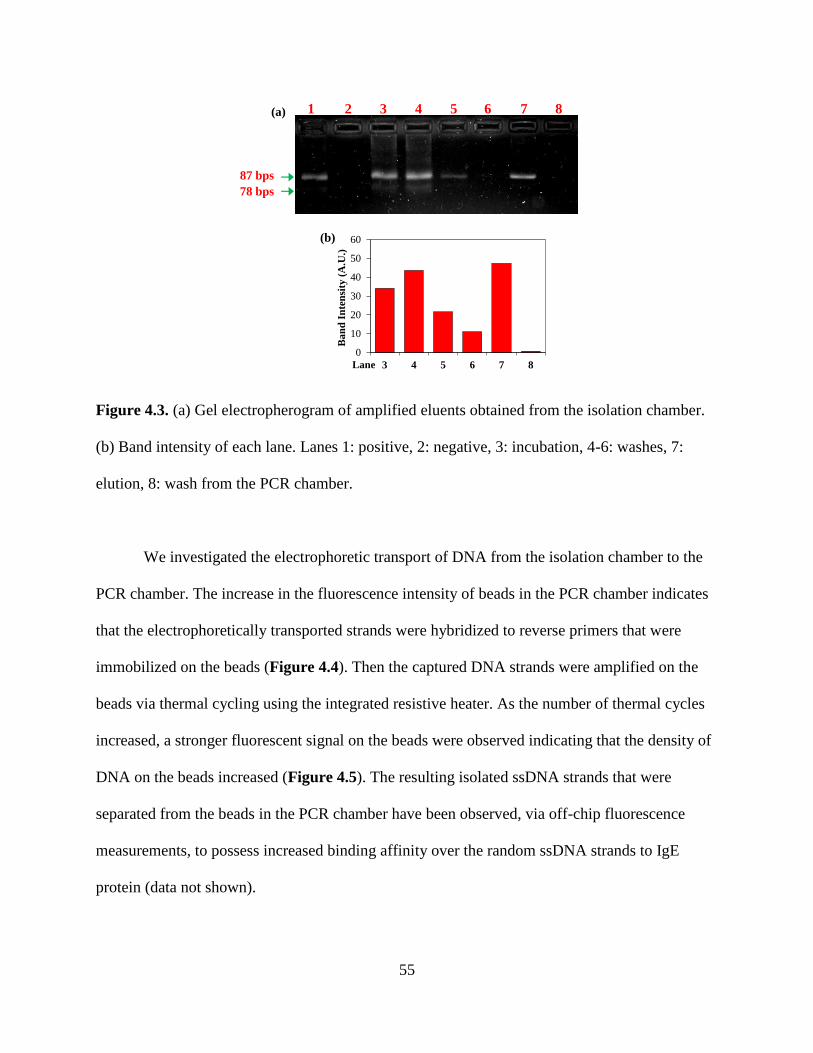
55
1 2 3 4 5 6 7 8
87 bps
78 bps
0
10
20
30
40
50
60
3 4 5 6 7 8
Ban
d I
nte
nsi
ty (
A.U
.)
Lane
(a)
(b)
Figure 4.3. (a) Gel electropherogram of amplified eluents obtained from the isolation chamber.
(b) Band intensity of each lane. Lanes 1: positive, 2: negative, 3: incubation, 4-6: washes, 7:
elution, 8: wash from the PCR chamber.
We investigated the electrophoretic transport of DNA from the isolation chamber to the
PCR chamber. The increase in the fluorescence intensity of beads in the PCR chamber indicates
that the electrophoretically transported strands were hybridized to reverse primers that were
immobilized on the beads (Figure 4.4). Then the captured DNA strands were amplified on the
beads via thermal cycling using the integrated resistive heater. As the number of thermal cycles
increased, a stronger fluorescent signal on the beads were observed indicating that the density of
DNA on the beads increased (Figure 4.5). The resulting isolated ssDNA strands that were
separated from the beads in the PCR chamber have been observed, via off-chip fluorescence
measurements, to possess increased binding affinity over the random ssDNA strands to IgE
protein (data not shown).
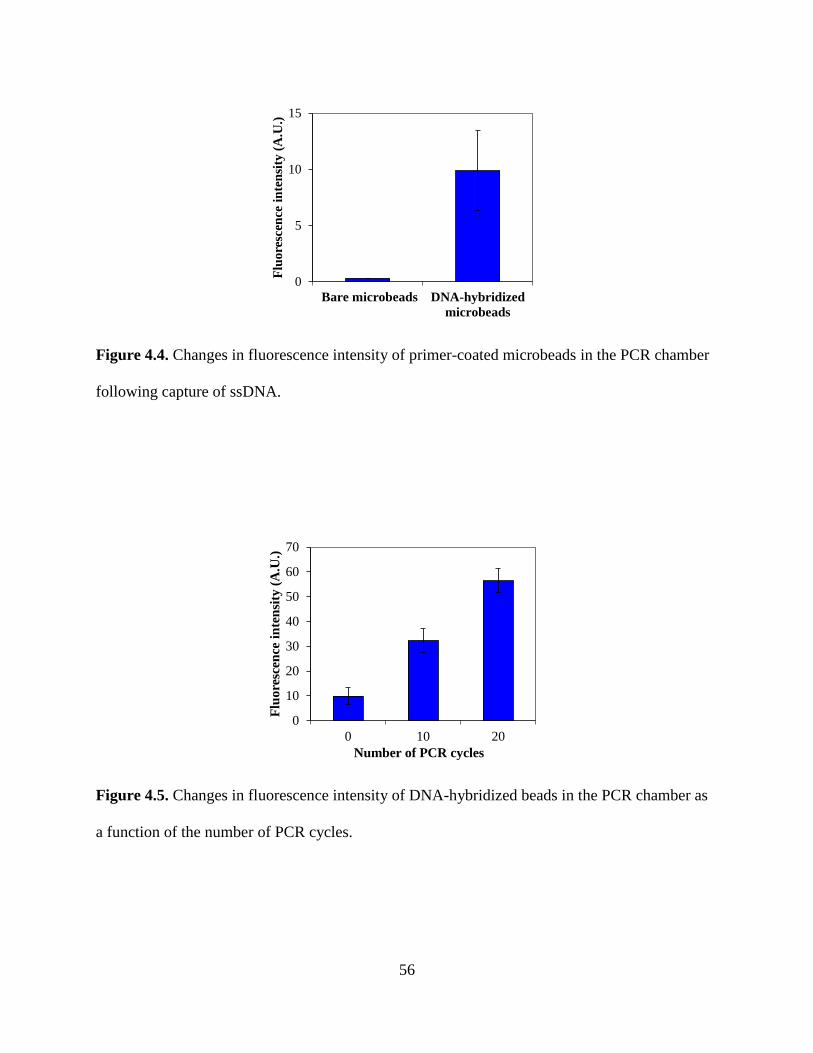
56
0
5
10
15
Bare microbeads DNA-hybridized
microbeads
Flu
ore
scen
ce i
nte
nsi
ty (
A.U
.)
Figure 4.4. Changes in fluorescence intensity of primer-coated microbeads in the PCR chamber
following capture of ssDNA.
0
10
20
30
40
50
60
70
0 10 20
Flu
ore
scen
ce i
nte
nsi
ty (
A.U
.)
Number of PCR cycles
Figure 4.5. Changes in fluorescence intensity of DNA-hybridized beads in the PCR chamber as
a function of the number of PCR cycles.
57
4.5 Conclusions
We have demonstrated an integrated microfluidic chip for isolating and amplifying
ssDNA that bind to human IgE antibody protein. In the chip, cross-contamination of buffers in
different microchambers was eliminated with the gel-filled channel, while complicated flow
handling components were not necessary realizing a greatly simplified chip operation.
Experimental results show that the microfluidic device developed is capable of achieving
processes required for a single round of SELEX against protein targets. These results will be
used as a basis for establishing parameters for selection, transfer, and amplification that are
required in multiple rounds of SELEX using a microfluidic device. In such device, DNA strands
that strongly bind to a protein target will be isolated on target-functionalized microbeads in a
microchamber and amplified in another chamber, while the DNA strands will be
electrokinetically manipulated between the chambers.
58
Chapter 5. Microfluidic Selection and Enrichment of Biomolecule-and Cell-
Binding Aptamers
5.1 Introduction
In this chapter, we present a microfluidic approach for integrated isolation of target-
binding nucleic acids for biomolecules and cells, and amplification of strands via electrokinetic
control. The devices are capable of isolating and amplifying nucleic acids that bind to
biomolecules, and allows microfluidic isolation of nucleic acids specific to cellular targets.
Molecules that can strongly bind to specific biological analytes such as small molecules,
proteins, cells, and organisms have important biomedical applications. In particular, target-
binding nucleic acids (e.g., aptamers) can be obtained for a broad spectrum of analytes with high
affinity and can possess well controlled target selectivity. Also they can bind to targets with
predefined characteristics in equilibrium, kinetic, thermodynamics dependence, and stimuli
responsive properties. Because of these advantages, target-binding nucleic acids are highly
attractive for clinical applications as well as basic research. However, methods for development
of target-binding nucleic acids are time- and resource-consuming due to many individual
procedures requiring hundreds of sample handling steps.
Recently, microfluidic technology has been employed to efficiently select target-binding
nucleic acids. For example, a microfluidic device has been developed to effectively trap target-
functionalized magnetic beads using magnetic field gradients. The device demonstrated a rapid
enrichment of target-specific strands by efficiently removing weakly binding strands [53].
Significant progress also has been made to develop microfluidic chips to integrate the
components required for the entire selection processes of target-binding nucleic acids in a single
59
device. In such devices, sample solutions are manipulated by pneumatically controlled
components while DNA strands are amplified by on-chip thermocycling [63, 103].
While demonstrating improved selection efficiencies and reduced assay times, these
existing devices still require additional off-chip processes such as the separation of double-
stranded DNA (dsDNA) into single-stranded DNA (ssDNA). In addition, effective separation of
enriched products from raw samples is challenging and contamination of the product solution
with impurities commonly occurs in existing devices. Thus, complicated flow control
components for sample handling such as pneumatically driven pumps and valves are required in
the devices [13].
Aiming to address these issues, we present a microfluidic approach for integrated
isolation and amplification of target-binding nucleic acids via electrokinetic control. The
microfluidic device used benefits from a highly simplified design achieved by combining
surface-based DNA isolation and amplification with gel-based electrophoretic transport. The
separation of different functional microchambers by a gel eliminates cross-contamination while
allowing for electrophoretic transport of DNA. The device is capable of isolating and amplifying
nucleic acids that bind to biomolecules, and allows microfluidic isolation of nucleic acids
specific to cellular targets. The device’s high level of integration enables isolation and
amplification of target-binding nucleic acids within 10 hours, which is much shortened compared
with weeks to months required by conventional platforms.
5.2 Principle and Design
The principle of the isolation and amplification of target-binding DNA on-chip is
schematically shown in Figure 5.1. For isolation of nucleic acids binding to small molecules,
microbeads functionalized with capture sequences and random DNA are incubated with the
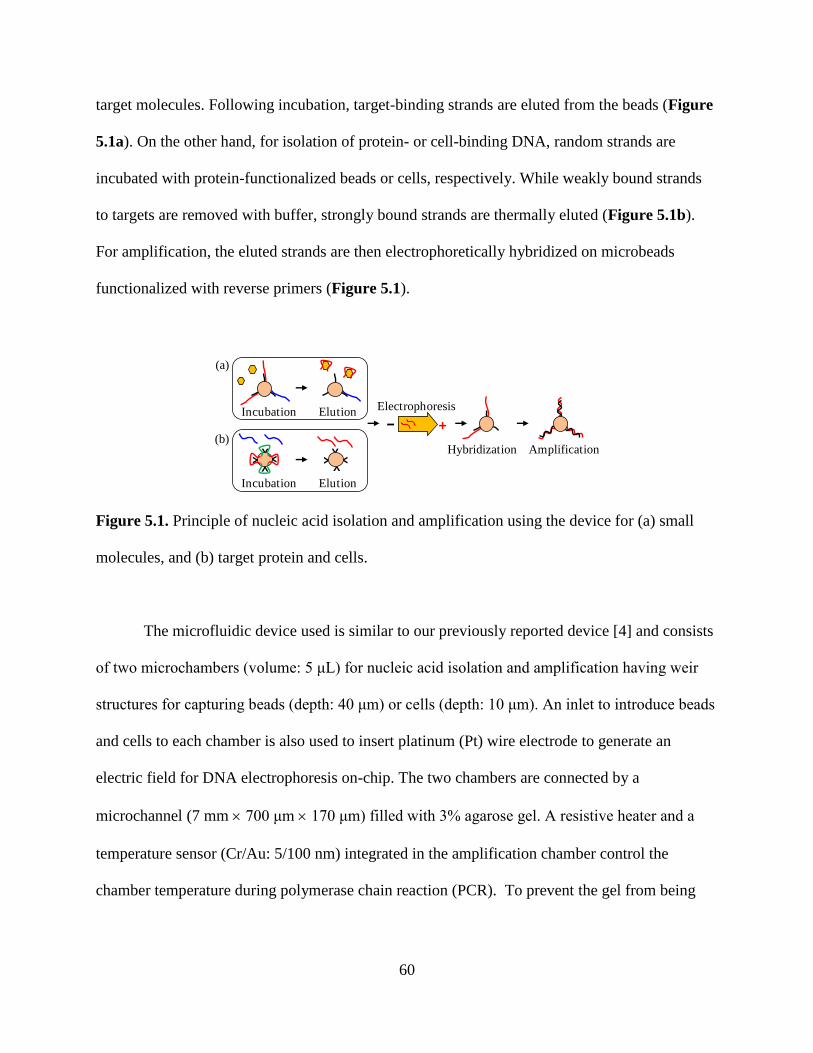
60
target molecules. Following incubation, target-binding strands are eluted from the beads (Figure
5.1a). On the other hand, for isolation of protein- or cell-binding DNA, random strands are
incubated with protein-functionalized beads or cells, respectively. While weakly bound strands
to targets are removed with buffer, strongly bound strands are thermally eluted (Figure 5.1b).
For amplification, the eluted strands are then electrophoretically hybridized on microbeads
functionalized with reverse primers (Figure 5.1).
− +Incubation Elution
Electrophoresis
AmplificationHybridization
Y
Y Y
Y Y
Y Y
Y
Incubation Elution
(a)
(b)
Figure 5.1. Principle of nucleic acid isolation and amplification using the device for (a) small
molecules, and (b) target protein and cells.
The microfluidic device used is similar to our previously reported device [4] and consists
of two microchambers (volume: 5 μL) for nucleic acid isolation and amplification having weir
structures for capturing beads (depth: 40 μm) or cells (depth: 10 μm). An inlet to introduce beads
and cells to each chamber is also used to insert platinum (Pt) wire electrode to generate an
electric field for DNA electrophoresis on-chip. The two chambers are connected by a
microchannel (7 mm 700 μm 170 μm) filled with 3% agarose gel. A resistive heater and a
temperature sensor (Cr/Au: 5/100 nm) integrated in the amplification chamber control the
chamber temperature during polymerase chain reaction (PCR). To prevent the gel from being
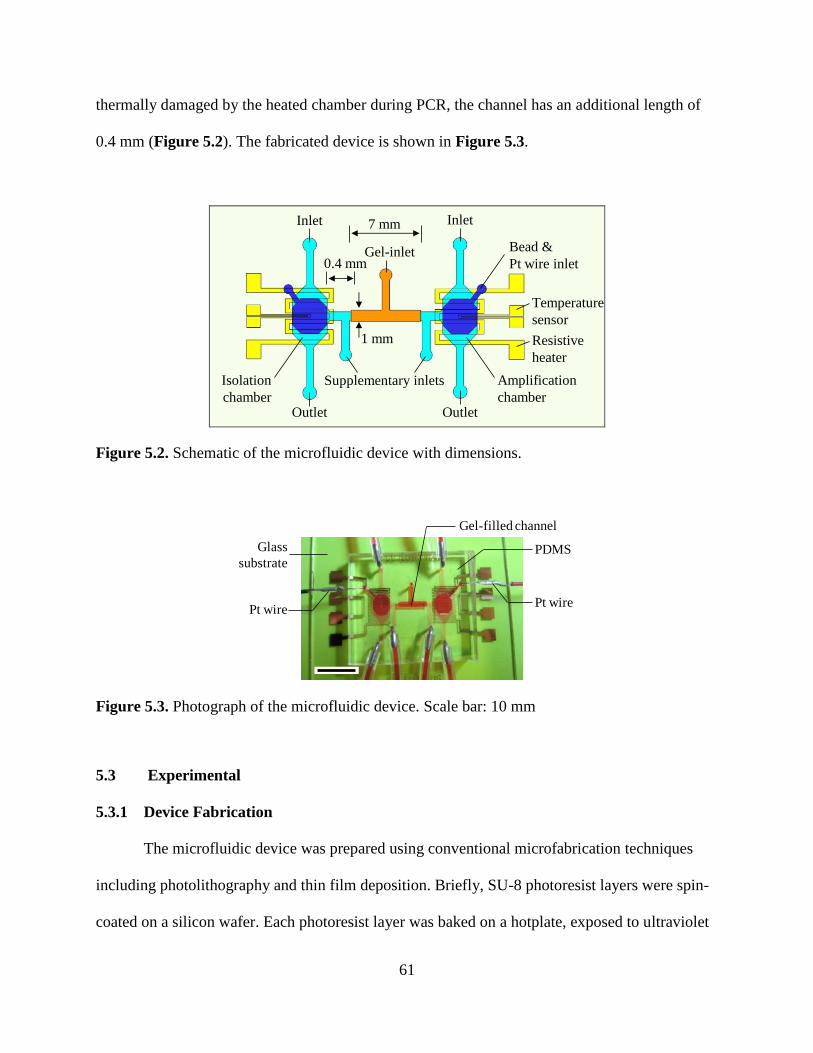
61
thermally damaged by the heated chamber during PCR, the channel has an additional length of
0.4 mm (Figure 5.2). The fabricated device is shown in Figure 5.3.
Temperature
sensor
Supplementary inlets
7 mm
1 mm
Isolation
chamber
Inlet Inlet
Outlet Outlet
Resistive
heater
Amplification
chamber
Bead &
Pt wire inlet0.4 mmGel-inlet
Figure 5.2. Schematic of the microfluidic device with dimensions.
Glass
substrate
Pt wire
PDMS
Gel-filled channel
Pt wire
Figure 5.3. Photograph of the microfluidic device. Scale bar: 10 mm
5.3 Experimental
5.3.1 Device Fabrication
The microfluidic device was prepared using conventional microfabrication techniques
including photolithography and thin film deposition. Briefly, SU-8 photoresist layers were spin-
coated on a silicon wafer. Each photoresist layer was baked on a hotplate, exposed to ultraviolet
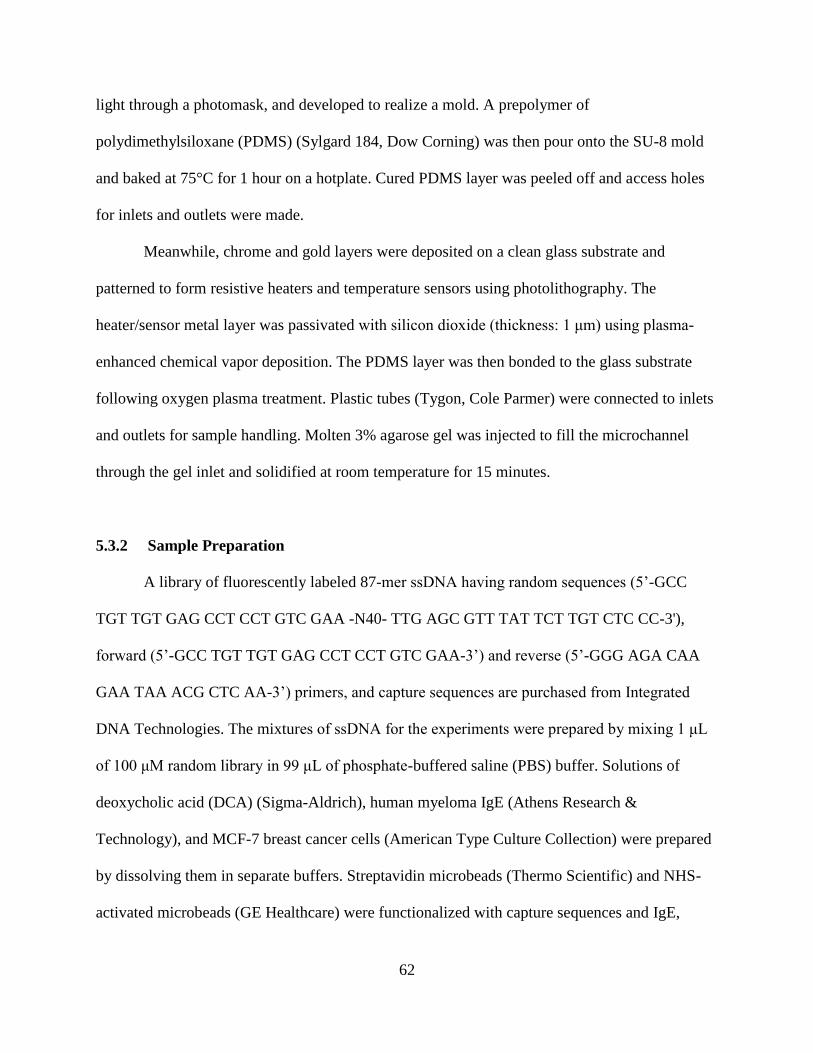
62
light through a photomask, and developed to realize a mold. A prepolymer of
polydimethylsiloxane (PDMS) (Sylgard 184, Dow Corning) was then pour onto the SU-8 mold
and baked at 75°C for 1 hour on a hotplate. Cured PDMS layer was peeled off and access holes
for inlets and outlets were made.
Meanwhile, chrome and gold layers were deposited on a clean glass substrate and
patterned to form resistive heaters and temperature sensors using photolithography. The
heater/sensor metal layer was passivated with silicon dioxide (thickness: 1 μm) using plasma-
enhanced chemical vapor deposition. The PDMS layer was then bonded to the glass substrate
following oxygen plasma treatment. Plastic tubes (Tygon, Cole Parmer) were connected to inlets
and outlets for sample handling. Molten 3% agarose gel was injected to fill the microchannel
through the gel inlet and solidified at room temperature for 15 minutes.
5.3.2 Sample Preparation
A library of fluorescently labeled 87-mer ssDNA having random sequences (5’-GCC
TGT TGT GAG CCT CCT GTC GAA -N40- TTG AGC GTT TAT TCT TGT CTC CC-3'),
forward (5’-GCC TGT TGT GAG CCT CCT GTC GAA-3’) and reverse (5’-GGG AGA CAA
GAA TAA ACG CTC AA-3’) primers, and capture sequences are purchased from Integrated
DNA Technologies. The mixtures of ssDNA for the experiments were prepared by mixing 1 μL
of 100 μM random library in 99 μL of phosphate-buffered saline (PBS) buffer. Solutions of
deoxycholic acid (DCA) (Sigma-Aldrich), human myeloma IgE (Athens Research &
Technology), and MCF-7 breast cancer cells (American Type Culture Collection) were prepared
by dissolving them in separate buffers. Streptavidin microbeads (Thermo Scientific) and NHS-
activated microbeads (GE Healthcare) were functionalized with capture sequences and IgE,

63
respectively, and stored in PBS buffer. Tris-boric acid (TB) buffer (89 mM Tris, 89 mM boric
acid, and 100 mM NaCl) was used as an electrolyte for DNA electrophoresis on-chip. A PCR
mixture was prepared following manufacture’s recommendation (Promega).
5.3.3. Experimental Procedure
Experiments of isolation and amplification of target-binding ssDNA in random DNA
mixtures is carried out as follows. Approximately 30% of the volume of the isolation chamber is
filled with DNA- or target-functionalized microbeads or cells through the inlet. The beads or
cells are then washed with PBS buffer (20 μL/min) for 5 minutes using a syringe pump. For
isolation of DCA-binding ssDNA, a random DNA mixture is introduced into the isolation
chamber and washed with PBS buffer (10 μL/min). Then, a solution containing DCA is
introduced into the isolation chamber (10 μL/min) and incubated with the beads for 10 minutes.
The strands bound to DCA are collected at the outlet of the chamber in separate tubes (~33 μL).
For isolation of ssDNA binding to IgE or MCF-7 cells, a random mixture of ssDNA is
introduced into the isolation chamber (10 μL/min) filled with IgE-functionalized beads or the
cells. Weakly bound strands to the target are washed with PBS buffer introduced to the chamber
(40 μL/min) while the waste solutions are collected in separate samples at the outlet (~33 μL).
Strongly bound DNA strands to targets are eluted by heating the chamber at 59°C for 5 minutes
while the eluents are collected from the outlet in separate tubes (~33 μL).
For device characterization of DNA amplification, fluorescently labeled ssDNA and
reversed-primer coated beads in TB buffer are filled in the isolation and amplification chambers,
respectively. Pt electrodes are inserted into the Pt inlets in each chamber and a 50 V of potential
difference is applied for 25 minutes. The DNA strands are then electrophoretically transported

64
through the gel-filled channel and hybridized onto the reversed primers coated beads in the
amplification chamber. PCR mixture is introduced into the amplification chamber using a
micropipette. PCR amplification of DNA on the bead surfaces is then induced by thermocycling
using the integrated resistive heater and temperature sensor on-chip.
To monitor the progress of experiment, the collected eluents containing ssDNA are
amplified using a conventional thermocycler and visualized with slab-gel electrophoresis. The
relative amounts of residual DNA in the eluents are evaluated by comparing the band intensities
for each sample in gel images using the ImageJ software (National Institutes of Health freeware).
A fluorescence microscope and spectrometer are used to measure the fluorescence intensities of
microbeads.
5.4 Results and Discussion
We first tested capture of microbeads and MCF-7 cells by the weir structures in the
isolation chambers. Using a syringe, microbeads in PBS buffer were slowly introduced to fill an
isolation chamber. Since the depth of the weir is 40 μm, most of the microbeads injected
(diameter: 45-165 μm) are trapped in the chamber while buffer could flow to exit through the
chamber outlet. Some beads escaped the weir structure without being trapped. This could be
because flexible PDMS could be deformed to allow the beads to pass though the weir. A
micrograph shows that the beads can be densely loaded in the chamber (Figure 5.4a).
Similarly, MCF-7 cells (mean diameter: 15 μm) in a buffer solution were injected into an
isolation chamber using a micropipette and trapped by the weir structure (depth: 10 μm) having
micropillars. The cells are captured by the structure while buffer solution could pass through the
spaces between the weir and glass substrate created by the micropillars (Figure 5.4b).
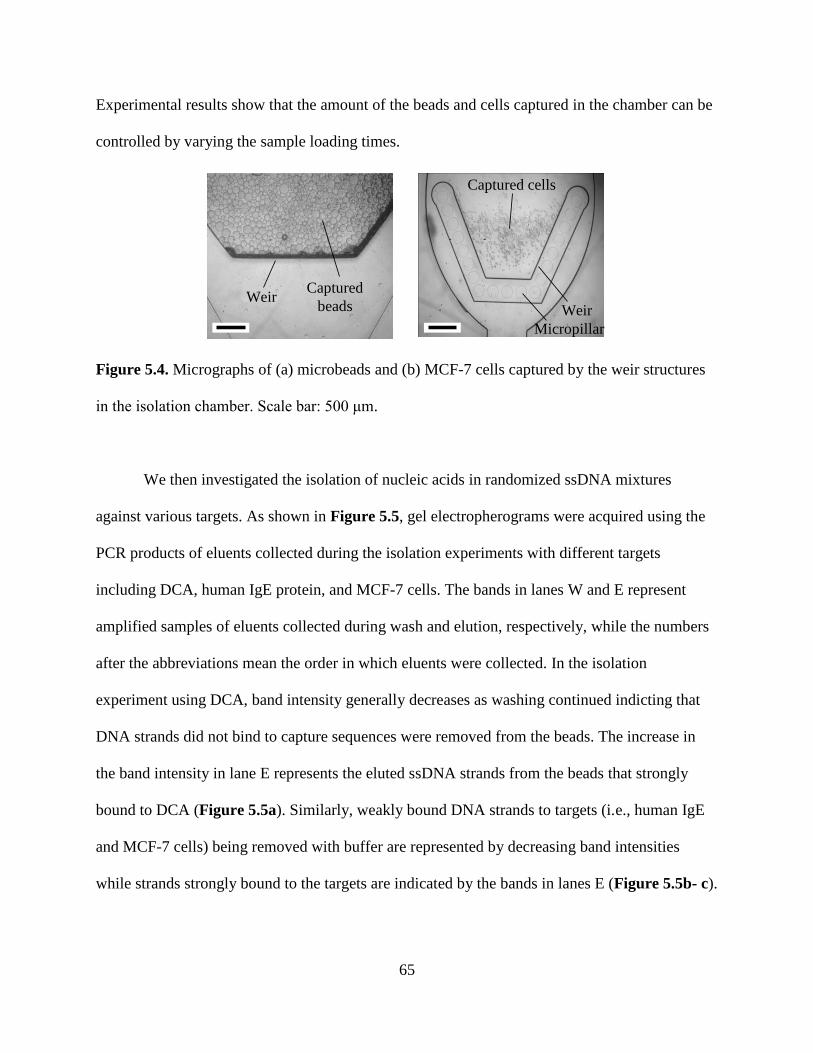
65
Experimental results show that the amount of the beads and cells captured in the chamber can be
controlled by varying the sample loading times.
Captured
beads
Captured cells
WeirWeir
Micropillar
Figure 5.4. Micrographs of (a) microbeads and (b) MCF-7 cells captured by the weir structures
in the isolation chamber. Scale bar: 500 μm.
We then investigated the isolation of nucleic acids in randomized ssDNA mixtures
against various targets. As shown in Figure 5.5, gel electropherograms were acquired using the
PCR products of eluents collected during the isolation experiments with different targets
including DCA, human IgE protein, and MCF-7 cells. The bands in lanes W and E represent
amplified samples of eluents collected during wash and elution, respectively, while the numbers
after the abbreviations mean the order in which eluents were collected. In the isolation
experiment using DCA, band intensity generally decreases as washing continued indicting that
DNA strands did not bind to capture sequences were removed from the beads. The increase in
the band intensity in lane E represents the eluted ssDNA strands from the beads that strongly
bound to DCA (Figure 5.5a). Similarly, weakly bound DNA strands to targets (i.e., human IgE
and MCF-7 cells) being removed with buffer are represented by decreasing band intensities
while strands strongly bound to the targets are indicated by the bands in lanes E (Figure 5.5b- c).
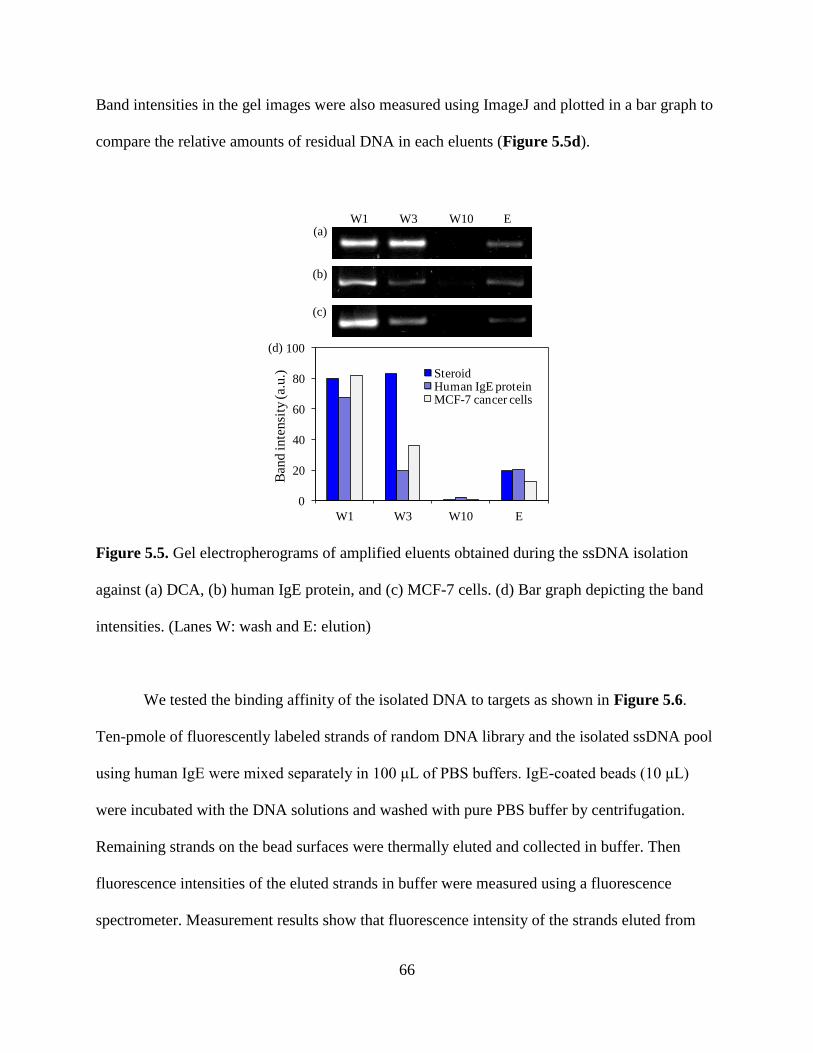
66
Band intensities in the gel images were also measured using ImageJ and plotted in a bar graph to
compare the relative amounts of residual DNA in each eluents (Figure 5.5d).
0
20
40
60
80
100
W1 W3 W10 E
Ban
d inte
nsi
ty (a.
u.) Steroid
Human IgE proteinMCF-7 cancer cells
W1 W3 W10 E(a)
(b)
(c)
(d)
Figure 5.5. Gel electropherograms of amplified eluents obtained during the ssDNA isolation
against (a) DCA, (b) human IgE protein, and (c) MCF-7 cells. (d) Bar graph depicting the band
intensities. (Lanes W: wash and E: elution)
We tested the binding affinity of the isolated DNA to targets as shown in Figure 5.6.
Ten-pmole of fluorescently labeled strands of random DNA library and the isolated ssDNA pool
using human IgE were mixed separately in 100 μL of PBS buffers. IgE-coated beads (10 μL)
were incubated with the DNA solutions and washed with pure PBS buffer by centrifugation.
Remaining strands on the bead surfaces were thermally eluted and collected in buffer. Then
fluorescence intensities of the eluted strands in buffer were measured using a fluorescence
spectrometer. Measurement results show that fluorescence intensity of the strands eluted from
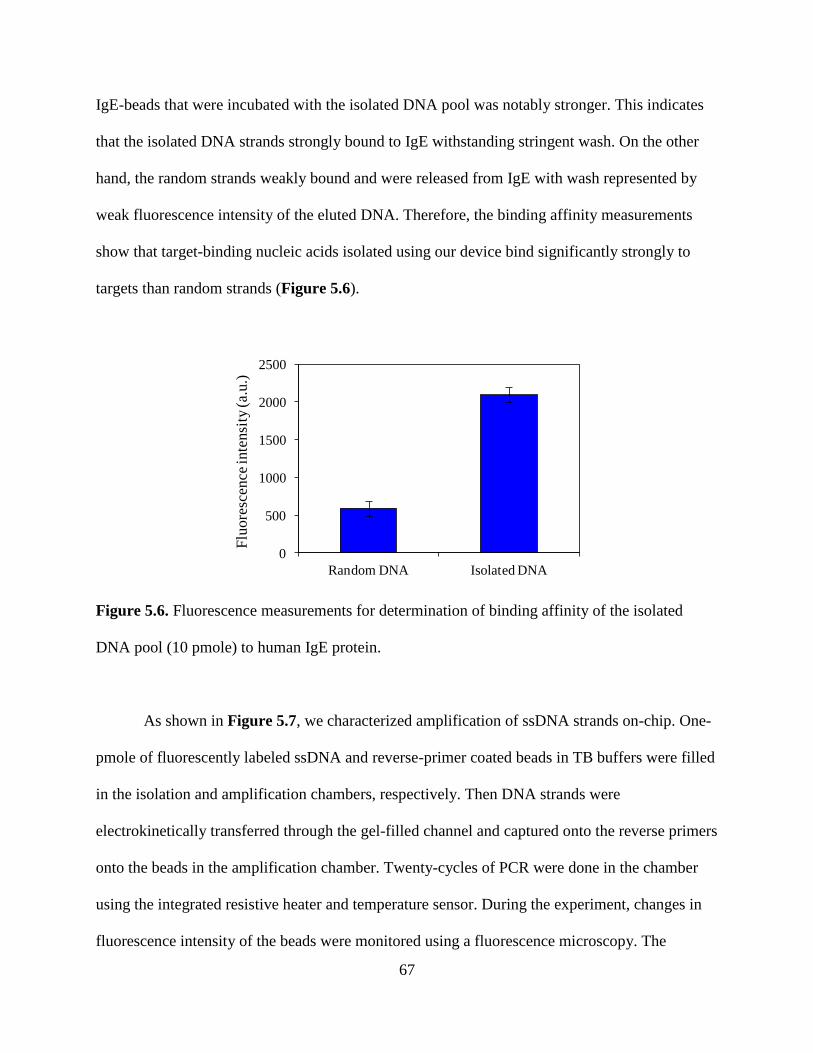
67
IgE-beads that were incubated with the isolated DNA pool was notably stronger. This indicates
that the isolated DNA strands strongly bound to IgE withstanding stringent wash. On the other
hand, the random strands weakly bound and were released from IgE with wash represented by
weak fluorescence intensity of the eluted DNA. Therefore, the binding affinity measurements
show that target-binding nucleic acids isolated using our device bind significantly strongly to
targets than random strands (Figure 5.6).
0
500
1000
1500
2000
2500
Random DNA Isolated DNA
Flu
ore
scen
ce in
tensi
ty (a.
u.)
Figure 5.6. Fluorescence measurements for determination of binding affinity of the isolated
DNA pool (10 pmole) to human IgE protein.
As shown in Figure 5.7, we characterized amplification of ssDNA strands on-chip. One-
pmole of fluorescently labeled ssDNA and reverse-primer coated beads in TB buffers were filled
in the isolation and amplification chambers, respectively. Then DNA strands were
electrokinetically transferred through the gel-filled channel and captured onto the reverse primers
onto the beads in the amplification chamber. Twenty-cycles of PCR were done in the chamber
using the integrated resistive heater and temperature sensor. During the experiment, changes in
fluorescence intensity of the beads were monitored using a fluorescence microscopy. The
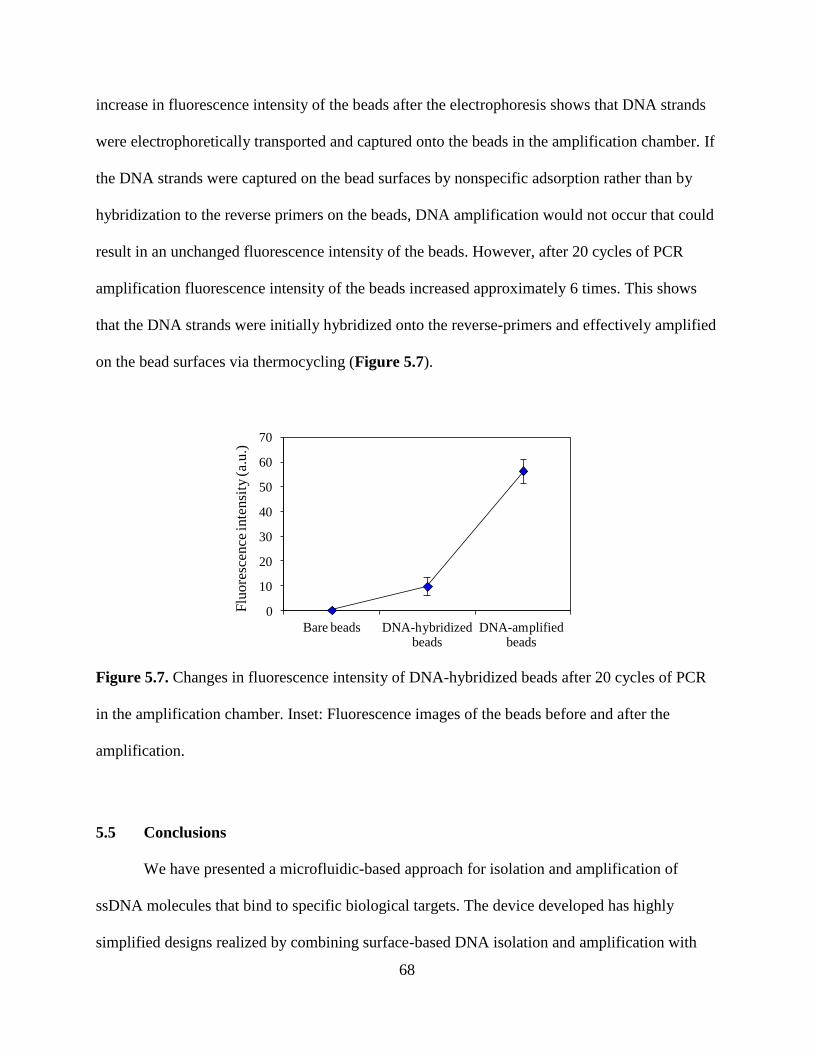
68
increase in fluorescence intensity of the beads after the electrophoresis shows that DNA strands
were electrophoretically transported and captured onto the beads in the amplification chamber. If
the DNA strands were captured on the bead surfaces by nonspecific adsorption rather than by
hybridization to the reverse primers on the beads, DNA amplification would not occur that could
result in an unchanged fluorescence intensity of the beads. However, after 20 cycles of PCR
amplification fluorescence intensity of the beads increased approximately 6 times. This shows
that the DNA strands were initially hybridized onto the reverse-primers and effectively amplified
on the bead surfaces via thermocycling (Figure 5.7).
0
10
20
30
40
50
60
70
Bare beads DNA-hybridized beads
DNA-amplified beads
Flu
ore
scen
ce in
ten
sity
(a.
u.)
Figure 5.7. Changes in fluorescence intensity of DNA-hybridized beads after 20 cycles of PCR
in the amplification chamber. Inset: Fluorescence images of the beads before and after the
amplification.
5.5 Conclusions
We have presented a microfluidic-based approach for isolation and amplification of
ssDNA molecules that bind to specific biological targets. The device developed has highly
simplified designs realized by combining surface-based DNA isolation and amplification with
69
gel-based electrophoretic transport. Due to the high level integration, complicated flow control
elements are not required in our device. On the other hand, cross-contamination between
different functional chambers is eliminated by a gel filled in the channel while allowing for an
effective electrophoretic transport of DNA strands.
Experimental results show that the devices are capable of performing a single round
SELEX against biological targets including small molecules, proteins, and cells. For small
molecule targets, a randomized DNA library will be captured on bead surfaces and target-
binding strands are released from the beads upon an introduction of the target molecules. For
protein and cell targets, strands that bind to the targets are captured onto the protein-
functionalized beads and cell surfaces, respectively. The target-binding strands are then
electrokinetically transferred and amplified on primer-coated microbeads.
70
Chapter 6. Microfluidic SELEX for Isolation of Protein-, Small Molecule-,
and Cell-Binding Aptamers
6.1 Introduction
In this chapter, we present microfluidic devices in which multiple rounds of SELEX can
be performed for isolation of oligonucleotides that bind to targets including human IgE protein,
glucose-boronic acid complex, and MCR-7 cancer cell targets. Similar to the preliminary devices
discussed in Chapter 5, target-binding strands are electrokinetically transferred and amplified on
bead surfaces in the devices presented in this chapter.
Recently, microfluidic technology has been applied to improve aptamer selection
efficiency, and minimize assay time and sample consumption. In one approach, hydrodynamic
flow was used to effectively wash weakly- and non-binding strands onto target-functionalized
magnetic beads that are captured by a magnetic field generated in a microfluidic device. Using
the device, generation of strong-binding aptamers was resulted within 3 rounds of SELEX [53,
54]. In addition, microfluidic chips with pneumatic flow control components and DNA
amplification components were used to isolate target-binding nucleic acids. However, additional
off-chip processes such as the strand separation of dsDNA into ssDNA are still needed for
isolation of target-binding strands using these devices. Furthermore, the devices typically require
complicated flow-handling components such as pneumatically driven pumps and valves to
manipulate sample and reagents.
We present microfluidic chips for aptamer generation with a greatly simplified chip
design, fabrication process, and operation. The simplicity of the chip is achieved by utilizing a
combination of bead-based selection and PCR amplification of target binding oligonucleotides,
and gel-based electrophoretic transport of the strands. In the device, aptamer candidates are
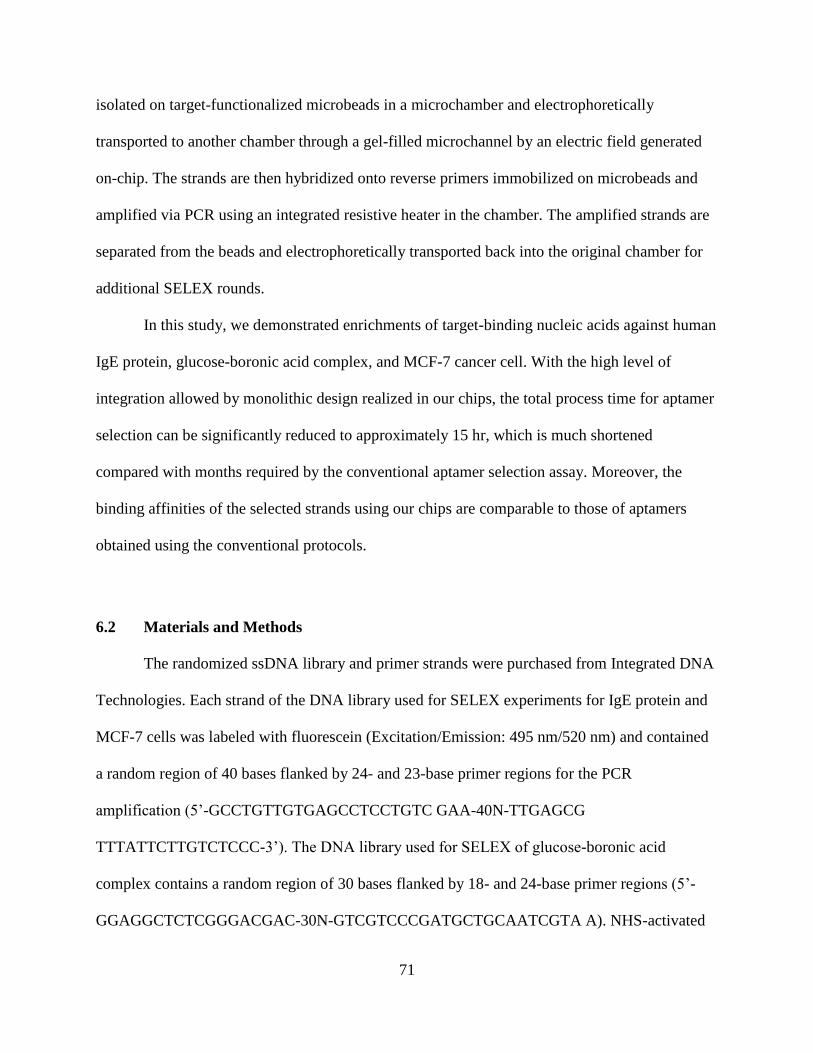
71
isolated on target-functionalized microbeads in a microchamber and electrophoretically
transported to another chamber through a gel-filled microchannel by an electric field generated
on-chip. The strands are then hybridized onto reverse primers immobilized on microbeads and
amplified via PCR using an integrated resistive heater in the chamber. The amplified strands are
separated from the beads and electrophoretically transported back into the original chamber for
additional SELEX rounds.
In this study, we demonstrated enrichments of target-binding nucleic acids against human
IgE protein, glucose-boronic acid complex, and MCF-7 cancer cell. With the high level of
integration allowed by monolithic design realized in our chips, the total process time for aptamer
selection can be significantly reduced to approximately 15 hr, which is much shortened
compared with months required by the conventional aptamer selection assay. Moreover, the
binding affinities of the selected strands using our chips are comparable to those of aptamers
obtained using the conventional protocols.
6.2 Materials and Methods
The randomized ssDNA library and primer strands were purchased from Integrated DNA
Technologies. Each strand of the DNA library used for SELEX experiments for IgE protein and
MCF-7 cells was labeled with fluorescein (Excitation/Emission: 495 nm/520 nm) and contained
a random region of 40 bases flanked by 24- and 23-base primer regions for the PCR
amplification (5’-GCCTGTTGTGAGCCTCCTGTC GAA-40N-TTGAGCG
TTTATTCTTGTCTCCC-3’). The DNA library used for SELEX of glucose-boronic acid
complex contains a random region of 30 bases flanked by 18- and 24-base primer regions (5’-
GGAGGCTCTCGGGACGAC-30N-GTCGTCCCGATGCTGCAATCGTA A). NHS-activated
72
microbeads (diameter: 45 - 165 μm, mean diameter: 90 μm) and human IgE protein were
purchased from GE Healthcare Life Sciences and Athens Research, respectively. Chemicals to
prepare buffers for protein-and small molecule-SELEX (44.5 mM Tris base, 44.5 mM boric acid,
50 mM NaCl, pH 8.5), and for cell-SELEX (14 mM HEPES, 14 mM NaOAc, 50 mM MgCl2, pH
7.5) were purchased from Sigma-Aldrich, Inc. Elution buffers included 0.2 M NaOH in the
SELEX buffer used for SELEX of each target. A microplate reader (Wallack Victor2,
PerkinElmer) and a fluorescence microscope (LSM 510, Zeiss) were used for fluorescence
measurements of solutions, microbeads, or cells. A power supply (E3631A, Agilent
Technologies) and a multimeter (34410A, Agilent Technologies) controlled by the LabVIEW
software (National Instruments Corp.) running on a computer manipulated the temperature in the
chip for PCR amplification on-chip. A conventional thermocycler (Eppendorf Mastercycler
Gradient, Eppendorf) was used to amplify DNA strands for the gel electropherogram and large
scale PCR.
To prepare IgE functionalized beads, NHS activated beads (200 μL) were washed 3
times in a column with SELEX buffer. The beads were then incubated with 5.7 μM IgE (35 μL)
at room temperature for 5 hr on a shaker and were washed 3 times with SELEX buffer. To block
the NHS binding sites not occupied by IgE, the beads were incubated with 0.1M Tris-HCl buffer
at room temperature for 1 hr followed by buffer wash. The IgE functionalized beads was stored
in SELEX buffer in a refrigerator (4°C).
A standard fluorescence binding assay was used to measure binding affinity of DNA
strands to IgE. Fluorescently labeled strands with various concentrations (0-100 nM) were
prepared in SELEX buffer (total volume: 100 µL). IgE-functionalized beads in tubes (3
104/tube) were washed with SELEX buffer and incubated with the DNA strands at room
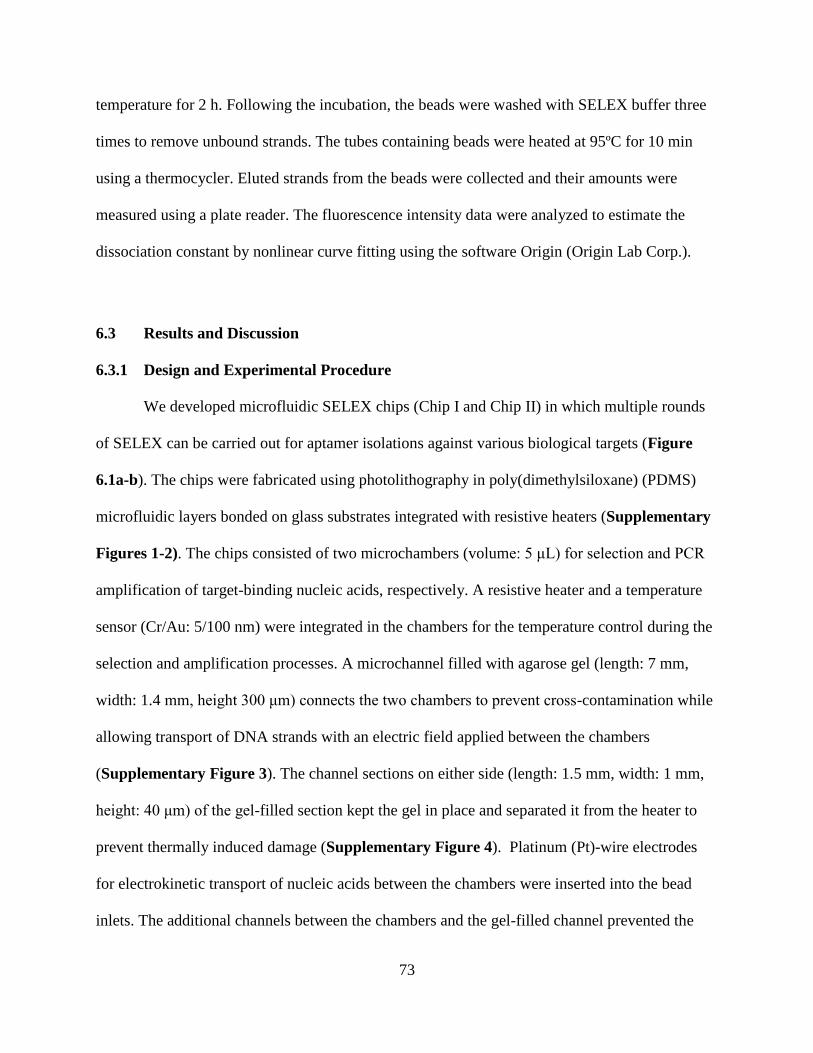
73
temperature for 2 h. Following the incubation, the beads were washed with SELEX buffer three
times to remove unbound strands. The tubes containing beads were heated at 95ºC for 10 min
using a thermocycler. Eluted strands from the beads were collected and their amounts were
measured using a plate reader. The fluorescence intensity data were analyzed to estimate the
dissociation constant by nonlinear curve fitting using the software Origin (Origin Lab Corp.).
6.3 Results and Discussion
6.3.1 Design and Experimental Procedure
We developed microfluidic SELEX chips (Chip I and Chip II) in which multiple rounds
of SELEX can be carried out for aptamer isolations against various biological targets (Figure
6.1a-b). The chips were fabricated using photolithography in poly(dimethylsiloxane) (PDMS)
microfluidic layers bonded on glass substrates integrated with resistive heaters (Supplementary
Figures 1-2). The chips consisted of two microchambers (volume: 5 μL) for selection and PCR
amplification of target-binding nucleic acids, respectively. A resistive heater and a temperature
sensor (Cr/Au: 5/100 nm) were integrated in the chambers for the temperature control during the
selection and amplification processes. A microchannel filled with agarose gel (length: 7 mm,
width: 1.4 mm, height 300 μm) connects the two chambers to prevent cross-contamination while
allowing transport of DNA strands with an electric field applied between the chambers
(Supplementary Figure 3). The channel sections on either side (length: 1.5 mm, width: 1 mm,
height: 40 μm) of the gel-filled section kept the gel in place and separated it from the heater to
prevent thermally induced damage (Supplementary Figure 4). Platinum (Pt)-wire electrodes
for electrokinetic transport of nucleic acids between the chambers were inserted into the bead
inlets. The additional channels between the chambers and the gel-filled channel prevented the
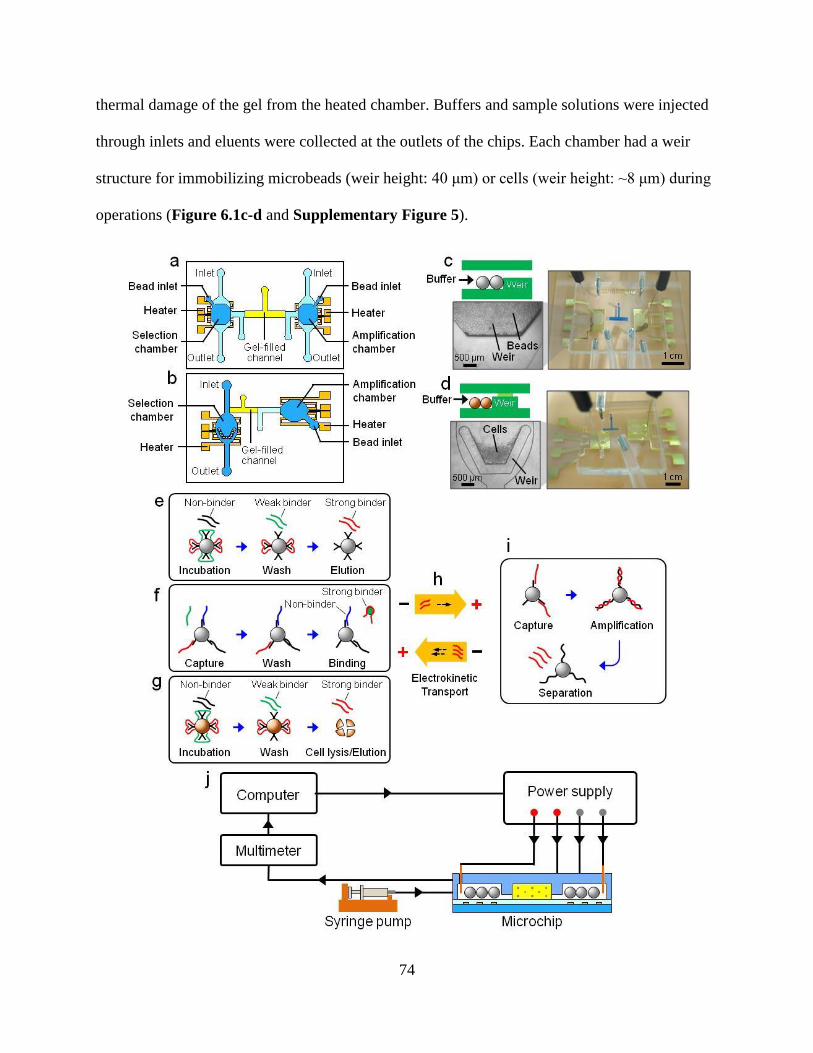
74
thermal damage of the gel from the heated chamber. Buffers and sample solutions were injected
through inlets and eluents were collected at the outlets of the chips. Each chamber had a weir
structure for immobilizing microbeads (weir height: 40 μm) or cells (weir height: ~8 μm) during
operations (Figure 6.1c-d and Supplementary Figure 5).
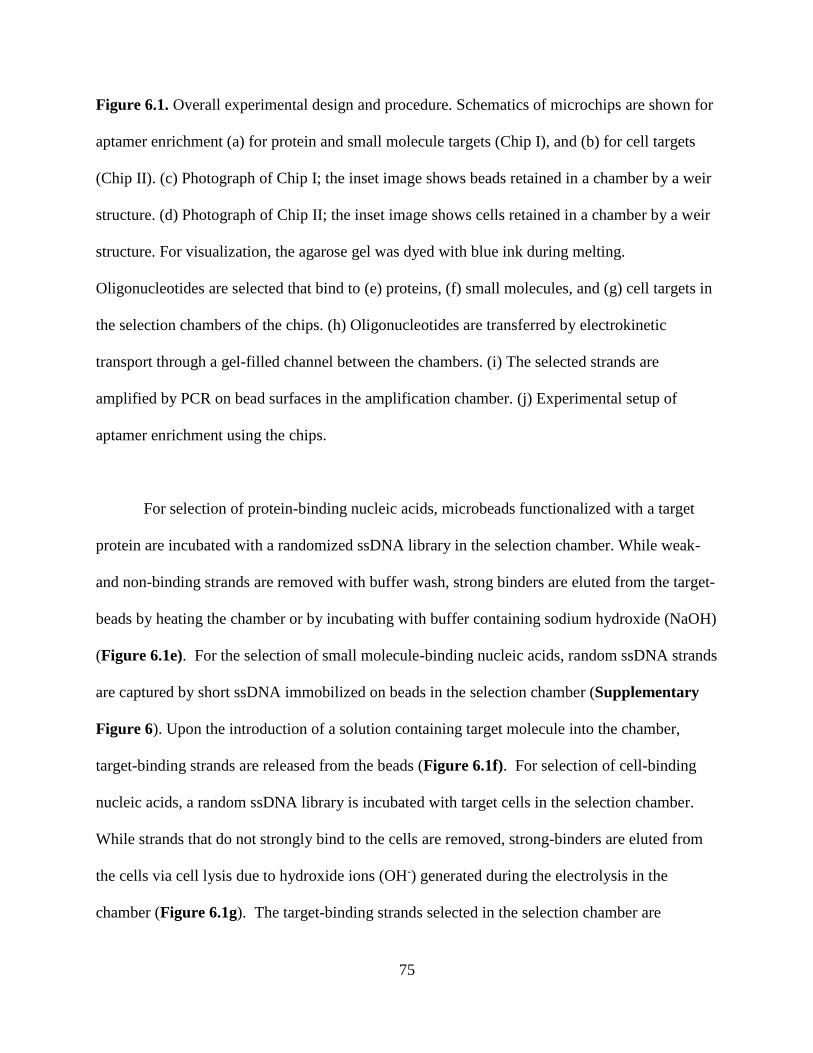
75
Figure 6.1. Overall experimental design and procedure. Schematics of microchips are shown for
aptamer enrichment (a) for protein and small molecule targets (Chip I), and (b) for cell targets
(Chip II). (c) Photograph of Chip I; the inset image shows beads retained in a chamber by a weir
structure. (d) Photograph of Chip II; the inset image shows cells retained in a chamber by a weir
structure. For visualization, the agarose gel was dyed with blue ink during melting.
Oligonucleotides are selected that bind to (e) proteins, (f) small molecules, and (g) cell targets in
the selection chambers of the chips. (h) Oligonucleotides are transferred by electrokinetic
transport through a gel-filled channel between the chambers. (i) The selected strands are
amplified by PCR on bead surfaces in the amplification chamber. (j) Experimental setup of
aptamer enrichment using the chips.
For selection of protein-binding nucleic acids, microbeads functionalized with a target
protein are incubated with a randomized ssDNA library in the selection chamber. While weak-
and non-binding strands are removed with buffer wash, strong binders are eluted from the target-
beads by heating the chamber or by incubating with buffer containing sodium hydroxide (NaOH)
(Figure 6.1e). For the selection of small molecule-binding nucleic acids, random ssDNA strands
are captured by short ssDNA immobilized on beads in the selection chamber (Supplementary
Figure 6). Upon the introduction of a solution containing target molecule into the chamber,
target-binding strands are released from the beads (Figure 6.1f). For selection of cell-binding
nucleic acids, a random ssDNA library is incubated with target cells in the selection chamber.
While strands that do not strongly bind to the cells are removed, strong-binders are eluted from
the cells via cell lysis due to hydroxide ions (OH-) generated during the electrolysis in the
chamber (Figure 6.1g). The target-binding strands selected in the selection chamber are
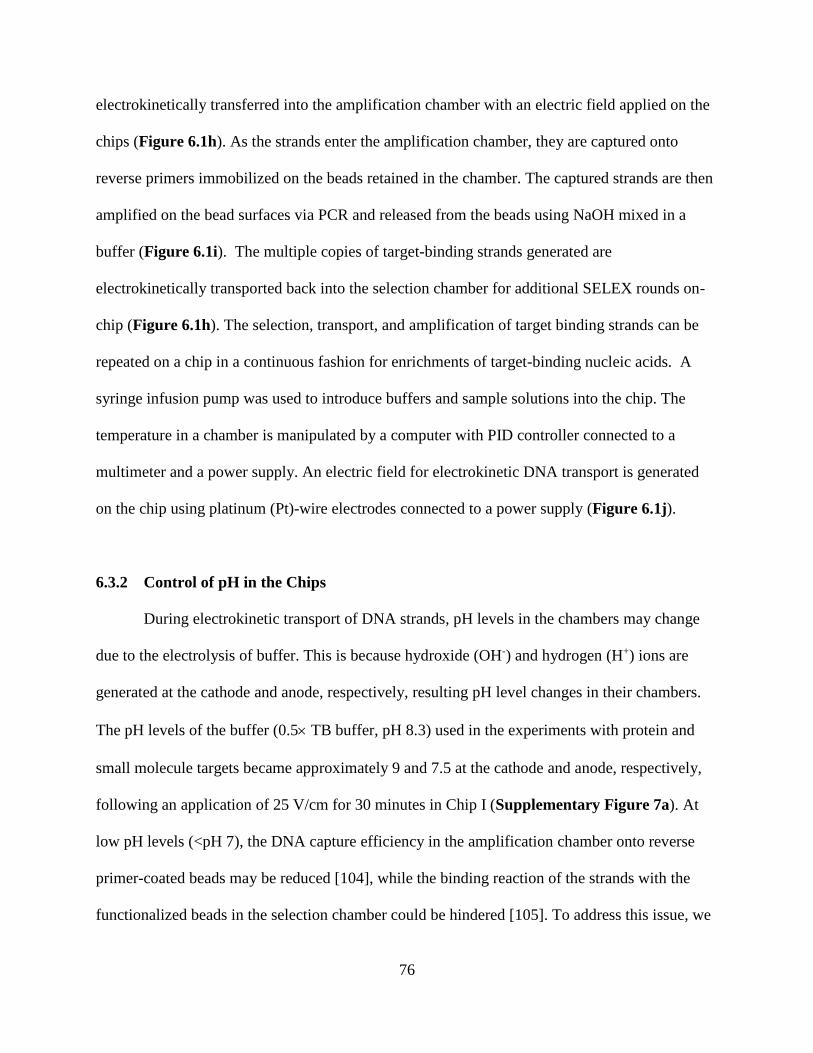
76
electrokinetically transferred into the amplification chamber with an electric field applied on the
chips (Figure 6.1h). As the strands enter the amplification chamber, they are captured onto
reverse primers immobilized on the beads retained in the chamber. The captured strands are then
amplified on the bead surfaces via PCR and released from the beads using NaOH mixed in a
buffer (Figure 6.1i). The multiple copies of target-binding strands generated are
electrokinetically transported back into the selection chamber for additional SELEX rounds on-
chip (Figure 6.1h). The selection, transport, and amplification of target binding strands can be
repeated on a chip in a continuous fashion for enrichments of target-binding nucleic acids. A
syringe infusion pump was used to introduce buffers and sample solutions into the chip. The
temperature in a chamber is manipulated by a computer with PID controller connected to a
multimeter and a power supply. An electric field for electrokinetic DNA transport is generated
on the chip using platinum (Pt)-wire electrodes connected to a power supply (Figure 6.1j).
6.3.2 Control of pH in the Chips
During electrokinetic transport of DNA strands, pH levels in the chambers may change
due to the electrolysis of buffer. This is because hydroxide (OH-) and hydrogen (H+) ions are
generated at the cathode and anode, respectively, resulting pH level changes in their chambers.
The pH levels of the buffer (0.5 TB buffer, pH 8.3) used in the experiments with protein and
small molecule targets became approximately 9 and 7.5 at the cathode and anode, respectively,
following an application of 25 V/cm for 30 minutes in Chip I (Supplementary Figure 7a). At
low pH levels (<pH 7), the DNA capture efficiency in the amplification chamber onto reverse
primer-coated beads may be reduced [104], while the binding reaction of the strands with the
functionalized beads in the selection chamber could be hindered [105]. To address this issue, we
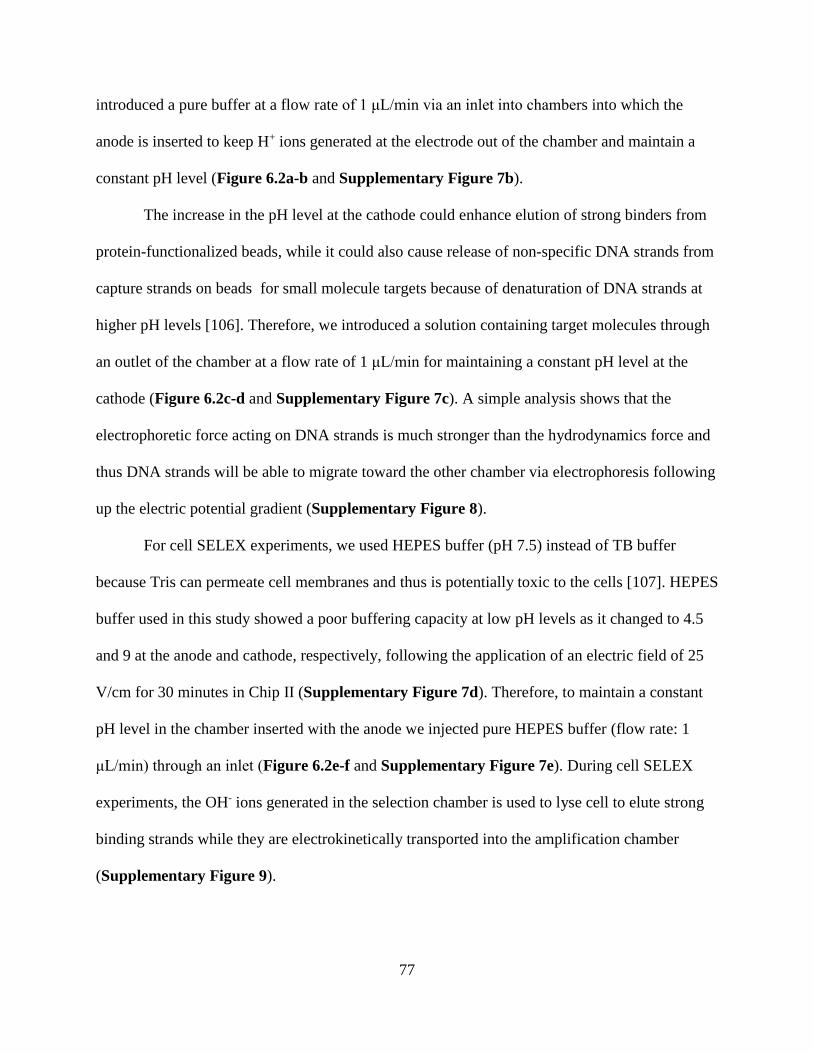
77
introduced a pure buffer at a flow rate of 1 μL/min via an inlet into chambers into which the
anode is inserted to keep H+ ions generated at the electrode out of the chamber and maintain a
constant pH level (Figure 6.2a-b and Supplementary Figure 7b).
The increase in the pH level at the cathode could enhance elution of strong binders from
protein-functionalized beads, while it could also cause release of non-specific DNA strands from
capture strands on beads for small molecule targets because of denaturation of DNA strands at
higher pH levels [106]. Therefore, we introduced a solution containing target molecules through
an outlet of the chamber at a flow rate of 1 μL/min for maintaining a constant pH level at the
cathode (Figure 6.2c-d and Supplementary Figure 7c). A simple analysis shows that the
electrophoretic force acting on DNA strands is much stronger than the hydrodynamics force and
thus DNA strands will be able to migrate toward the other chamber via electrophoresis following
up the electric potential gradient (Supplementary Figure 8).
For cell SELEX experiments, we used HEPES buffer (pH 7.5) instead of TB buffer
because Tris can permeate cell membranes and thus is potentially toxic to the cells [107]. HEPES
buffer used in this study showed a poor buffering capacity at low pH levels as it changed to 4.5
and 9 at the anode and cathode, respectively, following the application of an electric field of 25
V/cm for 30 minutes in Chip II (Supplementary Figure 7d). Therefore, to maintain a constant
pH level in the chamber inserted with the anode we injected pure HEPES buffer (flow rate: 1
μL/min) through an inlet (Figure 6.2e-f and Supplementary Figure 7e). During cell SELEX
experiments, the OH- ions generated in the selection chamber is used to lyse cell to elute strong
binding strands while they are electrokinetically transported into the amplification chamber
(Supplementary Figure 9).
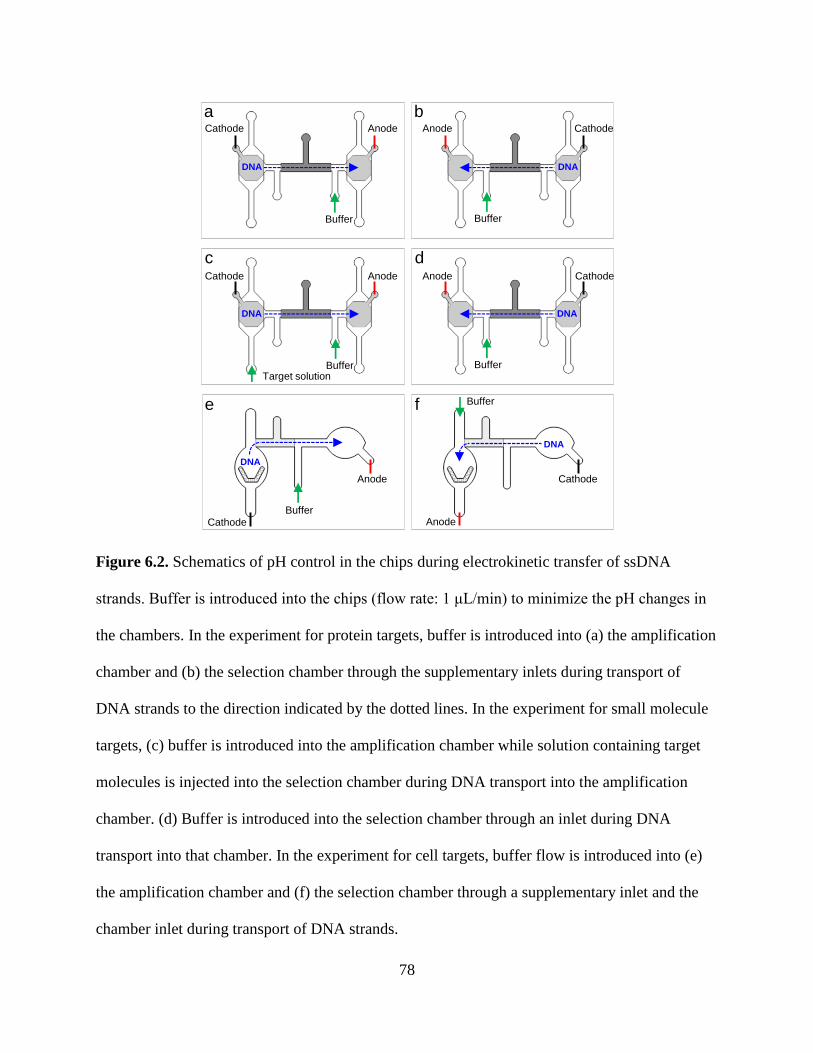
78
DNA
Cathode Anode
Buffer
DNA
Anode Cathode
Buffer
a b
DNA
Cathode Anode
Buffer
Anode Cathode
Buffer
c d
Target solution
DNA
BufferCathode
Anode
e f
Cathode
Anode
DNA
Buffer
DNA
Figure 6.2. Schematics of pH control in the chips during electrokinetic transfer of ssDNA
strands. Buffer is introduced into the chips (flow rate: 1 μL/min) to minimize the pH changes in
the chambers. In the experiment for protein targets, buffer is introduced into (a) the amplification
chamber and (b) the selection chamber through the supplementary inlets during transport of
DNA strands to the direction indicated by the dotted lines. In the experiment for small molecule
targets, (c) buffer is introduced into the amplification chamber while solution containing target
molecules is injected into the selection chamber during DNA transport into the amplification
chamber. (d) Buffer is introduced into the selection chamber through an inlet during DNA
transport into that chamber. In the experiment for cell targets, buffer flow is introduced into (e)
the amplification chamber and (f) the selection chamber through a supplementary inlet and the
chamber inlet during transport of DNA strands.
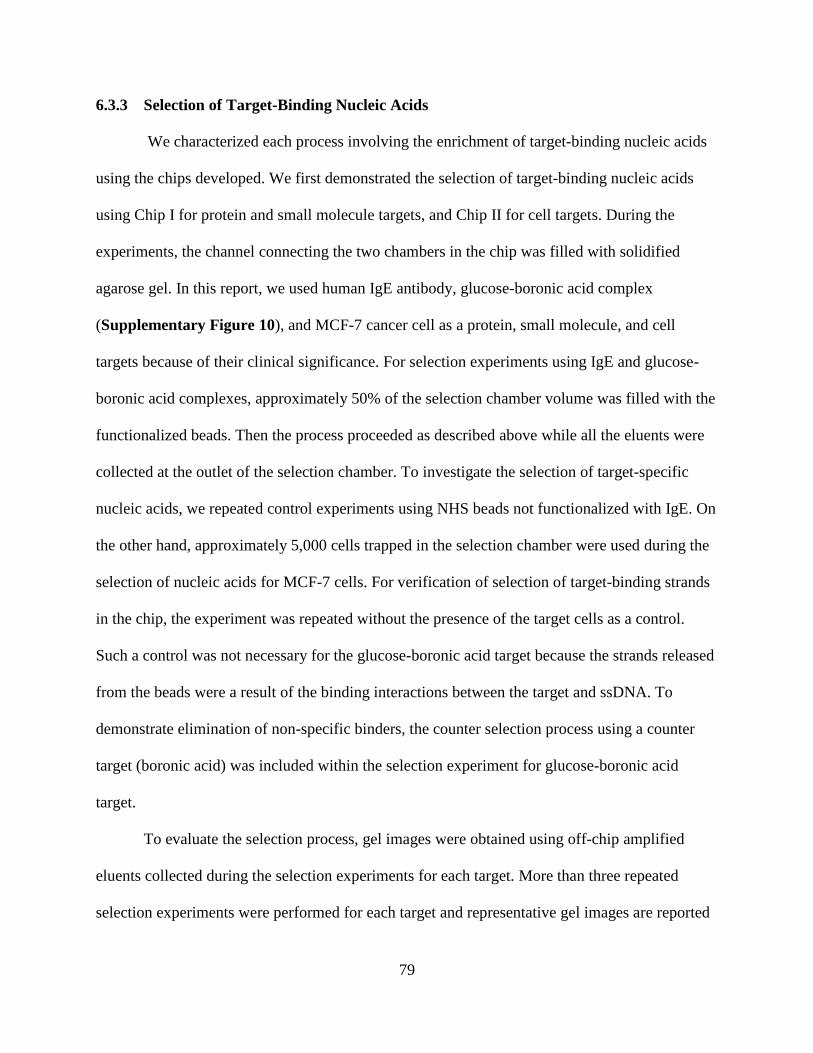
79
6.3.3 Selection of Target-Binding Nucleic Acids
We characterized each process involving the enrichment of target-binding nucleic acids
using the chips developed. We first demonstrated the selection of target-binding nucleic acids
using Chip I for protein and small molecule targets, and Chip II for cell targets. During the
experiments, the channel connecting the two chambers in the chip was filled with solidified
agarose gel. In this report, we used human IgE antibody, glucose-boronic acid complex
(Supplementary Figure 10), and MCF-7 cancer cell as a protein, small molecule, and cell
targets because of their clinical significance. For selection experiments using IgE and glucose-
boronic acid complexes, approximately 50% of the selection chamber volume was filled with the
functionalized beads. Then the process proceeded as described above while all the eluents were
collected at the outlet of the selection chamber. To investigate the selection of target-specific
nucleic acids, we repeated control experiments using NHS beads not functionalized with IgE. On
the other hand, approximately 5,000 cells trapped in the selection chamber were used during the
selection of nucleic acids for MCF-7 cells. For verification of selection of target-binding strands
in the chip, the experiment was repeated without the presence of the target cells as a control.
Such a control was not necessary for the glucose-boronic acid target because the strands released
from the beads were a result of the binding interactions between the target and ssDNA. To
demonstrate elimination of non-specific binders, the counter selection process using a counter
target (boronic acid) was included within the selection experiment for glucose-boronic acid
target.
To evaluate the selection process, gel images were obtained using off-chip amplified
eluents collected during the selection experiments for each target. More than three repeated
selection experiments were performed for each target and representative gel images are reported

80
here. Since the brightness of bands in a gel image represents the amount of ssDNA strands in the
eluent loaded in the lane, the progress of the selection process could be investigated by
comparing the band intensities. In the gel image, bands in lanes W, E , and C represent amplified
samples of eluent collected during washing, elution, and counter selection, respectively, while
the numbers after the abbreviations of each process represent the order in which eluent samples
were collected. For example, “1” in “W1” means the 1st eluent sample collected during the
washing step.
The gel image for selection of IgE-binding nucleic acids shows that the band intensity
decreased from lanes W1 to W10 indicating that ssDNA strands having low affinities to IgE were
removed from the beads as the buffer wash continued. The increased band intensity in Elution
lane suggests that ssDNA that strongly bind to IgE were released from the beads when the
chamber was exposed to the elution buffer (See material section). In the gel image for the control,
the band intensity also gradually decreased from lanes W1 to W10. However, the absence of
visible band shown in the lane E suggests that DNA strands were almost completely removed
from the beads during buffer wash and more importantly the strands collected using IgE-
functionalized beads were selected due to the binding interaction with IgE and not by non-
specific adsorption to the chamber or bead surfaces (Figure 6.3a-b). The gel image for selection
of strands that bind to glucose-boronic acid complexes shows that strands that were not captured
onto the beads functionalized with capture strands were washed with buffer as indicated by the
decreasing band intensity from lanes W1 to W12. The strands that bind to boronic acids (counter
target) were removed from the beads as the band shown in lane C suggests. A strong band in lane
E indicates that strands that specifically bind to glucose-boronic acid complexes were eluted
from the capture strands on beads (Figure 6.3c-d). Similar to the results obtained for the
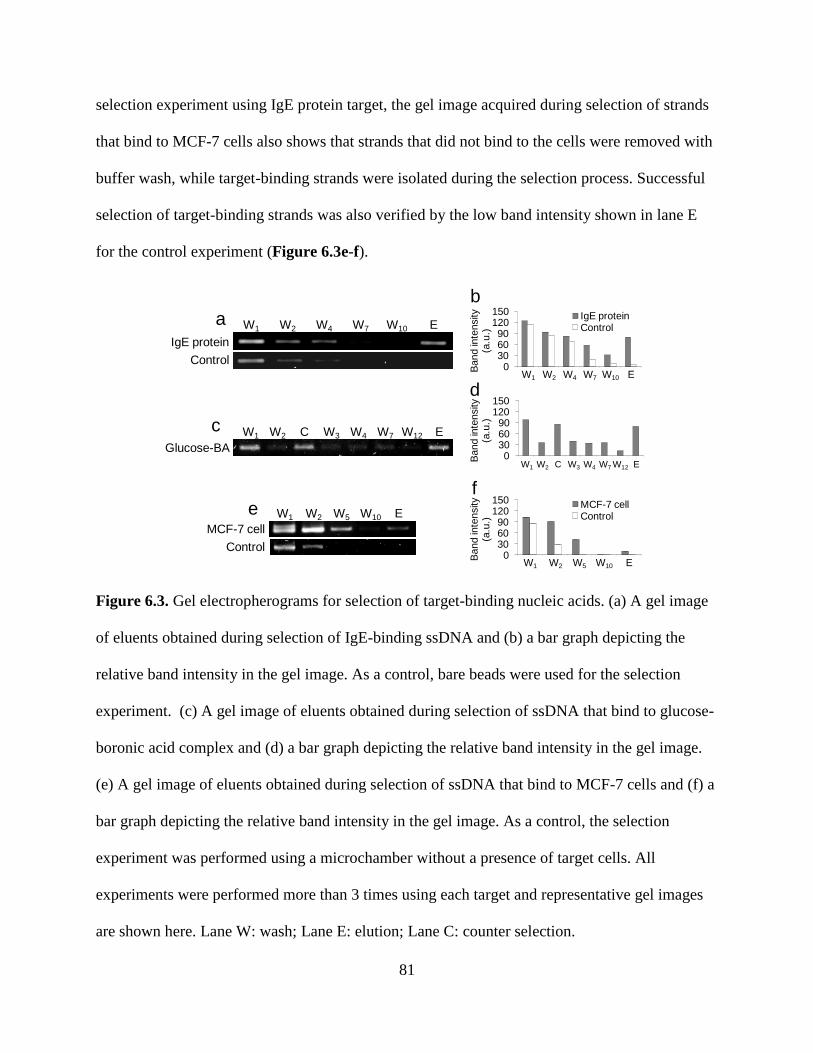
81
selection experiment using IgE protein target, the gel image acquired during selection of strands
that bind to MCF-7 cells also shows that strands that did not bind to the cells were removed with
buffer wash, while target-binding strands were isolated during the selection process. Successful
selection of target-binding strands was also verified by the low band intensity shown in lane E
for the control experiment (Figure 6.3e-f).
0306090
120150
1 2 3 4 5 6 7 8Band in
tensity
(a.u
.)
0306090
120150
1 2 3 4 5 6Band in
tensity
(a.u
.)
IgE proteinControl
0306090
120150
1 2 3 4 5Band in
tensity
(a.u
.)
MCF-7 cellControl
W1a
c
MCF-7 cell
e
IgE protein
Control
Control
b
f
d
Glucose-BA
W2 W4 W7 W10 E
W1 W2 W3 W4 W12 EC W7
W1 W2 W5 W10 E
W1 W2 W4 W7 W10 E
W1 W2 C W3 W4 W7 EW12
W1 W2 W5 W10 E
Figure 6.3. Gel electropherograms for selection of target-binding nucleic acids. (a) A gel image
of eluents obtained during selection of IgE-binding ssDNA and (b) a bar graph depicting the
relative band intensity in the gel image. As a control, bare beads were used for the selection
experiment. (c) A gel image of eluents obtained during selection of ssDNA that bind to glucose-
boronic acid complex and (d) a bar graph depicting the relative band intensity in the gel image.
(e) A gel image of eluents obtained during selection of ssDNA that bind to MCF-7 cells and (f) a
bar graph depicting the relative band intensity in the gel image. As a control, the selection
experiment was performed using a microchamber without a presence of target cells. All
experiments were performed more than 3 times using each target and representative gel images
are shown here. Lane W: wash; Lane E: elution; Lane C: counter selection.
82
6.3.4 Transfer and Capture of Nucleic Acids in the Chips
We then investigated electrokinetic transfer of ssDNA strands selected in the selection
chamber to the amplification chamber. We also simultaneously examined the capture of the
transported strands onto reverse primers immobilized on microbeads placed in the amplification
chamber. We first used Chip I and IgE functionalized beads to investigate the electrokinetic
transfer and capture of target-binding strands. In Chip I, fluorescently labeled ssDNA strands
that bind to IgE-beads were separated from the beads using elution buffer in the selection
chamber. An electric field of 25 V/cm was then generated between two chambers via Pt-wire
electrodes to electrokinetically transport and capture the strands in the amplification chamber
which was filled with primer-coated beads.
To monitor the DNA transfer, fluorescence images were taken at the center of the gel-
filled channel with a 1-minute time interval as the fluorescently labeled strands migrated from
the selection to amplification chambers through the gel-filled channel. The fluorescence
intensities of each image were measured and plotted over the duration of DNA transport. The
graph plotted shows that majority of the ssDNA strands reached to the monitoring site, which is
the midpoint between two chambers, within approximately 10 minutes as the maximum
fluorescence signal was observed at the time. Therefore, to maximize transport of ssDNA strands
between two chambers, we chose to generate approximately 25 V/cm of electric field on-chip for
DNA transport for 30 minutes. No significant damage was observed in a gel following an
exposure to the electric field (Supplementary Figure 11). We found that the amount of DNA
strands electrokinetically transported into the amplification chamber did not increase beyond 30
minutes of an electric field application (Figure 6.4a). We also investigated electrokinetic transfer
of strands that bind to MCF-7 cells using Chip II in which fluorescently labeled ssDNA strands

83
bound to cells in a chamber were eluted and electrokinetically transferred into another chamber.
Following different durations of the electric field application, fluorescence intensities of the
buffer were measured in the chamber to which DNA strands were transferred. We observed that
approximately 25 minutes would be sufficient to electrokinetically transfer ssDNA that bind to
MCF-7 cells between two chambers in Chip II (Figure 6.4b).
Following the transfer DNA strands eluted from IgE-functionalized beads, the reverse
primer-immobilized beads filled in the amplification chamber were washed with buffer and their
fluorescence intensities were measured using a fluorescence microscope. The average
fluorescence intensity of the beads following an electrokinetic transfer (positive) was
significantly higher than the intensity of bare beads (control) indicating that the ssDNA strands
were captured onto the reverse primers functionalized on the beads by hybridization following
their migration into the amplification chamber (Figure 6.4c). In separate experiments using Chip
I, we also demonstrated the capture of electrokinetically transported ssDNA strands selected
against glucose-boronic acid complexes in the selection chamber onto reverse primer-coated
microbeads in the amplification chamber. To verify the capture of the strands, the beads were
washed with buffer and captured strands were separated from the beads using elution buffer. The
strong band shown in lane S suggests that strands were captured by reverse primers on beads
during the electrokinetic transfer (Figure 6.4d). In addition, electrokinetic transfer and capture of
MCF-7 cell binding strands to the primer-coated microbeads in the amplification chamber of
Chip II was also verified by the increase in the fluorescence intensity of the beads (Figure 6.4e).
84
6.3.5 Amplification of Nucleic Acids on Bead Surfaces
We then investigated the amplification of the captured strands on the beads in the
amplification chamber via PCR. Following the capture of electrokinetically transported strands,
the beads in the chamber were washed with buffer. Then the chamber was filled with buffer
containing PCR reagents (See method section) and thermocycling was induced using the
resistive heater and temperature sensor integrated in the chamber. Fluorescently labeled forward
primers were used for PCR so that fluorescence signals of the beads, which correspond to the
generation of double-stranded DNA (dsDNA), could be measured using a fluorescence
microscope (Supplementary Figure 12).
The fluorescence intensity curve showed that during the initial 10 PCR cycles the
captured DNA strands were amplified exponentially on the bead surfaces doubling the strands
each cycle. As the number of PCR cycles increased to from 10 to 20, reaction components such
as reverse primers on the beads were being consumed and amplification slowed down. Thus, the
fluorescence intensity increased more linearly. Beyond 25 PCR cycles, the fluorescence intensity
did not further increase as most reverse primers on the bead surfaces were consumed and no
more PCR products were being generated (Figure 6.4f). In separate experiments, we also
confirmed that the amplification chamber in a single chip could be used multiple times without
generation of significant amount of strands that might remain in the chamber from previous
amplification process (Supplementary Figure 13).
6.3.6 Transfer of Amplified Nucleic Acids back in the Selection Chamber
We further investigated the electrokinetic transfer of amplified strands back to the
selection chamber in both Chip I and Chip II. The strands amplified on beads in the amplification
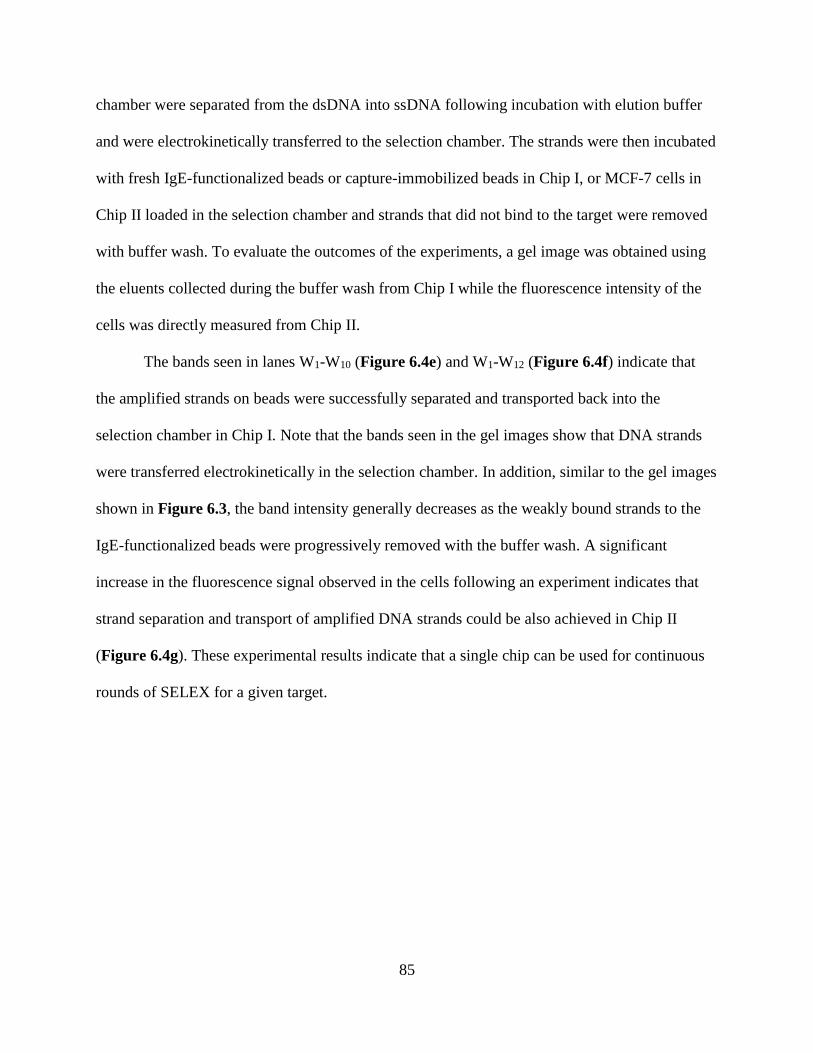
85
chamber were separated from the dsDNA into ssDNA following incubation with elution buffer
and were electrokinetically transferred to the selection chamber. The strands were then incubated
with fresh IgE-functionalized beads or capture-immobilized beads in Chip I, or MCF-7 cells in
Chip II loaded in the selection chamber and strands that did not bind to the target were removed
with buffer wash. To evaluate the outcomes of the experiments, a gel image was obtained using
the eluents collected during the buffer wash from Chip I while the fluorescence intensity of the
cells was directly measured from Chip II.
The bands seen in lanes W1-W10 (Figure 6.4e) and W1-W12 (Figure 6.4f) indicate that
the amplified strands on beads were successfully separated and transported back into the
selection chamber in Chip I. Note that the bands seen in the gel images show that DNA strands
were transferred electrokinetically in the selection chamber. In addition, similar to the gel images
shown in Figure 6.3, the band intensity generally decreases as the weakly bound strands to the
IgE-functionalized beads were progressively removed with the buffer wash. A significant
increase in the fluorescence signal observed in the cells following an experiment indicates that
strand separation and transport of amplified DNA strands could be also achieved in Chip II
(Figure 6.4g). These experimental results indicate that a single chip can be used for continuous
rounds of SELEX for a given target.
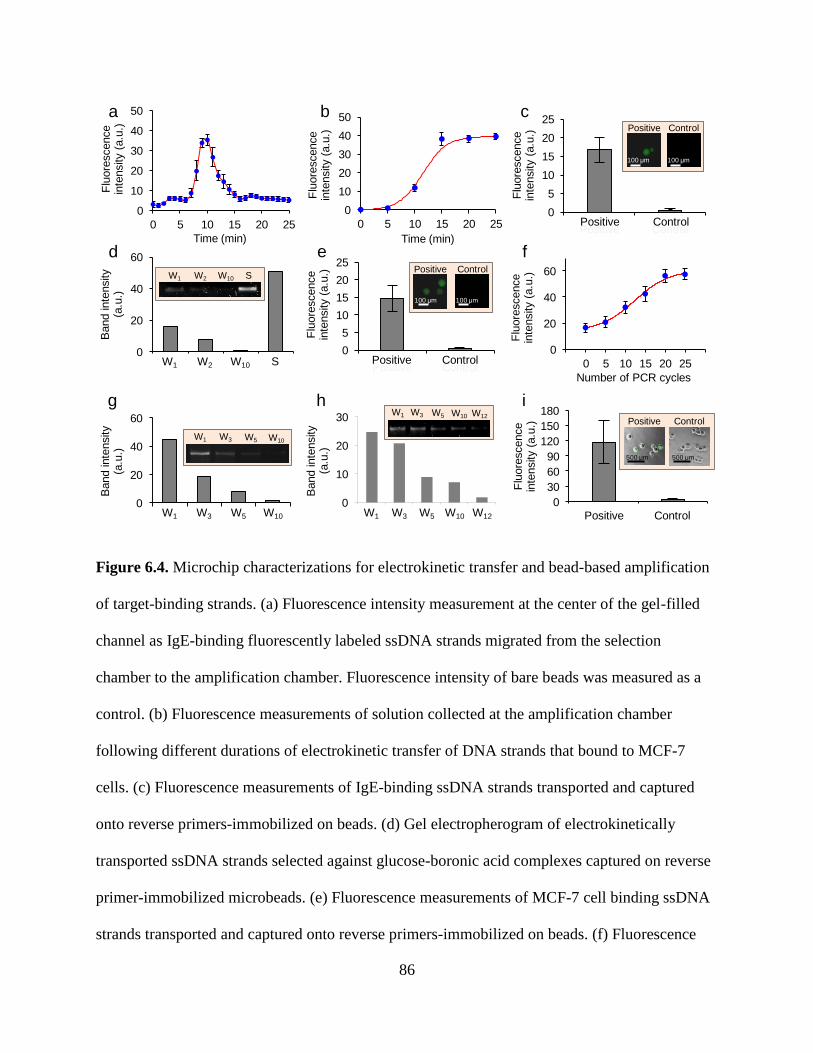
86
0
10
20
30
Wash 1 Wash 3 Wash 5 Wash 10
Wash 12
Band inte
nsity
(a.u
.)
0
20
40
60
Wash 1Wash 3Wash 5Wash 10
Band inte
nsity
(a.u
.)
0
20
40
60
Wash 1 Wash 2 Wash 10 Separation
Band inte
nsity
(a.u
.)
0
5
10
15
20
25
Positive Control
Flu
ore
scence
inte
nsity (
a.u
.)
0
30
60
90
120
150
180
DNA-bound cellsF
luore
scence
inte
nsity (
a.u
.)
0
5
10
15
20
25
Positive Control
Flu
ore
scence
inte
nsity (
a.u
.)
0
20
40
60
-5 0 5 10 15 20 25 30
Flu
ore
scence
inte
nsity (
a.u
.)
Number of PCR cycles
a b c
d e f
Positive Control
0
10
20
30
40
50
0 5 10 15 20 25
Flu
ore
scence
inte
nsity (
a.u
.)
Time (min)
0
10
20
30
40
50
0 5 10 15 20 25
Flu
ore
scence
inte
nsity (
a.u
.)
Time (min)
g h i
W1 W3 W5 W10 W12
W1 W3 W5 W10 W12
W1 W3 W5 W10
W1 W3 W5 W10
W1 W2 W10 S
W1 W2 W10 SPositive Control
Positive Control
Positive Control
Positive Control
Positive Control
100 μm 100 μm
100 μm 100 μm
500 μm 500 μm
Figure 6.4. Microchip characterizations for electrokinetic transfer and bead-based amplification
of target-binding strands. (a) Fluorescence intensity measurement at the center of the gel-filled
channel as IgE-binding fluorescently labeled ssDNA strands migrated from the selection
chamber to the amplification chamber. Fluorescence intensity of bare beads was measured as a
control. (b) Fluorescence measurements of solution collected at the amplification chamber
following different durations of electrokinetic transfer of DNA strands that bound to MCF-7
cells. (c) Fluorescence measurements of IgE-binding ssDNA strands transported and captured
onto reverse primers-immobilized on beads. (d) Gel electropherogram of electrokinetically
transported ssDNA strands selected against glucose-boronic acid complexes captured on reverse
primer-immobilized microbeads. (e) Fluorescence measurements of MCF-7 cell binding ssDNA
strands transported and captured onto reverse primers-immobilized on beads. (f) Fluorescence
87
intensity of ssDNA strands amplified on beads following different numbers of PCR cycles
applied in the amplification chamber. Gel electropherograms for eluents collected during the
selection process for (g) IgE and (h) glucose-boronic acid following the amplified strands on
beads electrokinetically transported back in the selection chamber. (i) Fluorescence intensity
measurement of MCF-7 cells following amplified strands on beads electrokinetically transported
back into the selection chamber. Fluorescence intensities of bare cells were measured as a
control. Lane W: wash; Lane S: separation.
6.3.7 Multiple SELEX Rounds for Enrichment of Target-Binding Strands
The results obtained in experiments and theoretical analysis for the chip characterization
demonstrate that processes involving multiple SELEX rounds including the selection, transport,
amplification, and strand separation of target-binding strands could be achieved continuously in
our chips. To confirm these observations, we performed multiple rounds of SELEX using a chip
for each target without interruption between each process for verification. Eluents, however,
were collected during removal of unbound strands on functionalized beads or target cells during
the selection process while the eluents of the enriched final DNA pools for each target were also
sampled at the end of a multi-round SELEX. Using the eluents, gel images were obtained from
which band intensities were compared to investigate overall enrichment processes of target-
binding strands for each target.
We used Chip I for the enrichment of target-binding strands for IgE proteins in which 3
SELEX rounds were performed continuously. One additional selection process using human
Immunoglobulin G (IgG), to which the enriched DNA strands were not desired to bind (counter
selection), was conducted before the final enriched DNA pool was collected at the outlet of the

88
selection chamber. We also used Chip I for the enrichment of target-binding strands for glucose-
boronic acid complex binding in which 3 rounds of SELEX were performed. Counter selection
processes using boronic acids were added in the 2nd and 3rd SELEX rounds to maximize the
selection of strands that bind to the target complexes but not to boronic acids (counter target).
For the enrichment of MCF-7 cell-binding strands, we used Chip II and performed 3 rounds of
continuous SELEX (Supplementary Figure 14). Typical process time for a multi-round SELEX
using our chips was approximately 15 hours.
The gel image (Figure 6.5a) was obtained using eluents collected during the enrichment
of IgE-binding strands. As indicated by the distinct band shown in the lane W1 for each SELEX
round, all the necessary processes for on-chip SELEX such as selection, transfer, and
amplification were successfully carried out during the continuous SELEX experiment. In general,
the band intensity decreased from W1 to W10 as non- or weak-binding strands were removed
from bead surfaces with buffer wash in each round. During the3rd round, relatively smaller
amount of DNA was removed from the beads during wash as the weak band intensity shown in
lane W1. This could be because the binding affinity of the enriched pool increased and thus the
individual strands in the pool bound more strongly to the targets. Target-binding strands
collected following the multiple SELEX rounds and an additional counter selection were
obtained at the end of the experiment as a strong band shown in lane E (Figure 6.5b).
The gel image (Figure 6.5c) obtained for glucose-boronic acid complexes also indicates
that a continuous on-chip SELEX properly performed as distinct bands are shown in the lanes
W1. A relatively strong band in lane W10 in the 1st round could be due to the excess amount of
randomized ssDNA strands introduced initially that were not captured by the capture strands on
microbeads. Discernible bands shown in the lane C for 2nd and 3rd rounds indicate that strands
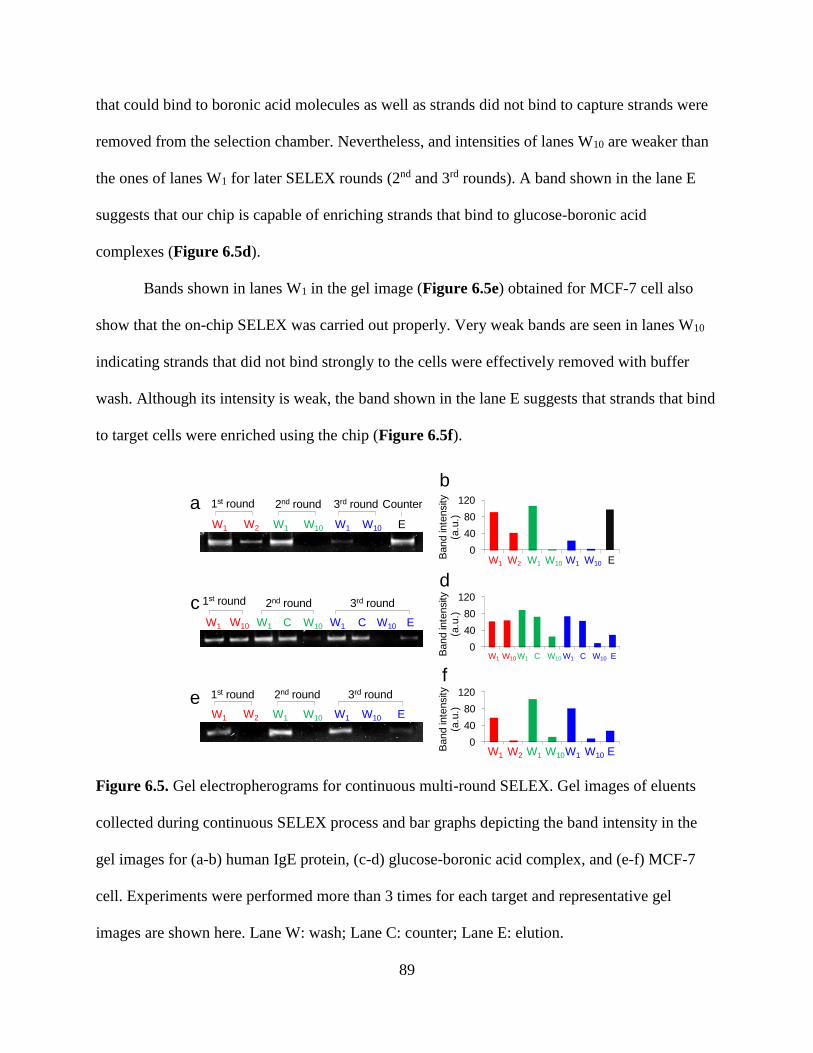
89
that could bind to boronic acid molecules as well as strands did not bind to capture strands were
removed from the selection chamber. Nevertheless, and intensities of lanes W10 are weaker than
the ones of lanes W1 for later SELEX rounds (2nd and 3rd rounds). A band shown in the lane E
suggests that our chip is capable of enriching strands that bind to glucose-boronic acid
complexes (Figure 6.5d).
Bands shown in lanes W1 in the gel image (Figure 6.5e) obtained for MCF-7 cell also
show that the on-chip SELEX was carried out properly. Very weak bands are seen in lanes W10
indicating strands that did not bind strongly to the cells were effectively removed with buffer
wash. Although its intensity is weak, the band shown in the lane E suggests that strands that bind
to target cells were enriched using the chip (Figure 6.5f).
0
40
80
120
Band in
tensity
(a.u
.)
0
40
80
120
Band in
tensity
(a.u
.)
1st round 2nd round 3rd round
W1 W2 W1 W10
Counter
e
a
c
f
0
40
80
120
Band in
tensity
(a.u
.)
b
d1st round 2nd round 3rd round
1st round 2nd round 3rd round
W1 W10 E
W1 W10 W1 C W1 W10 EW10 C
W1 W2 W1 W10 W1 W10 E
W1 W2 W1 W10 W1 W10 E
W1 W10 W1 C W1 W10 EW10 C
W1 W2 W1 W10W1 W10 E
Figure 6.5. Gel electropherograms for continuous multi-round SELEX. Gel images of eluents
collected during continuous SELEX process and bar graphs depicting the band intensity in the
gel images for (a-b) human IgE protein, (c-d) glucose-boronic acid complex, and (e-f) MCF-7
cell. Experiments were performed more than 3 times for each target and representative gel
images are shown here. Lane W: wash; Lane C: counter; Lane E: elution.
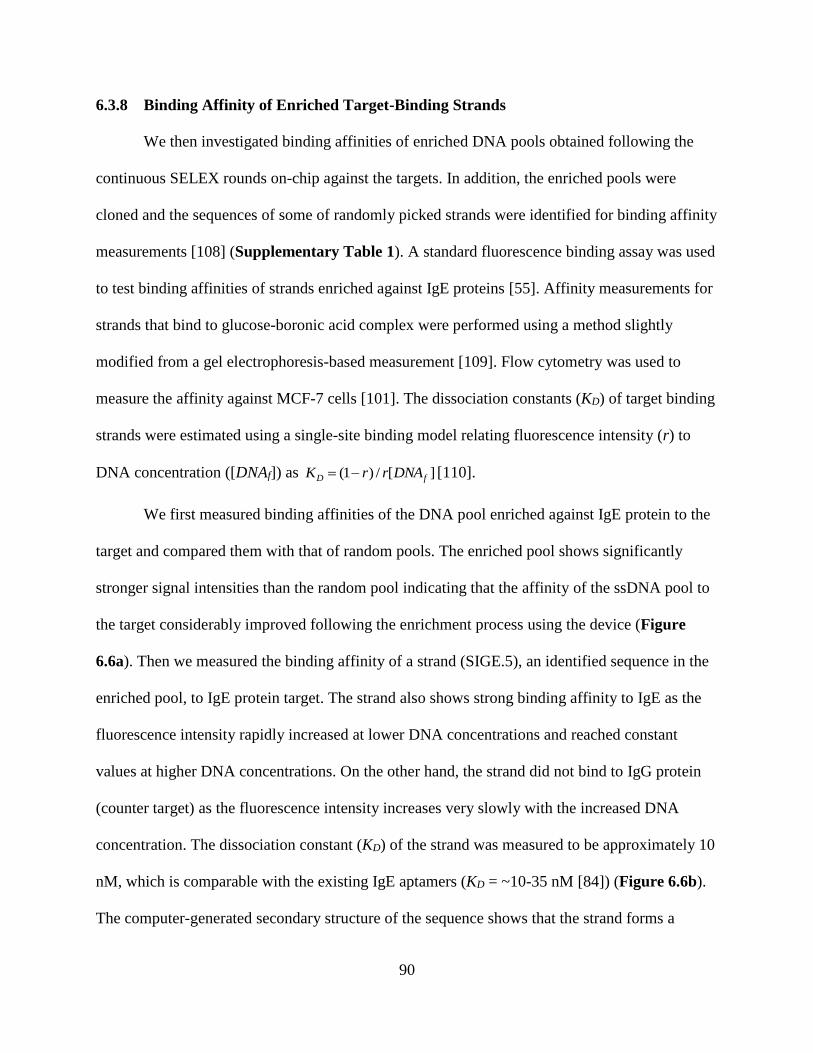
90
6.3.8 Binding Affinity of Enriched Target-Binding Strands
We then investigated binding affinities of enriched DNA pools obtained following the
continuous SELEX rounds on-chip against the targets. In addition, the enriched pools were
cloned and the sequences of some of randomly picked strands were identified for binding affinity
measurements [108] (Supplementary Table 1). A standard fluorescence binding assay was used
to test binding affinities of strands enriched against IgE proteins [55]. Affinity measurements for
strands that bind to glucose-boronic acid complex were performed using a method slightly
modified from a gel electrophoresis-based measurement [109]. Flow cytometry was used to
measure the affinity against MCF-7 cells [101]. The dissociation constants (KD) of target binding
strands were estimated using a single-site binding model relating fluorescence intensity (r) to
DNA concentration ([DNAf]) as ][/)1( fD DNArrK [110].
We first measured binding affinities of the DNA pool enriched against IgE protein to the
target and compared them with that of random pools. The enriched pool shows significantly
stronger signal intensities than the random pool indicating that the affinity of the ssDNA pool to
the target considerably improved following the enrichment process using the device (Figure
6.6a). Then we measured the binding affinity of a strand (SIGE.5), an identified sequence in the
enriched pool, to IgE protein target. The strand also shows strong binding affinity to IgE as the
fluorescence intensity rapidly increased at lower DNA concentrations and reached constant
values at higher DNA concentrations. On the other hand, the strand did not bind to IgG protein
(counter target) as the fluorescence intensity increases very slowly with the increased DNA
concentration. The dissociation constant (KD) of the strand was measured to be approximately 10
nM, which is comparable with the existing IgE aptamers (KD = ~10-35 nM [84]) (Figure 6.6b).
The computer-generated secondary structure of the sequence shows that the strand forms a
91
hairpin loop structure which could be responsible for its strong binding affinities to IgE protein
(Supplementary Figure 15 and Supplementary Table 2).
To assess the binding affinity of DNA strands enriched against glucose-boronic acid
complexes, microbeads were functionalized with individual strands via capture strands. Then,
different concentrations of target solutions were incubated with beads to allow binding reactions
between the strands on beads and the target molecules. Strands released from beads following
the incubation with different target concentrations were amplified via PCR for gel
electropherogram. Band intensities measured from the gel images show that the enriched DNA
pool binds significantly stronger to the target molecule (KD = ~ 5 μM) than the random pool
(Figure 6.6c). Furthermore, dissociation constant of a sequence in the enriched pool (SGB.2)
was ~2 μM, which is in the range of values for aptamers binding to small molecules [111]
(Figure 6.6d).
Flow cytometry measurements showed that the average fluorescence intensity of cells
incubated with the fluorescently labeled enriched DNA pool was significantly stronger than the
cells incubated with the random DNA library as indicated by the fluorescence intensity curve
which is shifted to the right (i.e., higher intensity) when compared to the signal obtained from
bare cells. Note that all cells possess some intrinsic level of autofluorescence, which is
commonly caused by nicotinamide adenine dinucleotide (NADH), riboflavins, and flavin
coenzymes in the cells [112, 113] (Figure 6.6e). In addition, the affinity of an aptamer
candidate for MCF-7 cells was KD = 20 nM, which is typical for aptamers reported against other
cancer cells [97] (Figure 6.6f). We verified that the fluorescence signal observed is not due to
the DNA uptake by dead cells using a propidium iodide assay [114] (Supplementary Figure 16).
92
0
200
400
600
800
0 5 10 15
Flu
ore
scence
inte
nsity (
a.u
.)
Target concentration (µM)
0
30
60
90
120
1000 10000 100000
Cell
count
Enriched poolRandom poolBare cells
0
500
1000
1500
0 20 40 60 80 100
Flu
ore
scence
inte
nsity (
a.u
.)
DNA concentration (nM)
0
100
200
300
400
500
0 50 100 150 200
Flu
ore
scence
inte
nsity (
a.u
.)
DNA concentration (nM)
0
200
400
600
800
0 5 10 15
Flu
ore
scence
inte
nsity (
a.u
.)
Target concentration (µM)
0
500
1000
1500
0 20 40 60 80 100
Flu
ore
scence
inte
nsity (
a.u
.)
DNA concentration (nM)
ba
c d
fe
Enriched pool
Random pool IgE
IgG
Enriched pool
Random pool
103 104 105
Fluorescence intensity (a.u.)
KD = 10 nM
KD = 2 μM
KD = 20 nM
KD = 5 μM
KD = 15 nM
Figure 6.6. Fluorescence-based binding affinity measurements of strands. Binding curves of (a)
enriched pool and random pool, and (b) a selected strand (SIGE. 5) against IgE protein. Binding
curves of (c) enriched pool and random pool, and (d) a selected strand (SGB. 2) against glucose-
boronic acid complex. (e) Flow cytometry measurements of cells incubated with enriched pool
and random pool, and bare cells. (f) A binding curve of a selected strand (SMCF. 1) against
MCF-7 cells.
93
6.4 Conclusions
We presented microfluidic chips for rapid generation of aptamers against various targets
including human IgE protein, small-molecule glucose-boronic acid complex, and MCF-7 cells.
The chips developed possess greatly simplified designs achieved by beads-based selection and
amplification of target-binding nucleic acids in functional microchambers with gel-based
electrokinetic transport of the strands in a single chip. Cross-contamination between different
chambers is effectively eliminated with a gel-based electrophoresis on-chip. The high level
integration of processes required for aptamer enrichments eliminates the need for complicated
flow handling components typically required in microfluidic chips. The devices were first
characterized for the processes necessary for generating target-binding oligonucleotides such as
selection, electrokinetic transfer, and amplification of strands on-chip. Following the device
characterization, multiple rounds of SELEX were demonstrated for the enrichment of target-
binding ssDNA strands in a random library for each target. Finally, target-binding strands
isolated using the devices were tested for binding affinities for their targets.
In our devices, ssDNA strands that strongly bound to IgE protein and MCF-7 cells were
isolated on IgE-functionalized bead and cell surfaces, while strands that did not bind to the
targets were removed with buffer wash (flow rate: 40 μL/min and 10 μL/min for IgE and MCF-7
targets, respectively). In addition, strands that bound to glucose-boronic acid complex were
effectively released from capture strands on beads upon an exposure to solution-borne target
molecules. With an electric field (~25 V/cm) generated on-chip, target-binding strands were
electrokinetically transferred (velocity: ~1 mm/min) to another chamber through a gel-filled
channel. While a constant pH level was maintained in the chamber by injecting a fresh buffer
94
solution (flow rate: 1 μL/min), the strands transferred were captured on primer-coated
microbeads and amplified in the chamber via PCR.
Using the devices, selection of target-binding oligomers in a random ssDNA library was
achieved within 3 SELEX rounds with assay times of approximately 15 hours. An aptamer
candidate identified against IgE protein showed specific binding to the target with KD = 10 nM,
while it possessed very weak binding affinity to IgG (counter target). The binding affinity of the
strand tested is comparable with binding affinity of existing IgE aptamers (KD = 10-35 nM [84]).
In addition, an aptamer candidate for glucose-boronic acid complex showed KD = 5 μM, which
was in the range of binding affinities of DNA aptamers for small molecules [111]. The affinity of
an aptamer candidate for MCF-7 cells was KD = 20 nM, which was typical value for aptamers
reported against other cancer cells [97].
95
Chapter 7. Conclusions
In this study, we developed electrokinetically integrated microfluidic SELEX platforms
for rapid generation of aptamers for various targets including proteins, small molecules, and cells.
The microdevices developed possess greatly simplified design, preparation, and operation
achieved by beads-based isolation and amplification of target binding oligonucleotides in
microchambers with gel-based electrokinetic transfer of the strands. The high level integration of
the devices eliminated the need for complicated flow handling components while cross-
contamination between different chambers was effectively prevented with a gel-based DNA
transfer on-chip. We first characterized our devices for processes required for aptamer generation
such as selection, electrokinetic transfer, and amplification of target-binding oligonucleotides on-
chip against human IgE protein, glucose-boronic acid complex, and MCF-7 cancer cells. Then,
we demonstrated multiple rounds of SELEX using one chip for each target without interruption
between each process during aptamer generation. Finally, binding affinities of the strands
generated using our devices were measured against their targets.
In Chapter 1, we provided an overview of aptamers including their properties attractive in
many biological applications. In addition, conventional methods used for the generation of
aptamers were described, with the procedures, advantages, and limitations stated. Microfluidic
technology employed for more efficient generation of aptamers was also discussed. Furthermore,
the objectives and specific aims of the current research were described followed by the
discussion on the contribution of this research on the aptamer generation.
In Chapter 2, we presented a microfluidic device that effectively isolates and enriches
ssDNA molecules that bind to human IgE antibody protein using a combination of SPE and
electrokinetic transfer techniques. In the device, oligomers were isolated via specific capture
96
onto microbeads functionalized with IgE in a chamber and electrokinetically transferred into
another chamber through a microchannel filled with a solidified agarose gel. A resistive heater
was integrated under the isolation chamber providing heat to release strongly bound oligomer
strands from the beads. The gel in the channel effectively blocked flows of undesirable samples
across the two chambers while only allowing oligomers that could be transferred with an applied
potential difference on chip. Results show that oligomers strands that strongly bind to IgE were
captured and enriched by repeatedly transferring them in a separate chamber in the device.
In Chapter 3, we presented a microfluidic chip that allows investigation of binding
interaction between nucleic acids and target cells. The microchip consists of two chambers for
capture and collection of cell binding nucleic acids, respectively, which were connected by a gel-
filled channel enabling electrokinetic transfer of oligomers while preventing cross-contamination
between the chambers. The electrokinetic approach for manipulation of DNA captured on cell
surfaces allows greatly simplified chip design for the investigation of binding interactions of
DNA with cells. Experimental results show that the microchip could establish key parameters for
selection of cell-binding oligomers from a random oligonucleotide library for later integration
within a microfluidic Cell-SELEX device.
In Chapter 4, we demonstrated an integrated microfluidic chip for isolation and PCR
amplification of ssDNA that bind to human IgE antibody protein. In the chip, cross-
contamination of buffers and samples in different microchambers was eliminated with the gel-
filled channel, while complicated flow handling components were not necessary realizing a
greatly simplified chip operation. Experimental results showed that the microfluidic device
developed was capable of achieving the processes required for a single round of SELEX against
protein targets which could be as a basis for establishing parameters for processes required in
97
multiple rounds of SELEX in a microfluidic device. In particular, DNA strands that strongly
bind to a protein target would be isolated on target-functionalized microbeads in a chamber and
amplified in another chamber, while the DNA strands are electrokinetically manipulated between
the chambers.
In Chapter 5, we presented a microfluidic-based approach for isolation and PCR
amplification of ssDNA molecules that bind to specific biological targets. The device possessed
highly simplified designs realized by combining surface-based DNA isolation and amplification
with gel-based electrophoretic transport. Due to the high level integration, complicated flow
control elements were not required in our device. On the other hand, cross-contamination
between different functional chambers was effectively eliminated by a gel filled in the channel
while allowing for an electrokinetic transfer of DNA strands. Results showed that the devices
were capable of performing a single round SELEX against biological targets including small
molecules, proteins, and cells.
In Chapter 6, we presented microfluidic devices for rapid generation of aptamers against
various targets including human IgE antibody protein, small-molecule glucose-boronic acid
complex, and MCF-7 cancer cells. A greatly simplified device design was achieved by beads-
based selection and amplification of target-binding oligomers in microchambers with gel-based
electrokinetic transfer of the strands in a device. The high level integration of processes required
for aptamer enrichments eliminated the need for complicated flow handling components
typically required in microfluidic devices. Using the devices, we were able to generate target-
binding oligonucleotides in a random ssDNA library in as few as 3 SELEX rounds with assay
times of approximately 15 hours. The specific binding affinity of an aptamer candidate for IgE

98
protein glucose-boronic acid, and MCF-7 cell showed the dissociation constants (KD) of 10 nM,
5 μM, and 20 nM, respectively.
Based on the results obtained using our preliminary devices, we can identify several
directions for future work toward creating microfluidic platforms that enable the rapid generation
of aptamers against clinically significant biological targets.
First, development of a microfluidic SELEX system could be pursued for selection of
aptamers with predefined binding characteristics to targets. The conformational structure of an
aptamer, which is responsible for the aptamer-target binding, can be strongly affected by
environmental conditions such as temperature, pH, and ionic strength [3, 5, 18]. Thus, such
SELEX microchip could be constructed to enable the selection of aptamers under a desirable
condition achieved by MEMS-based control of external conditions. For example, temperature
during the aptamer selection in the chip could be controlled in closed loop using integrated
temperature sensors and heaters (similar to those used in this thesis) such that the aptamers can
be selected to bind to the target and dissociate at different desired temperatures, respectively.
Second, the ability to integrate a microfluidic SELEX system could be further extended
to create a system for isolating RNA aptamers. Although the selection of RNA aptamers
typically requires more processing stems, RNA aptamers bind more favorably to a wider variety
of targets due to their tendency to form three-dimensional structures [115]. While the overall
strategy of surface-based selection and amplification remains the same for RNA aptamer
generation, the SELEX system would need to be modified for the amplification of target-binding
strands by integrating components for transcription and reverse transcription of the RNA strands.
Finally, DNA and RNA aptamers rapidly isolated on microfluidic platforms can be
explored in practically important applications. For instance, aptamers with tailor-designed
99
binding characteristics can be applied to in vitro manipulation and sensing of biological targets,
such as microfluidic affinity purification of biomolecules and cells on a solid phase with high
specificity, and isocratic elution of such analytes for downstream analysis and detection. In
isocratic elution, analytes are captured by the solid phase and eluted in the same buffer allowing
reduced complexity of the experimental protocol. In addition, isocratic elution could enable
efficient regeneration and reuse of the aptamer-functionalized surface [25]. Using aptamers with
predefined temperature-dependent binding characteristics, microfluidic affinity purification can
be performed in such a way that biological targets are captured by aptamer functionalized solid
surfaces at a temperature optimized for the aptamer-target binding, and upon purification by
buffer washes, eluted at a different temperature that induces dissociation of the aptamer-target
complex [25, 116]. In an in vivo setting, aptamers generated can be used in diagnostic and
therapeutic applications. In particular, the potential of aptamers as imaging and therapeutic agent
carriers or even themselves as therapeutic drugs is well recognized [117, 118], but has been
limited primarily by a lack of aptamers for targets of interest [119]. This potential could be
realized by using microfluidic platforms to rapidly isolate aptamers to recognize virtually any
biomarkers. For example, by straightforward chemical reactions, such aptamers could be
conjugated to imaging agents such as nanoparticles to form aptamer-based probes or therapeutic
agents to realize aptamer-based drug delivery [120] facilitating targeted delivery of the agents to
diseased cells (e.g., tumor cells) in the human body for early diagnosis and effective therapy,
respectively [121]. Furthermore, aptamers may be used as drugs by regulating disease-related
biological functions in cells [119]. An example of the aptamer-based drugs is Macugen, which is
a RNA aptamer regulating the activities of vascular endothelial growth factor (VEGF) to
manipulate VEGF-mediated angiogenesis (the formation of the new blood vessels) and prevent

100
vascular leakage from retinal vessels that could cause loss of vision [122]. Microfluidic
platforms would hold the potential to allow more rapid and systematic development of such
aptameric drugs against practically important targets [119, 123].
101
References
[1] A. D. Ellington and J. W. Szostak, "In vitro selection of RNA molecules that bind
specific ligands," Nature, vol. 346, pp. 818-822, 1990.
[2] C. Tuerk and L. Gold, "Systematic evolution of ligands by exponential enrichment: RNA
ligands to bacteriophage T4 DNA polymerase," Science, vol. 249, pp. 505-510, 1990.
[3] S. D. Jayasena, "Aptamers: an emerging class of molecules that rival antibodies in
diagnostics," Clinical chemistry, vol. 45, pp. 1628-1650, 1999.
[4] S. M. Nimjee, C. P. Rusconi, and B. A. Sullenger, "Aptamers: an emerging class of
therapeutics," Annu. Rev. Med., vol. 56, pp. 555-583, 2005.
[5] A. D. Keefe, S. Pai, and A. Ellington, "Aptamers as therapeutics," Nature Reviews Drug
Discovery, vol. 9, pp. 537-550, 2010.
[6] M. B. Murphy, S. T. Fuller, P. M. Richardson, and S. A. Doyle, "An improved method
for the in vitro evolution of aptamers and applications in protein detection and
purification," Nucleic Acids Research, vol. 31, pp. e110-e110, 2003.
[7] H.-M. So, K. Won, Y. H. Kim, B.-K. Kim, B. H. Ryu, P. S. Na, H. Kim, and J.-O. Lee,
"Single-walled carbon nanotube biosensors using aptamers as molecular recognition
elements," Journal of the American Chemical Society, vol. 127, pp. 11906-11907, 2005.
[8] P. Bouchard, R. Hutabarat, and K. Thompson, "Discovery and development of
therapeutic aptamers," Annual review of pharmacology and toxicology, vol. 50, pp. 237-
257, 2010.
[9] A. Heckel and G. Mayer, "Light regulation of aptamer activity: an anti-thrombin aptamer
with caged thymidine nucleobases," Journal of the American Chemical Society, vol. 127,
pp. 822-823, 2005.
[10] K.-A. Yang, R. Pei, D. Stefanovic, and M. N. Stojanovic, "Optimizing Cross-reactivity
with Evolutionary Search for Sensors," Journal of the American Chemical Society, vol.
134, pp. 1642-1647, 2012.
[11] R. R. White, B. A. Sullenger, and C. P. Rusconi, "Developing aptamers into
therapeutics," Journal of Clinical Investigation, vol. 106, pp. 929-934, 2000.
[12] C. K. O'Sullivan, "Aptasensors–the future of biosensing?," Analytical and bioanalytical
chemistry, vol. 372, pp. 44-48, 2002.
[13] J. Kim, J. Hilton, K. Yang, R. Pei, K. Ennis, M. Stojanovic, and Q. Lin, "A microchip for
nucleic acid isolation and enrichment," in Micro Electro Mechanical Systems (MEMS),
2012 IEEE 25th International Conference on, 2012, pp. 765-768.
[14] T. Nguyen, R. Pei, M. Stojanovic, and Q. Lin, "An aptamer-based microfluidic device for
thermally controlled affinity extraction," Microfluidics and nanofluidics, vol. 6, pp. 479-
487, 2009.
[15] Y. Ohno, K. Maehashi, and K. Matsumoto, "Label-Free Biosensors Based on Aptamer-
Modified Graphene Field-Effect Transistors," Journal of the American Chemical Society,
pp. 666-669, 2010.
[16] E. W. Ng, D. T. Shima, P. Calias, E. T. Cunningham, D. R. Guyer, and A. P. Adamis,
"Pegaptanib, a targeted anti-VEGF aptamer for ocular vascular disease," Nature Reviews
Drug Discovery, vol. 5, pp. 123-132, 2006.
[17] M. Famulok, J. S. Hartig, and G. Mayer, "Functional aptamers and aptazymes in
biotechnology, diagnostics, and therapy," Chemical Reviews-Columbus, vol. 107, pp.
3715-3743, 2007.
102
[18] R. Stoltenburg, C. Reinemann, and B. Strehlitz, "SELEX? A (r) evolutionary method to
generate high-affinity nucleic acid ligands," Biomolecular engineering, vol. 24, pp. 381-
403, 2007.
[19] R. K. Mosing, S. D. Mendonsa, and M. T. Bowser, "Capillary electrophoresis-SELEX
selection of aptamers with affinity for HIV-1 reverse transcriptase," Analytical Chemistry,
vol. 77, pp. 6107-6112, 2005.
[20] J. C. Cox, P. Rudolph, and A. D. Ellington, "Automated RNA selection," Biotechnology
progress, vol. 14, pp. 845-850, 1998.
[21] J. C. Cox and A. D. Ellington, "Automated selection of anti-protein aptamers,"
Bioorganic & medicinal chemistry, vol. 9, pp. 2525-2531, 2001.
[22] J. P. Kutter, S. C. Jacobson, and J. M. Ramsey, "Solid phase extraction on microfluidic
devices," Journal of Microcolumn Separations, vol. 12, pp. 93-97, 2000.
[23] C. Yu, M. H. Davey, F. Svec, and J. M. Fréchet, "Monolithic porous polymer for on-chip
solid-phase extraction and preconcentration prepared by photoinitiated in situ
polymerization within a microfluidic device," Analytical Chemistry, vol. 73, pp. 5088-
5096, 2001.
[24] J. D. Ramsey and G. E. Collins, "Integrated microfluidic device for solid-phase extraction
coupled to micellar electrokinetic chromatography separation," Analytical chemistry, vol.
77, pp. 6664-6670, 2005.
[25] T. H. Nguyen, R. Pei, M. Stojanovic, and Q. Lin, "Demonstration and characterization of
biomolecular enrichment on microfluidic aptamer-functionalized surfaces," Sensors and
Actuators B: Chemical, vol. 155, pp. 58-66, 2011.
[26] R. D. Oleschuk, L. L. Shultz-Lockyear, Y. Ning, and D. J. Harrison, "Trapping of bead-
based reagents within microfluidic systems: on-chip solid-phase extraction and
electrochromatography," Analytical Chemistry, vol. 72, pp. 585-590, 2000.
[27] K. A. Wolfe, M. C. Breadmore, J. P. Ferrance, M. E. Power, J. F. Conroy, P. M. Norris,
and J. P. Landers, "Toward a microchip‐based solid‐phase extraction method for isolation
of nucleic acids," Electrophoresis, vol. 23, pp. 727-733, 2002.
[28] H. Tian, A. F. Hühmer, and J. P. Landers, "Evaluation of silica resins for direct and
efficient extraction of DNA from complex biological matrices in a miniaturized format,"
Analytical Biochemistry, vol. 283, pp. 175-191, 2000.
[29] W. Cao, C. J. Easley, J. P. Ferrance, and J. P. Landers, "Chitosan as a polymer for pH-
induced DNA capture in a totally aqueous system," Analytical chemistry, vol. 78, pp.
7222-7228, 2006.
[30] J. Wen, L. A. Legendre, J. M. Bienvenue, and J. P. Landers, "Purification of nucleic acids
in microfluidic devices," Analytical chemistry, vol. 80, pp. 6472-6479, 2008.
[31] S. Natesan, D. G. Baer, T. J. Walters, M. Babu, and R. J. Christy, "Adipose-derived stem
cell delivery into collagen gels using chitosan microspheres," Tissue Engineering Part A,
vol. 16, pp. 1369-1384, 2010.
[32] M. Karle, J. Miwa, G. Czilwik, V. Auwärter, G. Roth, R. Zengerle, and F. von Stetten,
"Continuous microfluidic DNA extraction using phase-transfer magnetophoresis," Lab on
a Chip, vol. 10, pp. 3284-3290, 2010.
[33] J.-W. Choi, K. W. Oh, A. Han, C. A. Wijayawardhana, C. Lannes, S. Bhansali, K. T.
Schlueter, W. R. Heineman, H. B. Halsall, and J. H. Nevin, "Development and
characterization of microfluidic devices and systems for magnetic bead-based
biochemical detection," Biomedical microdevices, vol. 3, pp. 191-200, 2001.
103
[34] K.-S. Shin, S. W. Lee, K.-C. Han, S. K. Kim, E. K. Yang, J. H. Park, B.-K. Ju, J. Y. Kang,
and T. S. Kim, "Amplification of fluorescence with packed beads to enhance the
sensitivity of miniaturized detection in microfluidic chip," Biosensors and Bioelectronics,
vol. 22, pp. 2261-2267, 2007.
[35] M. Cretich, G. Di Carlo, C. Giudici, S. Pokoj, I. Lauer, S. Scheurer, and M. Chiari,
"Detection of allergen specific immunoglobulins by microarrays coupled to
microfluidics," Proteomics, vol. 9, pp. 2098-2107, 2009.
[36] E. D. Goluch, S. I. Stoeva, J.-S. Lee, K. A. Shaikh, C. A. Mirkin, and C. Liu, "A
microfluidic detection system based upon a surface immobilized biobarcode assay,"
Biosensors and Bioelectronics, vol. 24, pp. 2397-2403, 2009.
[37] T. H. Nguyen, R. Pei, M. Stojanovic, and Q. Lin, "Demonstration and Characterization of
Biomolecular Enrichment on Microfluidic Aptamer-Functionalized Surfaces," Sensors
and Actuators B: Chemical, 2010.
[38] M.-C. Lin, J. Nawarak, T.-Y. Chen, H.-Y. Tsai, J.-F. Hsieh, S. Sinchaikul, and S.-T.
Chen, "Rapid detection of natriuretic peptides by a microfluidic LabChip analyzer with
DNA aptamers: Application of natriuretic peptide detection," Biomicrofluidics, vol. 3, p.
034101, 2009.
[39] Q. Zhao, M. Wu, X. Chris Le, and X.-F. Li, "Applications of aptamer affinity
chromatography," TrAC Trends in Analytical Chemistry, 2012.
[40] M. Bu, T. Melvin, G. Ensell, J. S. Wilkinson, and A. G. Evans, "Design and theoretical
evaluation of a novel microfluidic device to be used for PCR," Journal of
Micromechanics and Microengineering, vol. 13, p. S125, 2003.
[41] Y. Liu, C. B. Rauch, R. L. Stevens, R. Lenigk, J. Yang, D. B. Rhine, and P. Grodzinski,
"DNA amplification and hybridization assays in integrated plastic monolithic devices,"
Analytical Chemistry, vol. 74, pp. 3063-3070, 2002.
[42] E. T. Lagally, C. A. Emrich, and R. A. Mathies, "Fully integrated PCR-capillary
electrophoresis microsystem for DNA analysis," Lab on a Chip, vol. 1, pp. 102-107, 2001.
[43] S. Park, Y. Zhang, S. Lin, T.-H. Wang, and S. Yang, "Advances in microfluidic PCR for
point-of-care infectious disease diagnostics," Biotechnology advances, vol. 29, pp. 830-
839, 2011.
[44] Y. Zhang and P. Ozdemir, "Microfluidic DNA amplification-a review," Analytica
chimica acta, vol. 638, pp. 115-125, 2009.
[45] C. Zhang, J. Xu, W. Ma, and W. Zheng, "PCR microfluidic devices for DNA
amplification," Biotechnology advances, vol. 24, pp. 243-284, 2006.
[46] M. U. Kopp, A. J. De Mello, and A. Manz, "Chemical amplification: continuous-flow
PCR on a chip," Science, vol. 280, pp. 1046-1048, 1998.
[47] P. J. Obeid, T. K. Christopoulos, H. J. Crabtree, and C. J. Backhouse, "Microfabricated
device for DNA and RNA amplification by continuous-flow polymerase chain reaction
and reverse transcription-polymerase chain reaction with cycle number selection,"
Analytical chemistry, vol. 75, pp. 288-295, 2003.
[48] I. Schneegaß, R. Bräutigam, and J. M. Köhler, "Miniaturized flow-through PCR with
different template types in a silicon chip thermocycler," Lab on a Chip, vol. 1, pp. 42-49,
2001.
[49] J. Hilton, T. Nguyen, M. Barbu, R. Pei, M. Stojanovic, and Q. Lin, "Pathogen detection
using microfluidic bead-based polymerase chain reaction," in Solid-State Sensors,
104
Actuators and Microsystems Conference (TRANSDUCERS), 2011 16th International,
2011, pp. 190-193.
[50] J. Hilton, J. Kim, T. H. Nguyen, M. Barbu, R. Pei, M. Stojanovic, and Q. Lin, "Isolation
of thermally sensitive aptamers on a microchip," 2012, pp. 100-103.
[51] G. Hybarger, J. Bynum, R. F. Williams, J. J. Valdes, and J. P. Chambers, "A microfluidic
SELEX prototype," Analytical and bioanalytical chemistry, vol. 384, pp. 191-198, 2006.
[52] U. Kim, C.-W. Shu, K. Y. Dane, P. S. Daugherty, J. Y. Wang, and H. Soh, "Selection of
mammalian cells based on their cell-cycle phase using dielectrophoresis," Proceedings of
the National Academy of Sciences, vol. 104, pp. 20708-20712, 2007.
[53] J. Qian, X. Lou, Y. Zhang, Y. Xiao, and H. T. Soh, "Generation of highly specific
aptamers via micromagnetic selection," Analytical chemistry, vol. 81, pp. 5490-5495,
2009.
[54] X. Lou, J. Qian, Y. Xiao, L. Viel, A. E. Gerdon, E. T. Lagally, P. Atzberger, T. M.
Tarasow, A. J. Heeger, and H. T. Soh, "Micromagnetic selection of aptamers in
microfluidic channels," Proceedings of the National Academy of Sciences, vol. 106, pp.
2989-2994, 2009.
[55] M. Cho, Y. Xiao, J. Nie, R. Stewart, A. T. Csordas, S. S. Oh, J. A. Thomson, and H. T.
Soh, "Quantitative selection of DNA aptamers through microfluidic selection and high-
throughput sequencing," Proceedings of the National Academy of Sciences, vol. 107, pp.
15373-15378, 2010.
[56] S.-m. Park, J.-Y. Ahn, M. Jo, D.-k. Lee, J. T. Lis, H. G. Craighead, and S. Kim,
"Selection and elution of aptamers using nanoporous sol-gel arrays with integrated
microheaters," Lab on a Chip, vol. 9, pp. 1206-1212, 2009.
[57] J.-Y. Ahn, S. Lee, M. Jo, J. Kang, E. Kim, O. C. Jeong, T. Laurell, and S. Kim, "Sol–Gel
Derived Nanoporous Compositions for Entrapping Small Molecules and Their Outlook
toward Aptamer Screening," Analytical chemistry, vol. 84, pp. 2647-2653, 2012.
[58] C.-J. Huang, H.-I. Lin, S.-C. Shiesh, and G.-B. Lee, "Integrated microfluidic system for
rapid screening of CRP aptamers utilizing systematic evolution of ligands by exponential
enrichment (SELEX)," Biosensors & bioelectronics, vol. 25, p. 1761, 2010.
[59] J.-H. Wang, L. Cheng, C.-H. Wang, W.-S. Ling, S.-W. Wang, and G.-B. Lee, "An
integrated chip capable of performing sample pretreatment and nucleic acid amplification
for HIV-1 detection," Biosensors and Bioelectronics, 2012.
[60] C.-H. Weng, I.-S. Hsieh, L.-Y. Hung, H.-I. Lin, S.-C. Shiesh, Y.-L. Chen, and G.-B. Lee,
"An automatic microfluidic system for rapid screening of cancer stem-like cell-specific
aptamers," Microfluidics and nanofluidics, pp. 1-13, 2013.
[61] Y. J. Lee, B. Choi, E. H. Lee, K. S. Choi, and S. Sohn, "Immobilization stress induces
cell death through production of reactive oxygen species in the mouse cerebral cortex,"
Neuroscience letters, vol. 392, pp. 27-31, 2006.
[62] G. Chu, D. Vollrath, and R. W. Davis, "Separation of large DNA molecules by contour-
clamped homogeneous electric fields," Science, vol. 234, pp. 1582-1585, 1986.
[63] J. Hilton, J. Kim, T. Nguyen, M. Barbu, R. Pei, M. Stojanovic, and Q. Lin, "Isolation of
thermally sensitive aptamers on a microchip," in Micro Electro Mechanical Systems
(MEMS), 2012 IEEE 25th International Conference on, 2012, pp. 100-103.
[64] J. Lichtenberg, N. F. de Rooij, and E. Verpoorte, "A microchip electrophoresis system
with integrated in‐plane electrodes for contactless conductivity detection,"
Electrophoresis, vol. 23, pp. 3769-3780, 2002.
105
[65] M. J. Shiddiky and Y.-B. Shim, "Trace analysis of DNA: preconcentration, separation,
and electrochemical detection in microchip electrophoresis using Au nanoparticles,"
Analytical chemistry, vol. 79, pp. 3724-3733, 2007.
[66] J. Kim, J. Hilton, K. Yang, R. Pei, K. Ennis, M. Stojanovic, and Q. Lin, "A microchip for
nucleic acid isolation and enrichment," Paris, France, 2012, pp. 765-768.
[67] P. S. Dittrich, K. Tachikawa, and A. Manz, "Micro total analysis systems. Latest
advancements and trends," Analytical Chemistry, vol. 78, pp. 3887-3908, 2006.
[68] A. G. Crevillén, M. Hervás, M. A. López, M. C. González, and A. Escarpa, "Real sample
analysis on microfluidic devices," Talanta, vol. 74, pp. 342-357, 2007.
[69] S. M. Kim, M. A. Burns, and E. F. Hasselbrink, "Electrokinetic protein preconcentration
using a simple glass/poly (dimethylsiloxane) microfluidic chip," Analytical Chemistry,
vol. 78, pp. 4779-4785, 2006.
[70] K. C. Saunders, A. Ghanem, W. Boon Hon, E. F. Hilder, and P. R. Haddad, "Separation
and sample pre-treatment in bioanalysis using monolithic phases: A review," Analytica
Chimica Acta, vol. 652, pp. 22-31, 2009.
[71] L. Liu, S. Yu, S. Yang, P. Zhou, J. Hu, and Y. Zhang, "Extraction of genomic DNA using
a new amino silica monolithic column," Journal of Separation Science, vol. 32, pp. 2752-
2758, 2009.
[72] S. J. Kim, Y. A. Song, and J. Han, "Nanofluidic concentration devices for biomolecules
utilizing ion concentration polarization: theory, fabrication, and applications," Chemical
Society Reviews, vol. 39, pp. 912-922, 2010.
[73] J. Dai, T. Ito, L. Sun, and R. M. Crooks, "Electrokinetic trapping and concentration
enrichment of DNA in a microfluidic channel," Journal of the American Chemical
Society, vol. 125, pp. 13026-13027, 2003.
[74] F. Pena-Pereira, I. Lavilla, and C. Bendicho, "Miniaturized preconcentration methods
based on liquid-liquid extraction and their application in inorganic ultratrace analysis and
speciation: A review," Spectrochimica Acta Part B: Atomic Spectroscopy, vol. 64, pp. 1-
15, 2009.
[75] T. S. Ho, S. Pedersen-Bjergaard, and K. E. Rasmussen, "Recovery, enrichment and
selectivity in liquid-phase microextraction: Comparison with conventional liquid–liquid
extraction," Journal of Chromatography A, vol. 963, pp. 3-17, 2002.
[76] A. Handlos and T. Baron, "Mass and heat transfer from drops in liquid‐liquid extraction,"
AIChE Journal, vol. 3, pp. 127-136, 1957.
[77] M. Karwa, D. Hahn, and S. Mitra, "A sol–gel immobilization of nano and micron size
sorbents in poly (dimethylsiloxane)(PDMS) microchannels for microscale solid phase
extraction (SPE)," Analytica Chimica Acta, vol. 546, pp. 22-29, 2005.
[78] S. Pennathur, F. Baldessari, J. G. Santiago, M. G. Kattah, J. B. Steinman, and P. J. Utz,
"Free-solution oligonucleotide separation in nanoscale channels," Analytical Chemistry,
vol. 79, pp. 8316-8322, 2007.
[79] D. Stein, Z. Deurvorst, F. H. J. Van Der Heyden, W. J. A. Koopmans, A. Gabel, and C.
Dekker, "Electrokinetic Concentration of DNA Polymers in Nanofluidic Channels,"
Nano letters, vol. 10, pp. 765-772, 2010.
[80] D. Wu, J. Qin, and B. Lin, "Electrophoretic separations on microfluidic chips," Journal of
Chromatography A, vol. 1184, pp. 542-559, 2008.
[81] P. G. Mazzola, A. M. Lopes, F. A. Hasmann, A. F. Jozala, T. C. V. Penna, P. O.
Magalhaes, C. O. Rangel‐Yagui, and A. Pessoa Jr, "Liquid–liquid extraction of
106
biomolecules: an overview and update of the main techniques," Journal of Chemical
Technology and Biotechnology, vol. 83, pp. 143-157, 2008.
[82] S. Pedersen-Bjergaard, K. E. Rasmussen, and T. Grønhaug Halvorsen, "Liquid–liquid
extraction procedures for sample enrichment in capillary zone electrophoresis," Journal
of Chromatography A, vol. 902, pp. 91-105, 2000.
[83] A. Inoue, T. Ito, K. Makino, K. Hosokawa, and M. Maeda, "I-Shaped microchannel array
chip for parallel electrophoretic analyses," Analytical Chemistry, vol. 79, pp. 2168-2173,
2007.
[84] T. W. Wiegand, P. B. Williams, S. C. Dreskin, M. H. Jouvin, J. P. Kinet, and D. Tasset,
"High-affinity oligonucleotide ligands to human IgE inhibit binding to Fc epsilon
receptor I," The Journal of Immunology, vol. 157, p. 221, 1996.
[85] H. A. Levine and M. Nilsen-Hamilton, "A mathematical analysis of SELEX,"
Computational Biology and Chemistry, vol. 31, pp. 11-35, 2007.
[86] C. Cannizzaro, N. Tandon, E. Figallo, H. Park, S. Gerecht, M. Radisic, N. Elvassore, and
G. Vunjak-Novakovic, "Practical aspects of cardiac tissue engineering with electrical
stimulation," Methods in Molecular Medicine, vol. 140, p. 291, 2007.
[87] S. Miki, T. Kaneta, and T. Imasaka, "Capillary electrophoresis immunoassay based on an
on-column immunological reaction," Journal of Chromatography A, vol. 1066, pp. 197-
203, 2005.
[88] M. S. Munson, G. Danger, J. G. Shackman, and D. Ross, "Temperature gradient focusing
with field-amplified continuous sample injection for dual-stage analyte enrichment and
separation," Analytical Chemistry, vol. 79, pp. 6201-6207, 2007.
[89] J. J. Hayes and A. P. Wolffe, "Histones H2A/H2B inhibit the interaction of transcription
factor IIIA with the Xenopus borealis somatic 5S RNA gene in a nucleosome,"
Proceedings of the National Academy of Sciences, vol. 89, p. 1229, 1992.
[90] M. C. Morales, H. Lin, and J. D. Zahn, "Continuous microfluidic DNA and protein
trapping and concentration by balancing transverse electrokinetic forces," Lab Chip, 2011.
[91] K. A. Dill and S. Bromberg, Molecular driving forces: statistical thermodynamics in
chemistry and biology: Routledge, 2003.
[92] J. Rousseau, G. Drouin, and G. W. Slater, "Gel electrophoretic mobility of
single‐stranded DNA: The two reptation field‐dependent factors," Electrophoresis, vol.
21, pp. 1464-1470, 2000.
[93] C. Heller, "Separation of double‐stranded and single‐stranded DNA in polymer solutions:
I. Mobility and separation mechanism," Electrophoresis, vol. 20, pp. 1962-1976, 1999.
[94] Y. C. Chan, Y. K. Lee, and Y. Zohar, "High-throughput design and fabrication of an
integrated microsystem with high aspect-ratio sub-micron pillar arrays for free-solution
micro capillary electrophoresis," Journal of Micromechanics and Microengineering, vol.
16, p. 699, 2006.
[95] W. Emlen, A. Rifai, D. Magilavy, and M. Mannik, "Hepatic binding of DNA is mediated
by a receptor on nonparenchymal cells," The American journal of pathology, vol. 133, p.
54, 1988.
[96] J. A. Wolff, "The “grand” problem of synthetic delivery," Nature biotechnology, vol. 20,
pp. 768-769, 2002.
[97] K. Sefah, D. Shangguan, X. Xiong, M. B. O'Donoghue, and W. Tan, "Development of
DNA aptamers using Cell-SELEX," Nature protocols, vol. 5, pp. 1169-1185, 2010.
107
[98] A. Valero, J. Post, J. Van Nieuwkasteele, P. Ter Braak, W. Kruijer, and A. Van Den Berg,
"Gene transfer and protein dynamics in stem cells using single cell electroporation in a
microfluidic device," Lab on a Chip, vol. 8, pp. 62-67, 2008.
[99] R. B. Brown and J. Audet, "Current techniques for single-cell lysis," Journal of The
Royal Society Interface, vol. 5, pp. S131-S138, 2008.
[100] J. T. Nevill, R. Cooper, M. Dueck, D. N. Breslauer, and L. P. Lee, "Integrated
microfluidic cell culture and lysis on a chip," Lab on a Chip, vol. 7, pp. 1689-1695, 2007.
[101] J. P. Jakupciak, W. Wang, M. E. Markowitz, D. Ally, M. Coble, S. Srivastava, A. Maitra,
P. E. Barker, D. Sidransky, and C. D. O'Connell, "Mitochondrial DNA as a cancer
biomarker," The Journal of Molecular Diagnostics, vol. 7, pp. 258-267, 2005.
[102] M. Sánchez-Carbayo, "Use of high-throughput DNA microarrays to identify biomarkers
for bladder cancer," Clinical chemistry, vol. 49, pp. 23-31, 2003.
[103] C.-J. Huang, H.-I. Lin, S.-C. Shiesh, and G.-B. Lee, "An integrated microfluidic system
for rapid screening of alpha-fetoprotein-specific aptamers," Biosensors and
Bioelectronics, 2012.
[104] J. Zhang, H. P. Lang, G. Yoshikawa, and C. Gerber, "Optimization of DNA hybridization
efficiency by ph-driven nanomechanical bending," Langmuir, vol. 28, pp. 6494-6501,
2012.
[105] T. Hianik, V. Ostatná, M. Sonlajtnerova, and I. Grman, "Influence of ionic strength, pH
and aptamer configuration for binding affinity to thrombin," Bioelectrochemistry, vol. 70,
pp. 127-133, 2007.
[106] H. Bimboim and J. Doly, "A rapid alkaline extraction procedure for screening
recombinant plasmid DNA," Nucleic Acids Research, vol. 7, pp. 1513-1523, 1979.
[107] G. McFadden and M. Melkonian, "Use of Hepes buffer for microalgal culture media and
fixation for electron microscopy," Phycologia, vol. 25, pp. 551-557, 1986.
[108] F. Sanger, A. R. Coulson, B. Barrell, A. Smith, and B. Roe, "Cloning in single-stranded
bacteriophage as an aid to rapid DNA sequencing," Journal of molecular biology, vol.
143, pp. 161-178, 1980.
[109] M. Jing and M. T. Bowser, "Methods for measuring aptamer-protein equilibria: a
review," Analytica chimica acta, vol. 686, pp. 9-18, 2011.
[110] P. M. Fordyce, D. Gerber, D. Tran, J. Zheng, H. Li, J. L. DeRisi, and S. R. Quake, "De
novo identification and biophysical characterization of transcription-factor binding sites
with microfluidic affinity analysis," Nature biotechnology, vol. 28, pp. 970-975, 2010.
[111] M. McKeague and M. C. DeRosa, "Challenges and opportunities for small molecule
aptamer development," Journal of nucleic acids, vol. 2012, 2012.
[112] J. Aubin, "Autofluorescence of viable cultured mammalian cells," Journal of
Histochemistry & Cytochemistry, vol. 27, pp. 36-43, 1979.
[113] V. L. Mosiman, B. K. Patterson, L. Canterero, and C. L. Goolsby, "Reducing cellular
autofluorescence in flow cytometry: an in situ method," Cytometry, vol. 30, pp. 151-156,
1997.
[114] C. Riccardi and I. Nicoletti, "Analysis of apoptosis by propidium iodide staining and flow
cytometry," Nature protocols, vol. 1, pp. 1458-1461, 2006.
[115] A. Cencic, "Generating Aptamers for Cancer Diagnosis and Therapy," Clinical and
Experimental Pharmacology, 2012.
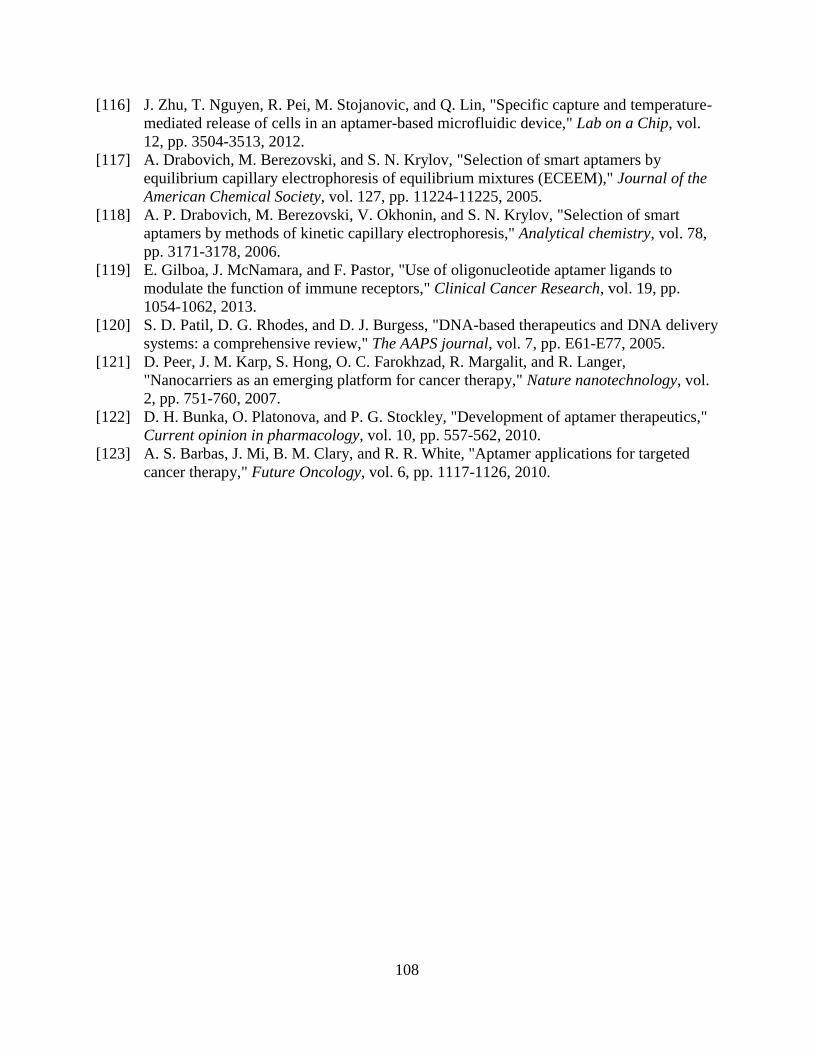
108
[116] J. Zhu, T. Nguyen, R. Pei, M. Stojanovic, and Q. Lin, "Specific capture and temperature-
mediated release of cells in an aptamer-based microfluidic device," Lab on a Chip, vol.
12, pp. 3504-3513, 2012.
[117] A. Drabovich, M. Berezovski, and S. N. Krylov, "Selection of smart aptamers by
equilibrium capillary electrophoresis of equilibrium mixtures (ECEEM)," Journal of the
American Chemical Society, vol. 127, pp. 11224-11225, 2005.
[118] A. P. Drabovich, M. Berezovski, V. Okhonin, and S. N. Krylov, "Selection of smart
aptamers by methods of kinetic capillary electrophoresis," Analytical chemistry, vol. 78,
pp. 3171-3178, 2006.
[119] E. Gilboa, J. McNamara, and F. Pastor, "Use of oligonucleotide aptamer ligands to
modulate the function of immune receptors," Clinical Cancer Research, vol. 19, pp.
1054-1062, 2013.
[120] S. D. Patil, D. G. Rhodes, and D. J. Burgess, "DNA-based therapeutics and DNA delivery
systems: a comprehensive review," The AAPS journal, vol. 7, pp. E61-E77, 2005.
[121] D. Peer, J. M. Karp, S. Hong, O. C. Farokhzad, R. Margalit, and R. Langer,
"Nanocarriers as an emerging platform for cancer therapy," Nature nanotechnology, vol.
2, pp. 751-760, 2007.
[122] D. H. Bunka, O. Platonova, and P. G. Stockley, "Development of aptamer therapeutics,"
Current opinion in pharmacology, vol. 10, pp. 557-562, 2010.
[123] A. S. Barbas, J. Mi, B. M. Clary, and R. R. White, "Aptamer applications for targeted
cancer therapy," Future Oncology, vol. 6, pp. 1117-1126, 2010.
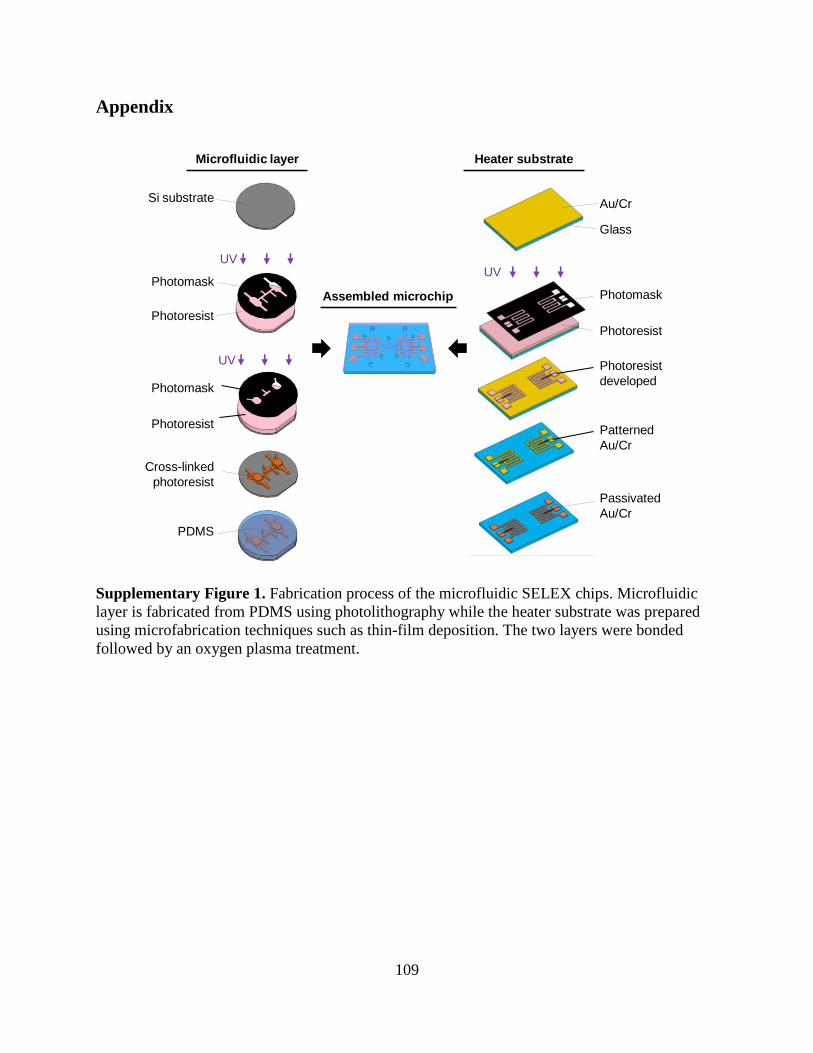
109
Appendix
Si substrate
Photomask
Cross-linked
photoresist
PDMS
Au/Cr
Glass
Photomask
Photoresist
UV
Photoresist
Photoresist
developed
Patterned
Au/Cr
Passivated
Au/Cr
Assembled microchip
UV
UV
Photomask
Photoresist
Microfluidic layer Heater substrate
Supplementary Figure 1. Fabrication process of the microfluidic SELEX chips. Microfluidic
layer is fabricated from PDMS using photolithography while the heater substrate was prepared
using microfabrication techniques such as thin-film deposition. The two layers were bonded
followed by an oxygen plasma treatment.
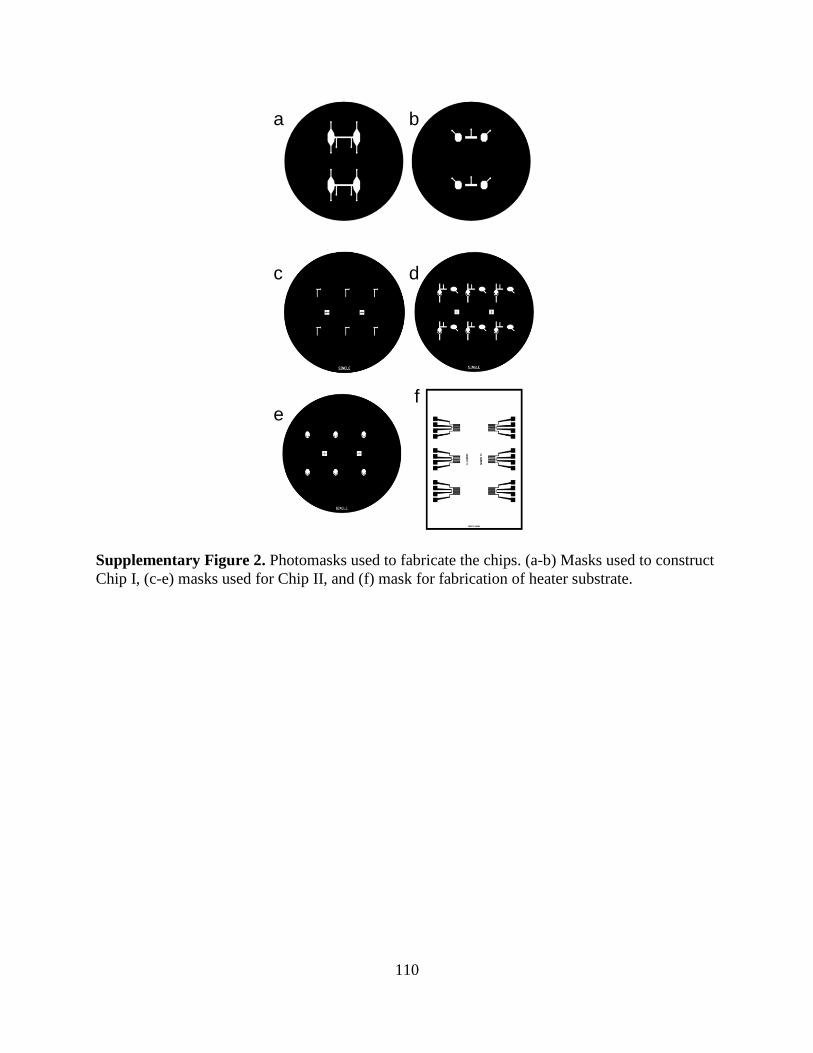
110
a b
c d
ef
Supplementary Figure 2. Photomasks used to fabricate the chips. (a-b) Masks used to construct
Chip I, (c-e) masks used for Chip II, and (f) mask for fabrication of heater substrate.
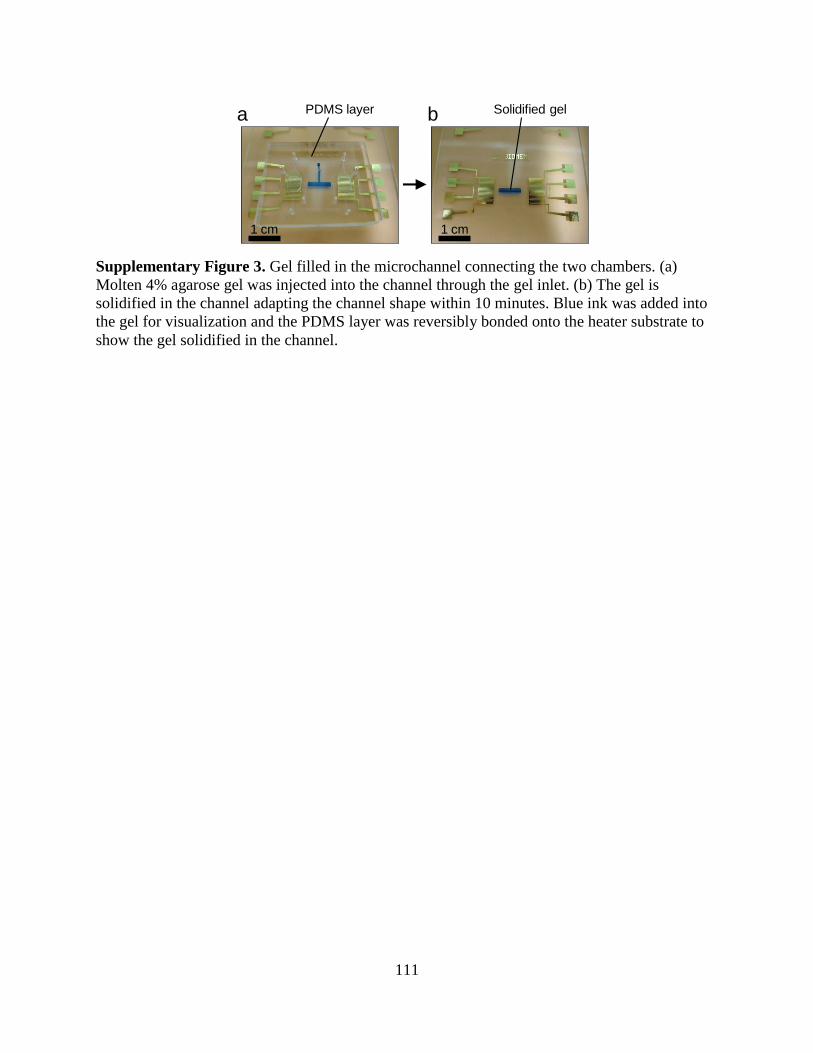
111
1 cm
Solidified gel
1 cm
PDMS layera b
Supplementary Figure 3. Gel filled in the microchannel connecting the two chambers. (a)
Molten 4% agarose gel was injected into the channel through the gel inlet. (b) The gel is
solidified in the channel adapting the channel shape within 10 minutes. Blue ink was added into
the gel for visualization and the PDMS layer was reversibly bonded onto the heater substrate to
show the gel solidified in the channel.
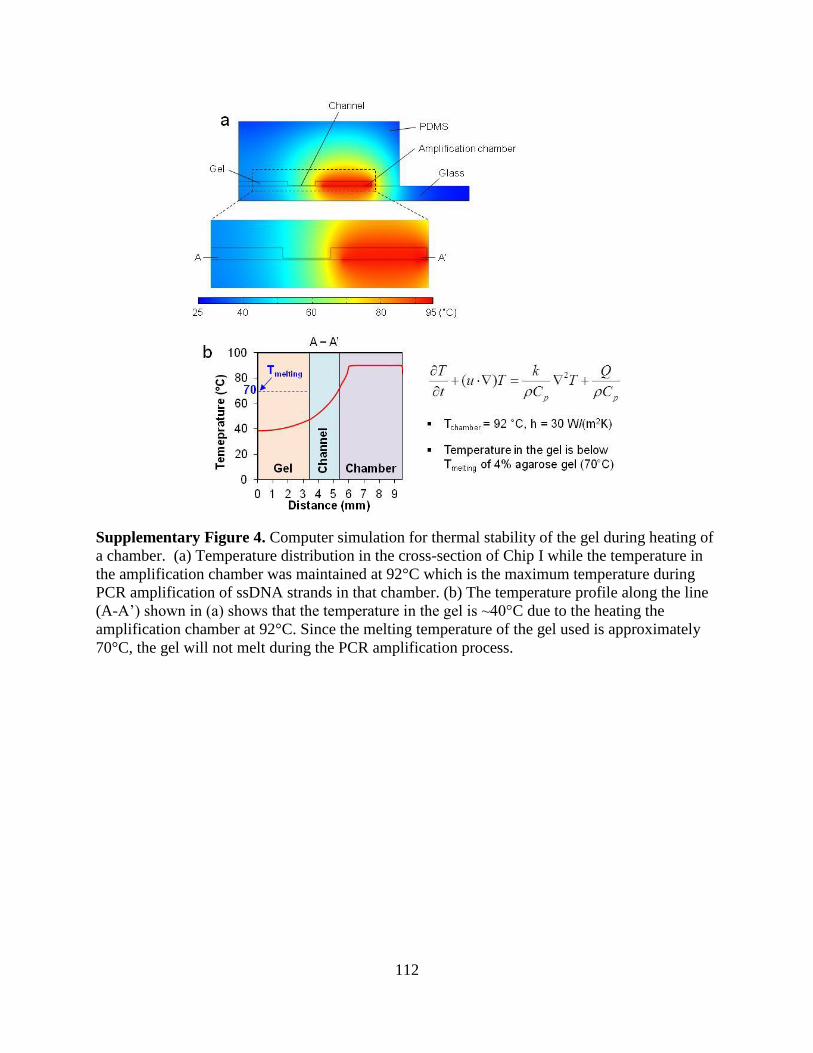
112
Supplementary Figure 4. Computer simulation for thermal stability of the gel during heating of
a chamber. (a) Temperature distribution in the cross-section of Chip I while the temperature in
the amplification chamber was maintained at 92°C which is the maximum temperature during
PCR amplification of ssDNA strands in that chamber. (b) The temperature profile along the line
(A-A’) shown in (a) shows that the temperature in the gel is ~40 C due to the heating the
amplification chamber at 92°C. Since the melting temperature of the gel used is approximately
70°C, the gel will not melt during the PCR amplification process.
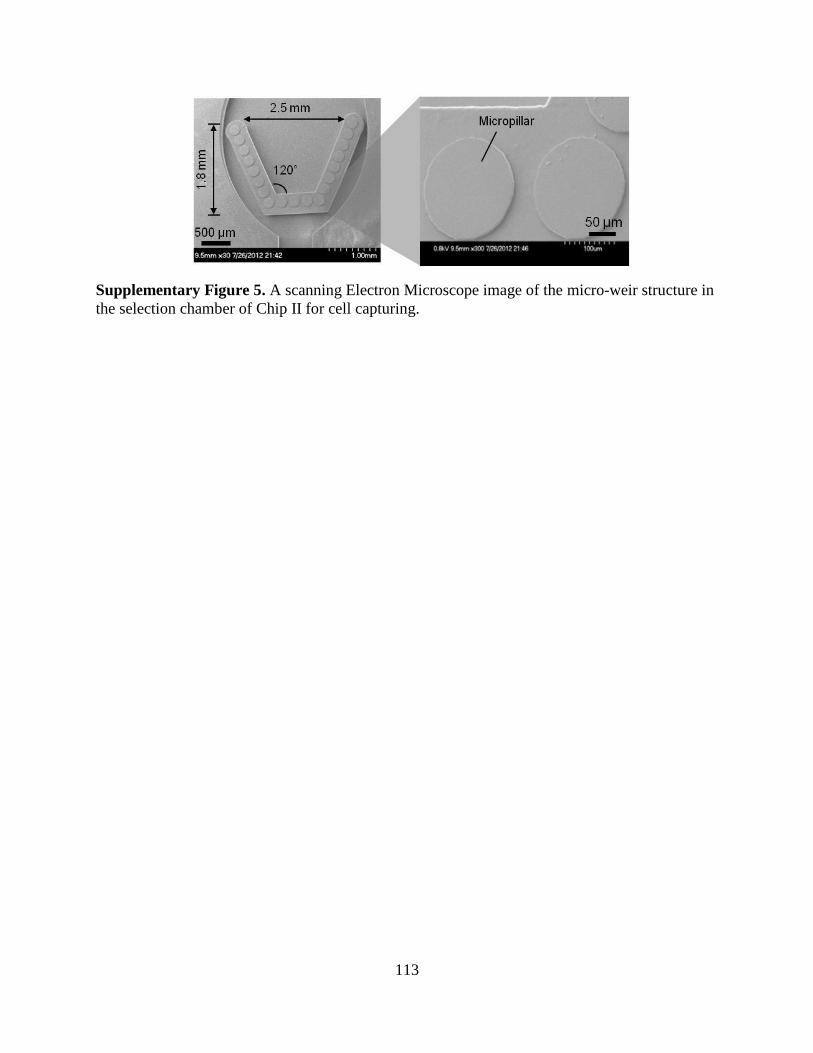
113
Supplementary Figure 5. A scanning Electron Microscope image of the micro-weir structure in
the selection chamber of Chip II for cell capturing.
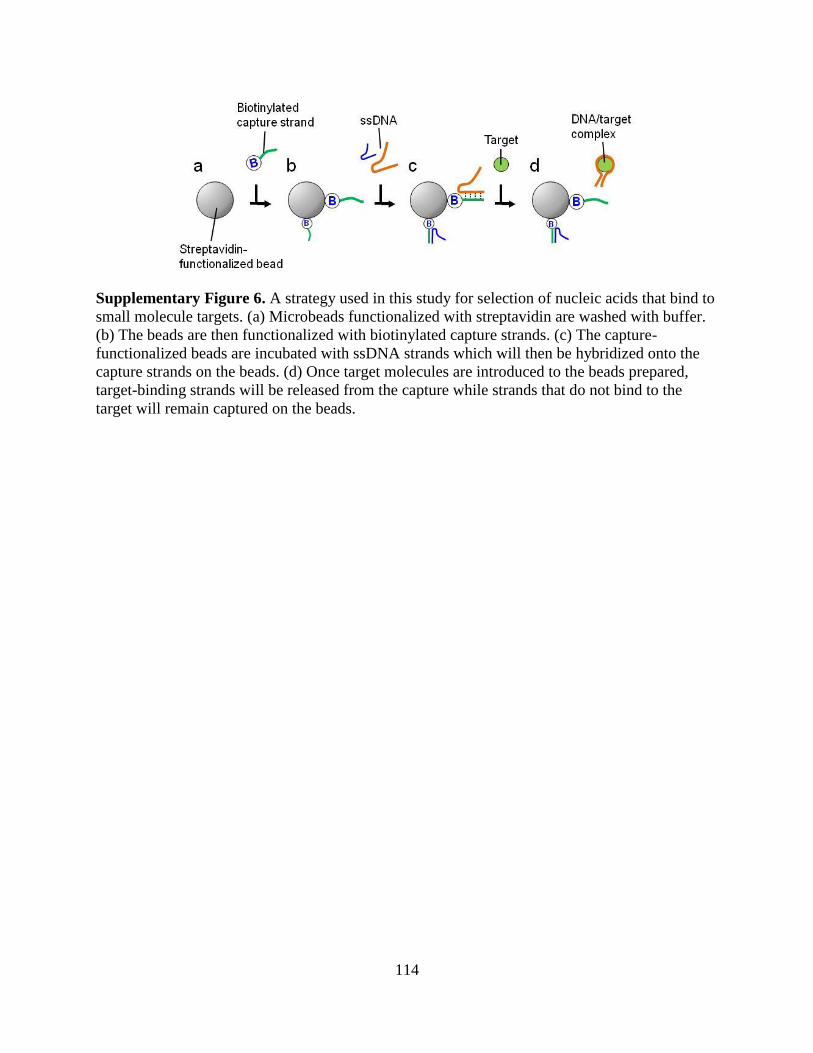
114
Supplementary Figure 6. A strategy used in this study for selection of nucleic acids that bind to
small molecule targets. (a) Microbeads functionalized with streptavidin are washed with buffer.
(b) The beads are then functionalized with biotinylated capture strands. (c) The capture-
functionalized beads are incubated with ssDNA strands which will then be hybridized onto the
capture strands on the beads. (d) Once target molecules are introduced to the beads prepared,
target-binding strands will be released from the capture while strands that do not bind to the
target will remain captured on the beads.
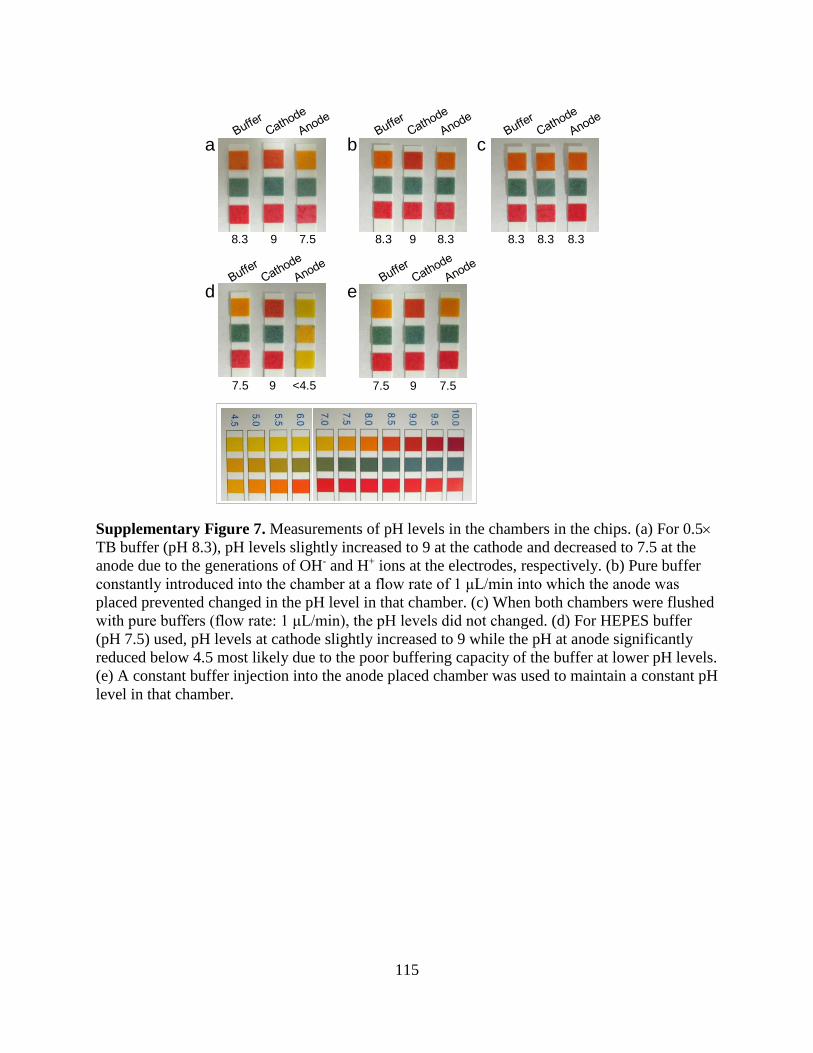
115
8.3 9 8.38.3 9 7.5
a b
8.3 8.3 8.3
7.5 9 <4.5 7.5 9 7.5
c
d e
Supplementary Figure 7. Measurements of pH levels in the chambers in the chips. (a) For 0.5
TB buffer (pH 8.3), pH levels slightly increased to 9 at the cathode and decreased to 7.5 at the
anode due to the generations of OH- and H+ ions at the electrodes, respectively. (b) Pure buffer
constantly introduced into the chamber at a flow rate of 1 μL/min into which the anode was
placed prevented changed in the pH level in that chamber. (c) When both chambers were flushed
with pure buffers (flow rate: 1 μL/min), the pH levels did not changed. (d) For HEPES buffer
(pH 7.5) used, pH levels at cathode slightly increased to 9 while the pH at anode significantly
reduced below 4.5 most likely due to the poor buffering capacity of the buffer at lower pH levels.
(e) A constant buffer injection into the anode placed chamber was used to maintain a constant pH
level in that chamber.
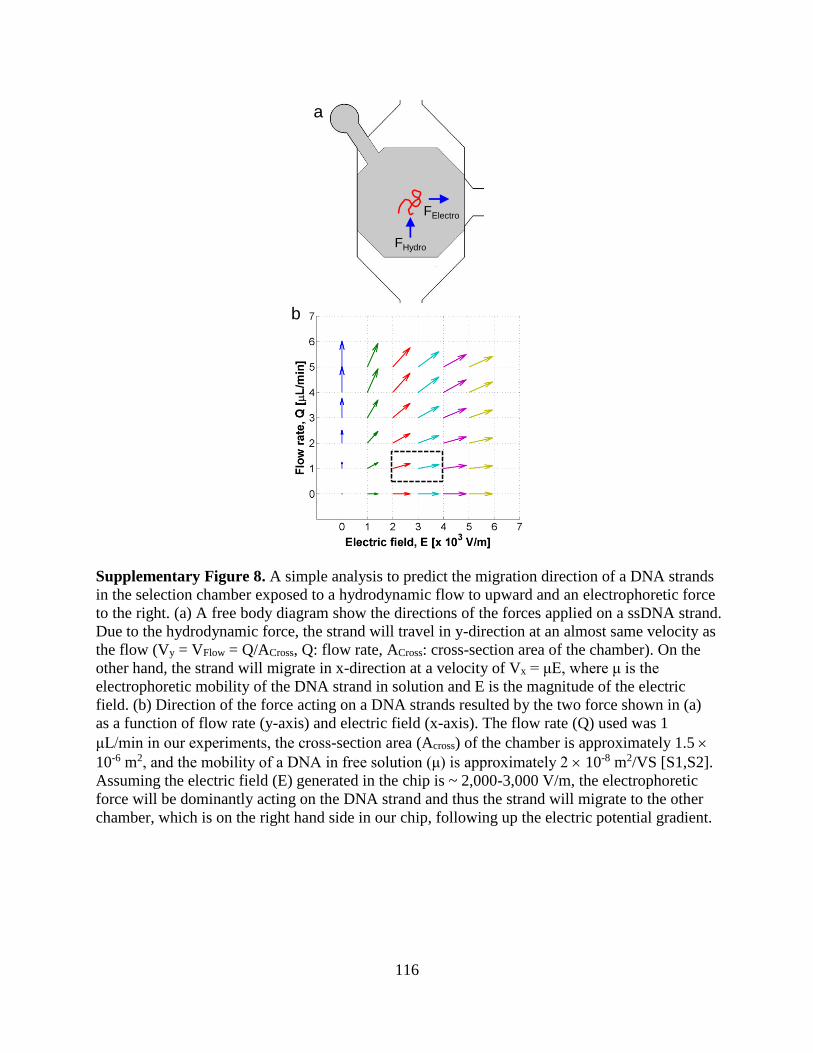
116
FElectro
FHydro
a
b
Supplementary Figure 8. A simple analysis to predict the migration direction of a DNA strands
in the selection chamber exposed to a hydrodynamic flow to upward and an electrophoretic force
to the right. (a) A free body diagram show the directions of the forces applied on a ssDNA strand.
Due to the hydrodynamic force, the strand will travel in y-direction at an almost same velocity as
the flow (Vy = VFlow = Q/ACross, Q: flow rate, ACross: cross-section area of the chamber). On the
other hand, the strand will migrate in x-direction at a velocity of Vx = μE, where μ is the
electrophoretic mobility of the DNA strand in solution and E is the magnitude of the electric
field. (b) Direction of the force acting on a DNA strands resulted by the two force shown in (a)
as a function of flow rate (y-axis) and electric field (x-axis). The flow rate (Q) used was 1
μL/min in our experiments, the cross-section area (Across) of the chamber is approximately 1.5
10-6 m2, and the mobility of a DNA in free solution (μ) is approximately 2 10-8 m2/VS [S1,S2].
Assuming the electric field (E) generated in the chip is ~ 2,000-3,000 V/m, the electrophoretic
force will be dominantly acting on the DNA strand and thus the strand will migrate to the other
chamber, which is on the right hand side in our chip, following up the electric potential gradient.
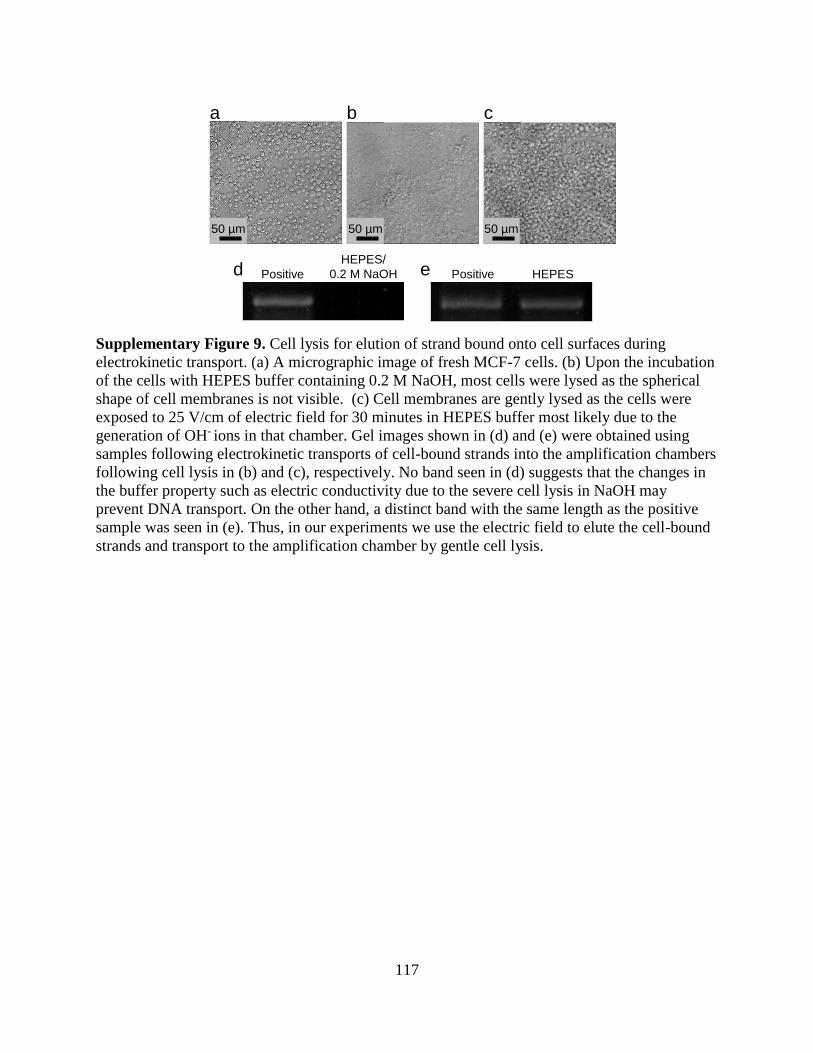
117
Positive Positive
HEPES/
0.2 M NaOH HEPES
50 µm
a
50 µm 50 µm
b c
d e
Supplementary Figure 9. Cell lysis for elution of strand bound onto cell surfaces during
electrokinetic transport. (a) A micrographic image of fresh MCF-7 cells. (b) Upon the incubation
of the cells with HEPES buffer containing 0.2 M NaOH, most cells were lysed as the spherical
shape of cell membranes is not visible. (c) Cell membranes are gently lysed as the cells were
exposed to 25 V/cm of electric field for 30 minutes in HEPES buffer most likely due to the
generation of OH- ions in that chamber. Gel images shown in (d) and (e) were obtained using
samples following electrokinetic transports of cell-bound strands into the amplification chambers
following cell lysis in (b) and (c), respectively. No band seen in (d) suggests that the changes in
the buffer property such as electric conductivity due to the severe cell lysis in NaOH may
prevent DNA transport. On the other hand, a distinct band with the same length as the positive
sample was seen in (e). Thus, in our experiments we use the electric field to elute the cell-bound
strands and transport to the amplification chamber by gentle cell lysis.
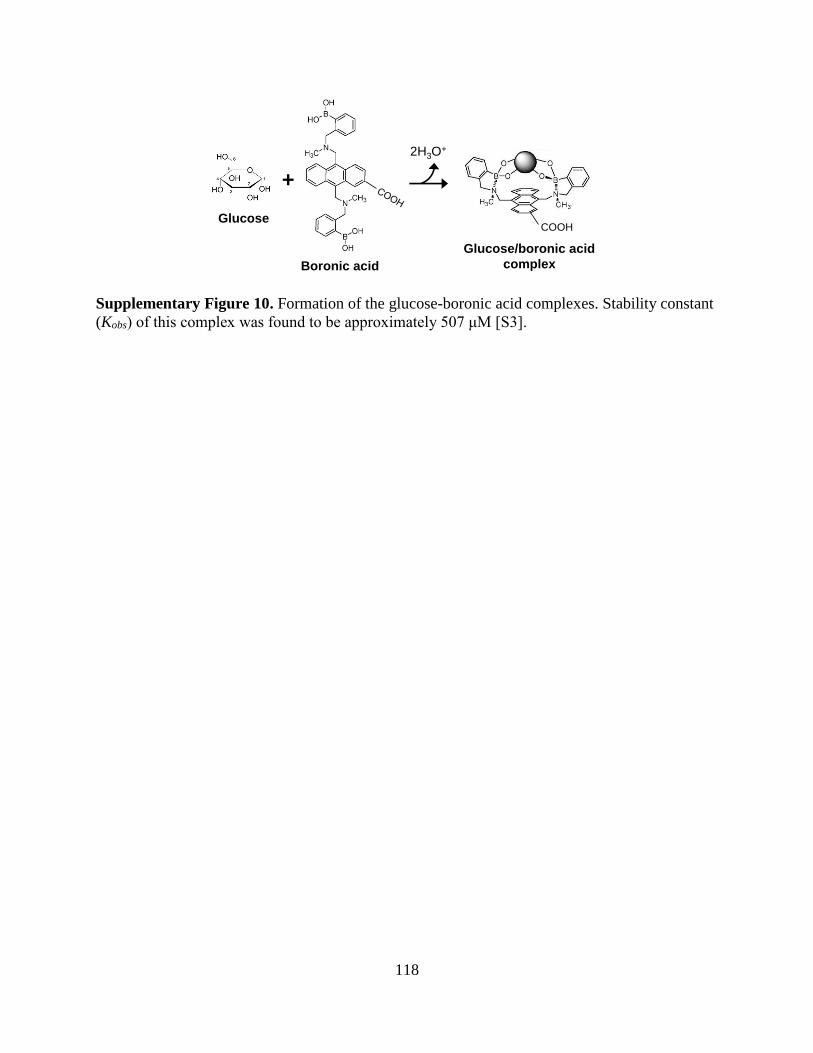
118
Glucose
Boronic acid
2H3O+
COOH
Glucose/boronic acid
complex
+
Supplementary Figure 10. Formation of the glucose-boronic acid complexes. Stability constant
(Kobs) of this complex was found to be approximately 507 μM [S3].
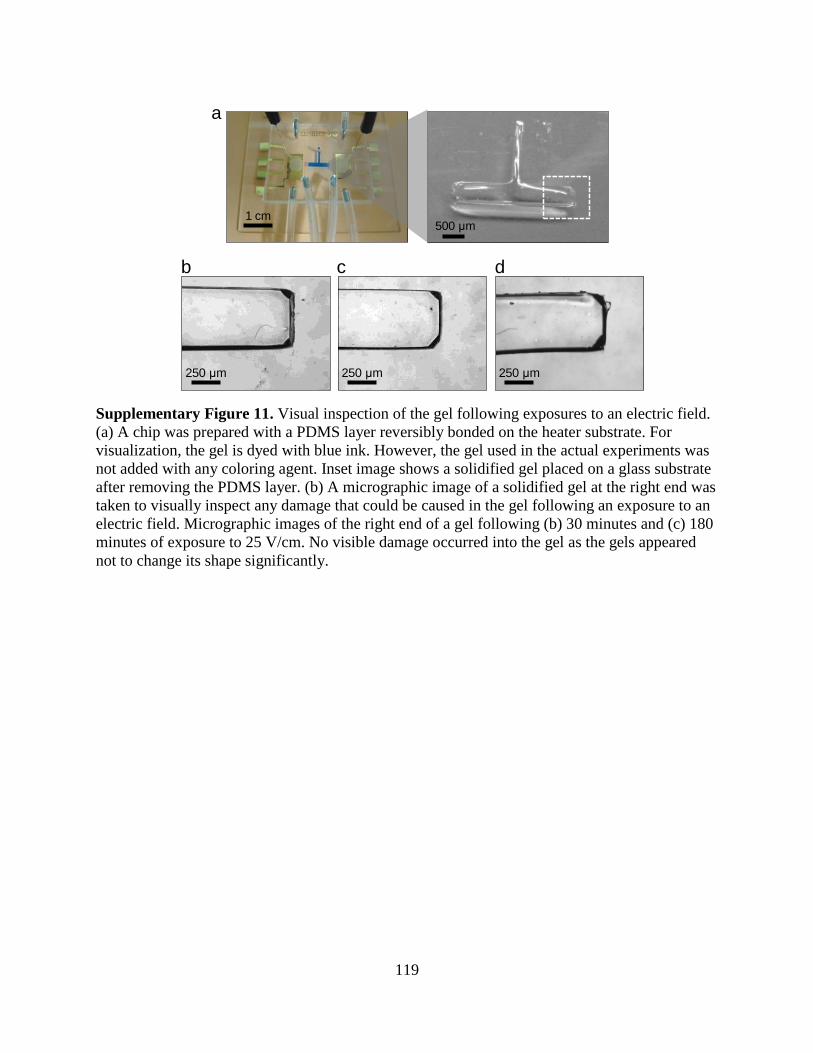
119
0 min 180 min
1 cm500 μm
250 μm
30 min
250 μm 250 μm
a
b c d
250 μm 250 μm 250 μm
b c d
Supplementary Figure 11. Visual inspection of the gel following exposures to an electric field.
(a) A chip was prepared with a PDMS layer reversibly bonded on the heater substrate. For
visualization, the gel is dyed with blue ink. However, the gel used in the actual experiments was
not added with any coloring agent. Inset image shows a solidified gel placed on a glass substrate
after removing the PDMS layer. (b) A micrographic image of a solidified gel at the right end was
taken to visually inspect any damage that could be caused in the gel following an exposure to an
electric field. Micrographic images of the right end of a gel following (b) 30 minutes and (c) 180
minutes of exposure to 25 V/cm. No visible damage occurred into the gel as the gels appeared
not to change its shape significantly.
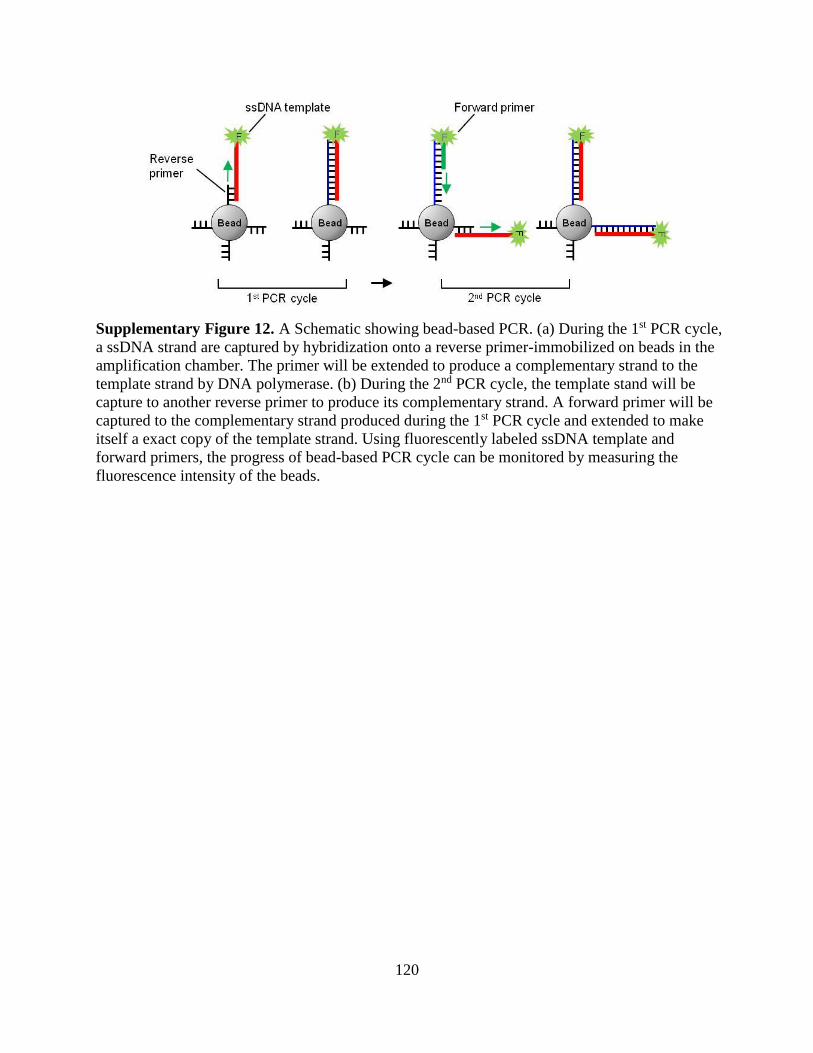
120
Supplementary Figure 12. A Schematic showing bead-based PCR. (a) During the 1st PCR cycle,
a ssDNA strand are captured by hybridization onto a reverse primer-immobilized on beads in the
amplification chamber. The primer will be extended to produce a complementary strand to the
template strand by DNA polymerase. (b) During the 2nd PCR cycle, the template stand will be
capture to another reverse primer to produce its complementary strand. A forward primer will be
captured to the complementary strand produced during the 1st PCR cycle and extended to make
itself a exact copy of the template strand. Using fluorescently labeled ssDNA template and
forward primers, the progress of bead-based PCR cycle can be monitored by measuring the
fluorescence intensity of the beads.
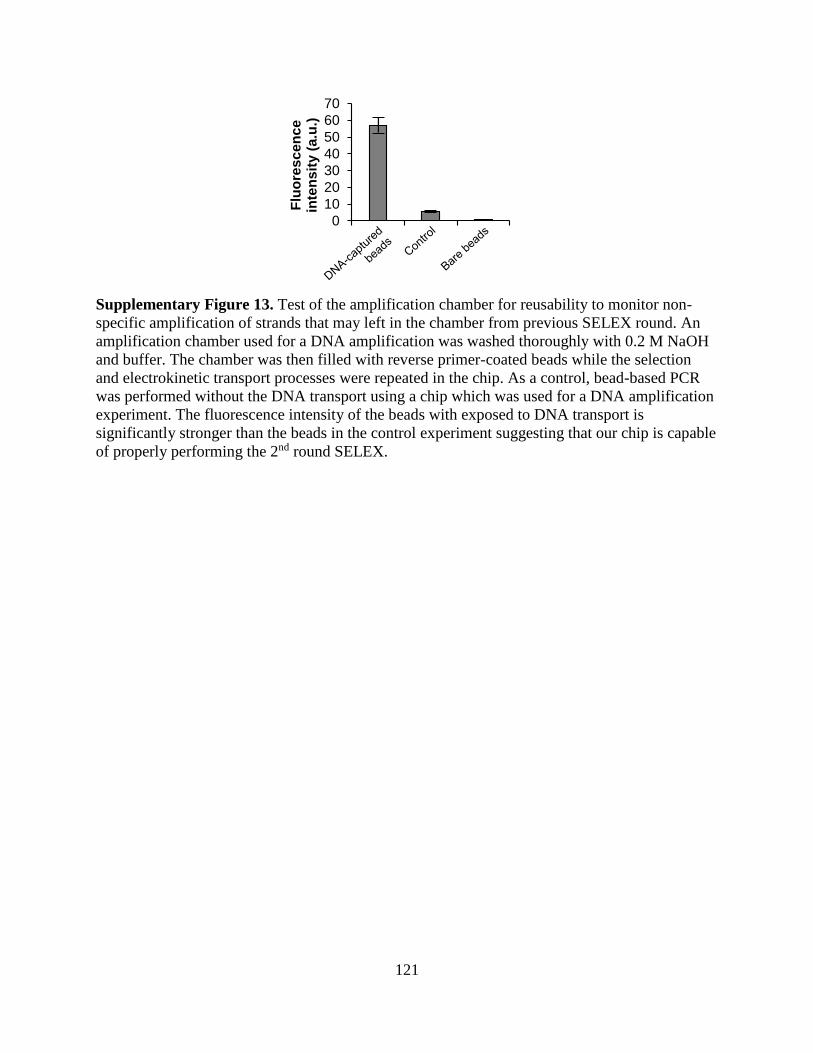
121
0
10
20
30
40
50
60
70
DNA-capturedbeads
Controlbare beads
Flu
ore
sc
en
ce
in
ten
sit
y (
a.u
.)
Supplementary Figure 13. Test of the amplification chamber for reusability to monitor non-
specific amplification of strands that may left in the chamber from previous SELEX round. An
amplification chamber used for a DNA amplification was washed thoroughly with 0.2 M NaOH
and buffer. The chamber was then filled with reverse primer-coated beads while the selection
and electrokinetic transport processes were repeated in the chip. As a control, bead-based PCR
was performed without the DNA transport using a chip which was used for a DNA amplification
experiment. The fluorescence intensity of the beads with exposed to DNA transport is
significantly stronger than the beads in the control experiment suggesting that our chip is capable
of properly performing the 2nd round SELEX.
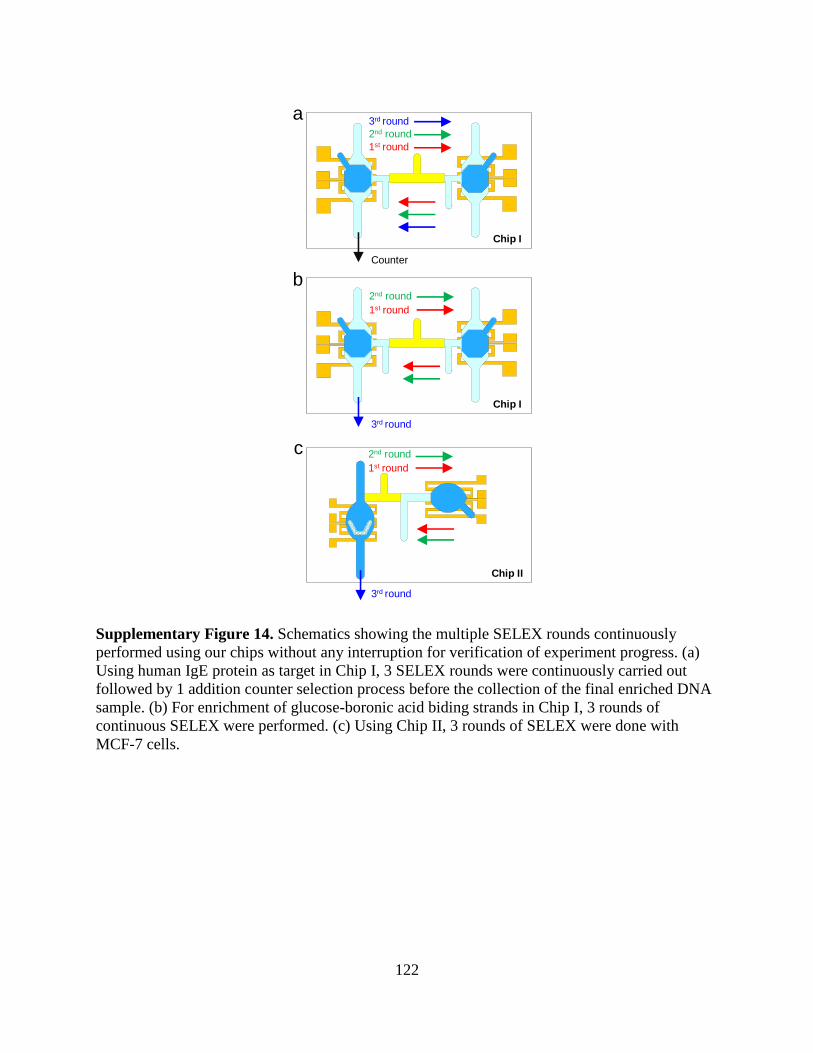
122
1st round
3rd round
2nd round
1st round
3rd round
2nd round
1st round
3rd round
2nd round
Counter
Chip I
Chip I
Chip II
b
a
c
Supplementary Figure 14. Schematics showing the multiple SELEX rounds continuously
performed using our chips without any interruption for verification of experiment progress. (a)
Using human IgE protein as target in Chip I, 3 SELEX rounds were continuously carried out
followed by 1 addition counter selection process before the collection of the final enriched DNA
sample. (b) For enrichment of glucose-boronic acid biding strands in Chip I, 3 rounds of
continuous SELEX were performed. (c) Using Chip II, 3 rounds of SELEX were done with
MCF-7 cells.
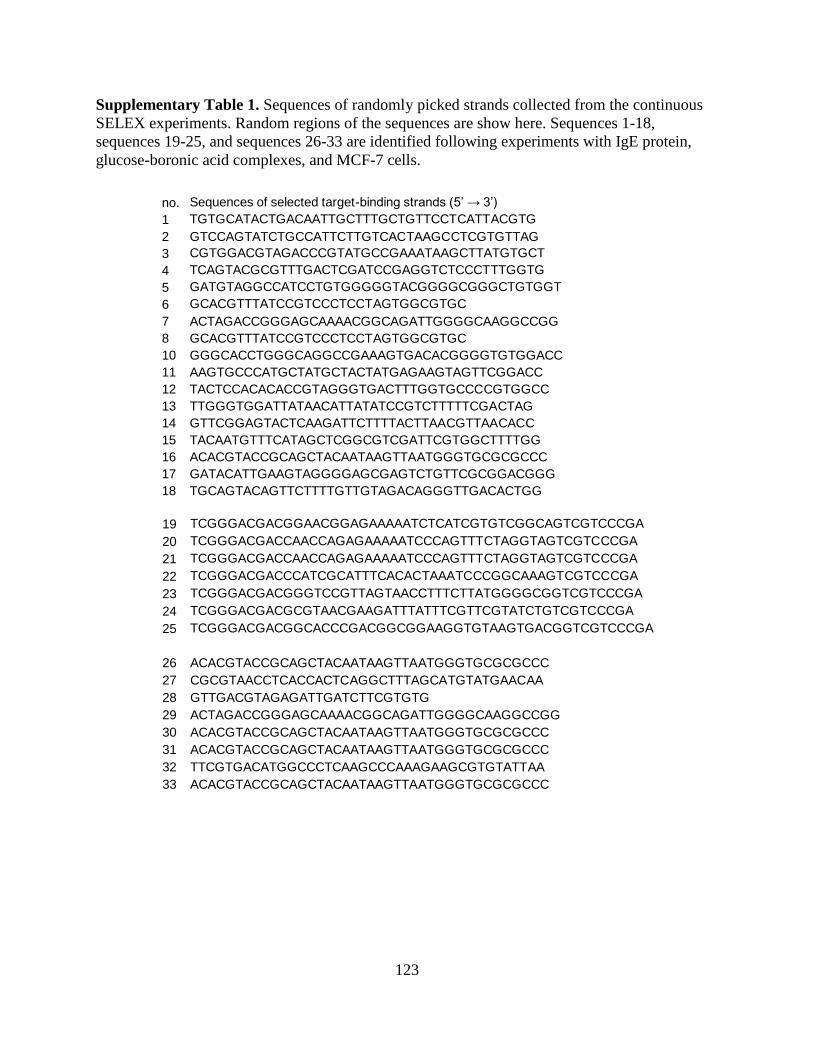
123
Supplementary Table 1. Sequences of randomly picked strands collected from the continuous
SELEX experiments. Random regions of the sequences are show here. Sequences 1-18,
sequences 19-25, and sequences 26-33 are identified following experiments with IgE protein,
glucose-boronic acid complexes, and MCF-7 cells.
no. Sequences of selected target-binding strands (5’ → 3’)
1 TGTGCATACTGACAATTGCTTTGCTGTTCCTCATTACGTG
2 GTCCAGTATCTGCCATTCTTGTCACTAAGCCTCGTGTTAG
3 CGTGGACGTAGACCCGTATGCCGAAATAAGCTTATGTGCT
4 TCAGTACGCGTTTGACTCGATCCGAGGTCTCCCTTTGGTG
5 GATGTAGGCCATCCTGTGGGGGTACGGGGCGGGCTGTGGT
6 GCACGTTTATCCGTCCCTCCTAGTGGCGTGC
7 ACTAGACCGGGAGCAAAACGGCAGATTGGGGCAAGGCCGG
8 GCACGTTTATCCGTCCCTCCTAGTGGCGTGC
10 GGGCACCTGGGCAGGCCGAAAGTGACACGGGGTGTGGACC
11 AAGTGCCCATGCTATGCTACTATGAGAAGTAGTTCGGACC
12 TACTCCACACACCGTAGGGTGACTTTGGTGCCCCGTGGCC
13 TTGGGTGGATTATAACATTATATCCGTCTTTTTCGACTAG
14 GTTCGGAGTACTCAAGATTCTTTTACTTAACGTTAACACC
15 TACAATGTTTCATAGCTCGGCGTCGATTCGTGGCTTTTGG
16 ACACGTACCGCAGCTACAATAAGTTAATGGGTGCGCGCCC
17 GATACATTGAAGTAGGGGAGCGAGTCTGTTCGCGGACGGG
18 TGCAGTACAGTTCTTTTGTTGTAGACAGGGTTGACACTGG
26 ACACGTACCGCAGCTACAATAAGTTAATGGGTGCGCGCCC
27 CGCGTAACCTCACCACTCAGGCTTTAGCATGTATGAACAA
28 GTTGACGTAGAGATTGATCTTCGTGTG
29 ACTAGACCGGGAGCAAAACGGCAGATTGGGGCAAGGCCGG
30 ACACGTACCGCAGCTACAATAAGTTAATGGGTGCGCGCCC
31 ACACGTACCGCAGCTACAATAAGTTAATGGGTGCGCGCCC
32 TTCGTGACATGGCCCTCAAGCCCAAAGAAGCGTGTATTAA
33 ACACGTACCGCAGCTACAATAAGTTAATGGGTGCGCGCCC
19 TCGGGACGACGGAACGGAGAAAAATCTCATCGTGTCGGCAGTCGTCCCGA
20 TCGGGACGACCAACCAGAGAAAAATCCCAGTTTCTAGGTAGTCGTCCCGA
21 TCGGGACGACCAACCAGAGAAAAATCCCAGTTTCTAGGTAGTCGTCCCGA
22 TCGGGACGACCCATCGCATTTCACACTAAATCCCGGCAAAGTCGTCCCGA
23 TCGGGACGACGGGTCCGTTAGTAACCTTTCTTATGGGGCGGTCGTCCCGA
24 TCGGGACGACGCGTAACGAAGATTTATTTCGTTCGTATCTGTCGTCCCGA
25 TCGGGACGACGGCACCCGACGGCGGAAGGTGTAAGTGACGGTCGTCCCGA
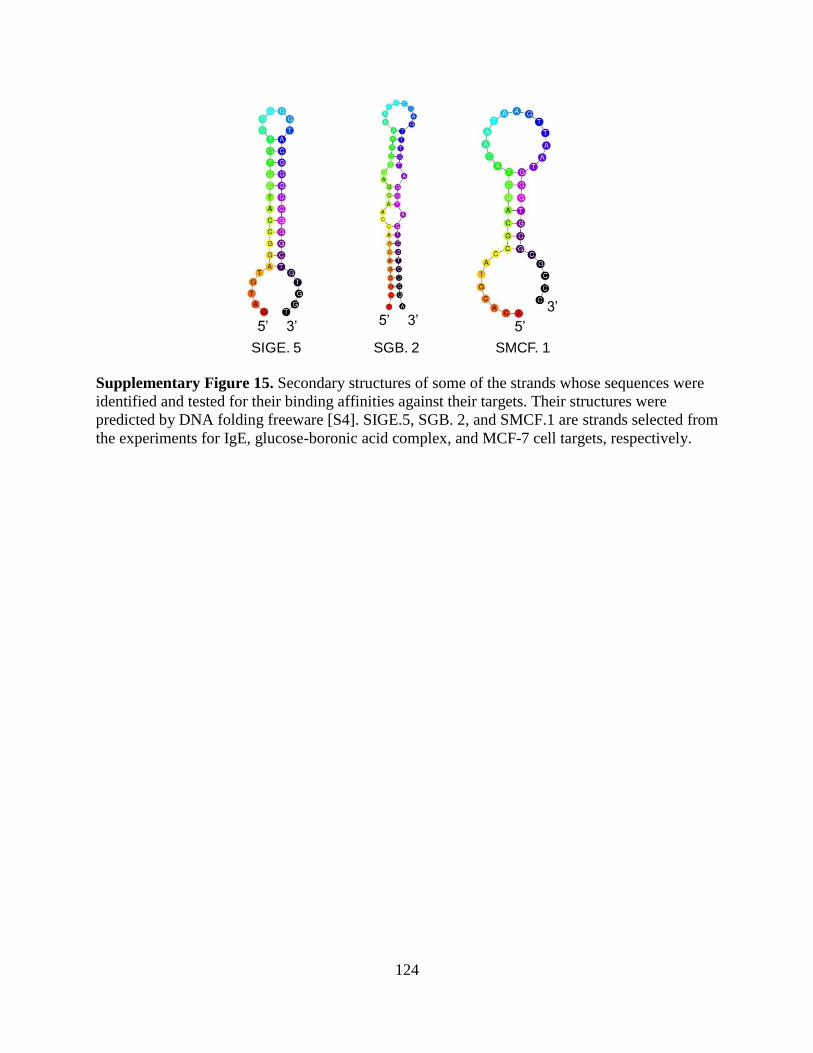
124
SIGE. 5 SGB. 2 SMCF. 1
5’ 3’ 5’ 3’ 5’
3’
Supplementary Figure 15. Secondary structures of some of the strands whose sequences were
identified and tested for their binding affinities against their targets. Their structures were
predicted by DNA folding freeware [S4]. SIGE.5, SGB. 2, and SMCF.1 are strands selected from
the experiments for IgE, glucose-boronic acid complex, and MCF-7 cell targets, respectively.
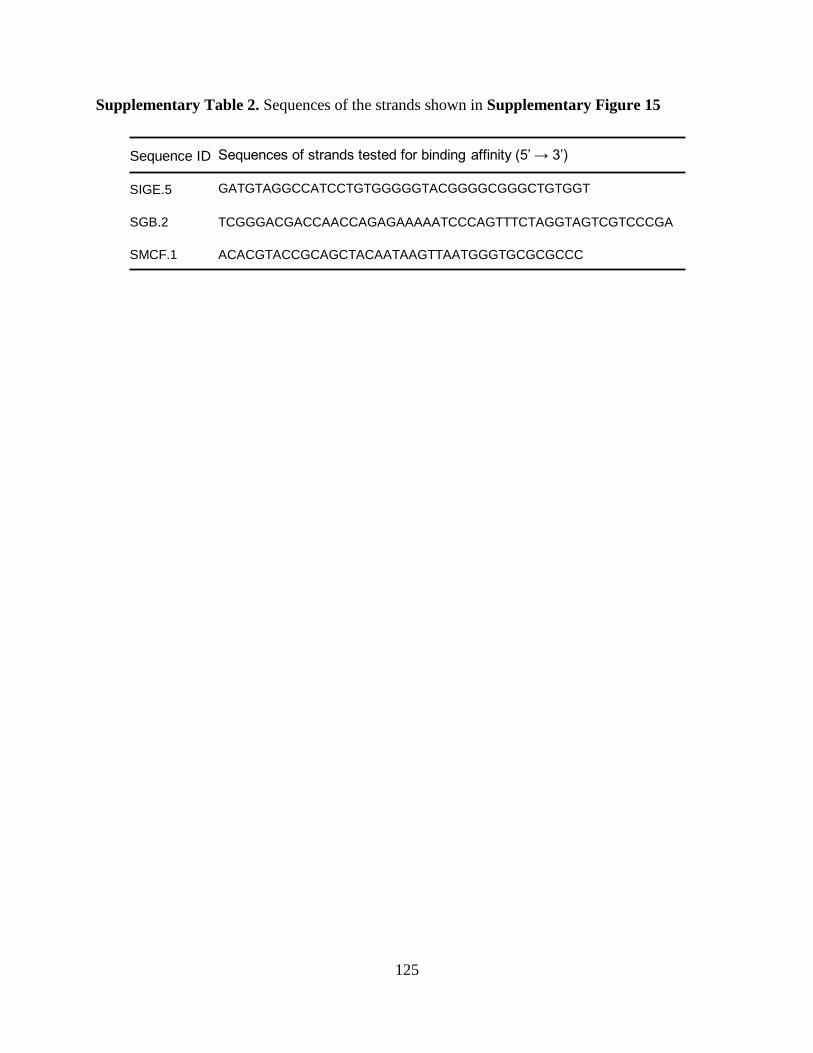
125
Supplementary Table 2. Sequences of the strands shown in Supplementary Figure 15
Sequence ID Sequences of strands tested for binding affinity (5’ → 3’)
SIGE.5 GATGTAGGCCATCCTGTGGGGGTACGGGGCGGGCTGTGGT
SGB.2 TCGGGACGACCAACCAGAGAAAAATCCCAGTTTCTAGGTAGTCGTCCCGA
SMCF.1 ACACGTACCGCAGCTACAATAAGTTAATGGGTGCGCGCCC
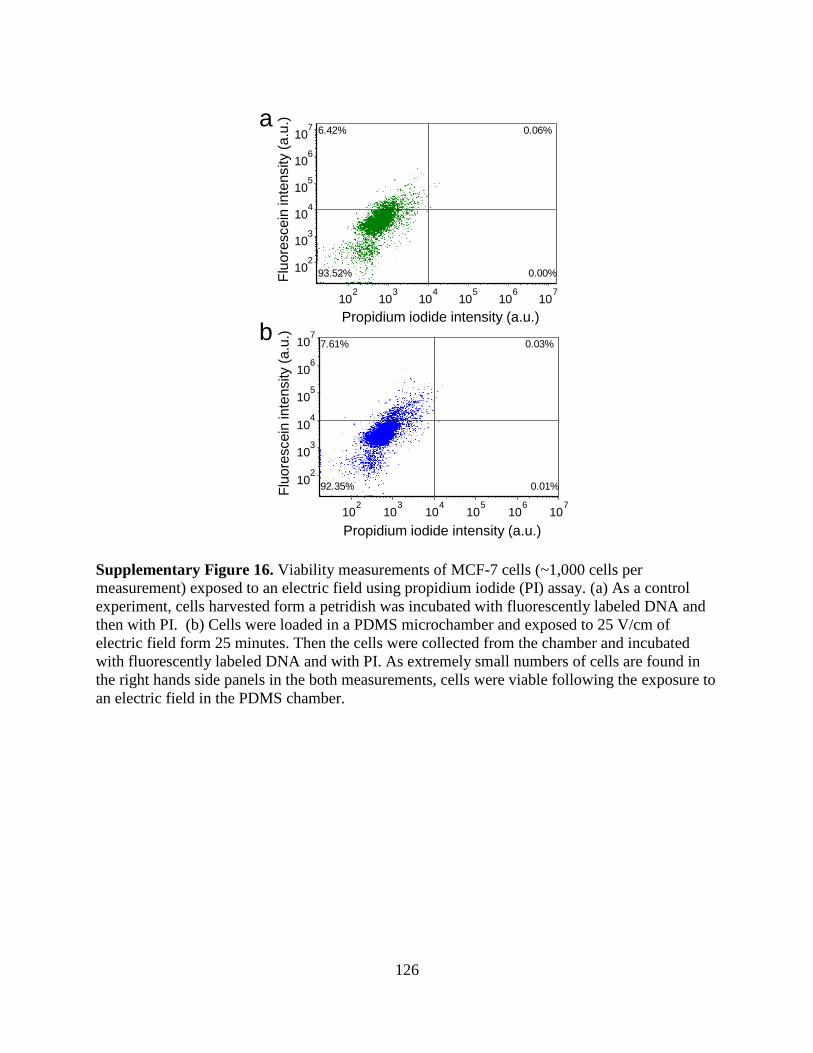
126
FL4-H
FL
1-H
102
103
104
105
106
107
102
103
104
105
106
107
0.00%93.52%
0.06%6.42%
Propidium iodide intensity (a.u.)
Flu
ore
scein
inte
nsity (
a.u
.)
FL4-H
FL
1-H
102
103
104
105
106
107
102
103
104
105
106
107
7.61% 0.03%
92.35% 0.01%
Propidium iodide intensity (a.u.)
Flu
ore
scein
inte
nsity (
a.u
.)
a
b
Supplementary Figure 16. Viability measurements of MCF-7 cells (~1,000 cells per
measurement) exposed to an electric field using propidium iodide (PI) assay. (a) As a control
experiment, cells harvested form a petridish was incubated with fluorescently labeled DNA and
then with PI. (b) Cells were loaded in a PDMS microchamber and exposed to 25 V/cm of
electric field form 25 minutes. Then the cells were collected from the chamber and incubated
with fluorescently labeled DNA and with PI. As extremely small numbers of cells are found in
the right hands side panels in the both measurements, cells were viable following the exposure to
an electric field in the PDMS chamber.
127
Supplementary References
[S1] C. Heller, "Separation of double‐stranded and single‐stranded DNA in polymer solutions: I.
Mobility and separation mechanism," Electrophoresis, vol. 20, pp. 1962-1976, 1999.
[S2] J. Rousseau, G. Drouin, and G.W. Slater, "Gel electrophoretic mobility of single‐stranded
DNA: The two reptation field‐dependent factors," Electrophoresis, vol. 21, pp. 1464-1470,
2000.
[S3] T. D. James, K. S. Sandanayake, R. Iguchi, and S. Shinkai, "Novel saccharide-photoinduced
electron transfer sensors based on the interaction of boronic acid and amine," Journal of the
American Chemical Society, vol. 117, pp. 8982-8987, 1995.
[S4] M. Zuker, "Mfold web server for nucleic acid folding and hybridization prediction," Nucleic
Acids Research, vol. 31, pp. 3406-3415, 2003.