a mixed methods examination of distracted …...a mixed methods examination of distracted driving in...
TRANSCRIPT
A MIXED METHODS EXAMINATION OF DISTRACTED DRIVING IN
COMMERCIAL TRUCK DRIVERS
by David I. Swedler
A dissertation submitted to Johns Hopkins University in conformity with the requirements for the degree of Doctor of Philosophy
Baltimore, Maryland August 2013

ii
Abstract
Distracted driving, a hazard that is increasingly common in the United States
(U.S.), creates a risk for occupational injury and death for truck drivers. The overall goal
of this dissertation was to understand the burden of distraction-involved truck fatalities in
the U.S. and gain insight into workplace and personal factors that would affect distracted
driving in this occupational population. First, after describing the rates of truck crashes
by state, I used a longitudinal analysis of fatality rates in crashes involving distracted
truck drivers and whether or not state and federal distracted driving bans affected these
rates. Second, I undertook a mixed methods study using surveys of drivers and interviews
with experts on distracted driving and truck driving safety.
Research findings are presented in three manuscripts: Effects of State on Fatalities
Involving Distracted Truck Drivers; The Effects of Safety Climate on Distracted Driving
in Commercial Truck Drivers; and Understanding Commercial Truck Drivers’ Decision-
Making Process Concerning Distracted Driving. First, I examined the rates of distraction-
involved truck fatalities in the U.S. over an 11-year period and found that while state
texting and handheld cell phone use bans were not associated with decreases in fatality
rates, fatality rates to truck drivers and all vehicle occupants had been decreasing since
2007. The second manuscript explored the relationship of organizational safety climate,
using an established questionnaire and key informant interviews, and found that
management commitment to safety and communications and procedures were important
for keeping drivers safe from the hazard of distracted driving. The third manuscript
explored how the constructs of the Theory of Planned Behavior (TPB) affected truck

iii
drivers’ decision-making concerning communication on the job. Key informants
described how the different aspects of the TPB could influence drivers’ decision making;
in regression analysis for both texting and dispatch device use, the TPB constructs of
intentions, norms, and perceived behavioral control were correlated with distraction-
involved near-crashes on the job.
Results from this dissertation revealed that while distraction-involved truck crash
rates are decreasing, there is wide variation between states. Furthermore, truck drivers’
supervisors play an important role in creating an organizational climate where drivers do
not feel pressured to undertaking distracting tasks while driving. These results should
impact organizational policies and enforcement of these policies to prevent distracted
driving. States, worker representatives, industry groups, and academic researchers will
influence future enactment of governmental and organizational policies concerning
distracted driving in truck drivers.
Advisor: Keshia M. Pollack, PhD, MPH
Readers: Andrea C. Gielen, ScD; Jacqueline Agnew, PhD, MPH; Susan P. Baker, ScD
(Hon), MPH
Alternates: Jon Vernick, JD, MPH; Roger D. Peng, PhD, MS

iv
Acknowledgements
Mr. Swedler’s graduate training was supported by the Occupational Injury
Epidemiology and Policy fellowship from the National Institute for Occupational Safety
and Health. Some funding for this dissertation research was provided by an ERC Pilot
Project Training Award through the Environmental Research Center for Occupational
Safety and Health, Department of Environmental Health Sciences, Johns Hopkins
Bloomberg School of Public Health (Grant # T42OH008428).
Thanks to Dr. Gordon Smith of the University of Maryland and Mr. Eric Roberts
from the Johns Hopkins Bloomberg School of Public Health (BSPH) for comments on
analyses in Manuscript 1. Drs. Joe Gallo and Sue Yeon Lee of the BSPH Mixed Methods
Interest Group provided input on mixed methods techniques used in Manuscripts 2 and 3.
Mr. Nasir Mohd Ismail of BSPH served as the second coder for qualitative analysis. Dr.
Shannon Frattaroli and Ms. Molly Simmons provided insight into qualitative data
analysis techniques. Mr. Lamont Byrd, head of Occupational Safety and Health for the
International Brotherhood of Teamsters, was instrumental in the execution of the online
survey of Teamsters members. Mr. Buddy Rosbon or Teamsters Local 639 pilot tested
the survey and provided other advice on data collection. Ms. Karen Strother, Ms. Edith
Jones, and Ms. Rachel Lemley assisted in project administration.
My thesis advisory committee of Drs. Keshia Pollack, Andrea Gielen, and
Jacqueline Agnew of BSPH provided advice and assistance during each step of the
research process.

v
Table of Contents Page
Abstract ii Acknowledgements vi Table of Contents v List of Tables vi List of Figures viii List of Appendices ix List of Acronyms x
Introduction 1
Methods 20
Manuscript 1 51 Effects of State Policies on Fatalities Involving Distracted Truck Drivers
Manuscript 2 74 The Effects of Safety Climate on Distracted Driving in Commercial Truck Drivers
Manuscript 3 96 Understanding Commercial Truck Drivers’ Decision-Making Process Concerning Distracted Driving
Discussion 128
Conclusion 150
Appendices 152
Bibliography 183 Curriculum Vitae 196

vi
List of Tables Page
1. Odds ratios (ORs) for safety critical events in commercial 5 truck drivers for cell phone use while driving sub-tasks. Adapted from Olson �����. 2009, Table 3 (p xxi).
2. Codes for the Body Type variable from FARS used to select 23 for crashes involving trucks.
3. Values of FARS variables indicating a distracted driver, 2000 24 through 2010.
4. Distribution of and sources of each variable used in the model. 28
5. Pattern matrix for three factors for the SCQ. Chronbach’s alpha 45 for reliability of each factor is listed.
6. Values of FARS variables indicating a distracted driver, 2000 57 through 2010.
7. Distribution of and sources of each variable used in the model. 58
8. Descriptive Data on Fatality Counts and Rates (per Billion 63 VMT) for Truck Drivers and All Vehicle Occupants in Distraction-Related Truck Crashes (Min-Max= Minimum – Maximum; SD = Standard Deviation; IQR = Interquartile Range)
9. Lowest and Highest State Fatality Counts and Rates (per Billion 63 VMT) for All Vehicle Occupants in Crashes Involving Distracted Truck Drivers, 2000 – 2010.
10. Results of Univariate Multi-level Poisson Regression on 66 Fatality Rates. IRRs in Bold are Significant at �<0.10.
11. Multivariate Multi-level Poisson Regression on Truck Driver 67 Fatality Rate in Crashes Involving Distracted Truck Drivers.
12. Multivariate Multi-level Poisson Regression on Fatality Rate 67 for All Vehicle Occupants in Crashes Involving Distracted Truck Drivers.
13. Pattern matrix for three factors for the SCQ. Chronbach’s 83 alpha for reliability of each factor is listed.
14. Descriptive data on 239 subjects who completed the survey. 85

vii
15. Univariate regression for demographic factors and three 86 safety climate factors on negative driving outcomes in the workplace. The odds ratios (ORs) are presented with odds of the negative outcome versus no outcome. OR for Gender are for women’s odds over men’s odds. There were too few subjects who did not list a gender to calculate ORs. ORs in bold were entered into multivariate regressions.
16. Results of multivariate analyses on negative driving outcomes. 87
17. Descriptive data on the respondents to the components of the 113 TPB questions for texting while driving and reading the dispatch device while driving.
18. Descriptive data on binary TPB variables for the texting 113 population (n=277).
19. Descriptive data on binary TPB variables for the dispatch 115 device population (n=153).
20. Reported crashes and near crashes for subjects completing 116 the texting and dispatch device sections. Percent of responses are in parentheses.
21. Univariate regression of demographic factors and the TPB 117 components on crash or near crash for texting while driving or reading the dispatch device. Odds ratios (ORs) are expressed with subjects who never experienced a given event as the baseline. Bold ORs are significant at p≤0.10 and were entered into multivariate regression.
22. Univariate regression of demographic factors and the TPB 119 components on crash or near crash for dispatch device use while driving or reading the dispatch device. Odds ratios (ORs) are expressed with subjects who never experienced a given event as the baseline. The values for categorical Norms and Attitudes variables are listed for each level. Bold ORs are significant at p≤0.10 and were entered into multivariate regression.
viii
List of Figures Page
1. The Theory of Planned Behavior from Parker et al. 1992. 12
2. Image sent out by the CDC’ via Twitter on March 22, 2013 19 (https://twitter.com/CDCInjury/status/315130180316323841/ photo/1)
3. Screenshot of the survey announcement on the Teamster’s 41 website (http://www.teamster.org/content/safety-study-all- commercial-drivers accessed 4 April 2013)
4. Diagram of the analysis of qualitative key informant 46 interviews (Qual) and quantitative analysis of surveys (Quan). This visualization is based off Plano-Clark’s and Creswell’s interpretation (p. 380) of Luzzo’s mixed methods analysis.
5. Yearly fatality rates for commercial truck drivers in DD- 64 related truck crashes. Dashed-line is mean rate across the study period (0.321 per BVMT).
6. Yearly fatality rates for all vehicle occupants in DD-related 64 truck crashes. Dashed-line is mean rate across the study period (1.101 per BVMT).
7. Scree plot with parallel analysis for safety climate questionnaire 84 principal component analysis. The parallel analysis crosses the scree plot after three factors.
8. Conceptual model of the Theory of Planned Behavior (from 99 Parker et al. Accident Analysis and Prevention, 1992)
9. Visual diagram of the analysis of qualitative key informant 100 interviews (Qual) and quantitative analysis of surveys (Quan). This visualization is based off Plano-Clark’s and Creswell’s interpretation (p. 380) of Luzzo’s mixed methods analysis.
10. Histogram of the Intentions to use the dispatch device while 114 driving. 1 = Definitely will use; 4 = Neutral; 7 = Definitely will not use.
ix
List of Appendices Page
Appendix 1. Secondary and tertiary distractions undertaken 152 by commercial truck drivers in the VTTI Study. Odds ratios and lower confidence limit (LCL) and upper confidence limit (UCL) are for safety critical events (Olson �����, Table 3, p xxi).
Appendix 2. Approved key informant interview script used 153 in phase 1 of mixed method data collection.
Appendix 3. Online survey administered to IBT drivers. 155
Appendix 4. Codebook from key informant interviews. 171
Appendix 5. Results of the online survey. This Appendix 172 describes how I arrived at the populations for both the TPB and safety climate analyses. Answers to individual SCQ and TPB questions are also presented.
Appendix 6. Distribution of scores for the dispatch device use 178 TPB constructs in Manuscript 3. Histograms generated using Stata v12.1.

x
Abbreviations
ATA- American Trucking Association
BLS- Bureau of Labor Statistics
CDC- Centers for Disease Control and Prevention
CPWD- Cell phone use while driving
DD- Distracted driving
DOT- Department of Transportation
FARS- Fatality Analysis Reporting System
FCC- Federal Communications Commission
FHWA- Federal Highway Administration
FMCSA- Federal Motor Carrier Safety Administration
GES- General Estimating System
GHSA- Governors Highway Safety Association
GPS- Global Positioning System
GVWR- Gross vehicle weight rating
IBT- International Brotherhood of Teamsters
IRB- Internal review board
MVC- Motor vehicle crash
NETS- Network of Employers for Transportation Safety
NHTSA- National Highway Transportation Safety Administration
NIOSH- National Institute for Occupational Safety and Health
OSHA- Occupational Safety and Health Administration
OSHMS- Occupational safety and health management systems
xi
PBC- Perceived behavioral control
SCQ- Safety climate questionnaire
SCQ-MD- Safety climate questionnaire- modified for drivers
TPB- Theory of planned behavior
TRA- Theory of reasoned action
VIF- Variance inflation factor
VMT- Vehicle miles traveled
VTTI- Virginia Tech Transportation Institute

1��
Introduction
Although distractions have always existed for drivers, the recent availability of
mass-marketed electronic communication devices has brought this hazard to the forefront
of motor vehicle safety. For the worker who drives on the job, electronic communication
while driving has become the norm due to both social and occupational pressures.
Commercial truck drivers in the United States (U.S.) face numerous distractions of
varying degrees of danger while trying to safely operate multi-ton vehicles. This thesis
seeks to understand the scope of the problem that distracted driving creates for truck
drivers, how distraction affects driver behavior, how company safety climate affects
distracted driving, and how policies can positively or negatively affect this problem.
This introductory section will first describe distracted driving from its origins to
modern hazards. Second, I will delve into distractions that are unique to commercial
truck drivers. Third, I will describe how workplace safety climate affects safe worker and
driver behavior. Fourth, I will also describe how drivers make decisions on safe driving
behaviors and how this will apply to commercial truck drivers. Finally, I will discuss
what steps have been taken to reduce distracted driving and what effects, if any, these
steps have had.
������� �������
Defining distracted driving first requires a description of all tasks that drivers can
undertake while driving. Ablassmeier and colleagues break down these tasks into three

2��
categories: primary tasks that only control vehicle speed and direction; secondary tasks
that support the primary tasks, such as turning on headlights or checking mirrors; and
tertiary tasks that are any activities the driver undertakes that are unrelated to driving [1].
It is these secondary and tertiary tasks that distract from primary driving. Distraction
from primary driving comes in four forms: 1) visual distractions that take the driver’s
eyes off the forward roadway; 2) auditory distractions that take the driver’s aural
perception from relative driving cues; 3) cognitive distractions take the driver’s mind off
the driving task; and 4) manual distractions take the driver’s hands off the wheel [2]. The
first two forms of distraction delay the driver from receiving necessary information for
the driving task, the third affects the processing of this incoming information, and the
fourth delays the driver from taking corrective action necessitated by the situation [3].
Thus, based on this classification the definition of distracted driving that I will use for
this thesis is, “any secondary or tertiary task that takes the driver’s eyes, hands, or
attention away from the primary task of driving.”
Studies of driver behavior using in-vehicle cameras have found over two dozen
secondary and tertiary tasks as sources of distraction [4-7]. Distractions cover a range of
behaviors, from common activities, such as reading a map or GPS and talking with a
passenger, to less frequently observed activities, like reading the newspaper or shaving.
An emergent threat is activities involving cellular phone use [8]. The term cell phone use
while driving (CPWD) encompasses any task involving a cell phone, including dialing a
phone, talking on the phone, and reading or writing messages [9]. CPWD has been
increasing in recent years due to the proliferation of cellular phones in the United States
3��
and elsewhere [10, 11]. Two of the most dangerous CPWD tasks are dialing the phone
and sending, reading, and writing short message service text messages (a.k.a. texting) [6].
Dialing and texting both involve manual, visual, and cognitive distractions [2]. Both in
the laboratory setting [12, 13] and during actual driving [6], texting has been shown to be
the greatest hazard for crash or near crash. This hazard is magnified by the exponential
growth of text messages sent in the U.S. since 2006: the number of text messages sent in
to U.S. doubled from 2006 to 2007, then doubled again from 2007 to 2008 [14].
Not all drivers are equally likely to drive distracted, nor are they affected equally
by distractions. While teens and drivers in their twenties [15, 16] are more likely to
undertake phone-related distraction while driving, drivers over 65 might take longer to
cognitively process such distractions [17]. A review of risk factors associated with
distracted driving found no evidence that males or females were more affected by cell
phone distraction than the other gender [18]. Drivers who choose to drive distracted are
less likely to see it as a dangerous activity [19], are more likely to undertake aggressive
driving behaviors like speeding and drink driving [20], and cannot accurately gauge their
own level of distraction [21].
Prior studies have examined the effects of distracted driving on the crash risk, yet
the results have varied depending on the definition of distraction under study as well as
what study method was used in a given investigation. As CPWD is the most studied
distraction, I will use it as an example. The first study of CPWD and crash risk by
Redelmeier and Tibshiriani in 1997 used a case-crossover study design and found that
4��
“telephone calls” increased the relative risk of injury crash 4.3 times [22]. One year later,
Violanti used a case-control study of fatal crashes to find that “phone use” increased the
odd ratio (OR) for crashing 9.3 times [23]. Into the 2000s, case-control [15] and case-
crossover [24] studies still produced crash ORs of 2.5 and 4.1, respectively.
Technological advances have allowed for naturalistic driving studies, where researchers
can view drivers in their natural state and more accurately estimate the risks of specific
aspects of CPWD. The trade-off for precision in these studies is a lower number of
drivers that can be analyzed and, consequently, the infrequent crashes and near crash
situations. Klauer and colleagues conducted a study for the National Highway Traffic
Safety Administration (NHTSA) and found that dialing a phone increased crash risk 2.8
times yet talking on a device did not increase crash risk [5].
It is important to note that the above studies generally surveyed the same activity
(“talking on a cell phone”) yet their methods and definitions of the observed behaviors
produced different results. Few studies have the statistical power to accurately measure
crash risk for all subtasks involved in a cell phone conversation [6], such as dialing the
phone, answering the phone, or holding the phone during a conversation. Critical analysis
of distraction definitions and comparing these crash risks between studies should inform
researchers when they are considering which aspects of a given distraction are most
dangerous.
The largest naturalistic driving study to examine distracted driving in commercial
truck drivers and was conducted by the Virginia Tech Transportation Institute (VTTI)
5��
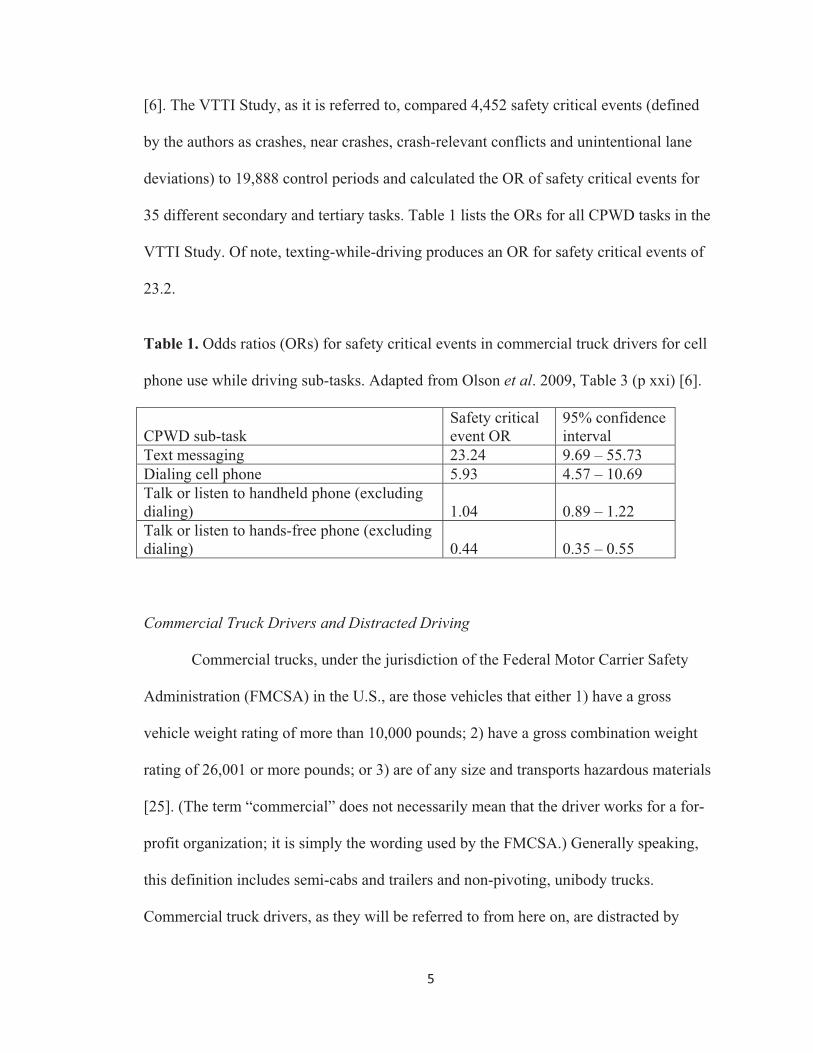
[6]. The VTTI Study, as it is referred to, compared 4,452 safety critical events (defined
by the authors as crashes, near crashes, crash-relevant conflicts and unintentional lane
deviations) to 19,888 control periods and calculated the OR of safety critical events for
35 different secondary and tertiary tasks. Table 1 lists the ORs for all CPWD tasks in the
VTTI Study. Of note, texting-while-driving produces an OR for safety critical events of
23.2.
Table 1. Odds ratios (ORs) for safety critical events in commercial truck drivers for cell
phone use while driving sub-tasks. Adapted from Olson �����. 2009, Table 3 (p xxi) [6].
CPWD sub-task Safety critical event OR
95% confidence interval
Text messaging 23.24 9.69 – 55.73 Dialing cell phone 5.93 4.57 – 10.69 Talk or listen to handheld phone (excluding dialing) 1.04 0.89 – 1.22 Talk or listen to hands-free phone (excluding dialing) 0.44 0.35 – 0.55
������������������������ �������� �������
Commercial trucks, under the jurisdiction of the Federal Motor Carrier Safety
Administration (FMCSA) in the U.S., are those vehicles that either 1) have a gross
vehicle weight rating of more than 10,000 pounds; 2) have a gross combination weight
rating of 26,001 or more pounds; or 3) are of any size and transports hazardous materials
[25]. (The term “commercial” does not necessarily mean that the driver works for a for-
profit organization; it is simply the wording used by the FMCSA.) Generally speaking,
this definition includes semi-cabs and trailers and non-pivoting, unibody trucks.
Commercial truck drivers, as they will be referred to from here on, are distracted by

6��
CPWD, texting, adjusting the radio, eating and all the other hazards faced by non-
commercial drivers [4]. There are additional occupational distractions that commercial
truck drivers face not found in personal vehicle operation, such as interacting with a
dispatch computer and using a CB radio [6]. Appendix 1 is from the aforementioned
VTTI Study and lists the OR and 95% confidence intervals for safety critical event for 35
secondary and tertiary tasks that commercial truck drivers were observed undertaking
while driving.
Even without the modern hazard of distracted driving, commercial truck drivers
are a population that is already under occupational stress. Trucking and courier services
(as grouped by the U.S. Bureau of Labor Statistics) have the highest costs for nonfatal
occupational injuries and illnesses in the U.S. [26]. As has been described by other
authors [27-29], truck driver health and well-being is affected by issues such as
sleepiness and fatigue, poor physical fitness, and the work being shift work-based.
Motor vehicle crashes are the main cause of occupational fatality in the U.S. and
not surprisingly this is the case for commercial truck drivers [30, 31]. The Centers for
Disease Control and Prevention (CDC) conducted a descriptive analysis of workplace
transportation fatalities and found that increased occupational MVC fatality was
associated with workers characteristics such as being over 55 years of age, of male
gender, or of Native American and Alaska Native race [30]. The CDC also found that the
highway transportation fatality rate for truck drivers (19.6 per 100,000 workers) is 22
times higher than the national average [30]. In 2010, 304 of the 415 fatalities (73%) of
7��
occupational fatalities to workers classified under Truck Transportation by the Bureau of
Labor Statistics (BLS) were from motor vehicle incidents [31].
Although it would make sense that workers exposed to frequent occupational
driving would have high incidence of motor vehicle fatalities, the fatality rate for truck
occupants was lower than passenger vehicle occupants, 3.7 per billion vehicle miles
traveled (VMT) and 19.3 per billion VMT in 1999, respectively [32]. There are a few
possible explanations for the lower fatality rate in truck passengers versus passenger
vehicle occupants. Truck drivers, in obtaining their commercial driver’s license, are
required to have more training than operators of privately owned vehicles. Using
Maryland as an example, applicants for a commercial driver’s license must have already
obtained a regular Class C license in addition to other requirements, such as being 21-
years-old for Interstate licensure and proof of a physical exam [33]. Also, the large mass
of commercial trucks offers relative protection to its occupants compared to occupants of
smaller vehicle [34]. Thus when a commercial truck driver is involved in a crash with
other vehicles, occupants in the other vehicles are at greater risk for fatality than the truck
driver him- or herself.
For commercial truck drivers the vehicle cab is their workplace, so distraction on
the job becomes and occupational hazard. Aside from work on commercial truck drivers
done by VTTI, other researchers have examined distracted driving in the occupational
setting. A study by Walsh and colleagues examined attitudes toward CPWD among
Australian drivers and found that those who claimed to drive mainly for business

8��
purposes were more like to have positive attitudes towards CPWD and intended to
undertake CPWD in the future versus those who drove mainly for non-business purposes
[35]. Walsh ������ recognize that cell phones have become a business tool and the ability
to both drive and conduct business simultaneously is a draw for business drivers. While
some drivers may want to undertake CPWD activities to improve work efficiency, some
drivers are forced to do so against their will. When drivers are under time pressures, they
lose what Caird and Kline [36] refer to as “adaptive degrees of freedom,” or the ability to
avoid unsafe behaviors in adverse driving situations. If an employer requires drivers to
multitask while driving, it becomes an issue of workplace safety climate.
���������������� �������������������
Drivers believe that they can be more efficient by taking phone calls while driving
[35]. This would seemingly be a time saver employers and worker, yet it is well
established that DD raises crash risk. If a company was to consider creating a policy on
CPWD or other DD, a cost-benefit analysis should be conducted to weigh these supposed
time saving versus the potential of a property damage-, injury-, or fatality-involved crash,
any potential ensuing liability claims [37], or costs associated with workers compensation
[38]. Although such an economic analysis is beyond the scope of this paper, similar
analysis has been done for company seat belt policies (for an example, see Boyce and
Geller [39]).
Not all occupational drivers face similar pressures concerning whether or not they
should undertake distractions while driving. Employers could send implicit or explicit
9��
signals to their drivers concerning driving distracted on the job. On one end of the
spectrum, an organization’s drivers could be explicitly told that it is against company
policy to undertake distractions while driving, and communications equipment in the cab
would only work when the vehicle was at rest. At the opposite end of the spectrum, an
organization could require drivers to take calls or answer messages while driving to
“improve” efficiency. Between the two extremes there are numerous other options: an
organization could ban personal communication for its drivers while still requiring them
to be available to communicate with management; an organization could have no policy
on distracted driving at all; or, an organization could explicitly say that drivers were not
to undertake distractions, yet still contact drivers when management knows that those
drivers are on the road. Measuring workplace communications, time pressures, and safety
procedures are some of the elements that fall under the broader study of workplace safety
climate [40, 41].
The concept of safety climate was developed by Dov Zohar, and he defines it as
shared perceptions among employees of an organization concerning the procedures,
practices, and reinforced behaviors surrounding the performance of high-risk operations
[41]. Most commonly measured using the Safety Climate Questionnaire (SCQ) [42], this
workplace assessment asks workers to describe how highly they feel management values
communication, work pressures, training, and management’s commitment to safety [41-
44]. Two meta-analyses found that the perception of management’s commitment to safety
is the most commonly assessed aspect of safety climate [42, 43]. Taken ������ as advised

10��
by Zohar [41], safety climate can describe the complex signals sent by management to
workers in regards to the value of worker safety.
The SCQ is an instrument that has workers answers questions on a Likert scale,
the score of which are compared to occupational outcomes, such as injuries or safe
behavior for a given workplace [43, 45]. Originally consisting of 40 questions across
different aspects of employee perception [40], the questionnaire has been modified and
validated across many occupations [42]. Wills and colleagues conducted a pair of studies
where they developed and validated a version of the SCQ for occupational drivers [46,
47]. Their first study used a factor analysis to examine the components of SCQ- Modified
for Drivers (SCQ-MD) [46]. Their second study used the SCQ-MD in conjunction with
other established measures of driver behavior and compared these various instruments to
workplace traffic offenses and crashes [47]. Because distracted driving is a workplace
safety issue for commercial truck drivers, based on a review of the literature I
hypothesize that safety climate will be correlated with driver safety in regards to
distracted driving.
�����������������������������
When making decisions on whether or not to undertake distracted driving while
on the job, commercial truck drivers must weigh personal, social, and occupational costs
and benefits for the distractions. The occupational safety approach of behavior-based
safety is one method for understanding injuries in the workplace; however, it is more
focused on safely changing behavior than describing it [48]. The Theory of Planned

11��
Behavior (TPB) has been used to describe decision-making surrounding safe driving
behaviors [49] and driving in the occupational setting [35, 50]. Using the dimensions of
the TPB described below, I will explore how commercial truck drivers weigh social and
occupational considerations when undertaking driving distractions.
In the 1970s, Fishbein and Azjen developed the Theory of Reasoned Action
(TRA) hypothesizing that attitudes and subjective norms surrounding a behavior
influenced intentions to undertake that behavior and that those intentions led the
individual to do or not do the behavior [51]. A limitation of the TRA is that it could not
account for an individual’s ability to make decisions in situations of reduced volitional
control [52]. Ajzen modified the TRA to include the construct of perceived behavioral
control (PBC) [53]. PBC is “the subjective probability that one is capable of executing a
certain course of action” (p 93) [53], a concept that is very similar to self-efficacy in
Bandura’s Social Cognitive Theory [54]. However, Bandura’s model of self-efficacy
involves the individual weighing the outcomes [55], whereas in the TPB the individual
considers the outcomes in Intention and Attitude aspects of the model. Figure 1 is a
model of TPB as depicted by Parker and colleagues.

12��
Figure 1. The Theory of Planned Behavior from Parker ������ 1992. [56]
The first step in measuring TPB constructs is conducting elicitation interviews to
specify the questions for the target population of interest. Montaño and Kasprzyk [52]
outline the execution of the elicitation interviews: first, the subjects are asked to describe
any positive or negative attributes associated with performing the action (i.e. a
description of attitudes); second, they describe social referents (individuals or groups)
that could affect their decision, either positively or negatively; finally, PBC is assessed by
eliciting any facilitators or barriers towards performance of a behavior. In the current
study, I used elicitation interviews to identify distractions that commercial drivers
commonly face, which social referents would affect their decisions to undertake these
distractions, what benefits or costs could result from the distractions, and whether or not
drivers had decisive control over undertaking or not these distractions while driving. The
elicitation interviews used to generate the TPB constructs in this study will be explained
in greater detail in the Methods section.
�
13��
����!��"������� ��������������
Part of this study will examine truck drivers who are members of the International
Brotherhood of Teamsters (IBT). The IBT represents over 1.4 million workers, mainly in
truck transportation such as long-haul freight trucks, tanker trucks, and package delivery
[57, 58]. Historically, the IBT has been a strong union [59, 60]. An example of their
political power applied to occupational health is their role in influencing President Nixon
to compromise in the creation of the Occupational Safety and Health Act [61]. Although
they currently represent one tenth of all union workers in the U.S. [57], a review of the
literature only found a single study of IBT members and occupational health [62]. There
is no existing literature on IBT members and crash risk.
There is existing literature that compares union workers in many industries to
their non-union counterparts. Compared to non-union work sites, unionization promotes
workplace safety initiatives, such as proper labeling of chemical hazards and ergonomic
protections [63, 64]. Union construction workers report more management support for
safe work practices than non-union construction workers [65]. This has resulted in union
workers having lower occupational injury and fatality rates than non-union workers in the
U.S. [66-68]. Thus, when interpreting the results of the second and third manuscripts, I
must be aware that the union drivers whom I am surveying are likely in safer
occupational climates than if I had surveyed non-union drivers.
�
�
�

14��
������� ���������������!������
As has been done for other behaviors that increase motor vehicle injuries and
fatalities (e.g., speeding, drunk driving), states and municipalities have passed laws
prohibiting distracted driving, specifically CPWD. Ibrahim and colleagues summarize the
history of state distracted driving laws in the U.S. [69]. As of July 2013, 41 states ban
texting-while-driving and 11 states ban all handheld cell phone use (Washington, DC
bans both) [70]. Although research has shown that there is no difference in crash risk
comparing talking on a handheld versus hands-free phones, no state bans hands-free
CPWD [22, 24]. Some states that don’t ban either or both activities have partial bans for
novice drivers or bus drivers; no state has a ban specific to commercial truck drivers [70].
Aside from laws pertaining to CPWD bans, Connecticut, Maine, New Hampshire,
Oklahoma and the District of Columbia have laws banning general distracted driving
[71]. To use Connecticut’s general distracted driving statute as an example, drivers are
prohibited from engaging “in any activity not related to the actual operation of a motor
vehicle in a manner that interferes with the safe operation of such vehicle on any
highway” [72].
Due to the federalized system of government in the U.S., the federal government
in Washington, DC has little control over state driving laws. In the past, the federal
government has necessitated that states have such regulations by making their enactment
a stipulation for receiving federal highway funds dispensed by the U.S. Department of
Transportation (DOT) [73]. As of yet, no legislative action (necessary for funding
appropriations) has been taken by the federal government on distracted driving for all
15��
drivers. However, the Executive Branch of the government does have jurisdiction over
some aspects of transportation. Under the guidance of DOT Secretary LaHood and with
the support of President Obama, the Executive Branch has taken action on distracted
driving [74]. Because the FMCSA has jurisdiction over commercial trucks, on September
30, 2009, Secretary LaHood issued a rule stating that commercial truck and bus drivers
would be banned from texting-while-driving through the entire U.S. [75]. The Final Rule
went into effect October 2010.
Because texting and handheld cell phone bans are fairly recent developments,
there are few thorough analyses of their effectiveness. The Governors’ Highway Safety
Association summarized the literature in 2011 and found that CPWD laws had temporary
effects on CPWD activity and little, if any, effect on crash and fatality rates [2]. There are
many reasons why these laws have not been effective in achieving their goals. Some
states allow for primary enforcement of CPWD laws while others limit officers to
secondary enforcement [69]. Primary enforcement of a regulation allows for law
enforcement officers to initiate a traffic stop upon observing the violation. If a law
enforcement officer observes a regulation prohibited under secondary enforcement, he or
she cannot pull over the offending driver specifically for that offense, and can only issue
a citation for the secondary offense if the driver was pulled over for a primary offense. A
legal review of the Pennsylvania texting ban describes the hurdles both law enforcement
officials and prosecutors face in enforcing the ban [76].

16��
A series of studies of teen drivers in North Carolina found that although
knowledge of a CPWD ban for teen drivers in the state slowly increased after the law was
passed, there was no decrease in handheld cell phone use in either the short- or long-term
[77, 78]. If the threat of punishment does not exist, then enforcement as a means to
reduce distracted driving is no longer effective. In fact, other researchers have
hypothesized that lack of enforcement, or inconsistent enforcement, is a major reason that
prior CPWD bans have failed to reduce CPWD crashes or prevalence [14, 69, 79].
If the laws alone do not increase awareness nor result in high levels of
enforcement, more concerted efforts could be necessary to produce an effect. NHTSA
conducted a demonstration project of high-visibility enforcement in conjunction with a
public relations campaign in up-state New York and Connecticut for such a purpose [80].
This NHTSA project, simultaneously implemented at both locations, was designed using
elements of previously successful driving safety campaigns, such as the seatbelt
enforcement project call “Click It or Ticket” and various drunk driving enforcement
efforts. Combining paid media, earned media, and high-visibility enforcement, this
project significantly reduced texting and handheld CPWD at both study sites. The
NHTSA report on the project even included best practices for law enforcement [80]. Yet
because it was so localized in time and place, there is no indication that this program
reduced CPWD-related crashes or injuries. Also, because the project was conducted in
2010 and 2011, there has been no follow-up study of the long-term effects in the two
communities. Due to the high cost of conducting such a coordinated program, it would be

17��
difficult to scale-up such a program to the state or national level; however, this project is
evidence that government intervention can reduce prevalence of distracted driving.
Employers recognize that distracted driving can be an occupational hazard, so
some organizations that require frequent driving have created their own policies on
distracted driving for employees. These policies are not exclusive to only transportation
companies: President Obama issued an Executive Order in 2009 banning all Federal
employees from texting while driving while on government business [81].
Organizations understand that not only are their employees at risk for injury, but
also that they could be liable for injuries to third parties caused by their employees who
are driving distracted [37]. At a 2011 conference on distracted driving in the occupational
setting, members of the Network of Employers for Traffic Safety (NETS) described some
of the steps their companies had taken to deal with occupational distracted driving [82].
The NETS members, such as Johnson & Johnson and Exxon, described how their
companies have taken steps not just to curtail CPWD for their drivers, but also change
management practices to insure that drivers are not being contacted when on the road. A
2010 VTTI study of company cell phone policies have been shown to be more effective
than state laws at reducing CPWD prevalence [4]. The VTTI researchers hypothesized
that on-board safety monitoring technology gave management the ability to observe
CPWD and those drivers working under a fleet cell phone policy knew that they could be
directly impacted (i.e. punished) for violating the policy. This hypothesis is supported by
18��
the finding that state bans did not reduce CPWD for drivers because the police could not
monitor cell phone use directly, as thus punishment was less likely [4].
Aside from the aforementioned NHTSA demonstration project involving high-
visibility enforcement [80], prior studies of CPWD bans have shown no effect on
prevalence or crashes, transportation safety experts have been forced to explore other
possible methods to reduce distracted driving. Consistent with the previously described
Theory of Planned Behavior described above, current efforts on curbing distracted
driving are considering the roles of social norms in CPWD. On March 22, 2013, the
CDC’s National Center for Injury Prevention and Control sent an image (Figure 2) out
via social networking service Twitter with the text “Don’t let distracted driving become a
social norm.” Three studies of non-American drivers all found that subjective norms,
what one’s peers think about a given behavior, have a major influence on younger
drivers’ decision-making surrounding CPWD [35, 83, 84]. One of these studies,
examining Kuwaiti drivers, found that injunctive norms, i.e., the perception of frequency
and acceptability of a given activity, were found to highly correlate with CPWD [84].
Thus, to change social norms on distracted driving, safety advocates will have to address
both subjective norms and injunctive norms [85].

19��
Figure 2. Image sent out by the CDC’ via Twitter on March 22, 2013
(https://twitter.com/CDCInjury/status/315130180316323841/photo/1)
20��
Methods
This Methods chapter will first describe the methods used in manuscript 1, then
the methods used jointly in manuscripts 2 and 3. Manuscript 1 is a statistical exploration
of fatality data and is mainly descriptive in nature. Manuscript 2 examines the effects of
workplace safety climate on driver distraction and manuscript 3 uses the Theory of
Planned Behavior to describe the decision-making process for drivers concerning
distracted driving on the job. Manuscripts 2 and 3 were developed in concert and were
conducted simultaneously using mixed methods.
Manuscript 1: Statistical Analysis of Distraction-Related Truck Crash Fatalities
As described in the Introduction, motor vehicle incidents are the leading cause of
occupational fatality in the U.S. Truck drivers face many forms of distraction while
driving on the job [6], yet this issue has emerged in the national consciousness with the
increase in cell phone use while driving, especially texting while driving. Prior to the
current study, little research has been conducted on the burden of distracted driving on
the population of truck drivers in the U.S. The Fatality Analysis Reporting System
(FARS, formerly known as the Fatal Accident Reporting System) maintained by NHTSA
[86] has been often used by researchers to track occupational [87, 88] and non-
occupational motor vehicle fatalities in the U.S. [14, 89]. FARS data are reported
annually and fatalities can be assessed by state or territory. Using these design
characteristics as the basis of the analysis, the purpose of Manuscript 1 is two-fold: 1)

21��
describe distraction-involved truck fatalities by state and across the study period; and 2)
assess the impact of state and federal distracted driving regulations on fatality rates.
��������������
The FARS data are publicly available and free to download. Cases in FARS are
downloaded by year and each case is assigned a unique observation number. Any crash
that involves a motor vehicle and result in the death of a motorist or non-motorist within
30 days of the crash is required to be compiled by each state (by a state FARS Analyst);
these state-level reports are then combined by NHTSA [90]. Sources that the states use to
complete data entry include Police Accident Reports, death certificates, state vehicle
registration files, coroner/medical examiner reports, state driver licensing files, hospital
medical records, state highway department data, emergency medical service reports, and
vital statistics data [90]. FARS has over 120 variables for each case (all of which are not
always recorded or required) [90]. It has been shown that when the variables get more
specific (e.g., vehicle make and model), the less likely they are to be consistently entered
in FARS [91]. NHTSA states that each Analyst’s data entry is checked for consistency
and completeness on a continuing basis; however, the manual describing the FARS data
does not indicate how levels of completeness and accuracy are measured and what is
considered acceptable [90].
The variables that I downloaded from FARS for each year were Seating Position,
Injury Severity, Body Type, Gross Vehicle Weight Rating, Related Factors- Driver Level
(up to four values of this variable were available for each subject), State, Case Number,
22��
Vehicle Number, and Person Number. Data were downloaded from FARS as text files
and uploaded into Stata v.12.1 (Stata Corp, College Station, TX). I downloaded every
case for each individual year, and then used the following process to identify the cases of
interest.
To collect the appropriate fatalities, I first needed to identify crashes involving
trucks and then determine when the drivers of the trucks were distracted. To identify
crashes involving trucks, two FARS variables were used: Body Type and Gross Vehicle
Weight Rating (GVWR) for each year of data [92]. Because the GVWR variable was first
included in the 2000 database, this year was established as the first year of the study
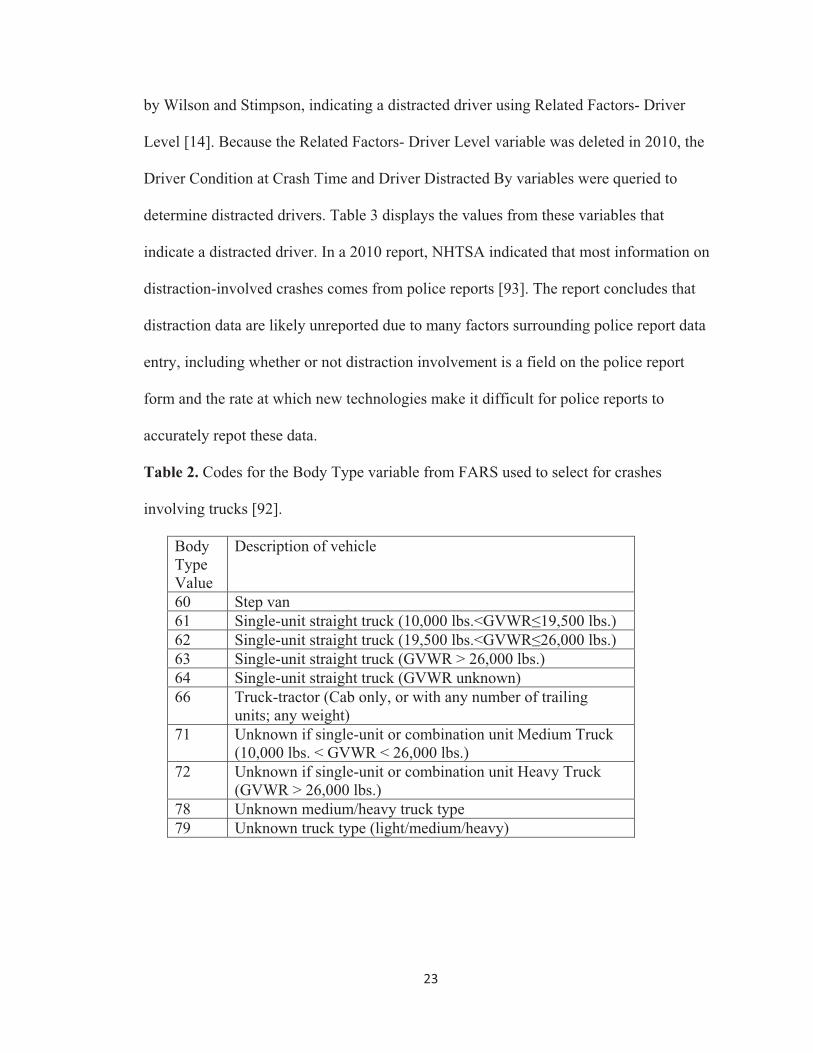
period. Table 2 lists the Body Type categories designating commercial trucks. These
Body Type values were validated using GVWR, as recommended by NHTSA in the
FARS Coding Manual [92]. I checked to insure that each vehicle identified as having a
Body Type found in Table 2 aligned with the FMCSA definition described in the
Introduction [25] using the GVWR variable. For vehicles with values of 64 and 79 for
Body Type, 204 vehicles were designated as not Commercial Motor Vehicles (CMVs)
because their GVWR was below 10,000 lbs. threshold that FMCSA uses to define CMVs.
After identifying crashes involving commercial trucks, I needed to identify those
truck drivers who were driving distracted. Because of a change in the FARS database for
2010, separate methods were necessary to identify those truck drivers who were
distracted for the 2000 through 2009 data and in the 2010 data. For 2000 through 2009, I
used the Related Factors- Driver Level variable. Table 3 displays the values, as described
23��
by Wilson and Stimpson, indicating a distracted driver using Related Factors- Driver
Level [14]. Because the Related Factors- Driver Level variable was deleted in 2010, the
Driver Condition at Crash Time and Driver Distracted By variables were queried to
determine distracted drivers. Table 3 displays the values from these variables that
indicate a distracted driver. In a 2010 report, NHTSA indicated that most information on
distraction-involved crashes comes from police reports [93]. The report concludes that
distraction data are likely unreported due to many factors surrounding police report data
entry, including whether or not distraction involvement is a field on the police report
form and the rate at which new technologies make it difficult for police reports to
accurately repot these data.
Table 2. Codes for the Body Type variable from FARS used to select for crashes
involving trucks [92].
Body Type Value
Description of vehicle
60 Step van 61 Single-unit straight truck (10,000 lbs.<GVWR�19,500 lbs.) 62 Single-unit straight truck (19,500 lbs.<GVWR�26,000 lbs.) 63 Single-unit straight truck (GVWR > 26,000 lbs.) 64 Single-unit straight truck (GVWR unknown) 66 Truck-tractor (Cab only, or with any number of trailing
units; any weight) 71 Unknown if single-unit or combination unit Medium Truck
(10,000 lbs. < GVWR < 26,000 lbs.) 72 Unknown if single-unit or combination unit Heavy Truck
(GVWR > 26,000 lbs.) 78 Unknown medium/heavy truck type 79 Unknown truck type (light/medium/heavy)
24��
In FARS, identifying a driver-related factor does not assign “blame” to that factor
for having caused the crash. This analysis did not account for other vehicular or
environmental factors, nor factors related to the other driver (in the case of multiple-
vehicle crashes) in our analysis. Thus I will refer to these crashes as distraction-involved
or distraction-related crashes; not “caused by” distracted driving. After identifying the
above crashes, fatalities to distracted truck drivers were identified using the Seating
Position and Injury Severity variables.
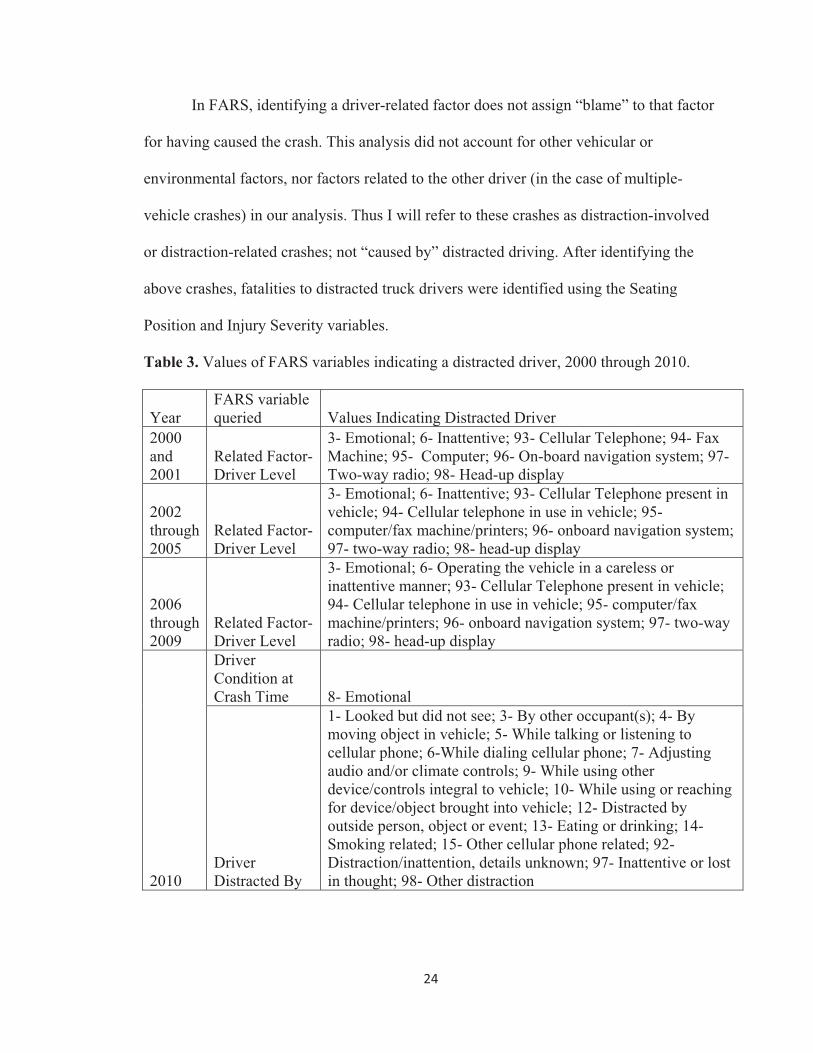
Table 3. Values of FARS variables indicating a distracted driver, 2000 through 2010.
Year FARS variable queried Values Indicating Distracted Driver
2000 and 2001
Related Factor- Driver Level
3- Emotional; 6- Inattentive; 93- Cellular Telephone; 94- Fax Machine; 95- Computer; 96- On-board navigation system; 97- Two-way radio; 98- Head-up display
2002 through 2005
Related Factor- Driver Level
3- Emotional; 6- Inattentive; 93- Cellular Telephone present in vehicle; 94- Cellular telephone in use in vehicle; 95- computer/fax machine/printers; 96- onboard navigation system; 97- two-way radio; 98- head-up display
2006 through 2009
Related Factor- Driver Level
3- Emotional; 6- Operating the vehicle in a careless or inattentive manner; 93- Cellular Telephone present in vehicle; 94- Cellular telephone in use in vehicle; 95- computer/fax machine/printers; 96- onboard navigation system; 97- two-way radio; 98- head-up display
2010
Driver Condition at Crash Time 8- Emotional
Driver Distracted By
1- Looked but did not see; 3- By other occupant(s); 4- By moving object in vehicle; 5- While talking or listening to cellular phone; 6-While dialing cellular phone; 7- Adjusting audio and/or climate controls; 9- While using other device/controls integral to vehicle; 10- While using or reaching for device/object brought into vehicle; 12- Distracted by outside person, object or event; 13- Eating or drinking; 14- Smoking related; 15- Other cellular phone related; 92- Distraction/inattention, details unknown; 97- Inattentive or lost in thought; 98- Other distraction

25��
I also identified fatalities to occupants other vehicles in distraction-involved truck
crashes. I identified crashes where a truck driver was distracted as described above and
used the Case Number variable to identify all vehicles in that given crash. Using the
Injury Severity variable, I identified all vehicle occupants who were killed in any vehicle
involved in the distraction-related crash. This second list of all vehicle occupants includes
all the truck drivers who were killed. Using the State variable and the Year variable, I
generated longitudinal fatality counts for each state and the District of Columbia (DC).
Each year of data offers a cross-section of fatalities in a given state. When individual
years are combined, they form a longitudinal fatality database [94].
���������#����
Fatalities were analyzed by both counts and rates. The exposure for the rate
calculation was billions of vehicle miles traveled (VMTs). VMT is a commonly used
measure of driving exposure [95, 96]. VMTs provided a more precise estimate of driving
exposure as opposed to calculating rates per number of individuals in a population. Since
this study is examining crashes involving trucks, I used diesel VMTs to calculate rates, as
was done by Neeley and Richardson [87], for a more precise measure of exposure data
for truck traffic in a state. Data on annual state VMTs was obtained from the Department
of Transportation’s Federal Highway Administration (FHWA) [97]. I downloaded table
VM4 from the annual “Highway Statistics” reports [98]. Fatality rates for truck drivers
and all vehicle occupants were calculated for each state and year.
26��
Descriptive analysis was conducted on fatality counts and rates. Fatalities for the
total period, by state, by year, and by state and by year (state*year) were described using
mean, standard deviation, and inter-quartile range. Because there is high variation
between states in motor vehicle crash rates and injuries [99], I conducted an analysis of
variance (ANOVA) to compare within- versus between-state variation [100].
#����$�������%���������������� ����������
To analyze the impact of distracted driving laws on fatality rates, a multi-level
longitudinal Poisson model was fit. The Poisson model, often used to describe the count
distribution of motor vehicle crashes [101], assumes that the mean (E[Y]) and variance
(Var[Y]) of an outcome given covariates (X1…Xn) are equal [102]. The offset for the
Poisson model [94, 102] was diesel VMT in billions of miles. The analysis of state laws
was informed by Neeley and Richardson’s analysis of the impact of state laws on truck
driver safety [87]. These authors designed their analysis of truck-involved fatalities
noting that crashes are correlated spatially (by state) and temporally [103, 104]. The
regression will employ random intercepts for the individual states with fixed effects for
the regression coefficients [103, 105, 106]. An exception was the cell phone saturation
variable, which used random effects [107]. The random effects model for cell phone
saturation had both a significant regression coefficient and reduced log likelihood versus
the fixed effects model.
The purpose of this regression analysis was to examine the effects of state CPWD
bans on distraction-involved truck crash fatality rates. Wilson and Stimpson conducted a
27��
similar longitudinal analysis of texting-while-driving in the U.S. using FARS data and
found that as of 2008 no state texting laws had an effect on reducing distraction-related
fatalities [14]. As of July 2013, I could identify no analyses of state handheld CPWD
bans. State bans on texting and handheld were identified using data from the Governors’
Highway Safety Association (GHSA) [70]. Binary variables were generated for each
state*year for presence of a given ban. Because the state*year is the level of analysis, I
could only describe which year a ban went into effect. Due to sample size limitations, I
was unable to describe cases by the state*month, which would be a more accurate
representation of when the bans went into effect. A binary variable for the FMCSA
texting ban was generated with no ban in 2000 through 2009 and the ban in effect for all
states in 2010. Although the FMCSA ban was announced in September, 2009 and the
FMCSA solicited open comments on its rule-making procedure in January, 2010, the ban
was not put into effect until October, 2010. Since the data were available from 2000 –
2010, this analysis will not be able to assess the impact of the 2010 FMCSA ban on
fatality rates
To study the impact of the CPWD bans, other state-level data known to affect
crash rates, motor vehicle fatality rates, and distracted driving were added to the model.
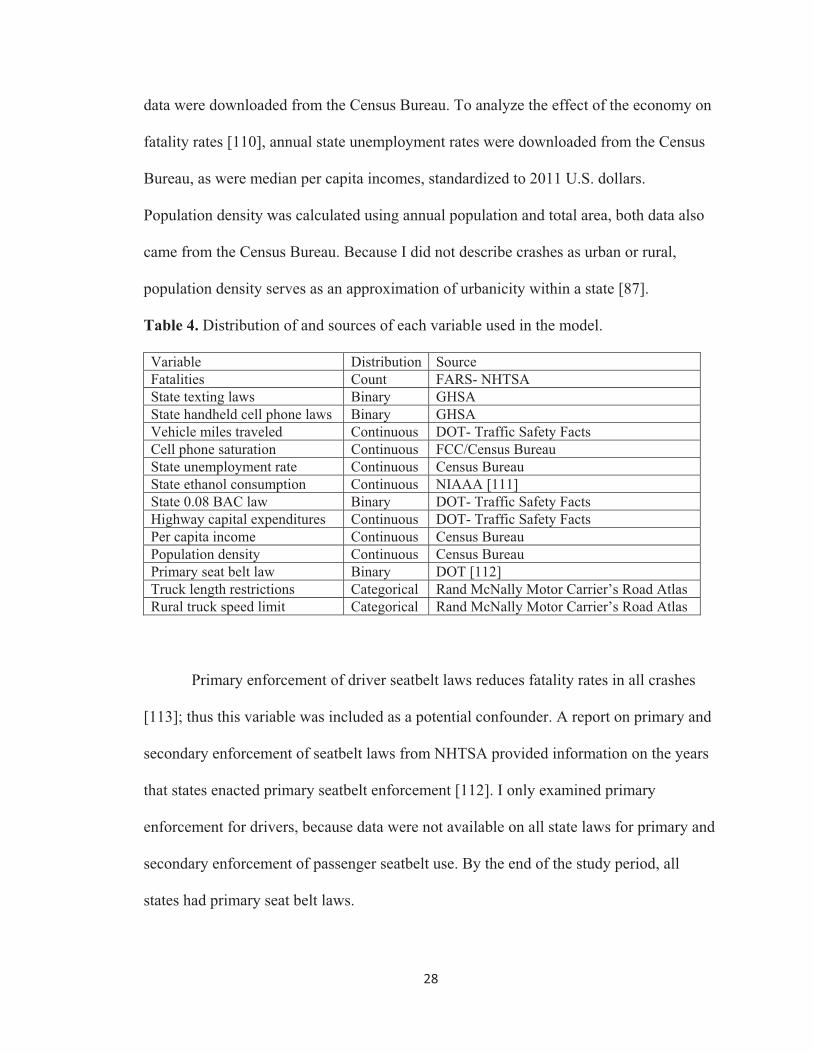
Table 4 lists these variables, their distributions, and sources. I will briefly describe each
of them below.
Cell phone saturation is the number of cell phone subscriptions per capita in a state in a
given year and describes the growth in cell phones across the study period [14, 108]. Data
on cell phones in a state came from annual reports by the FCC [109] and state population
28��
data were downloaded from the Census Bureau. To analyze the effect of the economy on
fatality rates [110], annual state unemployment rates were downloaded from the Census
Bureau, as were median per capita incomes, standardized to 2011 U.S. dollars.
Population density was calculated using annual population and total area, both data also
came from the Census Bureau. Because I did not describe crashes as urban or rural,
population density serves as an approximation of urbanicity within a state [87].
Table 4. Distribution of and sources of each variable used in the model.
Variable Distribution Source Fatalities Count FARS- NHTSA State texting laws Binary GHSA State handheld cell phone laws Binary GHSA Vehicle miles traveled Continuous DOT- Traffic Safety Facts Cell phone saturation Continuous FCC/Census Bureau State unemployment rate Continuous Census Bureau State ethanol consumption Continuous NIAAA [111] State 0.08 BAC law Binary DOT- Traffic Safety Facts Highway capital expenditures Continuous DOT- Traffic Safety Facts Per capita income Continuous Census Bureau Population density Continuous Census Bureau Primary seat belt law Binary DOT [112] Truck length restrictions Categorical Rand McNally Motor Carrier’s Road Atlas Rural truck speed limit Categorical Rand McNally Motor Carrier’s Road Atlas
Primary enforcement of driver seatbelt laws reduces fatality rates in all crashes
[113]; thus this variable was included as a potential confounder. A report on primary and
secondary enforcement of seatbelt laws from NHTSA provided information on the years
that states enacted primary seatbelt enforcement [112]. I only examined primary
enforcement for drivers, because data were not available on all state laws for primary and
secondary enforcement of passenger seatbelt use. By the end of the study period, all
states had primary seat belt laws.
29��
Two variables were included to account for the effects of drunk driving on fatality
rates. The first was a binary variable on whether or not a state used 0.08 mg/dl blood
alcohol content (BAC) as the threshold for driving while intoxicated (DWI) or driving
under the influence (DUI). These data came from the DOT’s annual Traffic Safety Facts
reports. Second, per capita alcohol consumption, measured in gallons of ethanol, was
obtained from a report from the National Institute on Alcohol Abuse and Alcoholism
[111]. Capital expenditures represent the investment that a state makes in roadway
infrastructure [87]. These data were also obtained from the Traffic Safety Facts reports
and converted to 2010 U.S. dollars. Traffic Safety Facts data were only available through
2010.
All the previous data are publically available online and free to download. Two
other variables that impacted fatality rates in the study of truck drivers by Neeley and
Richardson were maximum truck length and rural truck speed limit [87]. States are
allowed to set both the maximum speed on highways and the maximum allowable length
for trucks. The data were obtained from the annual editions of the Motor Carrier’s Road
Atlas published by Rand McNally. Examining the data, they naturally broke down into
categories. For maximum truck length, data were categorized as 1) under 53 feet; 2) 53
feet or 53 feet, six inches; 3) 57 feet, four inches or 57 feet, six inches; and 4) 59 feet or
longer. State speed limits were in 5 mile per hour (mph) intervals from 55 mph to 75
mph. I specifically examined “rural truck speed limits” in the analysis: some states have
higher speed limits for passenger vehicles versus large trucks and buses; furthermore,
some states have higher speed limits in rural areas versus urban areas [87].

30��
Because the Rand McNally atlases were not intended to be used for surveillance,
the 2007 through 2009 editions were missing data on rural truck speed limits. Internet
searchers produced some missing data: for example, Virginia changed the speed limits by
legislative action in from 65 mph in 2009 to 70 mph in 2010 [114]. I imputed the missing
data using a method developed by Royston for missing categorical data [115, 116].
Although this method worked, data highly varied between categories year-to-year within
a state, which did not reflect the infrequent changes seen in all other years of the study
period. As a result, I opted to carry the 2006 observations forward to 2009, a technique
for missing data that is commonly used in pharmaceutical studies [117], and noted the
limitations of doing so in the manuscript.
!� ��������������
As described previously, ANOVA was conducted to compare within- and
between-state variation for fatality rates. The results of the F-tests were highly significant
for truck driver fatality rates and all vehicle occupant fatality rates, F(50,510) = 14.51,
p<0.0001 and F(50,510) = 11.47, p<0.0001, respectively. These results reinforced the need
for a multi-level model in regression analysis. I used the variance inflation factor (VIF) to
test for multicollinearity among the covariates [94]. Since none of the VIF values were
above the rule-of-thumb cut-off of 10 no variables were eliminated from the model at this
step [118]. Later in the analysis process, Stata dropped the per capita income variable due
to collinearity. Other than that, all variables were included throughout the analysis.

31��
Unadjusted regression on truck driver fatality rate and all vehicle occupant fatality
rate was conducted for all covariates. For all variables aside from the 2010 FMCSA ban
(which was a national ban) state-level fixed-effects (FE) and random-effects (RE) were
tested [107]. In only the case of cell phone saturation was there a difference in effect
between FE and RE analysis. Other than cell phone saturation, all analyses were
conducted using FE.
Two multivariate regression models were fit for both truck driver fatality rates
and all vehicle occupant fatality rates. The first model included only those variables that
were significant in univariate regression at the � � 0.10 level. Entering covariates with p-
values less than 0.2 has been used in model selection in the past [94]; however, using
0.10 as a cutoff is a trade-off between including relevant covariates and model
performance [119]. The second model included the significant variables as well as in the
state texting and handheld CPWD bans and the FMCSA ban. These two models were
compared using likelihood ratio tests [94, 120].
To test for possible delayed-effects of state laws [121], lagged variables for state
texting and handheld CPWD laws were generated. Lagging the effects of the law by one
year produced no significant outcomes. Since 2010 was the last year of analysis, lag
effects for the FMCSA ban could not be tested.
32��
Manuscripts 2 and 3: A Mixed Methods Examination of Distracted Driving in
Commercial Truck Drivers
Manuscript 2 is an analysis of the effects of safety climate on distracted driving
behaviors in commercial truck drivers. Manuscript 3 uses the Theory of Planned
Behavior (TPB) to analyze the influences on truck drivers’ decision-making surrounding
distracted driving. Both papers were developed in concert and were conducted using key
informant interviews followed by an online survey of commercial truck drivers. First, I
will describe the methods for data collection, then I will describe the data analysis
methods for each manuscript separately.
When conducting a mixed methods study, researchers must consider what they
gain from combining two different paradigms and methods of research. To fully benefit
from mixed qualitative and quantitative methods, a researcher has to undertake a
pragmatic approach to understanding the strengths and limitations of each method [122,
123]. The term “triangulation” is used as a catch-all to describe how the weaknesses of
one method are buttressed by the second method, and vice versa [124]. The mixed
methods should grow out of a paradigm, sometimes referred to as post-positivist or
pragmatic [123, 124], that builds on both the positivist quantitative data and the
constructionist qualitative data.
&�����������������������'�(���)���������)������*�
The TPB, as described in the Introduction chapter, requires key informant
interviews to determine the appropriate behaviors, attitudes, social norms, and perceived

33��
behavioral control for the population of interest [52]. Originally, I had intended to
conduct focus group sessions with truck drivers instead of individual key informant
interviews. Working with Mr. Byrd, we had agreed to hold up to five focus group
sessions with drivers from IBT Local #639 located in Burtonsville, MD. After
Institutional Review Board (IRB) approval was granted through the Johns Hopkins
Bloomberg School of Public Health, we were unable to set up focus group sessions that
were satisfactory for all parties. Therefore, the qualitative data collection approach was
modified slights, and an amendment was submitted and approved by the IRB in
November 2012 to conduct key informant interviews.
The purpose of the interviews was four-fold: 1) Understand beliefs and attitudes
of truck drivers surrounding distracted driving; 2) Understand correlations between
workplace safety climate and distracted driving behaviors; 3) Understand non-crash
outcomes that could result from distracted driving; and 4) Determine if commercial truck
drivers perceive distracted driving as a threat. The interview script was developed with
the input of my Thesis Advisory Committee. After the subject matter was resolved, the
survey was pilot tested with a transportation safety researcher from the National
Transportation Safety Board and a representative of the American Trucking Association.
The recommendations of these experts were used in refining the final language of the
interview script. The approved interview script is presented in Appendix 2.
To identify potential respondents for the key informant interviews, I sought out
experts in truck driver safety or distracted driving. The initial interview subjects were

34��
purposively recruited from the list of attendees at the Symposium on Prevention of
Occupationally-Related Distracted Driving sponsored by the Johns Hopkins Bloomberg
School of Public Health Occupational Safety and Health Education and Research Center
on April 18, 2011 in Laurel, MD. From this conference, two appropriate subjects were
identified. Upon completion of the interview, subjects were asked if they could
recommend any of their peers who might contribute to data collection; nine subjects were
identified by interview participants or attendees from the conference. This snowball
sampling technique allowed us to reach interview subjects we might not otherwise have
considered [125].
Interviews were conducted via Skype (Microsoft Corp., Redmond, WA) and were
recorded using MP3 Skype Recorder v3.1 (www.VOIPCallRecording.com). Audio files
of the interviews were transcribed by uploading the .mp3 files to
www.productiontranscripts.com (Production Transcripts, Glendale, CA). Data collection
was ceased after 11 interviews when data saturation was reached. The recording software
failed on one interview, so I ended up with 10 transcripts and notes on all 11 interviews.
Data were collected in December, 2012 and January, 2013. The interview subjects
remained anonymous throughout data collection; when reference is made to specific
interview subjects in Manuscripts 2 and 3, their interview number will be used. Of the 11
interview subjects, five were researchers at academic institutions, three were at private
research institutions, and one a piece were from a union, a private company, and a federal
agency.

35��
Notes and transcripts were stored as Microsoft Word documents, which were then
used for qualitative coding. Data were open-coded line-by-line to label the themes found
in subjects’ responses [126, 127]. Initial themes were developed by identifying labels
that were found in commonly across the interviews. Focused coding, or level-2 coding,
was employed to group themes into broader categories [126, 127]. For example,
“personal control” and “work pressure” were two labels that often appeared close to one
another as interview subjects described the balance the drivers would have to strike in
their decision-making process. A codebook (Appendix 4) was developed during the
focused coding process. A second coder was employed for a subset of three randomly-
selected interviews as a check on the reliability of the coding process. Both coders met to
discuss the coding and how well the codebook described the categorizations of the data
[128]. The two coders differed slightly in their choice of wording of themes, but no
substantive differences emerged. Analysis will be further described for each of the two
studies in their respective sections.
&������������������������'���������������������������������������
The International Brotherhood of Teamsters (IBT) represents over one million
workers in the U.S. and Canada [57]. I reached out to this group because they represent
the largest number of commercial drivers in the U.S. Throughout the design of the study I
was in contact with the head of Occupational Safety and Health for the IBT, Mr. Lamont
Byrd. Mr. Byrd was able to help refine the language used in study materials and direct me
to appropriate groups within the IBT for study.

36��
After the key informant interviews were completed, the driver survey could be
finalized. Appendix 3 shows the finalized driver survey. Questions on pages 165 - 169
are the SCQ as modified for drivers by Wills and colleagues [46, 129]. The first step in
finalizing the survey was determining which behaviors were most hazardous and relevant
and the drivers [52]. The “Behaviors” section in the interview (Appendix 2) asked
respondents to give a rating of how distracting each of the behaviors is to truck drivers.
This list of behaviors were selected from the table from the VTTI study shown in
Appendix 1 [6]. Interview subjects were asked to respond using a Likert scale of 1
through 5 where 1 was “not at all distracting” and 5 was “very distracting.” The ratings
from all interview subjects were recorded by the interviewer, and a mean perceived
hazard was calculated for each behavior. After this section was completed, the
interviewer selected three or four of that the interviewee gave the highest distraction
scores. The subjects were then asked to describe for each of the selected behaviors if the
TPB constructs would affect driver behavior.
Key informants were unanimous in rating “Writing a text message or other
message on a cell phone” as very distracting, i.e. 5 out of 5. Dialing a cell phone, reading
a message, reading a map, interacting with a dispatch device, and writing notes or a log
all had mean perceived distractions above 4.5/5. The TPB survey relies on analyzing
behaviors that are relevant to the population. In this case, I choose both “writing a text
message…” and “interacting with a dispatch device” as the relevant behaviors that I
would use on the survey. After reviewing the literature and consulting with my Thesis
Advisory Committee, I settled on the language of “texting” rather than “writing a text

37��
message…” for the wording in the online survey. From the interviews, key informants
stated that texting could be either from management, if that is an organization’s
communication method, or personal communications with friends and family.
I chose “interacting with a dispatch device” because this is a distraction that is
unique to commercial truck drivers as an occupational hazard. Thus, any interactions that
a truck driver has with the device originate solely from his or her occupational situation.
One of the pilot testers and a key informant interview subject both recommended that
questions about dispatch device use be divided into “looking at” the dispatch device and
physically “interacting with” the device. Interview subjects rated “interacting with” as
more distracting, on average, than “looking at” the devices, mean perceived distraction
4.5/5 and 4.3/5, respectively. Only those drivers who used dispatch devices as part of
their work answered those questions. Two different types of dispatch devices are shown
for those survey participants who might be unclear as to what type of equipment the
survey referred.
To measure social norms for the TPB, appropriate social referents must be
identified [52, 53]. In the interviews, key informants were asked who would positively or
negatively influence a driver’s decision to undertake any of three or four distractions on
which each interview subjects was further probed. The text of all responses on social
referents for each behavior were entered into a spreadsheet and color coded indicating
whether the interview subject thought that a given referent would have a positive,
negative, or neutral/not further specified influence on undertaking such a behavior. In the

38��
10 transcribed interviews, key informants were asked about a total of 32 distracting
activities (with much overlap between interview subjects) and only four times did
interview subjects report that management had no influence over a given behavior.
Interview subjects were specifically asked if family members would influence
performance of these behaviors, and in 13 of these same 32 instances, key informants
said that family would have no influence. Coworkers and friends had even less influence
on behavior performance, according to the key informants. Thus, questions on pages 160,
163 and 164 in Appendix 3 ask about the opinions of supervisors, as they are the most
relevant social referents to commercial truck drivers.
The final page of the survey (Appendix page 170) describes various safety critical
events that commercial truck drivers might face. These outcomes were informed by the
literature, especially the work of the VTTI researchers [4, 6], and were confirmed as
likely scenarios by the key informants. From the Olson study [6] we know that distracted
driving crash is least likely, with near crashes being more common outcomes [130].
These four questions will be used as outcomes to analyze against safety climate scores
and the components of the TPB. To determine if the language in the survey was
appropriate, I went over survey with a Business Representative from an IBT Local with
whom Mr. Byrd had put me in contact. After adjusting question order and some wording
with the Business Representative, the survey took less than 10 minutes to complete upon
pilot testing.

39��
Mr. Byrd and other members of the IBT helped inform the selection of the target
population for the survey. Although Teamsters members are generally thought of as truck
drivers, the IBT represents a wide variety of drivers, and some non-drivers, whose job
duties are highly diverse [58]. From the online list of the various industries that IBT
workers work in [58], I narrowed down the target population with the assistance of Mr.
Byrd and other IBT representatives. The final sample of eligible drivers included those in
the carhaul, express, freight, package, and tankhaul industries. The question on page 157
in Appendix 3 is meant to screen for drivers in these industries. Representative images of
the various vehicles are in Appendix 3 on pages 157 and 158. Those drivers who select
the option “I don’t drive any of these type [sic] the majority of the time” are screened out
and redirected to a disqualification page in the survey thanking them for their time, but
informing them that they are not appropriate candidates for the research. I estimate that
up to 20% of subjects who initiated the survey would be screened out.
On page 174 of Appendix 5, I describe the types of vehicles driven by
respondents as they answered on the screening question. The categories in Table 2 of
Appendix 5 correspond to the images of the different vehicles on page 157 of Appendix
3. Using a Pearson’s �², the distribution of vehicle types is the same for all subjects who
passed the screening questions, those included in Manuscript 2, and those in both
populations of Manuscript 3. There is no publically available data from the Teamsters
that describes the distribution of its members by industry. The U.S. Census Bureau
generated a census of all commercial vehicles in the U.S. in 2002 [131]. The Census
report found that 62.9% of trucks in the U.S. are “heavy trucks,” which in the current

40��
study includes semi-trucks, carhaul, tankhaul, and dump trucks; 22.5% were “medium
trucks,” which includes the package vans in the current study; and the remaining 14.6%
of trucks were small trucks excluded from the current analysis. Although I did not seek
specific percentages of each vehicle type in the study, the percent of large trucks and
medium trucks in Manuscripts 2 and 3 are not widely different from the Census Bureau
report. A caveat is that the Census data were collected 11 years before my data, so the
American trucking fleet might have undergone changes in that time.
With Mr. Byrd’s assistance, a link to the survey was posted to the Teamster’s
website on April 2, 2013. The survey was created using SurveyMonkey, an online survey
tool (SurveyMonkey LLC, Palo Alto, CA). Figure 3 is a screenshot of the survey
announcement taken on April 4, 2013. Due to funding constraints, I could not afford to
pay each survey participants reimbursement for the time used taking the survey. Thus, as
seen in Figure 3, I used the raffle of an iPad 3 as enticement to take the survey. To insure
the privacy of any study subjects, a separate survey was created solely for subjects to
enter their email addresses if they wished to enter the raffle. As a further blinding
procedure, my advisor, Dr. Pollack, randomly selected a winner from email addresses
entered in the second survey. The survey was closed on May 19, 2013.

41��
Figure 3. Screenshot of the survey announcement on the Teamster’s website
(http://www.teamster.org/content/safety-study-all-commercial-drivers accessed 4 April
2013)
Separate sample size requirements were calculated for the safety climate data and
the TPB data. The safety climate questions are analyzed using a factor analysis. A rule of
thumb for sample size and factor analysis is a ratio of 10 subjects per survey question
[118], yet this is not a hard and fast rule [132]. A ratio of 5:1 or 6:1 has also been
frequently used, and after 300 subjects the ratio of subjects to questions can does not need
to be as high as 10:1 [132, 133]. For the 35-item SCQ modified for drivers [47], a sample
of at least 350 subjects would be very strong, whereas 175 subjects would produce the
minimal 5:1 ratio.
There are many ways to conduct a sample size calculation for multivariate
regression analyses of survey data [134-136], yet many TPB studies lack a sample size or

42��
power calculations [134]. Reviews of sample size find that the gold standard method is to
use variance inflation factor (VIF) from multivariate regression [134, 136]. Two studies
examining TPB and driver behavior were identified for sample size calculations: Elliott
and colleagues [49] used the TPB to describe 943 English drivers’ speeding behaviors
and Wills and colleagues [129] compared the TPB constructs to negative workplace
outcomes, such as crashes and traffic violations, for 317 Australian truck drivers. Neither
of these studies allowed for sample size calculation using the VIF method.
The Elliott ������ study regressed TPB components and demographic data, as I
plan to do, on speeding behaviors. The resulting model had an R2 of 0.63 and an F
statistic significant at p < 0.001 [49]. Using a sample size calculation from Fisher’s and
Van Belle’s text book [137] I calculated that the 943 subjects in the Elliott �������study
resulted in a power of 0.988. The data presented in the Wills ������ study did not allow for
a similar calculation. Extrapolating from the Elliott results, I estimated that a sample of
500 drivers would result in a study with power of greater than 0.80 and an alpha-level of
0.05.
Because the current study applies the TPB to a behavior (distracted driving) and a
population (truck drivers in the U.S.) that have never before been examined, there is no
one study that I can point to as a gold-standard when estimating outcome frequency. The
VTTI study by Olson and colleagues found only 21 crashes, 197 near crashes, and 1,215
lane deviations in 735,000 miles of recorded data [6]. Crashes and near-crashes are
seemingly rare events; however, the driver population in the study by Elliott and

43��
colleagues also reports very infrequent speeding behavior and their TPB analysis was
able to produce significant results [49]. As a result of the power calculation using the
Elliott ����� the IRB approved sampling of 500 subjects.
Manuscript 2- Safety Climate- Data Analysis
The mixed methods data were collected separately from different populations.
Although qualitative data were collected first, in this manuscript the order of data
collection was not important to its interpretation. In mixed methods study notation, this
manuscript follows a QUAN+qual design for the purposes of complementarity
evaluation, that is, elaborating and illustrating quantitative results with the qualitative
data [138, 139]. By using qualitative data from a population outside that of the drivers
who are surveyed quantitatively, this “between-method” should enhance the data’s
external validity [124].
Of the 440 subjects who entered the survey, 79 (18%) were screened out when
they identified as not driving in one of the vehicles of interest. Over the course of the
survey, 122 of the remaining 361 (34%) left the survey before completion. The final
population consisted of 239 members of the International Brotherhood of Teamsters.
Appendix 5 more thoroughly describes how this final sample size was reached. The
online survey consisted of the 35 item SCQ modified for drivers by Wills and colleagues
[46, 129]; questions on the subject’s gender, age, and years driving experience; and four
questions on crashes and near crashes involving distraction. Drivers were asked how
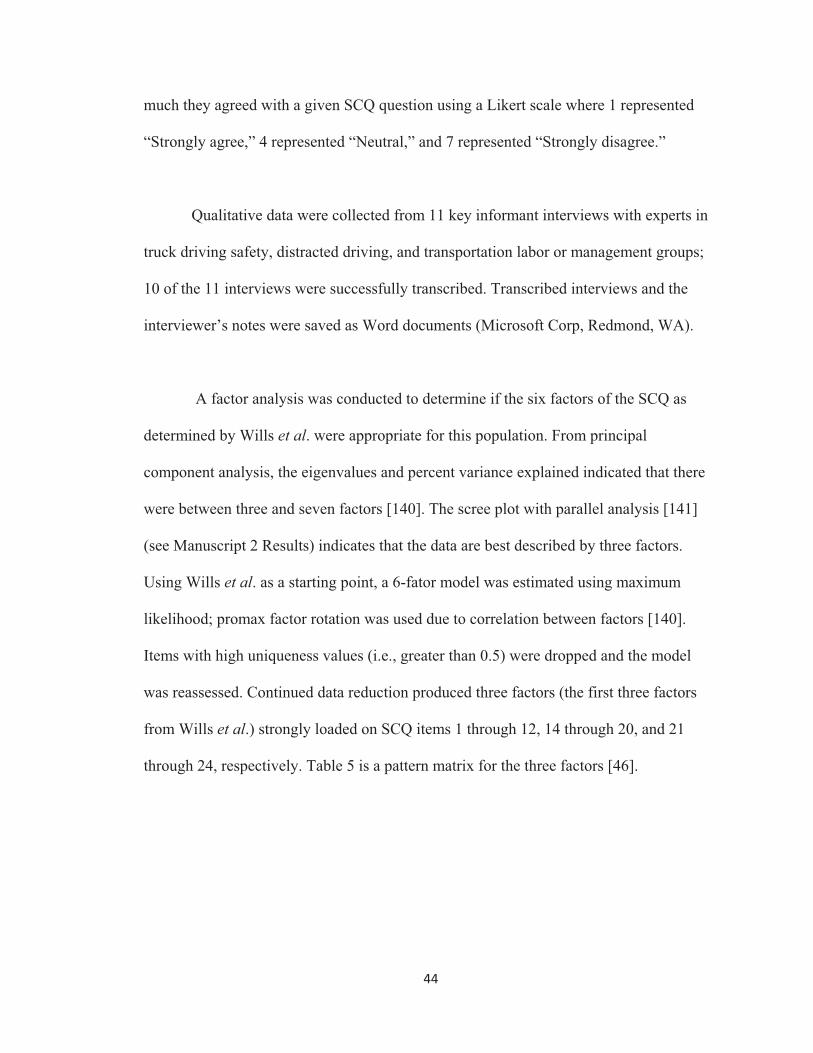
44��
much they agreed with a given SCQ question using a Likert scale where 1 represented
“Strongly agree,” 4 represented “Neutral,” and 7 represented “Strongly disagree.”
Qualitative data were collected from 11 key informant interviews with experts in
truck driving safety, distracted driving, and transportation labor or management groups;
10 of the 11 interviews were successfully transcribed. Transcribed interviews and the
interviewer’s notes were saved as Word documents (Microsoft Corp, Redmond, WA).
A factor analysis was conducted to determine if the six factors of the SCQ as
determined by Wills �����. were appropriate for this population. From principal
component analysis, the eigenvalues and percent variance explained indicated that there
were between three and seven factors [140]. The scree plot with parallel analysis [141]
(see Manuscript 2 Results) indicates that the data are best described by three factors.
Using Wills �����. as a starting point, a 6-fator model was estimated using maximum
likelihood; promax factor rotation was used due to correlation between factors [140].
Items with high uniqueness values (i.e., greater than 0.5) were dropped and the model
was reassessed. Continued data reduction produced three factors (the first three factors
from Wills �����.) strongly loaded on SCQ items 1 through 12, 14 through 20, and 21
through 24, respectively. Table 5 is a pattern matrix for the three factors [46].

45��
Table 5. Pattern matrix for three factors for the SCQ. Chronbach’s alpha for reliability of
each factor is listed.
Items and Labels 1 2 3 Factor 1- Communications and Pressure (� = 0.94) 1. Changes in working procedures and their effects on safety are effectively communicated to workers 0.74 2. Employees are consulted when changes to driver safety practices are suggested 0.79 3. Employees are told when changes are made to the working environment such as the vehicle, maintenance or garaging procedures 0.74 4. Safety policies relating to the use of motor vehicles are effectively communicated to the workers 0.87 5. Safety procedures relating to the use of motor vehicles are complete and comprehensive 0.84 6. An effective documentation management system ensures the availability of safety procedures relating to the use of motor vehicles 0.82 7. Safety problems are openly discussed between employees and management/supervisors 0.66 8. Safety procedures relating to the use of motor vehicles match the way tasks are done in practice 0.66 9. Employees can discuss important driver safety policy issues 0.51 10. Employees are consulted for suggested vehicle/driver safety improvements 0.72 11. Employees can identify relevant procedures for each job 0.62 12. Employees can express views about safety problems 0.50 Factor 2- Work Pressure (� = 0.93) 14. Time schedules for completing work projects are realistic 0.85 15. There is sufficient 'thinking time' to enable employees to plan and carry out their work to an adequate standard 0.88 16. Workload is reasonably balanced 0.87 17. There are enough employees/drivers to carry out the required work 0.76 18. Changes in workload, which have been made on short notice, can be dealt with in a way that does not affect driver safety 0.80 19. When driving employees have enough time to carry out their tasks 0.82 20. Problems that arise outside of employees' control can be dealt with in a way that does not affect driver safety 0.61 Factor 3- Management Commitment (� = 0.95) 21. Management are committed to driver safety 0.86 22. Management are committed to motor vehicle safety 0.85 23. Driver safety is central to managements' values and philosophies 0.82 24.Driver safety is seen as an important part of fleet management in this organization 0.70
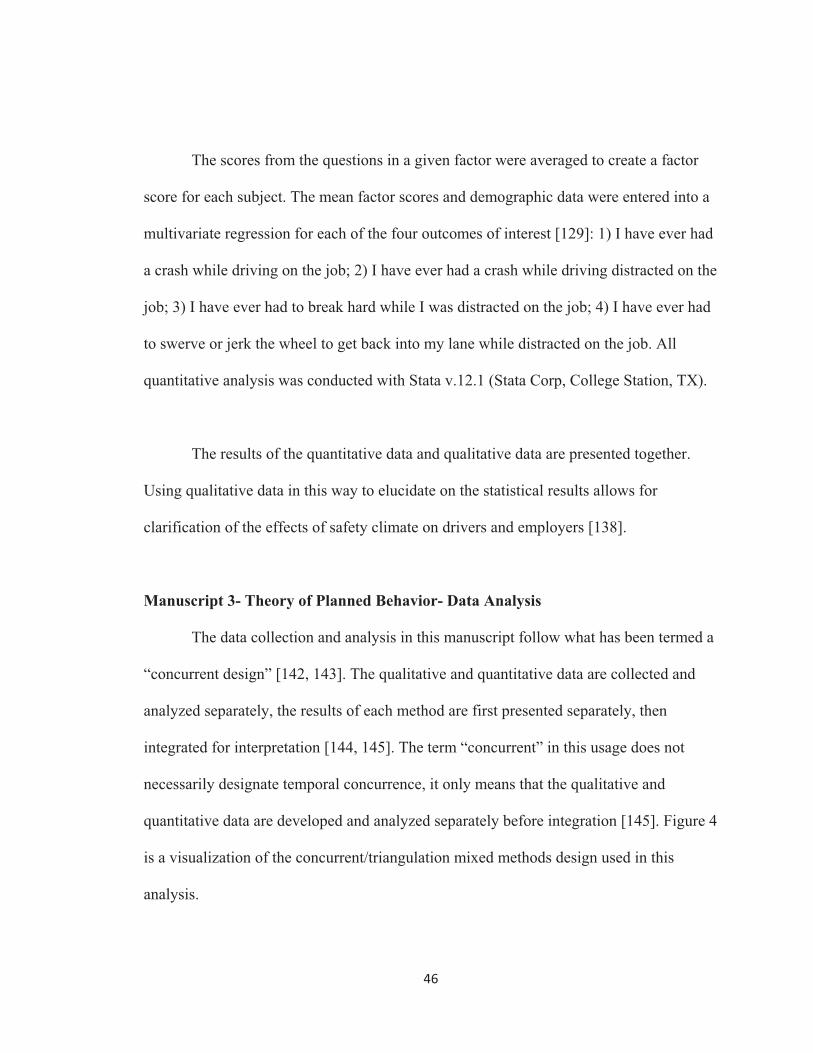
46��
The scores from the questions in a given factor were averaged to create a factor
score for each subject. The mean factor scores and demographic data were entered into a
multivariate regression for each of the four outcomes of interest [129]: 1) I have ever had
a crash while driving on the job; 2) I have ever had a crash while driving distracted on the
job; 3) I have ever had to break hard while I was distracted on the job; 4) I have ever had
to swerve or jerk the wheel to get back into my lane while distracted on the job. All
quantitative analysis was conducted with Stata v.12.1 (Stata Corp, College Station, TX).
The results of the quantitative data and qualitative data are presented together.
Using qualitative data in this way to elucidate on the statistical results allows for
clarification of the effects of safety climate on drivers and employers [138].
Manuscript 3- Theory of Planned Behavior- Data Analysis
The data collection and analysis in this manuscript follow what has been termed a
“concurrent design” [142, 143]. The qualitative and quantitative data are collected and
analyzed separately, the results of each method are first presented separately, then
integrated for interpretation [144, 145]. The term “concurrent” in this usage does not
necessarily designate temporal concurrence, it only means that the qualitative and
quantitative data are developed and analyzed separately before integration [145]. Figure 4
is a visualization of the concurrent/triangulation mixed methods design used in this
analysis.

47��
Figure 4. Diagram of the analysis of key informant interviews (Qual) and analysis of
surveys (Quan) in Manuscript 3. This visualization is based off Plano-Clark’s and
Creswell’s interpretation [146](p. 380) of Luzzo’s mixed methods analysis [145].
As described above, key informant interviews were used to elucidate the
components of the TPB relevant to distracted driving in an occupational population. This
is depicted in Figure 4 as the line from “Qual data collection” to “Quan data collection.”
Transcribed interviews were saved as Word documents for qualitative analysis. Interview
transcripts were analyzed for themes surrounding performance of distracting activities.
Specifically, data on social norms and perceived behavioral control were closely assessed
using qualitative methods. Online survey data of IBT members were downloaded from
SurveyMonkey into Stata statistical software. Of the 440 subjects who entered the survey,
79 (18%) were screened out because they did not drive the appropriate vehicle. All
subjects (n=277) answered TPB questions on “texting while driving” and those drivers
who indicated that they used a dispatch device in their work (n=153) answered questions

48��
on the TPB concerning “interacting with a dispatch device.” See Appendix 5 for a more
detailed description of how these sample sizes were produced.
The TPB constructs were the independent variables and were scored as described
by Montaño and Kasprzyk [52]. Attitude was assessed using the average of three
semantic differential 7-point bipolar scales ranging from 1 to 7 with endpoints including
“very harmful – very beneficial,” “very unpleasant – very pleasant,” and “very bad – very
good;” intention was measured using a single 7-point bipolar scale (1 through 7) with
endpoints “Definitely will – Definitely will not,” that is, an increased intention score
indicates that a driver had less intention to undertake a given behavior; perceived
behavioral control was assessed using a multi-item indirect assessment by multiplying
control beliefs (scored on a bipolar 7-point scale) with times perceived power (scored -3
to +3 on a bipolar scale); social norm was assessed with a multi-item indirect assessment
multiplying the normative belief (scored -3 to +3) times the motivation to comply (score
1 to 7). The Cronbach’s alpha for reliability of the texting and dispatch device use scales
were 0.71 and 0.84, respectively.
Exploratory data analysis was conducted on the TPB constructs separately for
both the texting and dispatch device populations [147]. Means and standard deviations
were generated for each TPB construct and because the range of scores was small,
frequency tables and histograms were also generated for visual assessment of the data.
Although previous studies on driver behavior and the TPB have used mean scores to
analyze each TPB construct [35, 56], our data were not normally distributed and clustered
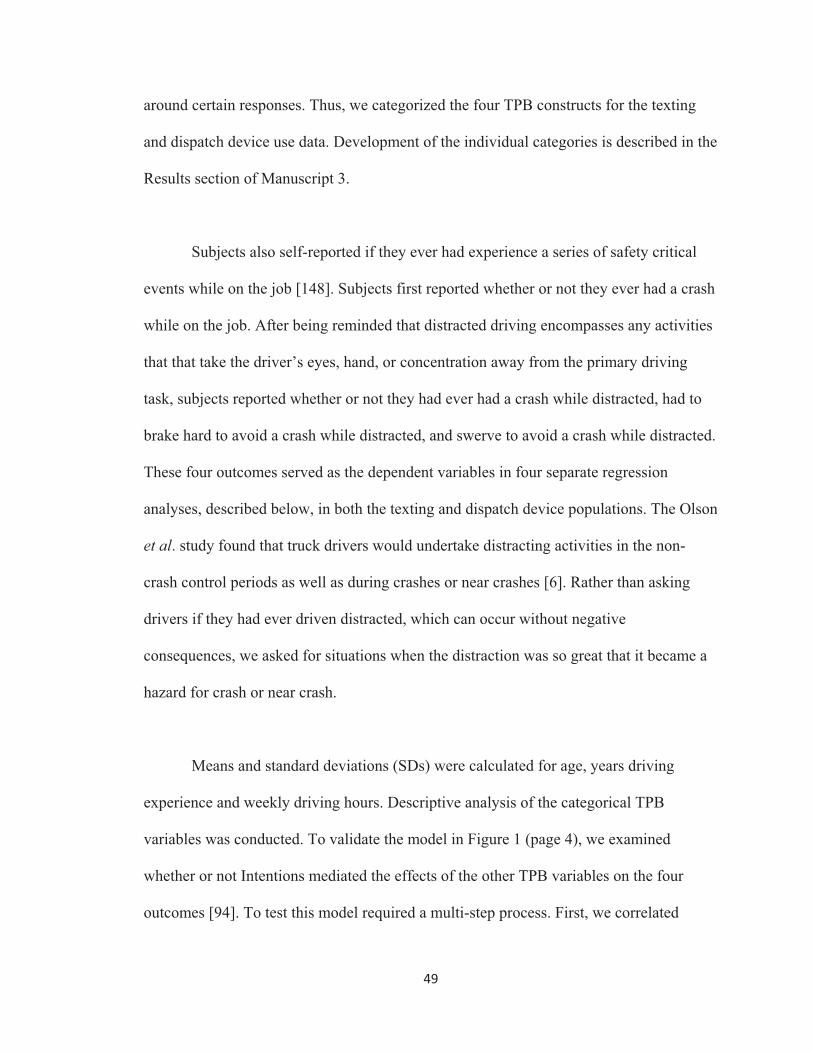
49��
around certain responses. Thus, we categorized the four TPB constructs for the texting
and dispatch device use data. Development of the individual categories is described in the
Results section of Manuscript 3.
Subjects also self-reported if they ever had experience a series of safety critical
events while on the job [148]. Subjects first reported whether or not they ever had a crash
while on the job. After being reminded that distracted driving encompasses any activities
that that take the driver’s eyes, hand, or concentration away from the primary driving
task, subjects reported whether or not they had ever had a crash while distracted, had to
brake hard to avoid a crash while distracted, and swerve to avoid a crash while distracted.
These four outcomes served as the dependent variables in four separate regression
analyses, described below, in both the texting and dispatch device populations. The Olson
�����. study found that truck drivers would undertake distracting activities in the non-
crash control periods as well as during crashes or near crashes [6]. Rather than asking
drivers if they had ever driven distracted, which can occur without negative
consequences, we asked for situations when the distraction was so great that it became a
hazard for crash or near crash.
Means and standard deviations (SDs) were calculated for age, years driving
experience and weekly driving hours. Descriptive analysis of the categorical TPB
variables was conducted. To validate the model in Figure 1 (page 4), we examined
whether or not Intentions mediated the effects of the other TPB variables on the four
outcomes [94]. To test this model required a multi-step process. First, we correlated
50��
Norms, PBC, and Attitudes to Behavioral Intentions using logistic regression for both
texting and dispatch device use [35, 56]. Second, univariate logistic regression was used
to analyze the association of each of the four TPB constructs for texting and distracted
driving with the four crash and near crash outcomes. Univariate logistic regression was
also conducted for demographic data that the drivers reported: gender, age, driving
experience, and weekly driving hours. Third, multivariate regressions were first
conducted without Intentions, then including Intentions to see if it attenuated the effects
of the other three TPB constructs, that is, did the ORs for Norms, PBC, and Attitudes
decrease and what, if any, effect was there on the significance of the ORs. A change in
the ORs towards 1.0 and/or decreasing significance of the p-values of the ORs was
considered to be a mediation effect. Control variables in the multivariate models included
on those variables that had p-values � 0.10. Entering covariates with p-values less than
0.2 has been used in model selection in the past [94]; however, using 0.10 as a cutoff is a
trade-off between including relevant covariates and model performance [119].
Qualitative and quantitative results are presented separately. Results from both
methods are then brought together for meta-inference, defined by Tashakkori and Teddlie
as “integration of the inferences that are obtained on the basis of QUAL and QUAN
strands of a mixed methods study” (p. 710) [149]. The quantitative and qualitative data
will be compared for where they agree and where they differ.
51��
Manuscript 1: Effects of State Policies on Fatalities Involving Distracted Truck
Drivers
Abstract
In order to prevent distracted driving-related crashes, states have banned texting
and handheld cell phone use for drivers. The present study analyzes the impact of these
regulations on state-level fatalities rates for both truck drivers and all vehicle occupants
in distraction-involved truck crashes. First, we described each fatality count by-state and
by-year using data from the Fatality Analysis Reporting System from 2000 through 2010.
A multi-level longitudinal Poisson model was fit to assess the impact of state bans for
texting or handheld cell phone use on distraction-related truck crash fatality rates. These
results revealed that fatality rates have been decreasing since 2007. We found that there
was no effect of state bans on distraction-involved truck crash fatality rates. A nationwide
ban on texting for commercial truck drivers implemented in 2010 was associated with a
continued decrease in fatality rates, yet further analysis will be necessary to assess the
impact of this regulation on distraction-involved truck fatality rates.
Introduction
Although motor vehicle fatality rates have been decreasing for the past few
decades [150], the rates and counts of fatalities involving distracted driving (DD) have
been increasing since the early 2000s [93]. An emerging contributor to DD crashes and
fatalities is cell phone use while driving (CPWD) [151], specifically, reading, writing,
and sending SMS messages with a cellular phone (a.k.a., text messaging, or texting) [14].

52��
In addition to these general electronic communication distractions, commercial truck
drivers may face occupational distractions, including keeping logs and monitoring a
dispatch device [6]. Both states and the federal government have implemented
regulations to decrease DD for all drivers and commercial drivers. This study will
quantify fatalities in the United States (U.S.) and examine the effects, if any, of state and
federal regulations on distraction-involved truck crashes.
������� � �����
Driving involves primary, secondary, and tertiary tasks [1]. Primary tasks are
those that only involve vehicle direction and speed, such as steering and breaking.
Secondary tasks support operation of the vehicle depending on the situation, such as
using turn signals, checking the speedometer, and turning on the lights. Anything not
included as primary or secondary task for vehicle operation is considered a tertiary task.
Tertiary tasks include a wide range of activities, such as interacting with passengers,
smoking, eating, and cell phone use [6, 7, 152]. Distracted driving (DD) is then defined
as any activity that takes the drivers eyes, hands, or concentration away from the primary
task of driving [153].
Although DD is not a novel risk to drivers [154], the recent increase in cell phone
use while driving (CPWD) has lead to a rise in DD-related motor vehicle crashes (MVCs)
[11, 14]. Estimates are that drivers use handheld cell phones approximately 6% of driving
time [8, 10]. Two of the most dangerous distractions that drivers can undertake with a
phone are texting while driving and dialing the phone [12, 13]. These tasks involve

53��
manual, visual, and cognitive distractions, and have been shown to produce the most
unsafe driving behavior in both simulator [155] and in-vehicle studies [6].
������������������������ ����������
The leading cause of death for all American workers is MVC [156]. The MVC
fatality rate is 3.7 deaths per every billion vehicle miles traveled (VMT) [32] for truck
drivers. In the U.S., commercial motor vehicles are those vehicles that a) have a gross
vehicle weight rating of more than 10,000 pounds; b) have a gross combination weight
rating of 26,001 pounds or more; c) are designed to transport 16 or more passengers; or
d) are of any size and transports hazardous materials [25]. Aside from distractions faced
by non-commercial drivers, commercial truck drivers face additional work- and vehicle-
specific distractions that raise their crash risk. A series of studies by the Virginia Tech
Transportation Institute has enumerated the unique occupational distractions faced by
commercial drivers, such as using a CB radio, and interacting with a dispatch computer
[4, 6]. These studies generated a thorough catalog of odds ratios for crashes and near
crashes for each distracting activity.
In the occupational setting, it is possible that truck drivers have less freedom over
the decision to undertake distracting activities while driving [36]. A study of occupational
drivers found that increased work pressures were correlated with driver distractions [47].
It is possible that professional drivers are being required, either explicitly or implicitly, to
undertake tertiary activities while driving to increase work efficiency. Whether or not
they have control over it, drivers who mainly drive for work purposes are more likely to
54��
report CPWD than drivers who mainly drive for non-occupational reasons [35]. An
increased number of potential distractions and workplace pressures to attempt distractions
while driving make DD an important risk factor for occupational injury and fatality. It is
unknown what the burden of DD-involved truck crashes is in the U.S. or globally.
Due to their size and mass, crashes involving large trucks pose a greater threat to
other vehicle occupants and pedestrians. For example, in 2009, among fatal crashes
involving a large truck and a passenger vehicle, there were only 18 fatalities to truck
occupants compared to 1,022 fatalities to occupants of the passenger vehicles [157]. In
multi-vehicle crashes, the mass of the truck poses an additional danger to occupants of
other vehicles and somewhat protects the truck driver from injury [158]. In fact, the ratio
of mass of two vehicle involved in a crash is predictive of fatality risk for occupants in
the two vehicles [34, 158]. Therefore, to fully understand the burden of DD-related truck
crashes, it is important to examine fatalities to both truck drivers and other vehicle
occupants involved in a given crash.
������� �������+�*�
In an attempt to address DD, states have passed laws restricting texting while
driving and handheld CPWD. New York was the first state to pass a texting ban for all
drivers in 2001, and as of April 1, 2013, 39 states and the District of Columbia (D.C.)
have passed texting bans [70]. Handheld CPWD is banned in 10 states and D.C.
Although research has shown that there is no difference in crash risk comparing talking
on a handheld versus hands-free phones [22, 24], no state currently bans all CPWD [70].
55��
The texting bans in 36 of the 40 jurisdictions have primary enforcement; 9 of 11
jurisdictions have primary enforcement for the handheld CPWD ban [70]. Some states
without comprehensive texting or handheld CPWD bans have partial bans for given
populations, such as novice drivers and bus drivers; no state has a ban specific to
commercial truck drivers [70].
Texting and handheld cell phone bans are recent legal solutions to the growing
hazards of CPWD. McCartt and colleagues studied the effect of handheld cell phone bans
in New York, Washington, D.C, and Connecticut and found immediate reductions in
usage rates, but had mixed success in the long-term [159]. The Governor’s Highway
Safety Association summarized the existing literature and found that there is no evidence
to suggest that texting or handheld CPWD bans have reduced crashes [2]. A recent study
by Lim and Chi found that handheld CPWD laws were associated with a reduction in
total crash fatality rates for drivers in age 18 – 35 cohorts, but had no effect for older
drivers [160].
In September 2009, the Federal Motor Carrier Safety Administration (FMCSA) of
the U.S. Department of Transportation issued a regulation entitled “Limiting the Use of
Wireless Communication Devices,” which banned commercial truck and bus drivers
from text messaging-while-driving [161]. In the final rule issued by the FMCSA, which
went into effect in October 2010, drivers who are found to be texting-while-driving face
up to a $2,750 fine and their employers are liable for a fine up to $11,000 [75]. Unlike the
patch-work state DD laws, this regulation went into effect for the U.S. at one set time and
56��
covered every state equally. However, in the text of the Final Rule, states were given up
to three years to implement sufficient enforcement of the regulation. A review of the
existing literature did not yield any prior studies on the implementation of this regulation
state-by-state.
Materials and Methods
���������������
The Fatal Accident Reporting System (FARS) is an annual database published by
the National Highway Transportation Administration (NHTSA) that includes all MVCs
that resulted a fatality in a given year [162]. Data were collected from 2000, when the
gross vehicle weight rating (GVWR) variable was first available, through 2010. Data
were downloaded from the FARS Encyclopedia (http://www-
fars.nhtsa.dot.gov/Main/index.aspx) into Stata v. 12.1 (Stat Corp., College Station, TX).
Using FARS, fatal crashes involving medium (GVWR from 10,000 to 26,000
pounds) and heavy (GVWR greater than 26,000 pounds) commercial trucks were
identified [87]. The Seating Position variable was used to identify the truck drivers.
Because of a change in the FARS database for 2010, separate methods were necessary to
identify those truck drivers who were distracted for the 2000 through 2009 data and in the
2010 data. For the period from 2000 through 2009, the Related Factors- Driver Level
variable was used. Table 3 displays the values, drawing on a method described by Wilson
and Stimpson, to indicate a distracted driver [14]. The Related Factors- Driver Level was
deleted from FARS in 2010, so the Driver Condition at Crash Time and Driver Distracted
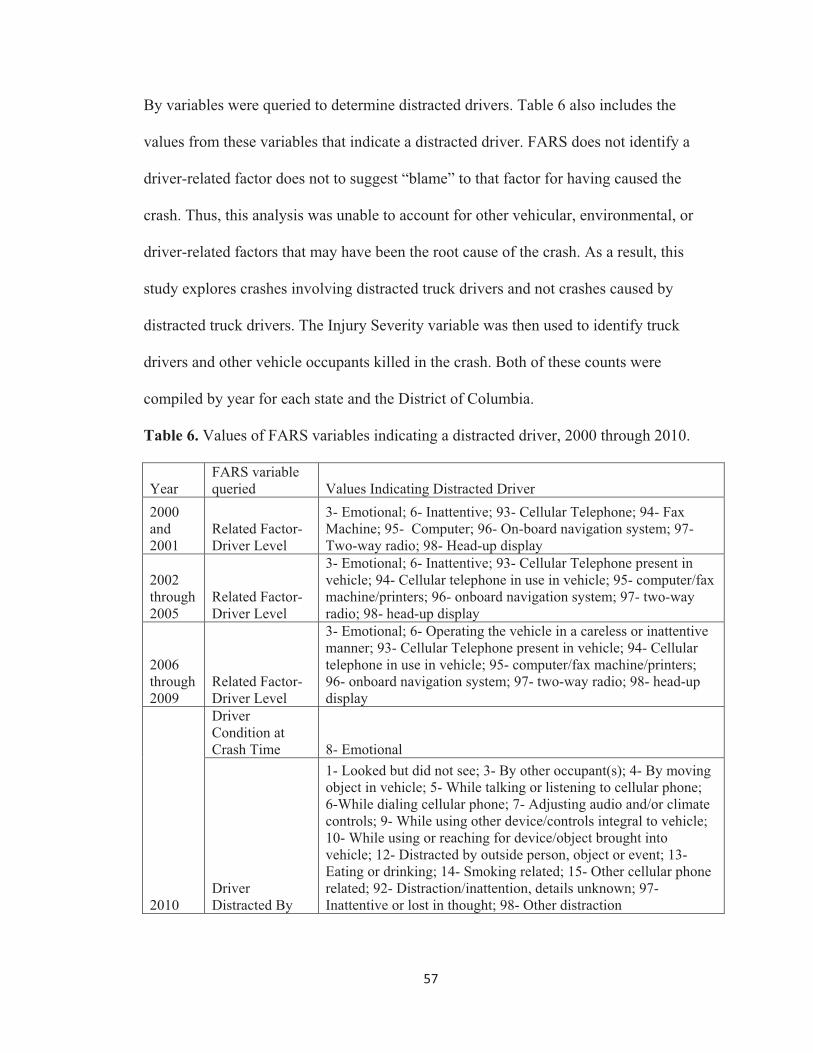
57��
By variables were queried to determine distracted drivers. Table 6 also includes the
values from these variables that indicate a distracted driver. FARS does not identify a
driver-related factor does not to suggest “blame” to that factor for having caused the
crash. Thus, this analysis was unable to account for other vehicular, environmental, or
driver-related factors that may have been the root cause of the crash. As a result, this
study explores crashes involving distracted truck drivers and not crashes caused by
distracted truck drivers. The Injury Severity variable was then used to identify truck
drivers and other vehicle occupants killed in the crash. Both of these counts were
compiled by year for each state and the District of Columbia.
Table 6. Values of FARS variables indicating a distracted driver, 2000 through 2010.
Year FARS variable queried Values Indicating Distracted Driver
2000 and 2001
Related Factor- Driver Level
3- Emotional; 6- Inattentive; 93- Cellular Telephone; 94- Fax Machine; 95- Computer; 96- On-board navigation system; 97- Two-way radio; 98- Head-up display
2002 through 2005
Related Factor- Driver Level
3- Emotional; 6- Inattentive; 93- Cellular Telephone present in vehicle; 94- Cellular telephone in use in vehicle; 95- computer/fax machine/printers; 96- onboard navigation system; 97- two-way radio; 98- head-up display
2006 through 2009
Related Factor- Driver Level
3- Emotional; 6- Operating the vehicle in a careless or inattentive manner; 93- Cellular Telephone present in vehicle; 94- Cellular telephone in use in vehicle; 95- computer/fax machine/printers; 96- onboard navigation system; 97- two-way radio; 98- head-up display
2010
Driver Condition at Crash Time 8- Emotional
Driver Distracted By
1- Looked but did not see; 3- By other occupant(s); 4- By moving object in vehicle; 5- While talking or listening to cellular phone; 6-While dialing cellular phone; 7- Adjusting audio and/or climate controls; 9- While using other device/controls integral to vehicle; 10- While using or reaching for device/object brought into vehicle; 12- Distracted by outside person, object or event; 13- Eating or drinking; 14- Smoking related; 15- Other cellular phone related; 92- Distraction/inattention, details unknown; 97- Inattentive or lost in thought; 98- Other distraction

58��
�����#�����
Descriptive analysis was conducted on fatalities involving truck driver and all
vehicle occupants in distraction-involved truck crashes. Data were analyzed by raw
counts and per billion VMT, an exposure commonly used to calculate motor vehicle
crash rates [95, 96]. Since this study specifically examines crashes involving trucks, rate
calculations were conducted using diesel VMTs, consistent with prior research, to
provide a more precise estimate of exposure [87]. Data on annual state VMTs was
obtained from the Department of Transportation’s Federal Highway Administration
(FHWA) [97]. State fatality rate data were described across states and across years. To
compare within- versus between-state variation an analysis of variance (ANOVA) was
used [100].
To analyze the impact of distracted driving laws on fatality rates, a multi-level
longitudinal Poisson model was fit, where the state was the first level and the U.S. was
the second level. The offset for the Poisson model [94, 102] was the log of diesel VMT in
billions of miles. Aside from state texting-while-driving bans, state handheld cell phone
bans, and the federal regulation banning texting for all commercial truck drivers, we
collected other variables that have been shown to influence DD crashes, or motor vehicle
fatality rates. Table 7 lists these variables, their distributions, and sources. I will briefly
describe each of them below.

59��
Table 7. Distribution of and sources of each variable used in the model.
Variable Distribution Source Fatalities Count FARS- NHTSA State texting laws Binary GHSA State handheld cell phone laws Binary GHSA Vehicle miles traveled Continuous DOT- Traffic Safety Facts Cell phone saturation Continuous FCC/Census Bureau State unemployment rate Continuous Census Bureau State ethanol consumption Continuous NIAAA [111] State 0.08 BAC law Binary DOT- Traffic Safety Facts Highway capital expenditures Continuous DOT- Traffic Safety Facts Per capita income Continuous Census Bureau Population density Continuous Census Bureau Primary seat belt law Binary DOT [112] Truck length restrictions Categorical Rand McNally Motor Carrier’s Road Atlas Rural truck speed limit Categorical Rand McNally Motor Carrier’s Road Atlas
Cell phone saturation is the number of cell phone subscriptions per capita in a
state in a given year and describes the growth in cell phones across the study period [14,
108]. Data on cell phones in a state came from annual reports by the FCC [109] and state
population data were downloaded from the Census Bureau. To analyze the effect of the
economy on fatality rates [110], annual state unemployment rates were downloaded from
the Census Bureau, as were median per capita incomes, standardized to 2011 U.S.
dollars. Population density was calculated using annual population and total area, both
data also came from the Census Bureau. Because I did not describe crashes as urban or
rural, population density serves as an approximation of urbanicity within a state [87].
Primary enforcement of driver seatbelt laws reduces fatality rates in all crashes
[113]; thus this variable was included as a potential confounder. A report on primary and
secondary enforcement of seatbelt laws from NHTSA provided information on the years
that states enacted primary seatbelt enforcement [112]. I only examined primary

60��
enforcement for drivers, because data were not available on all state laws for primary and
secondary enforcement of passenger seatbelt use. By the end of the study period, all
states had primary seat belt laws.
Two variables were included to account for the effects of drunk driving on fatality
rates. The first was a binary variable on whether or not a state used 0.08 mg/dl blood
alcohol content (BAC) as the threshold for driving while intoxicated (DWI) or driving
under the influence (DUI). These data came from the DOT’s annual Traffic Safety Facts
reports. Second, per capita alcohol consumption, measured in gallons of ethanol, was
obtained from a report from the National Institute on Alcohol Abuse and Alcoholism
[111]. Capital expenditures represent the investment that a state makes in roadway
infrastructure [87]. These data were also obtained from the Traffic Safety Facts reports
and converted to 2010 U.S. dollars. Traffic Safety Facts data were only available through
2010.
All the previous data are publically available online and free to download. Two
other variables that impacted fatality rates in the study of truck drivers by Neeley and
Richardson were maximum truck length and rural truck speed limit [87]. States are
allowed to set both the maximum speed on highways and the maximum allowable length
for trucks. The data were obtained from the annual editions of the Motor Carrier’s Road
Atlas published by Rand McNally. Examining the data, they naturally broke down into
categories. For maximum truck length, data were categorized as 1) under 53 feet; 2) 53
feet or 53 feet, six inches; 3) 57 feet, four inches or 57 feet, six inches; and 4) 59 feet or

61��
longer. State speed limits were in 5 mile per hour (mph) intervals from 55 mph to 75
mph. I specifically examined “rural truck speed limits” in the analysis: some states have
higher speed limits for passenger vehicles versus large trucks and buses; furthermore,
some states have higher speed limits in rural areas versus urban areas [87].
Because the Rand McNally atlases were not intended to be used for surveillance,
the 2007 through 2009 editions were missing data on rural truck speed limits. Internet
searchers produced some missing data: for example, Virginia changed the speed limits by
legislative action in from 65 mph in 2009 to 70 mph in 2010 [114]. I imputed the missing
data using a method developed by Royston for missing categorical data [115, 116].
Although this method worked, data highly varied between categories year-to-year within
a state, which did not reflect the infrequent changes seen in all other years of the study
period. As a result, I opted to carry the 2006 observations forward to 2009, a technique
for missing data that is commonly used in pharmaceutical studies [117], and noted the
limitations of doing so in the manuscript.
Data were compiled by state and by year into a longitudinal database [94].
Univariate analyses were conducted for the bans as well as covariates that have
previously been shown to affect crash fatality rates. Multivariate regression models were
fit for both truck driver fatality rates and fatality rates for all vehicle occupants. Two
nested models were fit for each outcome: Model 1was only those variables that were
statistically significant (p � 0.10) in univariate regression; Model 2 consisted of the

62��
variables in Model 1 plus the texting and handheld cell phone bans. The nested models
were compared with a likelihood ratio test [94, 120].
In univariate and multivariate analyses all covariates were examined using fixed
effects, other than cell phone saturation, which used random effects [107]. The random
effects model for cell phone saturation had both a significant regression coefficient and
reduced log likelihood versus the fixed effects model. Analysis was conducted using
Stata v 12.1 (College Station, TX).
Results
���������#�����
From 2000 through 2010, there were 1,007 fatalities to truck drivers who were
distracted at the time of the crash. The fatality rate for this period was 0.321 per billion
diesel VMT. For all vehicle occupants in crashes involving distracted truck drivers, there
were 3,942 fatalities for a rate of 1.101 per billion VMT. Table 8 has descriptive data on
fatality counts and rates by state and by year. ANOVA for both truck driver fatality rates
and fatality rates to all vehicle occupants found much more variation between than within
states (F(50,510) = 14.51, p<0.001 and F(50,510) = 11.47, p<0.001, respectively). Table 9 is an
example of the variation between states, displaying the highest and lowest state fatality
counts and rates over the study period. Figures 5 and 6 show fatality rates by year for
truck drivers and all vehicle occupants, respectively.

63��
Table 8. Descriptive Data on Fatality Counts and Rates (per Billion VMT) for Truck
Drivers and All Vehicle Occupants in Distraction-Related Truck Crashes (Min-Max=
Minimum – Maximum; SD = Standard Deviation; IQR = Interquartile Range)
Truck driver fatalities All vehicle occupant fatalities Mean (SD) Min-Max IQR Mean (SD) Min-Max IQR
Count per state 19.7 (25.8) 0 – 134 20 77.3
(106.8) 0 – 406 63
Rate per state 0.321 (0.33) 0 – 1.579 0.41 1.101 (0.95) 0 – 5.475 0.97
Count per year 91.6 (21.6) 53 – 129 35 358.4
(82.9) 202 – 498 143
Rate per year 0.303 (0.07) 0.179 – 0.405 0.13 1.185
(0.25) 0.682 – 1.632 0.43
Table 9. Lowest and Highest State Fatality Counts and Rates (per Billion VMT) for All
Vehicle Occupants in Crashes Involving Distracted Truck Drivers, 2000 – 2010.
Lowest Highest State Count State Rate State Count State Rate DC 0 DC 0.00 TX 406 OK 5.48 HI 2 UT 0.04 OK 405 PA 2.70 NH 2 GA 0.10 PA 399 MT 2.66 RI 2 MI 0.15 CA 383 MO 2.59 UT 2 OR 0.15 MO 257 NM 2.34 ND 4 AL 0.18 FL 160 KY 2.30 SD 4 NH 0.19 KY 156 KS 2.14 VT 4 OH 0.25 NM 119 MD 2.02 AR 5 ND 0.29 NC 103 ME 1.78 OR 7 SD 0.30 LA/MD 101 MS 1.56

64��
Figure 5. Yearly fatality rates for commercial truck drivers in DD-related truck crashes.
Dashed-line is mean rate across the study period (0.321 per BVMT).
Figure 6. Yearly fatality rates for all vehicle occupants in DD-related truck crashes.
Dashed-line is mean rate across the study period (1.101 per BVMT).
65��
,�������#�����
Table 10 displays results of univariate regression on truck driver fatality
rates and fatality rates for all vehicle occupants. For truck driver fatality rates, only
maximum rural truck speed limit and maximum truck length were significant predictors
in univariate regression. For all vehicle occupants in distracted driving-involved truck
crashes, rural truck speed limit, maximum truck length, percent cell phone saturation,
unemployment rate, and the federal ban on texting for truck drivers were all significant
univariate predictors.
Table 11 displays the results of multivariate regression on truck driver fatality
rates. Although states allowing the longest trucks and the highest rural speeds have near
significant increases in fatality rates, no significant differences in adjusted IRRs were
found. State and federal distraction laws were not significant predictors of fatalities,
although the FMCSA ban approaches significance in Model 2. The likelihood ratio test
found that there was no significant difference between Model 1 and Model 2. Table 12
displays the results of multivariate regression on fatality rates for all vehicle occupants in
distraction-involved crashes. Speed limit, truck length, unemployment rate, and cell
phone saturation were all not significant; however, the 2010 federal ban on texting-while
driving for commercial truck drivers was associated with a decrease in the fatality
incident rate by 41%. When we add state texting and handheld cell phone bans in Model
2, the 2010 ban was associated with a 49% decreased incident rate. A likelihood ratio test
found that Model 2, with the added state texting and handheld CPWD bans, resulted in
statistically improved model fit (likelihood ratio �²=6.36, p < 0.05).
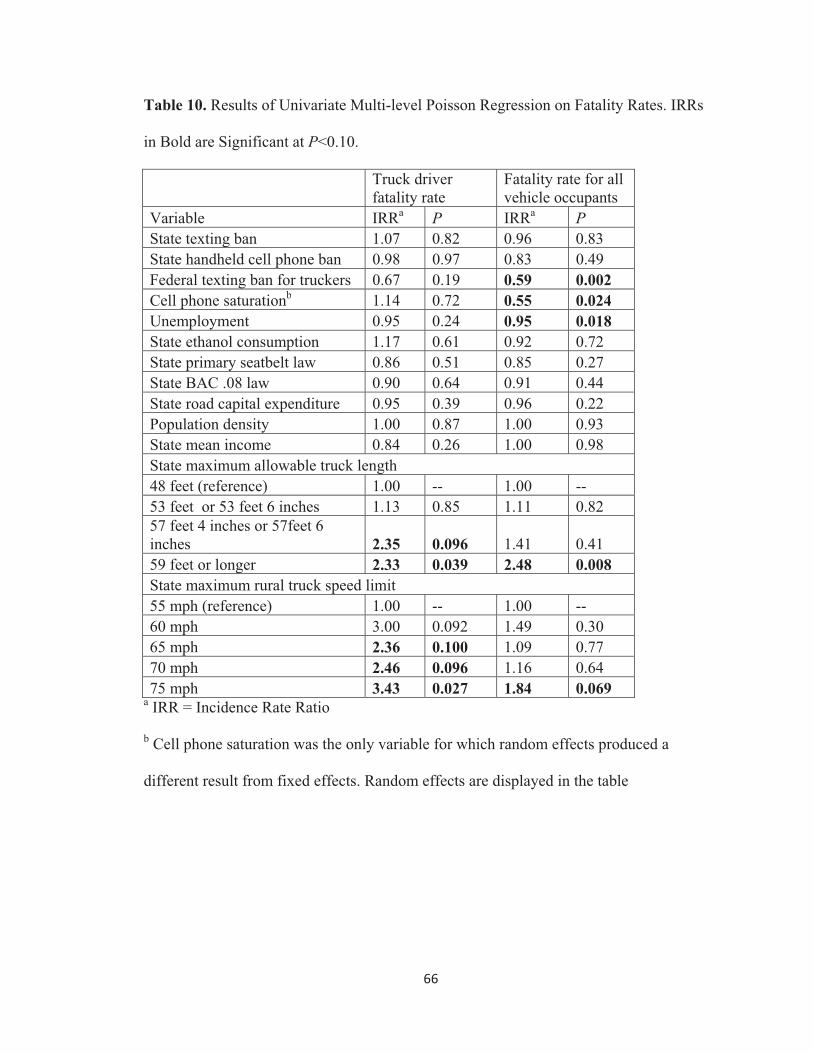
66��
Table 10. Results of Univariate Multi-level Poisson Regression on Fatality Rates. IRRs
in Bold are Significant at �<0.10.
Truck driver fatality rate
Fatality rate for all vehicle occupants
Variable IRRa �� IRRa ��State texting ban 1.07 0.82 0.96 0.83 State handheld cell phone ban 0.98 0.97 0.83 0.49 Federal texting ban for truckers 0.67 0.19 0.59 0.002 Cell phone saturationb 1.14 0.72 0.55 0.024 Unemployment 0.95 0.24 0.95 0.018 State ethanol consumption 1.17 0.61 0.92 0.72 State primary seatbelt law 0.86 0.51 0.85 0.27 State BAC .08 law 0.90 0.64 0.91 0.44 State road capital expenditure 0.95 0.39 0.96 0.22 Population density 1.00 0.87 1.00 0.93 State mean income 0.84 0.26 1.00 0.98 State maximum allowable truck length 48 feet (reference) 1.00 -- 1.00 -- 53 feet or 53 feet 6 inches 1.13 0.85 1.11 0.82 57 feet 4 inches or 57feet 6 inches 2.35 0.096 1.41 0.41 59 feet or longer 2.33 0.039 2.48 0.008 State maximum rural truck speed limit 55 mph (reference) 1.00 -- 1.00 -- 60 mph 3.00 0.092 1.49 0.30 65 mph 2.36 0.100 1.09 0.77 70 mph 2.46 0.096 1.16 0.64 75 mph 3.43 0.027 1.84 0.069
a IRR = Incidence Rate Ratio
b Cell phone saturation was the only variable for which random effects produced a
different result from fixed effects. Random effects are displayed in the table

67��
Table 11. Multivariate Multi-level Poisson Regression on Truck Driver Fatality Rate in
Crashes Involving Distracted Truck Drivers.
Model 1 Model 2 Variable IRRa P value IRRa P value Constant 0.10 < 0.001 0.99 < 0.001 Speed limit- 55 mph 1.00 (reference) -- 1.00 (reference) -- 60 mph 2.88 0.097 2.97 0.089 65 mph 2.39 0.089 2.42 0.089 70 mph 2.11 0.17 2.10 0.17 75 mph 2.51 0.11 2.65 0.091 Maximum length- 48 feet 1.00 (reference) -- 1.00 (reference) -- 53 feet or 53 feet 6 inches 1.03 0.96 1.02 0.97 57 feet 4 inches or 57feet 6 inches
2.04 0.19 1.91 0.24
59 feet or longer 2.18 0.056 2.13 0.066 State text ban 1.73 0.13 State handheld cell ban 0.56 0.31 Federal texting ban for truckers
0.52 0.06
a IRR = Incident rate ratio
Table 12. Multivariate Multi-level Poisson Regression on Fatality Rate for All Vehicle
Occupants in Crashes Involving Distracted Truck Drivers.
Model 1 Model 2 Variable IRRa P value IRRa P value Constant 0.94 < 0.001 1.02 < 0.001 Speed limit- 55 mph 1.00 (reference) -- 1.00 (reference) -- 60 mph 1.39 0.40 1.43 0.35 65 mph 1.14 0.66 1.17 0.60 70 mph 1.10 0.77 1.10 0.78 75 mph 1.73 0.14 1.74 0.13 Maximum length- 48 feet 1.00 (reference) -- 1.00 (reference) -- 53 feet or 53 feet 6 inches 0.69 0.5 0.72 0.55 57 feet 4 inches or 57feet 6 inches
0.77 0.6 0.78 0.61
59 feet or longer 1.61 0.25 1.64 0.24 State unemployment rate 0.98 0.57 0.97 0.29 Cell phone saturation 0.74 0.32 0.72 0.31 Federal texting ban for truckers
0.59 0.008 0.51 0.001
State texting ban 1.76 0.012 State handheld cell ban 0.49 0.061
a IRR = Incident rate ratio
68��
Discussion
Fatality rates for truck drivers and all vehicle occupants in distraction-involved
truck crashes have been decreasing since 2006 and 2007, respectively. While the 2010
FMCSA ban was associated with a decrease in fatality rates for all vehicle occupants in
2010, without more data after its implementation we cannot draw conclusions about its
impacts on fatality rates. As in prior studies [14, 160], our results did not find that state
DD laws were not correlated with reduced fatality rates.
Unlike prior studies that found distracted driving and crash fatality increasing in
spite of state CPWD bans [14, 18, 159], the 2010 FMCSA texting ban was implemented
during a period where distraction-involved fatalities were decreasing. Understanding the
decrease in these fatality rates will be important for future assessments of distraction-
involved truck crashes. As previously mentioned the total motor vehicle crash fatality
rate in the U.S. has been decreasing for decades. However, large truck-related fatalities
increased by almost 9% from 2009 to 2010 [150], which would have meant that the
decline in this sub-population of distraction-involved crashes occurred despite truck-
related MVC fatality rates increasing. In addition, Wilson and Stimpson found that all
distraction-related fatalities were increasing through 2008 [14], whereas the present study
showed a decrease in truck-involved distraction-related fatalities before 2008. It is
beyond the scope of this paper to compare the fatality rate for truck-involved distraction-
related fatalities to all distracted driving fatality rates in order to compare our findings to
those presented by Wilson and Stimpson. Future analyses in this area should consider
possible ways to isolate the effects of time trends in overall crash rates, from those related

69��
to specific policy interventions. There are methods that have been used in prior analyses
to address this potential bias [163, 164], and the next step of understanding the effects
will be to employ such methods.
There are several aspects of the FMCSA ban that potentially make it more
effective than the state CPWD bans. Amendola reviewed the Connecticut CPWD ban and
found that both law enforcement and the court system were among the factors
contributing to that law’s ineffectiveness�[165]. Unlike states where CPWD laws contain
unclear or weak definitions of what constitutes offending behavior�[69, 76], the FMCSA
final rule clearly amends the Federal Code with instructions on prohibited behavior and
recommended penalties�[75]. It is possible that the lack of any national comprehensive
distracted driving laws in the U.S. was impacting the effectiveness of these laws.
Another important feature of the FMCSA ban is that it includes penalties for both
drivers observed texting-while-driving, and a penalty for the drivers’ employers [75].
Therefore, employers have a monetary incentive to ensure that their drivers are not
texting-while-driving. The Network of Employers for Traffic Safety, a corporate
partnership for safe driving, conducted a poll of its membership in 2009 and reported on
24 of its member organizations’ corporate cell phone policies [82]. Some of the
companies (who were de-identified in the report) reserved the right to terminate workers
violating bans on either handheld CPWD or texting-while-driving. In the 13 months
between the announcement of the ban and its implementation, organizations would have
had an opportunity to establish their own distracted driving policies. Previous analysis by

70��
Hickman and colleagues found that truck drivers who drive for companies with
enumerated cell phone policies have significantly reduced prevalence of CPWD
compared to those companies that do not have such policies [4].
Through the FMCSA, it is easier for the government to regulate commercial
vehicles than it would be if the federal government wanted to ban texting in private
vehicles. Because of the distribution of Federal and State authority under the United
States’ Constitution, the federal government does not have jurisdiction over all driving
regulations. If the federal government wanted to take action on texting-while-driving for
all drivers, it could pass legislation making federal highway funds dependant on states
enacting such a ban; as was done successfully in 2001 when the Bush Administration
sought a nation-wide 0.08 BAC threshold for drunk driving [166]. By targeting
commercial truck and bus drivers, the Department of Transportation was able to take
action on a population that was readily available to them. We must remember that
although the crashes examined in this study involved a distracted truck driver, they were
not all caused by truck driver distraction, so further federal action to regulate truck driver
distraction might not provide such dramatic results.
+�������
Although FARS is the most comprehensive database, no validation studies of the
distracted driving measures were found in the extant literature. A NHTSA report on using
FARS analyzing distracted driving notes that police reports of distraction are not
consistent across states and jurisdictions [151]. Therefore, it is likely that FARS under-

71��
reports the number of crashes involving distraction and the estimates in this paper
actually underestimate the true magnitude of this public health problem.
There analyses could have been impacted by some measurement error. We were
unable to determine if the crashes in our study were caused by distracted driving. FARS
collects personal, vehicular, and environmental factors involved in each crash and does
not weigh which of these factors was the “cause” of a given crash or fatality [151]. Thus,
this study was limited in that it was only able to confidently explore crashes that involved
DD. In addition, it is unknown what effect, if any, the change in coding of distraction-
related crashes had on our results. In 2010, the definition for distracted driving became
more expansive than it was in prior years. The change in definition also resulted in FARS
more closely matching another NHTSA database, the General Estimating System.
Research using the General Estimating System found that the percent of police-reported
crashes involving distracted driving did not change between 2009 and 2010�[167].
Because of this, we do not believe that the change in FARS codes accounted for the
effects of the FMCSA regulation that revealed by these analyses.
Due to sample size considerations, our unit of analysis was the state*year.
Distraction-related crashes are rare events, so we needed a time period wide enough to
capture them for each state. By doing so, we lose the ability to analyze seasonality as a
factor for crashes. To accurately capture within state variation, we used the state as the
level as analysis and did not analyze urban versus rural crash rates. Nor did we analyze
driver-related factors, such as age, gender, licensure, or drink driving. Due to the

72��
omission of these variables in the present study, the results may have been impacted by
some residual confounding.
Finally, the FMCSA Final Rule is not explicit on how states are to implement or
enforce the law. We were unable to find any analysis of when and how each state
implemented and enforced of the regulation, thus we are unable to determine how these
factors affected our findings. More years of data after the ban was implemented will be
necessary to demonstrate what, if any effect, it had on fatality rates. Any potential effects
of the ban will need to be considered in the context of national trends in crash fatalities.
Conclusions
This study quantified distracted driving-involved truck crashes, state-by-state,
over an 11-year period. The state fatality rate for truck drivers in distraction-involved
truck crashes was 0.321 per billion diesel VMTs and the rate for all vehicle occupants in
these crashes was 1.101 per billion diesel VMTs. There was wide variation between
states for fatality counts and rates. Fatality rates in these distraction-involved truck
crashes were decreasing from 2007 through the end of the study period. State texting and
handheld cell phone bans were not associated with decreases in fatality rates over time.
While the 2010 FMCSA ban on texting while driving for commercial drivers was
associated with a decrease in fatality rates for all vehicle occupants in distraction-
involved truck crashes, the ban was not implemented until the last 3 months of the study
period, so we cannot say that it was responsible for the decrease in fatality rates.
73��
Important aspects of the FMCSA ban were that it was nationwide in scope and carried
very heavy penalties for drivers and employers. When more data from the period
following its implementation become available, the longitudinal effects of the ban should
be tested on distraction-involved crash fatality rates. Further research should determine
how the regulation was implemented and enforced to determine if there are features that
could be adopted by states to reduce the prevalence of distracted driving among all
drivers.

74��
Manuscript 2: The Effects of Safety Climate on Distracted Driving in Commercial
Truck Drivers
Abstract
For those who drive on the job, distracted driving is an occupational hazard. We
hypothesize that organizational safety climate will affect distraction-related outcomes for
truck drivers in the United States. A mixed methods study design was employed to
investigate this relationship: an online survey of union truck drivers using the Safety
Climate Questionnaire (SCQ) was complemented with semi-structured interviews of
distracted driving and truck safety experts. A factor analysis of the SCQ produced factors
that had previously been identified as describing Communications and Procedures,
Management Commitment, and Work Pressure. Interview subjects described how these
three constructs could decrease distracted driving. In univariate analyses,
Communications and Procedures and Management Commitment were associated with
self-reported distraction-related near crashes; none of the SCQ factors were significant in
multivariate regressions. This is the first study to describe the effect of safety climate on
distracted driving in the occupational setting.
Key words: mixed methods; factor analysis; near crash; Teamsters; occupational safety
Introduction
Motor vehicle crashes are the leading cause of occupational fatalities in the
United States (U.S.) for all workers [31, 168]. Over half of the occupational fatalities to
truck drivers in the U.S. are due to motor vehicle crash [31], and these deaths occur at a

75��
rate of 3.7 per billion vehicle miles traveled (VMT) [32]. Truck driver health and well-
being has been previously shown to be affected by issues such as sleepiness and fatigue,
poor physical fitness, and the work being shift work-based [27, 28]. Distracted driving
has long been a hazard for truck drivers; however, the emergence of portable electronic
communication devices has only their crash risk [4, 6].
In general, drivers are affected by distractions in four ways: 1) visual distractions
that take the driver’s eyes off the forward roadway; 2) auditory distractions that take the
driver’s aural perception from relative driving cues; 3) cognitive distractions take the
driver’s mind off the driving task; and 4) manual distractions take the driver’s hands off
the wheel [1, 2]. The first two forms of distraction could interfere with the driver from
receiving necessary information relevant to the driving task, the third affects the
processing of this new information, and the fourth delays the driver from taking
corrective action necessitated by the situation [3]. Tasks that drivers can undertake have
been broken into a taxonomy of three types of tasks: primary tasks are those that only
control vehicle speed and direction; secondary tasks that support the primary tasks, such
as turning on headlights or checking mirrors; and tertiary tasks that are any activities the
driver undertakes that are unrelated to driving [1]. Our definition of distracted driving is
any secondary or tertiary task that takes the driver’s eyes, hands, or concentration away
from the primary driving task.
Studies of driver truck behavior using in-vehicle cameras have found over two
dozen secondary and tertiary tasks as sources of distraction [4-7]. The term “cell phone

76��
use while driving” (CPWD) encompasses any task involving a cell phone, including
dialing a phone, talking on the phone, and reading or writing messages [9]. CPWD has
been increasing in recent years due to the proliferation of cellular phones in the U.S. and
elsewhere [10, 11]. Two of the most dangerous CPWD tasks are dialing the phone and
sending, reading, and writing short message service text messages (a.k.a., texting) [6].
These tasks involve manual, visual, and cognitive distractions [2]. Both in the laboratory
setting [12, 13] and during actual driving [6], texting has been shown to be the greatest
hazard for crash or near crash. The Virginia Tech Transportation Institute (VTTI) has
conducted multiple studies on distraction among commercial truck drivers and texting
created the greatest increased hazard for distracted driving crash or near crash [4, 6].
For commercial truck drivers the vehicle cab is their workplace; therefore,
distraction on-the-job is thus an occupational hazard. Because of this, organizational
policies surrounding distracted driving are important in reducing distracted driving
among professional truck drivers [4]. So while cell phones and other means of electronic
communication give drivers the ability to conduct business while driving [35], because
this is an occupational hazard, keeping drivers free from distractions while driving should
be a concern for employers. “Safety climate” is a framework for understanding how
highly an organization values safe worker behavior [40, 41]. Previously organizational
safety climate has been associated with occupational injuries and safe worker behavior
[42, 169, 170]. A study of Australian workers who drive on-the-job found that perceived
safety climate was correlated with safer driving behaviors [47]. Because truck drivers
77��
face so many occupational distractions, we hypothesize that occupational safety climate
will have a major impact on safe behaviors surrounding distracted driving.
Materials and Methods
This study was conducted using a mixed methods design. The ensuing sections
will describe the qualitative analysis and the quantitative analysis separately. The
qualitative and quantitative data were collected from separate populations. In mixed
methods study notation, this manuscript follows a QUAN+qual design for the purposes of
complementarity evaluation, that is, elaborating and illustrating quantitative results with
the qualitative data [138, 139]. Using qualitative data to elucidate the statistical results
allows us to further clarify the effects of the different aspects of safety climate on drivers
[138]. Furthermore, by using qualitative data from a population outside that of the drivers
who are surveyed quantitatively, this “between-method” triangulation should enhance the
study’s external validity [124]. The Johns Hopkins Bloomberg School of Public Health
Institutional Review Board approved of all study procedures.
&�������������������������� �#����
A purposive sample of experts in truck driver safety or distracted driving were
recruited from the list of attendees at the Symposium on Prevention of Occupationally-
Related Distracted Driving sponsored by the Johns Hopkins Bloomberg School of Public
Health Occupational Safety and Health Education and Research Center on April 18, 2011
in Laurel, MD. Ensuing interview subjects were recruited using a snowball sampling
technique [125]. An interview guide was developed and refined by the study team and

78��
was finalized after pilot testing with an expert in motor carrier safety who was a former
driver. Semi-structured interviews were conducted via Skype (Microsoft Corp.,
Redmond, WA) and were recorded using MP3 Skype Recorder v3.1
(VOIPCallRecording.com). Audio files of the interviews were transcribed by uploaded
the .mp3 files to productiontranscripts.com (Production Transcripts, Glendale, CA). Data
collection was ceased after 11 interviews when data saturation was reached [171]. The
recording failed on one interview, so only 10 of the 11 interviews were successfully
transcribed. Notes on all 11 interviews were successfully transcribed. Data collection
began in December, 2012 and ended in January, 2013.
The 10 transcripts and notes from all 11 interviews were stored as Microsoft
Word documents, which were then used for qualitative coding. Data were open-coded
line-by-line to label the themes found in subjects’ responses [126, 127]. A codebook was
developed during the focused coding process. A second coder was employed for a subset
of three randomly-selected interviews as a check on the reliability of the coding process.
Both coders met to discuss the coding and how well the codebook described the
categorizations of the data [128]. The two coders differed slightly in their choice of
wording of themes, but no substantive differences emerged. Because the interviews were
recorded anonymously, results of the interviews will be reported by subject number.
�&��������������������������� �#����
Quantitative data were collected via online survey. Members of the International
Brotherhood of Teamsters (IBT) in the U.S. were selected as target population for the
79��
survey. The IBT represents over one million truck drivers and union members in other
occupations in the U.S. and Canada [57]. The IBT was selected due to its size and
nationwide reach. A business representative from an IBT Local who was familiar with
the project was used to pilot test the survey and finalize the exact wording. The survey
required only 10 minutes to complete upon final testing.
With the assistance of personnel in the Office of Health and Safety at IBT
headquarters, we sought sub-industries where the drivers were most likely to experience
the distractions under study [58]. To identify drivers in the carhaul, express, freight,
motion picture, package, and tankhaul industries, study subjects were asked to select the
type of truck that they drove (with accompanying images) at the beginning of the survey.
Those who didn’t identify one of the selected vehicles were directed to a disqualification
page and thanked for their time. Of the 440 subjects who entered the survey, 79 (18%)
were screened out when they identified themselves as not driving in one of the vehicles
of interest. Over the course of the survey, 122 of the remaining 361 (34%) left the survey
before completion, resulting in a final sample of 239 subjects.
Of the 239 subjects who completed all portions of the survey, 60 (25%) drove
delivery vans and 179 (75%) drove larger trucks. Attempts to determine if the final
sample of respondents was representative of the larger population were limited because
of few existing publically available data of truck drivers. The most recent was a 2002
Census Bureau report on registered trucks in the U.S. that found that medium trucks (a
category that includes delivery vans) comprised 23% of the American truck fleet and
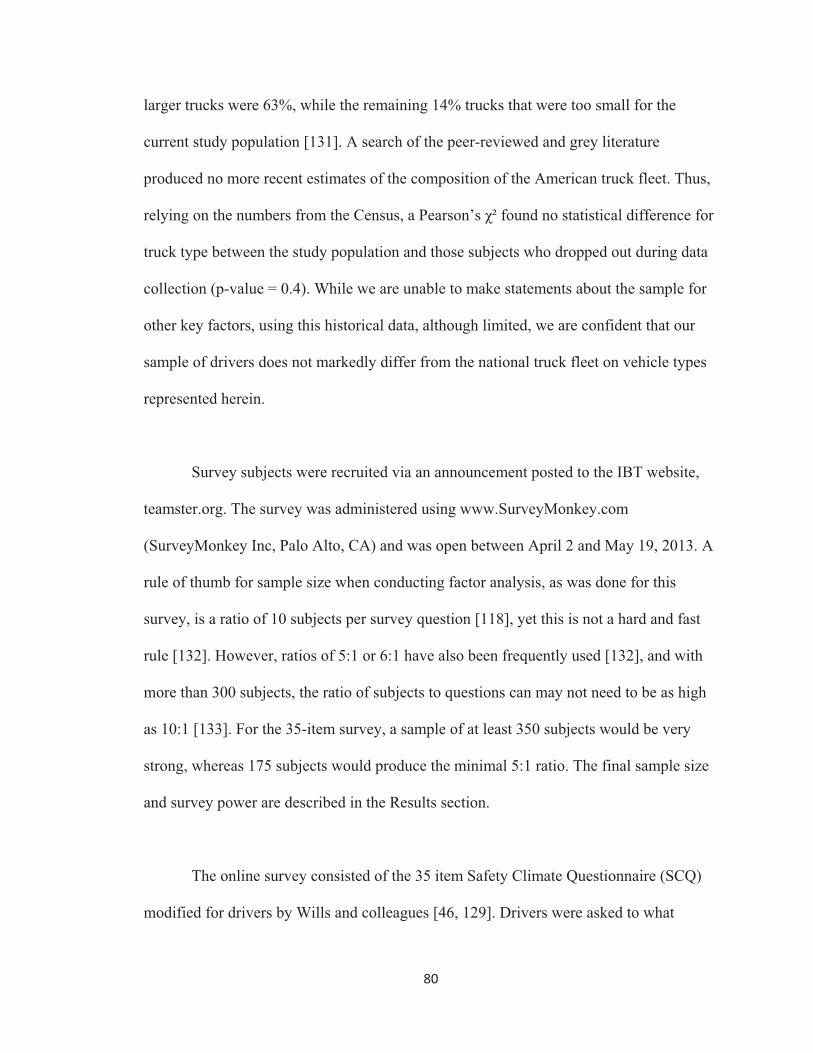
80��
larger trucks were 63%, while the remaining 14% trucks that were too small for the
current study population [131]. A search of the peer-reviewed and grey literature
produced no more recent estimates of the composition of the American truck fleet. Thus,
relying on the numbers from the Census, a Pearson’s �² found no statistical difference for
truck type between the study population and those subjects who dropped out during data
collection (p-value = 0.4). While we are unable to make statements about the sample for
other key factors, using this historical data, although limited, we are confident that our
sample of drivers does not markedly differ from the national truck fleet on vehicle types
represented herein.
Survey subjects were recruited via an announcement posted to the IBT website,
teamster.org. The survey was administered using www.SurveyMonkey.com
(SurveyMonkey Inc, Palo Alto, CA) and was open between April 2 and May 19, 2013. A
rule of thumb for sample size when conducting factor analysis, as was done for this
survey, is a ratio of 10 subjects per survey question [118], yet this is not a hard and fast
rule [132]. However, ratios of 5:1 or 6:1 have also been frequently used [132], and with
more than 300 subjects, the ratio of subjects to questions can may not need to be as high
as 10:1 [133]. For the 35-item survey, a sample of at least 350 subjects would be very
strong, whereas 175 subjects would produce the minimal 5:1 ratio. The final sample size
and survey power are described in the Results section.
The online survey consisted of the 35 item Safety Climate Questionnaire (SCQ)
modified for drivers by Wills and colleagues [46, 129]. Drivers were asked to what
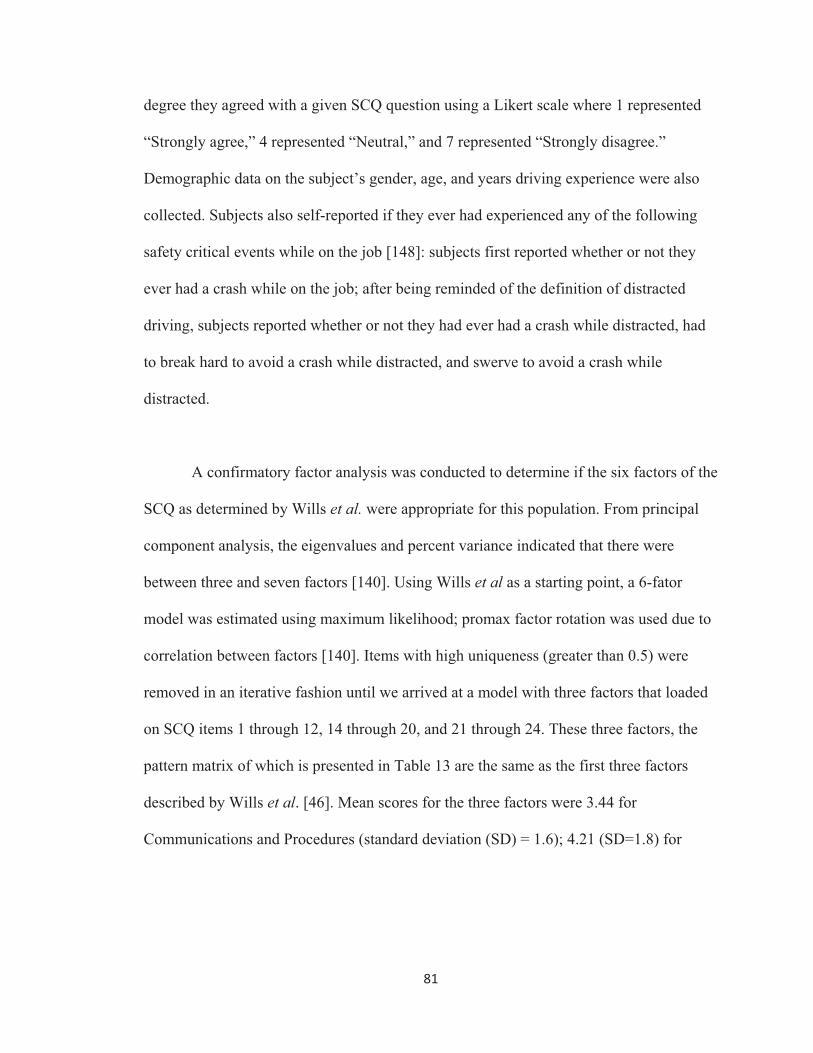
81��
degree they agreed with a given SCQ question using a Likert scale where 1 represented
“Strongly agree,” 4 represented “Neutral,” and 7 represented “Strongly disagree.”
Demographic data on the subject’s gender, age, and years driving experience were also
collected. Subjects also self-reported if they ever had experienced any of the following
safety critical events while on the job [148]: subjects first reported whether or not they
ever had a crash while on the job; after being reminded of the definition of distracted
driving, subjects reported whether or not they had ever had a crash while distracted, had
to break hard to avoid a crash while distracted, and swerve to avoid a crash while
distracted.
A confirmatory factor analysis was conducted to determine if the six factors of the
SCQ as determined by Wills ������ were appropriate for this population. From principal
component analysis, the eigenvalues and percent variance indicated that there were
between three and seven factors [140]. Using Wills ����� as a starting point, a 6-fator
model was estimated using maximum likelihood; promax factor rotation was used due to
correlation between factors [140]. Items with high uniqueness (greater than 0.5) were
removed in an iterative fashion until we arrived at a model with three factors that loaded
on SCQ items 1 through 12, 14 through 20, and 21 through 24. These three factors, the
pattern matrix of which is presented in Table 13 are the same as the first three factors
described by Wills �����. [46]. Mean scores for the three factors were 3.44 for
Communications and Procedures (standard deviation (SD) = 1.6); 4.21 (SD=1.8) for

82��
Work Pressures; and 3.90 (SD = 1.9) for Management Commitment. The scree plot1 with
parallel analysis [141] in Figure 7 supports our data as best described by three factors
[172]. We also generated the factor scores using the original six-factor structure from
Wills ������ [129]. The mean (SD) scores for the six factors were 3.42 (1.6) for
Communications and Procedures, 4.21 (1.8) for Work Pressure, 3.90 (1.9) for
Management Commitment, 4.80 (1.6) for Relationships, 3.80 (1.7) for Driver Training,
and 4.14 (1.8) for Safety Rules.
The mean factor scores and demographic data were entered first into univariate
regression for each of the four crash and near-crash outcomes. This analysis was
conducted for the three-factor model that our analysis generated as well as using scores
from the original six-factor model from Wills �����. Multivariate regressions were then
conducted for each outcome for factors that had p-values � 0.10. Entering covariates with
p-values less than 0.2 has been used in model development in the past [94]; however,
using 0.10 as a cutoff is a trade-off between including relevant covariates and model
performance [119]. All analyses were conducted with Stata v.12.1 (Stata Corp, College
Station, TX).
������������������������������������������������������������1 Where a scree plot flattens out (and is passed by the parallel analysis) indicates the number of�“interpretable”�components/factors.�Please�see�Jackson’s�1993�review�of�principle�component�analysis�(reference�number�171).�

83��
Table 13. Pattern matrix for three factors for the SCQ. Chronbach’s alpha for reliability
of each factor is listed.
Items and Labels 1 2 3 Factor 1- Communications and Pressure (� = 0.94) 1. Changes in working procedures and their effects on safety are effectively communicated to workers 0.74 2. Employees are consulted when changes to driver safety practices are suggested 0.79 3. Employees are told when changes are made to the working environment such as the vehicle, maintenance or garaging procedures 0.74 4. Safety policies relating to the use of motor vehicles are effectively communicated to the workers 0.87 5. Safety procedures relating to the use of motor vehicles are complete and comprehensive 0.84 6. An effective documentation management system ensures the availability of safety procedures relating to the use of motor vehicles 0.82 7. Safety problems are openly discussed between employees and management/supervisors 0.66 8. Safety procedures relating to the use of motor vehicles match the way tasks are done in practice 0.66 9. Employees can discuss important driver safety policy issues 0.51 10. Employees are consulted for suggested vehicle/driver safety improvements 0.72 11. Employees can identify relevant procedures for each job 0.62 12. Employees can express views about safety problems 0.50 Factor 2- Work Pressure (� = 0.93) 14. Time schedules for completing work projects are realistic 0.85 15. There is sufficient 'thinking time' to enable employees to plan and carry out their work to an adequate standard 0.88 16. Workload is reasonably balanced 0.87 17. There are enough employees/drivers to carry out the required work 0.76 18. Changes in workload, which have been made on short notice, can be dealt with in a way that does not affect driver safety 0.80 19. When driving employees have enough time to carry out their tasks 0.82 20. Problems that arise outside of employees' control can be dealt with in a way that does not affect driver safety 0.61 Factor 3- Management Commitment (� = 0.95) 21. Management are committed to driver safety 0.8622. Management are committed to motor vehicle safety 0.8523. Driver safety is central to managements' values and philosophies 0.8224.Driver safety is seen as an important part of fleet management in this organization 0.70
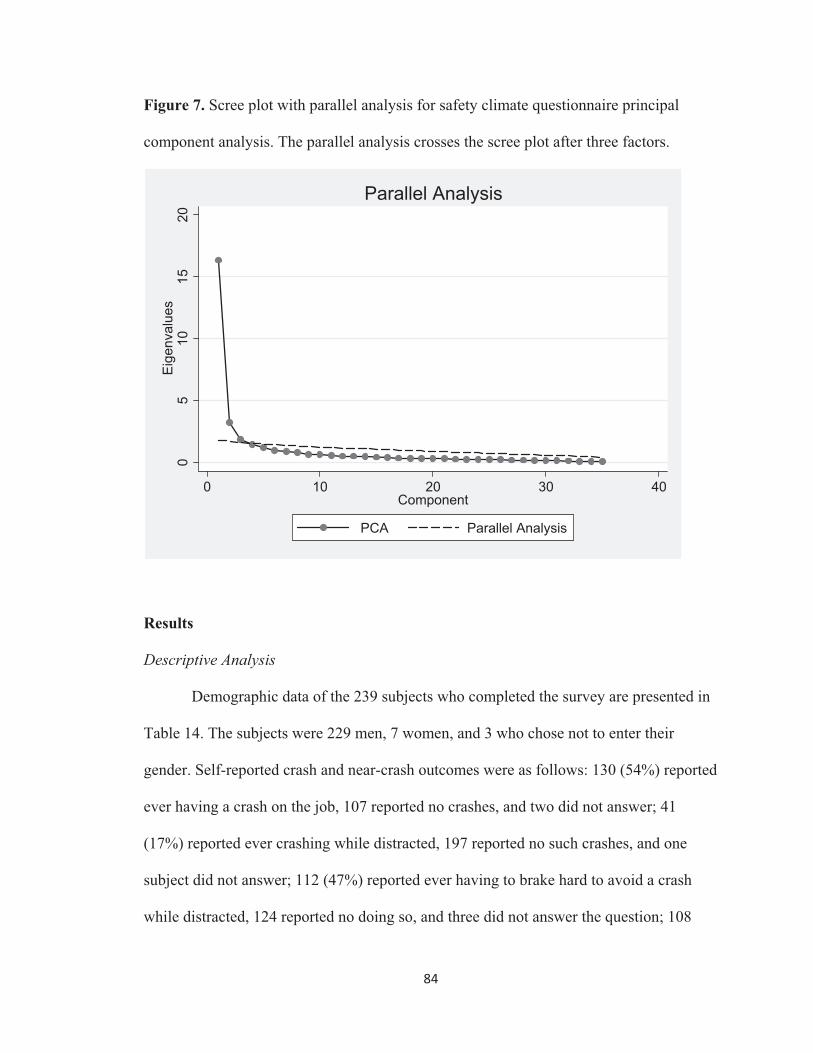
84��
Figure 7. Scree plot with parallel analysis for safety climate questionnaire principal
component analysis. The parallel analysis crosses the scree plot after three factors.
Results
���������#����
Demographic data of the 239 subjects who completed the survey are presented in
Table 14. The subjects were 229 men, 7 women, and 3 who chose not to enter their
gender. Self-reported crash and near-crash outcomes were as follows: 130 (54%) reported
ever having a crash on the job, 107 reported no crashes, and two did not answer; 41
(17%) reported ever crashing while distracted, 197 reported no such crashes, and one
subject did not answer; 112 (47%) reported ever having to brake hard to avoid a crash
while distracted, 124 reported no doing so, and three did not answer the question; 108
��
����
�����
�� ��
� �� �� �� ��������
���� ���� ��� ����
���� ��� ����

85��
(45%) reported ever having to swerve to avoid a crash while distracted, 129 reported not
doing so, and two subjects did not answer.
Table 14. Descriptive data on 239 subjects who completed the survey.
Mean SD Minimum-Maximum Age (years) 48.0 8.9 21 – 69 Driving experience (years) 22.7 10.1 1 – 45 Weekly driving (hours) 47.6 11.4 6 – 70
,�������#����
Results of univariate logistic regressions for demographic data and the three
factors are presented in Table 15. Variables entered into multivariate regressions were
differed for each outcome: for ever experiencing a crash, covariates were gender,
Communications and Procedures, Work Pressure, and Management Commitment; for
ever experiencing a distraction-related crash, covariates were age and driving experience;
for undertaking distraction-related braking, covariates were weekly driving exposure and
Communications and Procedures; for undertaking distraction-related swerving, covariates
were gender, Communications and Pressures, and Management Commitment.

86��
Table 15. Univariate regression for demographic factors and three safety climate factors
on negative driving outcomes in the workplace. The odds ratios (ORs) are presented with
odds of the negative outcome versus no outcome. OR for Gender are for women’s odds
over men’s odds. There were too few subjects who did not list a gender to calculate ORs.
ORs in bold were entered into multivariate regressions.
Ever experience a crash on the job
Ever experience a distraction-related crash on the job
Ever undertake hard braking while distracted on the job
Ever have to swerve while distracted on the job
Variable OR p-value OR p-value OR p-value OR p-value Gender 0.13 0.06 3.75 0.92 1.51 0.60 7.62 0.06 Age 1.02 0.25 1.05 0.03 0.98 0.27 1.02 0.27 Driving experience
1.02 0.13 1.04 0.03 0.99 0.66 1.01 0.28
Weekly driving 0.99 0.66 1.01 0.45 0.98 0.06 1.00 0.73 Communications and Procedures
1.19 0.03 0.98 0.84 1.15 0.09 1.21 0.02
Work Pressure 1.19 0.02 0.94 0.51 1.05 0.54 1.00 0.97 Management Commitment
1.15 0.04 0.98 0.90 1.08 0.25 1.14 0.05

87��
Table 16. Results of multivariate analyses on negative driving outcomes.
Ever experience a crash on the job
Ever experience a distraction-related crash on the job
Ever undertake hard braking while distracted on the job
Ever have to swerve while distracted on the job
Variable OR 95% CI OR 95% CI OR 95% CI OR 95% CI Gender 0.11 0.01-
1.01 3.67 0.75-17.90 8.09 0.93-
70.56 Age 1.02 0.94-1.10 Driving experience
1.02 0.96-1.09
Weekly driving 0.98 0.95-1.00
Communications and Procedures
1.17 0.93-1.47
1.17 1.00-1.38
1.12 0.89-1.40
Work Pressure 1.12 0.93-1.36
Management Commitment
0.99 0.80-1.22
1.09 0.91-1.31
The outcomes of the four multivariate regressions are presented in Table 16.
Some of these covariates approached significances. Gender approach significance in both
ever experiencing a crash and experiencing distraction-involve swerving (p-values of
0.051 and 0.058, respectively), yet the relationship between gender and these negative
outcomes was switched: men were more likely to experience a crash and women were
more likely to swerve while distracted. As age and driving experience increased, they
approached significance for ever reporting a distraction-related crash. Increasing weekly
driving exposure approached was significantly associated (p=0.039) for a reduction in
distraction-related hard breaking. Communications and Procedures approached
significance (p = 0.057) in multivariate regression for experiencing distraction-related
hard braking. No other safety climate factors approached significance in multivariate
regression.

88��
Using the Wills �����. six factor model, we found significant results in univariate
logistic regressions for ever crashing and ever swerving while distracted. Scores from
factors 1, 2, and 6 were associated with ever experiencing a crash on the job and factors
1, 2, 3, 4, and 6 were associated with ever swerving while distracted on the job. In
multivariate regression, the p-values for all these covariates were 0.2 or greater. Thus,
although our three factor model was not highly significant in multivariate regression, the
original six-factor model did not perform better.
&���������#����
Of the 11 interview participants, five were researchers at academic institutions;
three were at private research institutions; and one each were from a union, a private
company, and a federal agency. Because participants were guaranteed anonymity, no
further demographic data were collected. Although interview participants identified ways
that drivers would feel pressure from supervisors, coworkers, or family and friends to
undertake various distracting tasks, subjects said that it was ultimately up to each driver
to make the final decision on whether or do a given distracting activity while driving.
Interview subjects addressed how each of the three factors from the questionnaire could
impact truck driver safety surrounding distracted driving.
Because we did not interview truck drivers directly, we were unable to get
information on specific company policies regarding the Communications and Procedures
factor. One participant expressed concerns that it was possible for company culture, be it
from management or fellow coworkers, to have a suppressive effect on drivers even

89��
bringing up safety concerns, as expressed in SCQ items seven, nine, and 12. To enforce
company policies, interview subjects said that organizations could electronically monitor
their drivers. Two interview participants cited DriveCam (manufactured by The Driver
Science Company, San Diego, CA) as one method for monitoring driver behavior.
The Work Pressure factor, specifically time pressure, was commonly discussed as
important aspects of driver safety. A participant described how company culture could
vary between companies and influence the need to respond to dispatchers:
“[D]epending on the company and how they are structured and kind of the
underlying safety climate and culture, we might see that drivers are under the
impression that they need to be very responsive to anything that comes from the
office. Whether it's from dispatch or from a supervisor-- things like that.
Whereas, other companies might have policies where that feeling is a little less
intense. ”
Another participant stated that the pressures to respond quickly could be either explicit
company policy or an “[i]mplicit expectation that they use the device while driving so
that they can respond in a timely fashion to requests from the company.” A final, telling
quote about the structure of a delivery driver from a third interview subject demonstrates
just how intense time pressure can be for workers:
“I rode with a truck driver and you know his schedule meant that he had to eat
lunch in the truck, you know, he didn't have time to stop, go to the bathroom and
you know, that schedule didn't allow it. If he wanted to go to the bathroom he had
90��
to find a restroom at one of his stops and there was no time to go to like a
restaurant or a fast food restaurant or a Subway or anything like that.”
Interview participants described many ways that organizations could manifest the
Management Commitment factor of safety climate. The aforementioned video monitoring
of drivers is one such method. Management could also use engineering solutions to
protect drivers. Multiple interview subjects described how a Global Positioning System
(GPS) device is a safer alternative to a driver reading a map, as the GPS requires less
manipulation and many can give audio commands, removing the need for the driver to
take his/her eyes off the road to see directions. Furthermore, three subjects described how
management could set the in-vehicle dispatch device to promote driver safety, such as
only allowing the device to receive messages when the vehicle was stopped, or for the
device to relay auditory messages that do not require the driver to look away from the
forward roadway.
Discussion
Organizational safety climate has previously been shown to correlate with safe
workplace behaviors and injury rates [43, 45, 173]. This study sought to apply measures
of safety climate to distracted driving in truck drivers in the U.S. Using key informant
interviews and regression analyses of an established questionnaire, we believe that these
data will contribute to the understanding of how organizational climate contributes to
driver safety.
91��
A VTTI study found that truck drivers who drove for organizations with CPWD
policies had a lower prevalence of distracted driving as well as reduced odds for crashes
and near crashes compared with organizations without such policies [4]. Our data showed
in univariate regression that distraction-involved braking and swerving was correlated
with the safety climate factors of Communications and Procedures and Management
Commitment. By committing to safe work procedures where drivers are not required to
use electronic communications while driving, management can reduce drivers’ exposure
to distracted driving and decrease their crash risk.
A review of the origins of safety climate defines it as the social manifestation of
organizational culture as construed collectively by workers [169]. Interview subjects
described how an organization would be able to manifest its culture by consistent
practices regarding driver communication safety procedures. Organizations should be
consistent in their explicit and implicit expectations for driver behavior. Organizational
policies that lead to drivers being conflicted about their work procedures are what
organizational psychologist James Reason calls “inadvisable rules” [174]. Reason and
colleagues further describe how organizations can prevent driver errors and policy
violations with good organizational management and planning [175, 176]. Consistent
messaging concerning the separation of driving and secondary communications tasks
would reinforce good organizational culture surrounding distracted driving.
In univariate analysis, Management Commitment was associated with drivers ever
having a crash on the job and swerving while distracted. Management commitment to

92��
safety has previously been identified as the most important aspect of safety climate [42,
177]. The originator of the SCQ, Dov Zohar, hypothesizes that the management
commitment is at the heart of safety climate and all other measures of safety climate are
somewhat secondary [178]. Therefore while allowing drivers to have personal time for
eating or drinking and using the restroom while driving might be explicit manifestations
of Work Pressure, it still is a description of how management values the safe conduct of
work by their drivers.
This commitment to driver safety can be further manifested by how the driver’s
work space (i.e., vehicle cab) is designed, such as removing distractions, or programming
electronic devices so that drivers can only receive potentially distracting messages once
the vehicle is safely stopped. According to a review by O’Toole, mandating engineering
controls has been regulatory strategy used by the Occupational Safety and Health
Administration to promote occupational safety [179]. Future human factors and
ergonomic research could describe the effects of engineering controls on distracted
driving.
Male gender was associated with a near significant increase in ever reporting a
crash in multivariate regression. This finding is consistent with surveillance data from the
Centers for Disease Control and Prevention that found that fatal crash rate on the job is
eight times higher for men than women in U.S. [30]. Unexpectedly, we found that female
drivers had a much higher odds of reporting distraction-related swerving than males. One
of the interview subjects doubted that anyone would admit to the distraction-related

93��
outcomes that we asked about. Although anonymous surveys decrease the likelihood that
subjects would report “better” outcomes due to social desirability bias [180]. Collet and
colleagues reviewed the literature and found no clear evidence that distracted driving
affected men or women more [18], so it is possible that an unmeasured confounder
resulted in women reporting less distraction-involved swerving than men.
That increased weekly driving exposure was correlated with decreased odds of
reporting distraction-related swerving on the job was an unexpected finding. We might
expect that drivers who have increased weekly exposure to driving would have increased
exposure to distracted driving, and thus an increased likelihood of negative outcomes.
Because the mixed methods analysis was concurrent, we did not have the opportunity to
present these survey findings to the interview subjects. Future qualitative analysis could
offer insight on why drivers with increased weekly driving exposure have lower odds of
near crash.
����������� �+������
The current study had limited power compared to the Wills �����. studies in which,
with sample sizes of almost 100 more subjects, this version of the SCQ was developed
and validated [46, 47, 129]. Although we were missing three of the factors from Wills
and colleagues’ original model, the three factors that we did derive were the factors that
accounted for the majority of the variation in the Wills �����. studies. Furthermore, other
than dropping item 13 from the SCQ, our confirmatory factor analysis produced three
factors that matched the exploratory factor analysis of Wills �����. [46, 47].

94��
Our analysis of the Communications and Procedures factor was limited because
we were unable to interview truck drivers about the procedures surrounding distracted
driving at their organizations. While not being able to describe this component of safety
climate may have been hindered by our selection of two different study populations, the
selection of this between-method approach increases the external validity of the study
[124]. So whereas we might lose some precision in describing a given factor of safety
climate, the validity of the entire method is raised by drawing results from different,
complementary populations.
Since the survey was anonymous, we did not ask IBT members for which
organization they drove. This limited our ability to examine the impact of policies within
a particular organization on safety climate and distracted driving outcomes. However, we
were able to survey drivers in a variety of industries, increasing the external validity of
our results. Future analyses should analyze the effects of driving industry and
organization on safety climate and distracted driving outcomes.
While surveying IBT drivers creates the potential for a nationally-representative
sample; however, in keeping the data as anonymous as possible, no items on the
questionnaire asked the respondents to describe in which state(s) they drove and/or lived.
Furthermore, there are no data available from the IBT to which we can compare our
sample to assess the representativeness of the demographic data or type of vehicles

95��
driven by survey respondents. Thus, the degree to which these data are generalizable to a
larger population of IBT drivers is unknown, and a limitation of this research.
Conclusion
In univariate regression, we found associations between safety climate constructs
and crashes and distraction-involved near crashes in a population of Teamsters in the
U.S. In multivariate analysis, demographic factors and Communications and Procedures
approached statistical significance. Interviews with safety experts described how
organizations could influence safe driver behavior surrounding distractions by
establishing a good organizational climate. This could be accomplished through
consistent enforcement of company policies designed to prevent distracted driving on the
job. This research should lead to further investigations of how organizational
characteristics can affect distracted driving in professional truck drivers.

96��
Manuscript 3: Understanding Commercial Truck Drivers’ Decision-Making Process
Concerning Distracted Driving
Abstract
Distracted driving is an occupational hazard for truck drivers. Truck drivers’ decision-
making process is affected by their personal views on distractions as well as workplace
pressures. The purpose of this study is to understand the personal and organizational
factors that affect whether or not truck drivers undertake distracting activities while
driving on the job. Using the Theory of Planned Behavior, this concurrent mixed methods
study employed an online survey of members of the International Brotherhood of
Teamsters and key informant interviews with trucking and distracted driving safety
experts. Results from logistic regression analyses showed that drivers’ perception of their
supervisors’ normative beliefs concerning dispatch device use was directly associated
with distraction-involved near crashes, regardless of intention to use a dispatch device.
Drivers’ intentions toward texting while driving, however, mediated the effects of social
norms and perceived control on near crash distraction-involved outcomes. Interview
participants described how organizations that strictly enforce distracted driving policies, a
social normative factor, could reduce unsafe driving. However, interview participants
also felt that drivers ultimately had final say, a perceived control factor, concerning
distracted driving behaviors. Both intentions toward distractions and perceptions of
workplace factors concerning distracted driving were associated with distraction-involved
near crash outcomes. The TPB constructs for texting and dispatch device differed in their
impact in regression analyses on distraction-involved activities, suggesting that

97��
commercial truck drivers experience different pressures concerning different distracting
activities.
Background
Distracted driving is increasingly becoming a hazard to drivers in the United
States (U.S.) [151, 152, 181]. Drivers are distracted from primary driving tasks by 1)
visual distractions that take their eyes off the forward roadway; 2) auditory distractions
that take their aural perception from relative driving cues; 3) cognitive distractions that
take their mind off the driving task; and 4) manual distractions that take the driver’s
hands off the wheel [1, 2]. Although much of the increase in distracted driving is due to
the use of cell phones and other electronic communication [10, 14], truck drivers face
additional occupational distractions that stem from their occupational environment,
including interacting with a dispatch device and writing notes or a log [6]. When driving
on the job, truck drivers are faced with work and time pressures that influence their
decision-making about whether or not to undertake distracting tasks [36].
Research from the Virginia Tech Transportation Institute (VTTI) has
demonstrated how the odds for crashes and near crashes are increased when truck drivers
are distracted [6]. This VTTI study found that texting while driving increases the odds
ratio (OR) for crash or near crash 23 times compared to when drivers are not texting. The
VTTI study also found increased odds of crash or near crash for such activities as
interacting with the dispatch device (OR=9.9), reaching for an electronic device
(OR=6.7), looking at a map (OR=7.0), and dialing a cell phone (OR=5.9). Because motor

98��
vehicle crashes are the leading cause of occupational death in commercial truck drivers
[31], it is important to prevent crashes caused by distraction. The Theory of Planned
Behavior (TPB) [53] is a framework for understanding factors that affect individuals
when they consider whether or not to undertake a given behavior. Using the TPB, this
paper describes how personal, social, and occupational factors affect truck driver
decision-making concerning distracting activities while on the job.
The TPB, as shown in Figure 8, seeks to understand how attitudes, perceived
behavioral control (PBC), social norms, and intentions affect behavior performance [53,
56]. A previous study of truck driver safety in the United Kingdom used the TPB to
understand what factors would be most effective in increasing safe driving behavior and
compliance with safety regulations [50]. This prior study by Poulter �����. found that
while social norms affected safe driving behavior, truck drivers’ compliance with driving
regulations (“rule compliance”) was more affected by PBC. These authors concluded that
programs aimed at increasing safe driver behavior and rule compliance would require two
different approaches [50]. The TPB has also been applied to understanding distracted
driving in young drivers [9]; however, it has not been applied to understand distracted
driving among adults in the workplace.

99��
Figure 1. Conceptual model of the Theory of Planned Behavior (from Parker ������
Accident Analysis and Prevention, 1992)
The TPB uses key informant interviews to prepare surveys for the population of
study [52], which we did as well. In addition, this study also used key informant
interviews to further elaborate on how drivers would be affected by each component of
the TPB. The purpose of this study is to utilize a mixed methods concurrent design and
analysis to describe quantitatively how the TPB factors affect distraction-related crash
and near crash outcomes, and explore qualitatively the meaning of those results.
Methods
This study employed a mixed methods concurrent design and analysis [142, 143].
In a mixed methods concurrent design, the qualitative and quantitative data are collected
and analyzed separately, the results of each method are first presented separately, then
integrated for interpretation [144, 145]. Although the qualitative data were collected first,
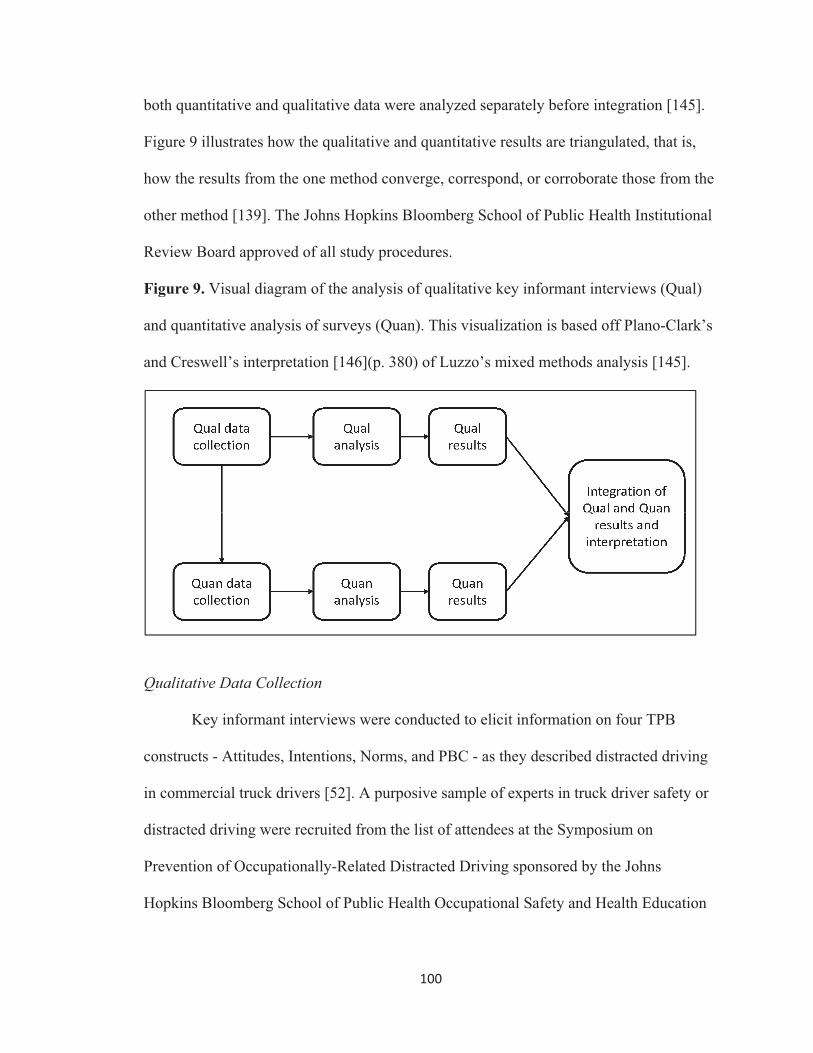
100��
both quantitative and qualitative data were analyzed separately before integration [145].
Figure 9 illustrates how the qualitative and quantitative results are triangulated, that is,
how the results from the one method converge, correspond, or corroborate those from the
other method [139]. The Johns Hopkins Bloomberg School of Public Health Institutional
Review Board approved of all study procedures.
Figure 9. Visual diagram of the analysis of qualitative key informant interviews (Qual)
and quantitative analysis of surveys (Quan). This visualization is based off Plano-Clark’s
and Creswell’s interpretation [146](p. 380) of Luzzo’s mixed methods analysis [145].
&�����������������������
Key informant interviews were conducted to elicit information on four TPB
constructs - Attitudes, Intentions, Norms, and PBC - as they described distracted driving
in commercial truck drivers [52]. A purposive sample of experts in truck driver safety or
distracted driving were recruited from the list of attendees at the Symposium on
Prevention of Occupationally-Related Distracted Driving sponsored by the Johns
Hopkins Bloomberg School of Public Health Occupational Safety and Health Education

101��
and Research Center on April 18, 2011 in Laurel, MD. Ensuing interview participants
were recruited using a snowball sampling technique [125].
The interview guide was developed and refined by the study team, and finalized
after pilot testing with an expert in motor carrier safety who is a former driver. Semi-
structured interviews were conducted via Skype (Microsoft Corp., Redmond, WA) and
were recorded using MP3 Skype Recorder v3.1 (VOIPCallRecording.com). Audio files
of the interviews were transcribed by uploading the .mp3 files to
productiontranscripts.com (Production Transcripts, Glendale, CA). Data collection
ceased after 11 interviews, which was the point when data saturation was reached [171].
The recording failed on one interview, so only 10 of the 11 interviews were successfully
transcribed. Since notes were taken during each interview, notes from all 11 interviews
were successfully transcribed. Data collection began in December, 2012 and ended in
January, 2013. Of the 11 interview participants, five were researchers at academic
institutions, three were at private research institutions, and one a piece were from a union,
a private company, and a federal agency. Because participants were guaranteed
anonymity, no further demographic data was collected. The author of this dissertation
served as the interviewer for all 11 interviews.
&��������������#����
The 10 transcripts and 11 sets of notes were saved as Microsoft Word documents.
Data were open-coded line-by-line to label themes found in the participants’ responses
[126, 127]. Open coding was employed to develop the initial themes that were found in
102��
commonly across the interviews. Focused coding, or level-2 coding, was employed to
group themes into broader categories [126, 127]. For example, “personal control” and
“work pressure” were two labels that often appeared close to one another as interview
participants described the balance the drivers would have to strike in their decision-
making process. A codebook was developed during the focused coding process. A second
coder, hired for the task, independently coded a subset of three randomly-selected
interviews as a check on the reliability of the coding process. Both coders met to discuss
the coding and how well the codebook described the categorizations of the data [128].
The two coders differed slightly in their choice of wording of themes, but no substantive
differences emerged. Because the interview participants were anonymously recorded,
results of the interviews will be reported by subject number.
To establish which distracted driver behaviors were appropriate for the online
survey of drivers [52], interview participants were first asked to give their opinions on
how distracting certain behaviors would be to truck drivers, including texting while
driving; reading the dispatch device; and writing notes or a log. Using a Likert scale,
interview participants rated on a scale of one (not very distracting) to five (very
distracting) 19 distracting behaviors described by the Virginia Tech Transportation
Institute [4, 6] and confirmed as relevant by two pilot tests of the interview. Two
behaviors were selected for analysis in the online survey: texting while driving was given
a maximum distraction rating by every interview participant; “interacting with a dispatch
device” was rated nearly as distracting as texting and is a behavior that is specific to the
occupational environment of truck drivers. Only drivers who indicated that they use

103��
dispatch devices answered TPB questions regarding dispatch device use and all drivers
answered questions about texting.
&������������������������
Quantitative data were collected via online survey. Members of the International
Brotherhood of Teamsters (IBT) in the U.S. were selected as target population for the
survey. The IBT represents over one million truck drivers and union members in other
occupations in the U.S. and Canada [57]. The IBT was in part selected due to its size and
nationwide reach. In addition, we were able to develop a relationship with the head of
Occupational Safety and Health for the IBT in Washington, D.C. in developing this
study. This IBT official understood the importance of the research and served as a
gatekeeper into the IBT population [125]. A business representative from an IBT Local
who was familiar with the project was used to pilot test the survey and finalize the exact
wording. The survey took 10 minutes to complete upon final testing. With the assistance
of IBT personnel, we sought sub-industries where the drivers were most likely to
experience the distractions under study [58]. To identify drivers in the carhaul, express,
freight, motion picture, package, and tankhaul industries, study participants were asked to
select the type of truck that they drove (with accompanying images) at the beginning of
the survey. Those who did not identify one of the selected vehicles were directed to a
disqualification page and thanked for their time.
Of the 440 subjects who began the survey, 79 (18%) were screened out because
they indicated that they did not drive one of the vehicles included in the study, and 68
104��
dropped out before completing the texting questions and driving outcome questions. For
the dispatch device section, 135 subjects were screened out as they indicated that they did
not use a dispatch device and 57 dropped out before completing all the questions on
dispatch device use. As these questions were part of a longer survey, some subjects
dropped out before completing questions on the driving outcomes: a total of 277 subjects
(77% of total eligible sample) completed survey questions for texting and the driving
outcomes, and 153 (42% of total eligible sample) completed the questions on dispatch
device use and driving outcomes.
In the texting group, 26% of subjects indicated that they drove delivery vans (i.e.,
were in the package industry) and 74% drove larger trucks. A 2002 Census Bureau report
on registered trucks in the U.S. found that medium trucks (a category that includes
delivery vans) comprised 23% of the American truck fleet and larger trucks were 63%,
while the remaining 14% trucks that were too small for the current study population
[131]. A search of the peer-reviewed and grey literature produced no more recent
estimates of the composition of the American truck fleet. The dispatch device sample was
comprised of 35% delivery drivers and 65% larger trucks. The texting population, the
dispatch device population, and the 68 subjects who dropped out before completing the
survey had statistically similar distributions of vehicles that they drove (Pearson’s �² p-
value = 0.4). We have no data on the 79 subjects that were screened out as not driving
vehicles in the target population.

105��
Survey subjects were recruited via an announcement posted to the IBT website,
teamster.org. The survey was administered using SurveyMonkey.com (SurveyMonkey
Inc, Palo Alto, CA) and was open between April 2, 2013 and May 19, 2013. A power
calculation using data from a similar study of the TPB and speeding behavior [49]
indicated that a sample size of 500 respondents would result in a power above 0.80 and �-
level of .05 [137]. Survey data were downloaded from SurveyMonkey into Stata v12.1
for analysis (Stata Corp, College Station, TX). The TPB constructs (Attitude, Norms,
Perceived Behavioral Control (PBC), and Intentions) were assessed in reference to two
behaviors: texting and dispatch device.
The TPB constructs were the independent variables and were scored as described
by Montaño and Kasprzyk [52]. Attitude was assessed using the average of three
semantic differential 7-point bipolar scales ranging from 1 to 7 with endpoints including
“very harmful – very beneficial,” “very unpleasant – very pleasant,” and “very bad – very
good.” Thus, an increased Attitude score indicates a more positive view of the distracting
behavior. Intention was measured using a single 7-point bipolar scale (1 through 7) with
endpoints “Definitely will – Definitely will not.” An increased Intention score indicates
that a driver had less intention to undertake a given behavior.
Both PBC and norms scores were generated by multiplying the two individual
scores together [52]. For the resulting variables, both the sign of the score and the
absolute value are informative. PBC was assessed using a multi-item indirect assessment
by multiplying control beliefs (scored on a bipolar 7-point scale) with times perceived

106��
power (scored -3 to +3 on a bipolar scale). The absolute values of the PBC component
describes how confident the driver is in being able to avoid an activity that he/she deems
to be easy (positive) or hard (negative) to avoid. Norms were assessed with a multi-item
indirect assessment multiplying the normative belief (scored -3 to +3) times the
motivation to comply (score 1 to 7). Negative norms values indicated that a driver’s
supervisor thinks that the driver should undertake a given behavior and positive values
indicate that supervisors think that the driver should not undertake the behavior. An
increased absolute value for norms indicates how important the supervisor’s opinion
concerning the distracting behavior is to the driver.
Exploratory data analysis was conducted on the TPB constructs separately for
both the texting and dispatch device populations [147]. Means and standard deviations
were generated for each TPB construct and because the range of scores was small,
frequency tables and histograms were also generated for visual assessment of the data.
Although previous studies on driver behavior and the TPB have used mean scores to
analyze each TPB construct [35, 56], our data were not normally distributed and clustered
around certain responses. Thus, we categorized the four TPB constructs for the texting
and dispatch device use data. Development of the individual categories is described in the
Results section.
Subjects also self-reported if they ever had experienced a series of safety critical
events while on the job [148]. Subjects first reported whether or not they ever had a crash
while on the job. After being reminded that distracted driving encompasses any activities

107��
that that take the driver’s eyes, hand, or concentration away from the primary driving
task, subjects reported whether or not they had ever had a crash while distracted, had to
brake hard to avoid a crash while distracted, and swerve to avoid a crash while distracted.
These four outcomes served as the dependent variables in four separate regression
analyses, described below, in both the texting and dispatch device populations. The Olson
�����. study found that truck drivers would undertake distracting activities in the non-
crash control periods as well as during crashes or near crashes [6]. Rather than asking
drivers if they had ever driven distracted, which can occur without negative
consequences, we asked for situations when the distraction was so great that it became a
hazard for crash or near crash.
&���������������#�����
Means and standard deviations (SDs) were calculated for age, years driving
experience and weekly driving hours. Descriptive analysis of the categorical TPB
variables was conducted. To validate the model in Figure 9 (page 99), we examined
whether or not Intentions mediated the effects of the other TPB variables on the four
outcomes [94]. To test this model required a multi-step process. First, we correlated
Norms, PBC, and Attitudes to Behavioral Intentions using logistic regression for both
texting and dispatch device use [35, 56]. Second, univariate logistic regression was used
to analyze the association of each of the four TPB constructs for texting and distracted
driving with the four crash and near crash outcomes. Univariate logistic regression was
also conducted for demographic data that the drivers reported: gender, age, driving
experience, and weekly driving hours. Third, multivariate regressions were first
108��
conducted without Intentions, then including Intentions to see if it attenuated the effects
of the other three TPB constructs, that is, did the ORs for Norms, PBC, and Attitudes
decrease and what, if any, effect was there on the significance of the ORs. A change in
the ORs towards 1.0 and/or decreasing significance of the p-values of the ORs was
considered to be a mediation effect. Control variables in the multivariate models included
on those variables that had p-values � 0.10. Entering covariates with p-values less than
0.2 has been used in model selection in the past [94]; however, using 0.10 as a cutoff is a
trade-off between including relevant covariates and model performance [119].
Results
&���������#����
Some interview participants went beyond the definition of distracted driving
given in the Background section for how they conceive of distracted driving. Participants
2, 5, and 8 expressed the belief that non-driving activities rose to the level of
“distractions” only when driving performance was impacted. Interview participant
number 2 was concerned that the distracting task was prioritized over driving and that
safely operating the vehicle then becomes a secondary task. Many participants were
concerned for the drivers’ decreased driving performance, but as one participant pointed
out, while drivers might think that they are increasing their work efficiency by
undertaking a second task, there is also a diminished capacity to carry out that second,
distracting activity. Interview participants were able to describe situations where drivers
crashed or came near to crashing when distracted. Only one of the 11 participants said

109��
that he/she did not know of any crashes involving distracted truck drivers and further
stated that he/she doubted that any driver would admit to driving distracted after a crash.
All interview participants were asked to comment on whom would influence
drivers’ decision-making for three or four distinct behaviors, such as texting, dialing a
phone, eating or drinking (many behaviors were repeated in multiple interviews). In the
10 transcribed interviews, participants stated that supervisors and/or management would
positively, negatively, or both influence drivers’ decision-making in 28 out of 32
different activities. No other social referents were named nearly as frequently. Although
the interviewer encouraged respondents to describe other potential social influences, such
as family members or coworkers, it was clear that supervisors had the biggest influence
on drivers’ decision-making process.
When asked about distracting activities, interview participants were able to
identify pros and cons of a wide variety of behaviors. Dispatch devices and cell phones
(both personally owned and owned by the company) were identified as ways for
management and drivers to stay in touch. Benefits to staying connected via such
electronic devices included updating information, route planning, informing customers on
arrival times, and being able to make emergency contacts. Drivers also could benefit
from being in phone contact with friends, family and coworkers. According to the
interview participants, being in phone contact with family members, either via phone
calls or text messages can give the drivers peace of mind from being able to check up on
family members. Interview respondents also stated that drivers could use talking on the
110��
phone as a way to ward off fatigue. Finally, complex tasks including writing notes or a
log, personal grooming, and eating or drinking could benefit drivers by allowing them to
finish up tasks that they would otherwise have to do once they have finished driving and
exited the vehicle.
Yet interview participants very strongly condemned many of these distracting
activities, saying that benefits were minor in comparison to the potential negative
consequences. Interview participant number 8 was specific about the main drawback
when he/she said:
“So it goes then beyond what were they doing specifically to their eyes are off the
road. And so it doesn't really matter whether they were texting, or reading the
newspaper, or interacting with the dispatching device. The bottom line is that their
eyes were off the forward roadway.”
Interview participants discussed all aspects of visual, cognitive, and manual distractions
as drawbacks. Comparing the different distracting behaviors, participants said that
whatever tasks took the longest or involved multiple forms of distraction (e.g., visual and
cognitive) were the most hazardous. Overall, interview participants felt that drivers
would have negative attitudes towards distracting tasks when they weighed the pros and
cons.
Interview participants felt that drivers had a great deal of personal control over
whether or not they undertake distracting behaviors while driving on the job. Even
though work pressures or family pressures might influence drivers to feel that they would
111��
need to undertake a secondary task, all the interview participants felt that it was
ultimately up to the driver to make the decision. In the words of participant number 4,
“I mean the decision ultimately rests on the driver. [There are] pressures from
things that would weigh into that. But to engage in the actual activity while
driving is completely under his control.”
However, participants described a range over control of distracting activities. Participant
number 10 stated that when reaching for objects in the vehicle cab, the more occupation-
related an object is, the less control that the driver has over that choice whereas the more
personal an object is, the more control the driver has over that choice.
Organizations could reduce drivers’ control over distracting activities by having
strong, clear policies against distracted driving. According to interview participants, strict
enforcement of these policies would be an effective deterrent, thus inhibiting drivers’
freedom to undertake distracting activities. Two interview participants cited DriveCam
(manufactured by The Driver Science Company, San Diego, CA) as one method for
monitoring driver behavior. Fear of punishment from the employer or receiving a ticket
from law enforcement for violating the U.S. Department of Transportation’s ban on
texting for commercial truck drivers [182] would further discourage drivers from driving
distracted, effectively reducing their control over undertaking that given behavior. Heavy
traffic conditions or construction zones where the driver’s full attention was needed for
driving were cited as other times that drivers might not feel free to undertake distracting
activities.

112��
One other influence on PBC and norms cited by interviews participants were laws
and law enforcement. In 2010, the Federal Motor Carrier Safety Administration issued a
rule stating that commercial truck and bus drivers were prohibited from texting while
driving [182]. The ban, which prohibits truck drivers from texting with a phone or
dispatch device, in the words of Participant 8, will be helpful in creating an
organizational safety culture where distracted driving was not the norm. Not only does
this ban create a list of prohibited activities that employers know that drivers should not
be undertaking, but also the regulation allows for an $11,000 fine for the vehicle’s owner
[182]. This last provision should give further motivation to organizations to ensure that
their drivers are not texting while driving.
&����������#����
Table 17 describes the demographics of subjects who completed the
texting and dispatch device sections of the survey. Both samples, the vast majority of
which were men, average over 20-years of experience driving and reported that they
drive more than 40 hours per week.
For the texting population, all four TPB constructs were categorized as binary
variables, because as previously noted, they were not normally distributed. Table 18
describes the distributions of these variables. The Attitudes categories are 1) those who
gave the lowest rating (i.e., one out of seven) to each of the three items on attitudes
towards texting and 2) those who gave any ratings higher than that. The Norms categories
are 1) those subjects who stated that their supervisor’s opinions were against texting and

113��
their supervisor’s opinions were very important to them and 2) subjects who gave any
other answer. The PBC categories are 1) subjects who felt it was easy to avoid texting
and stated that they would not text and 2) subjects who gave any other answer. The
Intentions categories are 1) those who intended not to text in the next 3 months and 2)
any other response.
Table 17. Descriptive data on the respondents to the components of the TPB questions
for texting while driving and reading the dispatch device while driving.
Texting while driving (n=277) Gender 265 male 9 female 3 unknown Mean SD Minimum-Maximum Age (years) 48.0 8.8 21 – 69 Driving experience (years) 22.8 10.1 1 – 45 Weekly driving (hours) 47.6 11.6 6 – 70 Using the dispatch device while driving (n=153) Gender 146 male 5 female 2 unknown Mean SD Minimum-Maximum Age (years) 46.4 8.4 21 – 69 Driving experience (years) 21.2 9.3 1 – 44 Weekly driving (hours) 47.6 11.3 6 – 70
Table 18. Descriptive data on binary TPB variables for the texting population (n=277).
Variable Level Count (%) Attitudes Negative attitudes on all three items 202 (73%)
Any other attitudes 75 (27%) Norms Supervisors oppose texting and strong motivation to comply 130 (47%)
Any other norms 147 (53%) PBC Easy to avoid texting and will not text 193 (70%)
Any other control beliefs 84 (30%) Intentions Strongly intend not to text 219 (79%)
Any other intentions 58 (21%)
There was greater variance for the TPB scores for the dispatch device questions
than there was for the texting questions. An example is presented in Figure 10, a

114��
histogram of responses to Intentions towards dispatch device use. Histograms for all TPB
constructs are presented in Appendix 6 of this Dissertation. Unlike in the texting
population, only half the subjects gave the maximum response “Definitely will not use”
and the data were more evenly spread among the other responses. Thus, the dispatch
device variables for the TPB were categorized differently than the texting population.
Figure 10. Histogram of the Intentions to use the dispatch device while driving. 1 =
Definitely will use; 4 = Neutral; 7 = Definitely will not use.
Table 19 describes the distributions for the dispatch device population. The
Attitudes categories are 1) very negative attitudes, akin to the first category in the texting
populations; 2) negative attitudes; and 3) neutral and positive attitudes towards dispatch
device use. The Norms categories are 1) those subjects who stated that both supervisor’s
opinions were against use and their supervisor’s opinions were very important; 2)
supervisor’s opinions matter and we less strongly opposed to use; 3) supervisor’s
opinions neither matter nor do not matter; and 4) supervisor’s opinions do not matter. The
0
20
40
60
80
1 2 3 4 5 6 7
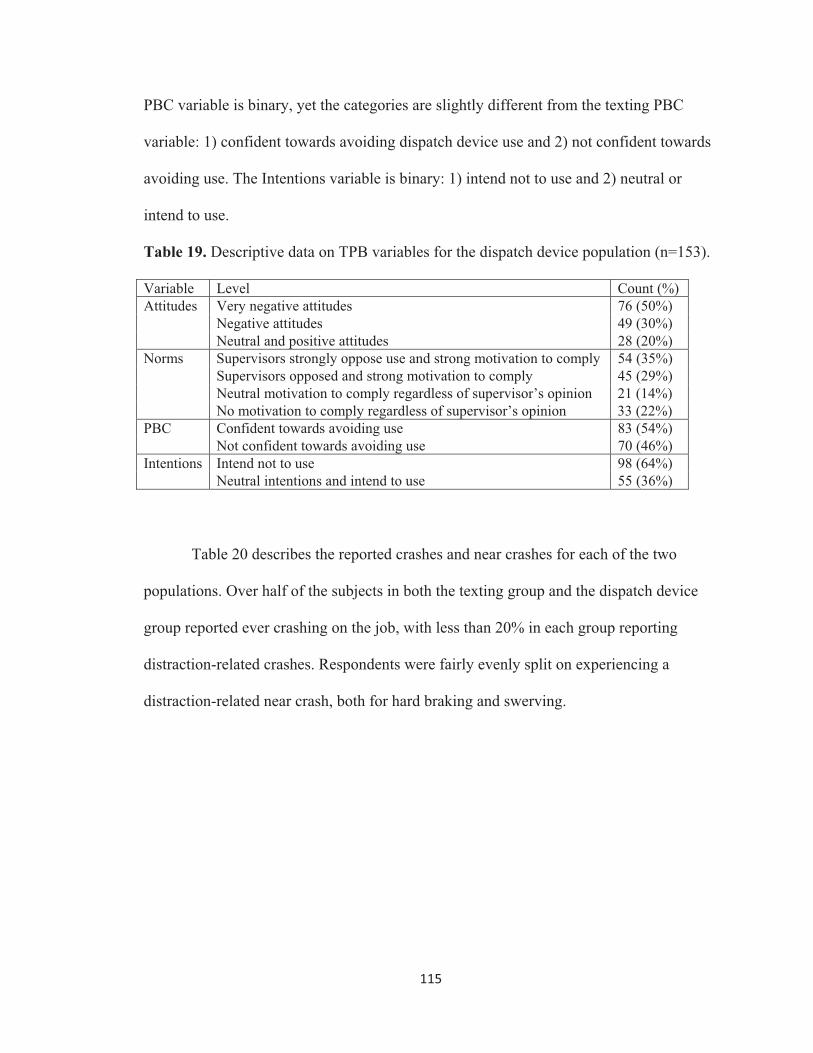
115��
PBC variable is binary, yet the categories are slightly different from the texting PBC
variable: 1) confident towards avoiding dispatch device use and 2) not confident towards
avoiding use. The Intentions variable is binary: 1) intend not to use and 2) neutral or
intend to use.
Table 19. Descriptive data on TPB variables for the dispatch device population (n=153).
Variable Level Count (%) Attitudes Very negative attitudes 76 (50%)
Negative attitudes 49 (30%) Neutral and positive attitudes 28 (20%)
Norms Supervisors strongly oppose use and strong motivation to comply 54 (35%) Supervisors opposed and strong motivation to comply 45 (29%) Neutral motivation to comply regardless of supervisor’s opinion 21 (14%) No motivation to comply regardless of supervisor’s opinion 33 (22%)
PBC Confident towards avoiding use 83 (54%) Not confident towards avoiding use 70 (46%)
Intentions Intend not to use 98 (64%) Neutral intentions and intend to use 55 (36%)
Table 20 describes the reported crashes and near crashes for each of the two
populations. Over half of the subjects in both the texting group and the dispatch device
group reported ever crashing on the job, with less than 20% in each group reporting
distraction-related crashes. Respondents were fairly evenly split on experiencing a
distraction-related near crash, both for hard braking and swerving.

116��
Table 20. Reported crashes and near crashes for subjects completing the texting and
dispatch device sections. Percent of responses are in parentheses.
Texting (n=277) Dispatch device (n=153) Yes No Missing Yes No Missing
Any crashes 151 (55%)
124 (45%)
2 (1%) 90 (59%)
62 (41%)
1 (1%)
Distraction-involved crashes
49 (18%)
228 (82%)
0 (0%) 23 (15%)
130 (85%)
0 (0%)
Distraction-involved hard braking
127 (46%)
147 (53%)
3 (1%) 76 (50%)
77 (50%)
0 (0%)
Distraction-involved swerving
121 (44%)
155 (56%)
1 (1%) 68 (44%)
85 (56%)
0 (0%)
The results of the full univariate regression analyses are presented in Appendix 6.
Here, I will briefly summarize the univariate results for the TPB constructs. For the
texting population, Norms was associated with ever experiencing a crash and distraction-
involved swerving; PBC and Intentions were associated with distraction-involved
swerving and distraction-involved braking; and Attitudes were not associated with any of
the four outcomes. For the dispatch device population, all four TPB constructs were
associated with the distraction-involved outcomes: crash, hard braking, and swerving.
None of the TPB constructs were associated with ever experiencing a crash. Those items
in bold in the tables in Appendix 6 were entered into multivariate regressions.
In the first step of a mediation analysis, the Attitudes, Norms, and PBC were
significantly associated with Intentions in logistic regression analysis for both texting and
dispatch device use populations. Table 21 presents the multivariate analyses for the
texting population for the three outcomes (ever experiencing a crash, distraction-involved
hard braking, and distraction-involved swerving) for which there were significant
multivariate results. Increased odds of crash were associated with those drivers who did
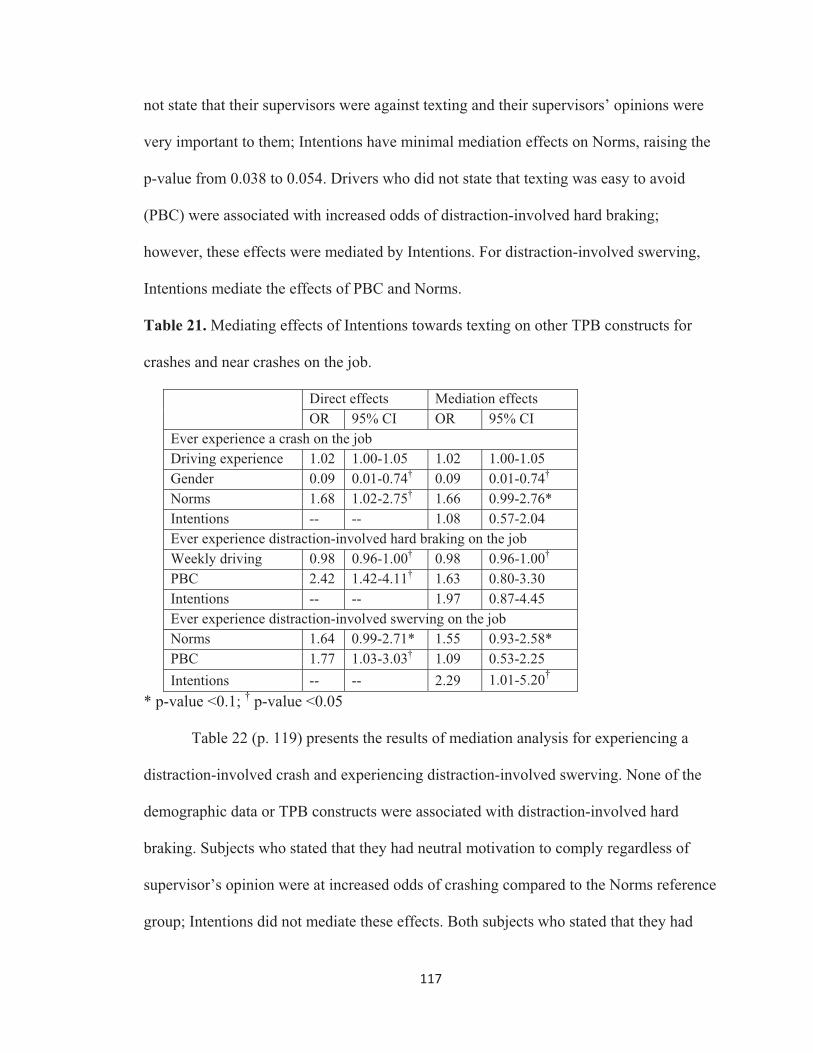
117��
not state that their supervisors were against texting and their supervisors’ opinions were
very important to them; Intentions have minimal mediation effects on Norms, raising the
p-value from 0.038 to 0.054. Drivers who did not state that texting was easy to avoid
(PBC) were associated with increased odds of distraction-involved hard braking;
however, these effects were mediated by Intentions. For distraction-involved swerving,
Intentions mediate the effects of PBC and Norms.
Table 21. Mediating effects of Intentions towards texting on other TPB constructs for
crashes and near crashes on the job.
Direct effects Mediation effects OR 95% CI OR 95% CI
Ever experience a crash on the job Driving experience 1.02 1.00-1.05 1.02 1.00-1.05 Gender 0.09 0.01-0.74† 0.09 0.01-0.74† Norms 1.68 1.02-2.75† 1.66 0.99-2.76* Intentions -- -- 1.08 0.57-2.04 Ever experience distraction-involved hard braking on the job Weekly driving 0.98 0.96-1.00† 0.98 0.96-1.00† PBC 2.42 1.42-4.11† 1.63 0.80-3.30 Intentions -- -- 1.97 0.87-4.45 Ever experience distraction-involved swerving on the job Norms 1.64 0.99-2.71* 1.55 0.93-2.58* PBC 1.77 1.03-3.03† 1.09 0.53-2.25 Intentions -- -- 2.29 1.01-5.20†
* p-value <0.1; † p-value <0.05
Table 22 (p. 119) presents the results of mediation analysis for experiencing a
distraction-involved crash and experiencing distraction-involved swerving. None of the
demographic data or TPB constructs were associated with distraction-involved hard
braking. Subjects who stated that they had neutral motivation to comply regardless of
supervisor’s opinion were at increased odds of crashing compared to the Norms reference
group; Intentions did not mediate these effects. Both subjects who stated that they had
118��
neutral motivation to comply regardless of supervisor’s opinion and subjects who stated
that they had no motivation to comply regardless of supervisor’s opinion were at
increased odds of experiencing distraction-involved swerving compared to the Norms
reference group; Intentions did not mediate these effects as well.
To summarize the quantitative analyses, when testing the TPB model in Figure 9,
Intentions did mediate the effects of the other TPB variables on the distraction-involved
outcomes in the texting population. Yet in the dispatch device population, Intentions did
not mediate the effects of norms on distraction-involved crashes and swerving.

119��
Table 6. Mediating effects of Intentions towards dispatch device use on other TPB
constructs for crashes and near crashes on the job.
Variable level Direct effects Mediation effects OR 95% CI OR 95% CI
Ever experience a distraction-involved crash on the job Driving Experience 1.04 0.98-1.09 1.04 0.98-1.09 Attitudes Very negative attitudes Reference Reference Negative attitudes 2.57 0.82-8.11 2.55 0.81-8.03
Neutral and positive attitudes 0.60 0.12-3.00 0.54 0.10-2.86
Norms
Supervisors strongly oppose use and strong motivation to comply Reference Reference
Supervisors opposed and strong motivation to comply 1.64 0.34-7.83 1.56 0.32-7.59
Neutral motivation to comply regardless of supervisor’s opinion 8.11
1.52-43.17† 7.87 1.47-42.30†
No motivation to comply regardless of supervisor’s opinion 2.20
0.45-10.74 2.07 0.41-10.37
PBC 1.74 0.54-5.77 1.49 0.39-5.67 Intentions -- -- 1.36 0.43-3.51 Ever experience distraction-involved swerving on the job Attitudes Very negative attitudes Reference Reference Negative attitudes 1.46 0.63-3.40 1.46 0.63-3.39
Neutral and positive attitudes 0.85 0.30-2.47 0.87 0.29-2.62
Norms
Supervisors strongly oppose use and strong motivation to comply Reference Reference
Supervisors opposed and strong motivation to comply 2.14 0.85-5.43 2.16 0.85-5.53
Neutral motivation to comply regardless of supervisor’s opinion 5.22
1.26-14.08† 4.24 1.27-14.20†
No motivation to comply regardless of supervisor’s opinion 5.29
1.89-14.78† 5.37 1.90-15.14†
PBC 1.31 0.57-3.06 1.38 0.49-3.84 Intentions -- -- 0.92 0.32-2.61
† p-value <0.05

120��
����������&����������� �&����������,����
While regression analysis supported the TPB framework displayed in Figure 9 for
texting, it did not do so for dispatch device use. In the interviews, participants reported
feeling that drivers ultimately had control over whether or not they undertook distracting
activities, yet one participant stated that drivers had less control over distractions that
were more work-related. Drawing from both the quantitative and qualitative analyses, it
is possible that drivers felt that they had much better control over their choices
surrounding texting than dispatch device use. The quantitative results for the texting
population support this conclusion, as Intentions mediates the effects of PBC on
distraction-involved near crash outcomes. Yet for the dispatch device use, Intentions
were more varied, and thus the social norms from drivers’ supervisors were most
important in determining distracted driving behavior.
In Tables 18 and 19, drivers indicated negative attitudes towards texting and
dispatch device use. Although interview participants believed that drivers would find
some positives to undertaking the distracting behaviors, the qualitative and quantitative
data both point to drivers having negative attitudes about distracted driving on the job. In
key informant interviews, participants felt that drivers would view distractions
negatively, yet, because they were not drivers themselves, could not speak directly to
drivers’ intentions. In this case, the quantitative results give us insight into an aspect of
TPB that the qualitative data could not give.

121��
Discussion
The results of these analyses support the important role that truck drivers’
supervisors play in preventing distracted driving on the job. Interviews with experts in
truck driving safety described how management can create a culture that either
encourages or discourages distracted driving, while surveys of IBT members
demonstrated the importance of organizational norms surrounding text messaging and
dispatch device use while driving. The importance of supervisors to driver safety has
been previously explored by Wills and colleagues in a population of professional drivers
in Australia [46, 47, 129]. In these studies, Wills ������ found that management
commitment to safety was the aspect of safety climate most correlated with safe driving
behavior [47]. Motor carrier companies have taken proactive steps to prevent distracted
driving. Both the Network of Employers for Transportation Safety [82], a private-public
partnership concerned with reducing crashes on and off the job, and the American
Trucking Association�[182], an industry advocacy group, have stated that some of their
member organizations had company policies on distracted driving prior to the 2010
federal ban on texting while driving for commercial truck drivers [182].
The results of this study and previous work also show the importance of company
policies for driver safety. Interview participants described how clearly enforced, explicit
company policies on distracted driving, with no competing implicit expectations, could
reduce employee distracted driving. A study of texting prevalence in commercial truck
drivers by Hickman and colleagues found that drivers who drove for organizations with
texting bans had a lower prevalence of texting while driving than companies without such
122��
policies [4]. Enforcement of organizational rules prohibiting electronic communications
while driving would affect both drivers’ perceived norms and PBC, as was described in
the synthesis of the qualitative and quantitative data.
The regression results on attitudes towards the two distractions did not produce
significant results. In Tables 18 and 19, the Attitude construct scores are very low, so it is
also possible that floor effects were affecting the regression analyses [183, 184]. The
interview participants were able to describe both pros and cons to undertaking a wide
range of distractions, including complex tasks, such as writing notes and personal
grooming, that were previously found to be hazardous for truck drivers [6]. It could be
that the drivers felt that they could be more efficient when doing a second task while
driving, which was seen in prior research [35] as was described by our interview
participants. Further interviews should be conducted with drivers to understand their
attitudes towards distractions.
Our regression analyses did not use distracted driving as the outcome of interest.
From the VTTI study, we know that drivers can undertake distractions while driving and
not experience any adverse events [6]. Previous research using the TPB framework has
examined intentions to undertake an activity instead of direct observation of the activity
itself [35, 56]. We did find significant correlations to Intentions for the three other TPB
constructs for both texting and dispatch device use. By examining distraction-related
crashes and near crashes, our outcomes of interest were times when distractions had
affected driver safety. This is more in line with the definition of distracted driving given
123��
by interview participants 2, 5, and 8, that is, a task is only distracting when it affects
driver safety. Alternative analyses could have included a proactive analysis, where we
measured TPB constructs then explored their association with future incidence of
distracted driving or distraction-related crashes and near crashes.
����������� �+������
This paper was limited in scope in that it could not cover drivers who are owner-
operators, which limits the generalizability of these findings to only union drivers. This
distinction is important because owner-operated drivers face work and time pressures that
are different from the union drivers that this study examined [185]. When interview
participants would begin to describe such drivers, the interviewer (DS) had to remind
them that that was beyond the scope of the study. While interview participants did
describe both union and non-union driver/management interactions, the survey results are
only applicable to union drivers. Union workers receive more safety training than their
non-union counterparts and are less likely to accept hazardous working conditions [186].
It is possible that the survey populations have safer driving behaviors and better safety
climate than non-union drivers in the U.S.
Similar to the present analysis, prior analysis of the TPB found that intentions
mediated the effects of other constructs on behavioral outcomes [187, 188]. More
advanced statistical models, such as Verschuur and Hurts’ structural equation model of
the impact of TPB on unsafe driving behaviors [189] or the path analyses of the TPB and
truck driver safety by Poulter �����. [50], should be conducted to see how each of the TPB

124��
constructs affect distracted driving in the workplace for truck drivers. The sample size for
both populations made these analytical approaches infeasible and might otherwise have
limited our results as well. It was difficult to estimate the necessary sample size for a
population and outcomes that had previously not been examined, but researchers will
now have the estimates from this study for sample size calculations in future studies.
Although we anticipated a sample size of 500 subjects as necessary for analysis, we did
find some significant results in populations of 277 and 153 subjects.
While the distribution of vehicle types for the texting population was similar to
that seen in the Census Bureau report [131], the dispatch device population has a higher
percentage of delivery van drivers. The Census report on the 2002 American truck fleet
was the final report in that series before the Census discontinued that analysis, so there is
an 11-year gap between when those data were collected and data collection in the current
study. We cannot tell if this increase is due to a greater percentage of delivery van drivers
using dispatch devices compared to drivers of larger trucks. Yet, the percent of delivery
drivers in each study population were not significantly different from one another.
No data are available to compare the percentage of delivery van drivers to larger
truck drivers in the total IBT membership in the U.S. While sampling IBT members
offers the possibility of a nationwide sample, we had no mechanism to analyze from
which states the survey subjects drove. Furthermore, we are unable to compare the
demographics of the study populations to IBT members or truck drivers. This population
was overwhelmingly male, which is consistent with both previous research [190] and the

125��
opinions of interview participants in the current study. The authors know of no
nationally-representative studies that describe driver age, experience, and weekly driving
exposure to which we can compare our study population.
This study was limited in assessment of outcomes of interest because we had to
rely on self-reported incidents. Although self-reported incident report has been validated
by previous studies [191, 192], methodological issues still remain. By asking subjects if
they had ever had a crash or distraction-related near miss, we increased the time period of
interest, and thus potential incidents. Landen and Hendricks caution that by increasing the
time period for incidents that recall bias increases beyond 12 months of recall [193]. As
the one participant who reported no knowledge of distraction-related crashes implied,
there might be social desirability bias when asking drivers to admit to distraction-related
driving outcomes; however, anonymous surveys decrease the likelihood of such bias
[180].
A final limitation was that not all subjects who completed the texting and/or
dispatch device sections answered the outcome questions. This study was part of a larger
survey of driver behavior and safety climate factors, so there were an additional 35
questions between the end of the TPB sections and the outcome measures. If the survey
was not as long, we might not have seen survey fatigue, which is one possibility for the
large numbers of respondents who skipped questions [133].

126��
This study was not designed to examine the same populations with both the
quantitative and qualitative methods; however, we believe that the mixed methods design
lends strength to our results. Collins and colleagues stated that the legitimacy of each
method within any mixed methods study should be the first measure of that study’s
legitimacy [194]. Both surveys [195] and expert opinion [196] have been used in the past
to assess truck driver safety. Using a concurrent design and analysis of the interviews and
surveys creates what Onwuegbuzie and Johnson refer to as paradigmatic mixing
legitimacy [142, 143]. That is, independent analysis of each method is conducted
separately and meta-inference allows us to draw legitimate conclusions across both
methods. Although the results of the surveys and interviews could have stood on their
own, the mixing of results in this analysis provides additional insight into driver
distraction that we would not have been able to gain had we conducted this as two
separate studies.
Conclusions
In this study, we described how distracted driving behavior in truck drivers can be
strongly impacted by their supervisors. By enforcing strict policies on distracted driving,
supervisors can affect drivers’ perceived control and norms surrounding distracted
driving, two aspects of the TPB that were correlated with negative distracted driving
outcomes. Interview participants felt that drivers would have negative attitudes towards
driving distracted and would not intend to undertake such distractions. In regression
analyses, drivers’ intentions towards texting mediated the effects of the other TPB
constructs on distraction-involved near crashes; yet their intentions towards dispatch

127��
device use did not have the same mediating effects. But utilizing qualitative and
quantitative methods for data collection and analysis, this study was able to describe how
personal and organizational factors affect drivers when deciding whether or not they
should undertake various distracting activities.

128��
Discussion
The purposes of this dissertation was to describe the epidemiology of distraction-
involved truck crashes in the U.S., examine the impact of distracted driving laws on these
fatalities, understand the impact of safety climate on distracted driving in truck drivers,
and understand factors affecting the decision-making process of truck drivers regarding
distracted driving on the job. In this dissertation, the first manuscript, Effects of State
Policies on Fatalities Involving Distracted Truck Drivers, found that while fatality rates
for distraction-involved truck crashes have been decreasing since 2007, state distracted
driving laws had no effects on fatality rates. The 2010 federal ban on texting while
driving for commercial truck drivers was associated with a decrease in the fatality rate for
all vehicle occupants in distraction-involved truck crashes, yet more data will be
necessary to establish the effects, if any, of federal ban. This is the first study to examine
fatal crashes where truck driver distraction was a factor in the crash and to see if
distracted driving laws affected these fatality rates.
The second manuscript, The Effects of Safety Climate on Distracted Driving in
Commercial Truck Drivers, explored the relation of safety climate factors to negative
outcomes of distracted driving. Although the survey of drivers from the IBT did not
produce many significant findings, interviews with experts in truck safety and distracted
driving described how these elements of safety climate might affect distracted driving for
truck drivers. From the SCQ-MD, the Communications and Procedures and Management
Commitment factors were associated with self-reported near crashes in univariate
129��
analyses. Interview subjects described how management could affect driver safety,
through work processes, time pressures, and communication methods.
In the third manuscript, Understanding Commercial Truck Drivers’ Decision-
Making Process Concerning Distracted Driving, the Theory of Planned Behavior (TPB)
was used to describe how drivers consider whether or not to undertake distractions while
driving. Interviews with experts in truck safety and distracted driving elaborated on these
findings. For both texting and dispatch device use, TPB constructs of intentions, norms,
and perceived control were associated with crash and near crash outcomes in regression
analyses. Interview subjects reported that while drivers might gain some benefits in time-
saving from undertaking distractions while driving, that the negatives of distractions
would vastly outweigh the positives. While supervisors were viewed as having the most
influence on drivers’ distracted driving behavior, interview subjects felt that the ultimate
decision on choosing whether or not to undertake distracting activities fell to the drivers
themselves.
While the first manuscript explicitly considers the impact of government policy
on truck driver safety, the second and third papers consider factors more related to the
workplace and driver-management interaction. It might appear that factors affecting the
first manuscript are different from those affecting the second and third, there are
government agencies, safety groups, labor unions, and corporate representatives that
affect all three areas. This chapter will describe how the results from the three
manuscripts are integrated and their impacts on future research and practice. It also

130��
includes an analysis of how different policy actors affect the formation and execution of
safety policies and if/how they attempted to influence the distracted driving policies
under study.
�����$���������-�������
The FMCSA ban on texting while driving [75] directly regulates truck driver
activity on the job. Because the regulation allows for a fine of both the driver and their
employer [75], this policy creates an incentive for companies to enforce this ban for their
employees. However, regulations such as these are not the sole reason that companies
implement safety programs for their drivers. Some companies had CPWD bans in place
prior to the 2009 announcement of the FMCSA regulation and its enactment in 2010, as
described in a report by The Network of Employers for Transportation Safety (NETS)
[82] and in written testimony to the FMCSA from the American Trucking Association
(ATA) [182].
A study led by Jeff Hickman at the Virginia Tech Transportation Institute (VTTI)
found that drivers who drove for companies with texting bans had a lower prevalence of
texting while driving than for drivers of companies without such policies [4].
Furthermore, the reduction in prevalence in companies with CPWD versus those
organizations without such policies was greater than the non-significant reduction found
in states that had texting bans versus states that did not have texting bans [4]. Participants
in the qualitative data collection outlined in the second and third manuscripts described
technological means for monitoring driver behavior, including in-vehicle cameras and
131��
company cell phone records. These technologies present a method for management to
proactively enforce company policy, rather than having to react to negative events,
including distracted driving citations or distraction-involved crashes involving their
employees.
The Network of Employers for Transportation Safety (NETS) is a consortium of
private and public organizations concerned with reducing crashes on and off the job
[197]. Professional organizations like NETS allow for the sharing of information and best
practices surrounding driver safety topics like distracted driving among members. The
NETS website (www.trafficsafety.org) has some publically available information on
distracted driving [198], and the NETS member companies share further information on
policies and enforcement with one another (Jack Haley2, personal communication July 2,
2013). Best practices for occupational distracted driving are also available from the
federal government. The National Institute for Occupational Safety and Health (NIOSH)
has a fact sheet concerning distracted driving in the occupational setting [199]. While
NIOSH is charged with conducting research on occupational hazards, it falls to the
Occupational Safety and Health Administration (OSHA) to regulate occupational safety
issues. OSHA has a webpage with information on distracted driving [200] and model
company policies [201], but it has not issued any regulations aimed at curbing distracted
driving in the workplace. The Federal Communications Commission (FCC), which
regulates cellular phone traffic in the U.S., also provides an online clearing house for
possible distracted driving regulations[202]; however, the FCC states on this website that
������������������������������������������������������������2 Jack Haley is the Executive Director for NETS
132��
it does not endorse any of the technological or managerial interventions listed on the
website.
�
In the Federal Register the FMCSA states that it received over 400 comments
during the 6-month open comment period [182]. Some comments came from industry
groups, including the American Trucking Association (ATA) and the Owner-Operator
Independent Drivers Association. In its comments to the FMCSA, the ATA stated that
many of its member organizations already had texting bans. On its website the ATA
states that it seeks to educate policymakers about the needs of its members [203]. If the
ATA was submitting comments to the FMCSA concerning texting, it was likely because
its members felt that this was an important issue. Although the texting ban did not go into
effect until October 2010, companies in the commercial trucking industry would have
had forewarning that the ban was coming, both from the FMCSA’s call for comments, as
well as from organizations like the ATA.
Because the unit of analysis in Manuscript 1 was the state*year, I could not
analyze the effects of the FMCSA regulation in 2010 month-by-month. A drop in
fatalities after October in comparison to January through September in 2010 would
provide some evidence that the statistically significant drop was due to the FMCSA ban,
and not other reasons, such as pre-emptive implementation of organizational policies. I
could find no analysis describing if the proposed texting ban had prompted organizations
to implement their own policies in the months prior to enactment of the FMCSA’s rule.
However, federal regulation can prompt organizations to enact policies before regulation

133��
takes effect, a recent example of which is fast food companies posting calorie information
at their stores before the relevant provisions of the Affordable Care Act went into effect
[204].
Company policies concerning distracted driving on the job would seem to fall
under the safety climate construct of “communications and procedures” [46, 129]. As part
of the key informant interviews in manuscript three, one participant said that the FMCSA
ban might create safety culture in an organization where distracted driving was
previously the norm. Moreover, as shown in Manuscript 3, those drivers who had lower
scores on the Norms TPB construct for texting and dispatch device use were more likely
to have reported swerving while distracted (lower Norms scores mean that drivers stated
that their supervisors wanted them to be in more contact while driving). So while some
companies may believe it is efficient for drivers to communicate with their supervisors
while driving [35], having a consistent policy that workers not drive distracted would
result in safer outcomes for drivers. Later in this chapter I will use the results of this
thesis and the prior literature to describe the most important factors in creating distracted
driving policies.
!�����������������������������
Described elsewhere in this dissertation, Flin and colleagues identify the most
commonly examined aspects of safety climate as 1) management/supervision, 2) safety
systems, 3) risk, 4) work pressure, and 5) competence [42]. Previous research, including
the work of Wills and colleagues in formulating the modified version of the Safety
134��
Climate Questionnaire used in manuscript two [46], describes management commitment
to safety as most important aspect of safety climate [42, 177, 178, 205]. One way for
management to commit to worker safety is through the establishment of safety and health
management systems, also known as safety management systems, or occupational safety
and health management systems (OSHMS) [206].
Systematic management of occupational safety and health has grown out of the
fields of psychology, sociology, industrial relations, occupational safety, occupational
health, and management [207]. The International Labor Office defines OSHMS as “a set
of interrelated or interacting elements to establish [occupational safety and health] policy
and objectives, and to achieve those objectives” (International Labor Office 2001, p 19)
[208]. These programs started to gain popularity in the 1990s when “accident analysis”
moved from focusing on individual errors to considering system-wide failures as the root
cause of traumatic injury and death [174, 176, 207].
Although some countries such as Canada and Norway have mandatory OSHMS
programs [206], OSHA does not require any such programs in the U.S. Aside from online
materials with best-practices for setting up these programs [209, 210], OSHA also
administers the Susan Harwood Training Grant Program for non-profit organizations that
can be used to expand safety and health capacities or for demonstration projects on safety
and health [211]. Robson ������ refer to OSHMS programs not mandated by regulation as
“voluntary” [206]. These programs can be incentivized by government agencies (such as
OSHA) or insurers. Robson and colleagues find that mandatory OSHMS programs are by

135��
their regulatory nature, very broad in their requirements, whereas voluntary programs are
highly complex and usually only found in large companies [206].
An examination of all aspects of OSHMS programs for truck driver health and
safety is beyond the scope of this dissertation. I will now discuss what I believe to be
important factors for organizations to consider when creating a distracted driving
component of a SMS. To do so, I will draw on data both from the Olson ������ VTTI
study [6] (see also Appendix 1) from my dissertation research.
An organization should first consider whether or not a specific type of driver
should require contact with his or her supervisor while driving. As part of the surveys in
this dissertation research, I asked IBT drivers to identify which industry [58] they drove
for. The different types of drivers would all have different requirements put on their time
and scheduling. One of the participants in key informant interviews described how little
personal time a UPS delivery driver has while driving his/her route. In this example, a
UPS driver (who would fall under the IBT “express” industry) would have much less
control over their personal time than drivers who drove more point-to-point routes, such
as carhaul, tankhaul and freight industries [58].
I had hoped that the survey sample would be large enough to analyze crash and
near-crash risk by IBT industry; however the power for such analysis was not possible
with this sample. The third study on the SCQ by Wills ����� was the only previous work
that I could identify where safety climate was compared across organizations [129]. This

136��
Wills �����. study, which did not any information about the organizations, including the
kind of driving employees were undertaking, did not find any significant differences
between the different organization’s safety climate scores. Future analyses should
compare safety climate across organizations and across driving industries. (Similarly,
Poulter �����. analyzed the effect of TPB on driver behavior in three different motor
carrier organizations, yet they did not analyze between-company differences either [50].)
If organizations decide that the cost-benefit analysis of contact between drivers
and supervisors is beneficial [35], they should consider risk to the drivers and other legal
factors. The Olson ������ VTTI study [6] (see Appendix 1) found an increased odds of
crash or near crash when truck drivers were texting while driving (odds ratio (OR)=
23.2); reaching for an electronic device like a cell phone or two-way radio (OR= 6.7); or
interacting with or reading a dispatch device (OR=9.9). The risk for crash exposes
companies to liability from property damage-, injury-, or fatality-involved crashes [37],
or costs associated with workers’ compensation [38].
Management should also be aware of what laws and regulations certain methods
of contact would violate. If drivers are contacted via text message for delivery updates,
that would violate the FMCSA regulation and force drivers to break the law. The Final
Rule from the FMCSA also states that drivers cannot use the dispatch device for text
messages while driving [212]. If drivers were required to answer their handheld cell
phone while driving to respond to their supervisors, then that would violate the law in
several states [70]. Yet, as I described in the second manuscript, a participant said in the

137��
second manuscript, drivers could get conflicting messages from supervisors where they
have the “[i]mplicit expectation that they use the device while driving so that they can
respond in a timely fashion to requests from the company.”
These conflicting messages would affect the Intentions and Norms aspects of the
TPB. Drivers might not intend to violate the law and explicit company policy, but they
would still feel pressure to do so. If drivers know that violating internal policy and law is
the norm within an organization, it could create a climate where drivers have poor
attitudes concerning Wills and colleagues’ safety climate factors of communications and
procedures, work pressure, management commitment, and safety rules [46, 129].
)�������������.� ����������'!�����
While considering the ban on texting for truck drivers, the FMCSA also received
comments advocating for and against banning all CPWD [182]. The FMCSA
acknowledged the existing research on CPWD and crash risk, yet stated that banning all
cell phone use for commercial truck drivers was beyond the proposed rule-making.
However, because of the powers delegated to the FMCSA [25], it could consider a
handheld or hands-free cell phone ban in the future.
It could be that regulating commercial truck and bus drivers was an example of
the federal government regulating where it was easily able to do so. Other examples of
the federal government regulating texting under its jurisdiction includes CPWD for
federal employees [81], and train operators [213]. As described in the Introduction

138��
chapter, it is easier for the federal government to regulate driver behavior in truck drivers
than it is for it to regulate drivers of personally owned vehicles. If the DOT was to
connect highway funding to state texting bans, as it had previously done for state drunk
driving laws [73], such legislation would face a much more difficult path through
Congress than simple regulation by the executive branch. In this section, I will review
how some of the stakeholder groups already mentioned in this chapter have affected the
previous regulatory process with an eye towards future regulations.
Advocacy organizations like NETS and the ATA can also influence the rule-
making process. In John Kingdon’s analysis of the federal policy process, interest groups
are found to more often oppose changes in the status quo and block action rather than
promote regulation [214]. During the comment period for the FMCSA texting ban, the
Federal Register reports that the ATA supported this ban; however, elsewhere in the
Federal Register reporting the FMCSA’s rule-making process, the ATA resisted many of
the regulations that the FMCSA was proposing [182]. For example, the ATA wanted
texting from the dispatch device to be exempted from the ban, a decision that the FMCSA
ruled against, and the ATA also felt that the fines on employers were not warranted for
companies that already had their own texting bans [182]. During motor carrier industry
deregulation, completed in 1980, the ATA was also initially against changes to the
system, yet ultimately supported the final legislation that was move favorable to their
constituents [215]. If the FMCSA was to offer future regulation on CPWD, the ATA
would definitely be opposed to that. Although it is beyond the scope of this dissertation,

139��
the comments submitted to the FMCSA could be analyzed in terms of which
organizations were for and against different components of the proposed rule.
Apart from federal regulation are the state bans on texting and handheld CPWD.
On June 19, 2013 Florida became the 41st state to ban texting while driving [70]. As
reviewed in the Introduction, and reinforced in manuscript one, there is currently no
evidence that state texting or CPWD bans reduce crashes or fatalities. Although state
CPWD laws have not been shown to decrease crashes or fatalities, the exact way that the
states enact, implement, and enforce the laws might affect the laws’ effectiveness [69].
Amendola reviewed the Connecticut CPWD ban and enumerated many reasons why it
had not yet been shown to be effective [165]. For example, Amendola found that unlike
Washington, DC, which aggressively enforces its handheld cell phone ban, other states
do not do a very good job of enforcing CPWD bans and as a result, drivers do not feel
that the laws apply to them. In some states like Pennsylvania [76], there is a high burden
of proof placed on the law enforcement officers when attempting to issue such a citation
for CPWD. Requiring the officers to pass a very high burden of proof to issue a citation
might further discourage officers from issuing CPWD citations.
When NHTSA created its pilot distracted driving deterrence program in 2010 –
2011 [80], high-visibility law enforcement was one of the pillars of the program. Shown
to be effective in the seat-belt enforcement programs of “Click it or Ticket” [216], raising
the profile of law enforcement and also the threat of receiving a citation, this might be
one method for countering the perception of drivers who do not believe that the texting

140��
bans apply to them [165]. Although the FMCSA acknowledged that there would be a
period where law enforcement would have to learn best practices for enforcing the
texting ban for commercial drivers, the agency reasoned that this should not be sufficient
to delay enacting the rule. How well this ban is implemented and enforced in the future
will impact its effectiveness. A complication of observing distracted driving activity in
truck drivers is how difficult it is for officers or observes to see into these large vehicles.
The FMCSA sought to address such a problem during an investigation of seatbelt use in
truck drivers [217], so observing distracted driving might be able to be accomplished by
similar methods. To observe seatbelt use in truck driver, law enforcement needed to be
positioned on overpasses or other raised locations. Thus, enforcement of truck driver
behavior could be more resource-intensive, but is not infeasible.
In the first manuscript, I found that truck length and rural maximum speed limit
were state-level regulations that affected distraction-involved truck crash fatality rates.
This reflects the analysis of Neeley and Richard’s paper on the effects of state regulations
on truck crash fatality rates [87]. Neeley and Richardson’s analysis influenced me when I
was designing my analysis because they showed how fatality rates in trucks can be
affected by aspects beyond policies directly related to truck drivers, including state
highway expenditures and unemployment rates. Because of the social and monetary costs
of the motor carrier industry, such as fatalities, pollution, and road maintenance, that are
not completely offset by the taxes and fees levied by the states [218], states should have
an interest in motor carrier safety. Analyses like mine and that of Neeley and Richardson
show that states should be able to effect distracted driving motor carrier safety through

141��
means other than just regulation of distracted driving. So while my analysis finds that
states can impact distraction-involved truck crash fatality rates, the regulations whose
aims are specifically to reduce the crash risks presented by distracted driving (i.e., CPWD
bans) did not affect distraction-involved crash rates.
����)���������,���������������'!������� �/�-���������,������
According to Kingdon, academics, researchers and consultants are important parts
of the policy process that often affect the policy alternatives more so than the policy
agenda itself [214]. In the case of the texting ban, research from the Virginia Tech
Transportation Institute actually helped drive the agenda. As discussed throughout this
dissertation, the VTTI study led by Rebecca Olson produced a very thorough analysis of
crash risk for truck drivers undertaking different distracted driving activities [6]. The
study, funded by the FMCSA, has also been heavily cited by the federal government.
Simply referred to as “the VTTI Study,” the statistic that texting while driving increases
crash risk by 23 times was referenced by the federal government in such locations as the
FCC’s distracted driving information page [202], and the texting ban Final Rule in the
Federal Register [182].
Research on motor carrier regulation has previously influenced federal policy on
truck driver safety. When the FMCSA changed its hours-of-service regulations in 2003
[219] it directly affected an important aspect of driver safety: fatigue [220]. Recent
analyses of the 2003 hours-of-service regulation found that drivers were not driving more
after the increase in allowable consecutive driving time [221], and, in two studies by
142��
VTTI, drivers were not experiencing increased crash risk during the longer hours-of-
service [222, 223]. By court order the FMCSA was forced to revisit the hours-of-service
regulations [221] and in the subsequent 2011 regulatory analysis the FMCSA cited work
by VTTI in their analysis of the new regulations [224].
������)������������������������,������
Further analysis of the FMCSA will be required to determine whether or not the
decrease in fatality rates associated with the ban is sustained. Although I chose to follow
the method of Wilson and Stimpson for analyzing state fatality rates [14], there are other
regression methods available for analyzing these fatalities. Fowles and colleagues
conducted an econometric analysis of truck crash-related fatalities in relation to cell
phone use across a 30-year span in the U.S. [108]. Their analysis did not analyze states,
nor consider state CPWD bans or the 2010 FMCSA ban; however, their study lays out a
detailed method for further analysis. I also believe that further analysis using the
naturalistic driving method found in the VTTI study would be an appropriate way to test
the effectiveness of the ban. The VTTI studies resulted in thousands of hours of in-
vehicle video [6] of drivers that could serve as baseline for a follow-up study. Although
this was a personnel- and resource-intensive, repeating the study could be a way to
compare prevalence of distracted driving pre- and post-ban.
Future research will also be necessary to consider how organizations can affect
distracted driving in their employees. In the NETS report on distracted driving, some of
the anonymous member companies reported reserving the right to terminate workers
143��
violating bans on either handheld CPWD or texting-while-driving [82]. Future analysis
should examine the safety climate for drivers from different organizations operating
under different CPWD bans to determine the effects of specific prohibition and
enforcement components, expanding on the work of Wills �����. that did not find any
between-organizational differences in organizational safety climate [129]. I believe that
this could be done with either quantitative or qualitative methods. A quantitative
approach would be to use the methods of Hickman �����. to naturalistically observe the
prevalence of CPWD and examine which aspects of company policy are best for reducing
prevalence [4]. Interviews or focus groups could also be conducted with drivers and
management, from the same organizations and different organizations, to understand
what both sides view as effective organizational policies for reducing driver distraction.
My third manuscript used the TPB as the conceptual framework for describing
distracted driving behavior. Gielen and Sleet [225] reviewed behavioral health theories
for their impact on behavior change. Their review could provide the framework for
changing driver behavior at the individual-level (e.g., using the stages of change model)
or at the organization- or community-level (e.g., using community mobilization) [225].
Due to logistical challenges, I was unable to conduct focus groups with truck drivers as
part of my research, a method that allows for participants to comment on and accept or
reject their peers’ reasoning on decision-making [226]. Because I relied on key informant
interviews with driving safety experts and not drivers themselves, the qualitative analysis
of the Attitude and Intentions TPB constructs was not as in-depth as it could have been.
144��
����������� �+����������������� ��!����
As has been described throughout this thesis, the methods employed have
strengths and limitations. In this section I will now review the strengths and limitations of
the methods used in this dissertation, and describe how the limitations could be addressed
with future research.
Using the Fatality Analysis Reporting System (FARS) database as the basis for
Manuscript 1 produces both challenges and great opportunities in the analysis. A first
limitation is that this database only captures crashes involving fatalities. Crashes
involving no injuries or non-fatal injuries are much more common than fatal crashes
[130]. The National Highway Transportation Safety Administration (NHTSA) has
another database, the National Automotive Sampling System’s General Estimating
System (GES), which captures data on crashes of all severities [151]. While FARS is a
census of all fatal crashes in a given year, GES is only a representative sample of crashes
in the U.S. Thus, in choosing to use FARS over GES, I was trading the breadth of crash
types found in GES for the validity of capturing every fatal crash in the U.S. during the
study period.
Although previous research has used FARS to study distraction-related crashes in
the U.S. [14, 160], it is not without limitations. In a report for NHTSA, Ascone and
colleagues find that both FARS and GES distraction data could be limited in their
reliance on police reports for distraction data in crashes [151]. Furthermore, Ascone ������
raise concerns about the consistency of police reporting of distractions across
145��
jurisdictions. Validation of the distraction variables as described in Table 1 of Manuscript
1 should be undertaken in the future as more studies of distracted driving rely on the
FARS database. Ascone ������ describe the National Motor Vehicle Crash Causation
Survey as a resource-intense method previously used for analyzing a small sample of
crashes [151]. A similar analysis could serve as a validation method for distraction-
involved crashes. While the validity of the distraction variables is not yet established, the
FARS database has been so often used for other fatal crash analyses (see Chen ����� [162]
and Carpenter and Pressley as two examples [227]) that it allows for comparison to the
wider literature on motor vehicle crash fatalities in the U.S.
The statistical model used in Manuscript 1 is another strength of the analysis.
From the ANOVA, there was more between-state variation than there was within-state
variation. Because of this clustering, a multi-level model was necessary [94]. A recent
study of the effects of cell phone on truck crashes released in early 2013 by Fowles and
colleagues did not employ such a mutli-level analysis [108]. Whereas the Fowles ������
paper was more concerned with long-term longitudinal effects of cell phones, they did
not explore the effects of state laws on truck crashes. This decision to analyze state laws
did not allow for the in-depth model testing seen in the Fowles ����� paper [108];
however, analysis of truck driver fatalities from Neeley and Richardson showed the
effects of state laws [87], and thus the multi-level approach was chosen. Finally, the
choice of the longitudinal model allows for analysis of change within states over time.
This is consistent with many prior analyses of health and transportation policies.

146��
The selection of diesel VMTs was another choice that adds strength to Manuscript
1. The selection of VMT for rate calculation was consistent with many other occupational
and non-occupational transportation studies. An alternative method for calculating
occupational fatality rates would have been to use data from the Bureau of Labor
Statistics (BLS) on workers in a given industry [156]. Although this would allow for
fatality rate comparisons between industries [228], the BLS data do not have the number
of employees in a given industry by state. Choosing diesel VMTs was another important
selection for the analysis. The DOT publishes data on VMTs for all vehicle traffic in a
state, but the choice of diesel VMTs allowed for the observation of occupational exposure
for this population.
Although the analysis of fatality rates using VMTs was a strength of the study
design, Manuscript 1 did not account for other trends in distraction-related crashes or
commercial truck crashes. Snowden and colleagues conducted one such analysis,
examining the effects of random alcohol testing on large truck fatal crashes, using light
truck as a comparison group [163]. To conduct such an analysis, an appropriate
comparison group would be required. Future analyses could be conducted comparing
truck-involved distraction fatalities to rates of all distraction-involved fatalities in the
U.S. [14] or for all truck-involved fatalities [150].
Another method for examining the impact of state laws would be an interrupted
time series difference-in-difference approach [229]. This difference-in-difference method
is useful in examining the effects of transportation policies on crashes and fatalities, yet it
147��
requires a greater number of time points than was available in our state*year analysis
[229, 230]. Such an analysis might be feasible in the future for states with very high
fatality counts, such as California, Texas, Oklahoma, and Pennsylvania, using
state*month as the time period of interest.
In Manuscript 1, I analyzed fatal crashes where the truck driver was killed and
fatal crashes where any vehicle occupant in any vehicle involved in the crash was killed.
This creates the assumption that crashes in the first group and second group are similar.
NHTSA analyzed fatal crashes in the U.S. and found that 2/3 of crashes in which a truck
driver was killed were single-vehicle crashes [150]. The same NHTSA report finds that
2,790 occupants of other vehicles were killed in multi-vehicle truck-involved crashes in
2010 compared to only 192 truck drivers who were killed in multi-vehicle truck-involved
crashes. These data indicate that the types of crashes resulting in fatalities to truck drivers
are different than those crashes that result in fatalities in other vehicle occupants. This
study was not designed to analyze crash type, but future analysis of truck crashes should
account for these differences.
In Manuscripts 2 and 3, there were strengths and limitations for both methods, in
addition to how the methods were mixed. Although the study proposal originally
included focus groups of IBT member drivers, logistical challenges necessitated the use
of key informant interviews. While expert opinion has been used to understand truck
driver safety in the past [196], the elicitation interview process for TPB studies usually is
performed with the same population that will be surveyed [52]. The snowball sampling
148��
technique also allowed me to access experts that I would not have previously known of,
or considered for study. For example, I had met Jack Hanley of NETS at a conference
and although he felt that he was not an appropriate study subject, he was able to direct me
to another NETS member who was able to provide the prospective of an expert from the
management side of driver safety.
Although interview subjects made occasional reference to owner-operators during
the interviews, no analysis of situations unique to owner-operators was conducted [185].
Further analysis should examine the effects of distracted driving on owner-operators and
consider how their work pressures affect decision-making while driving. Although
analysis of interviews was not only limited to discussion of union drivers, the survey was
a purely union population. Union workers receive more safety training than their non-
union counterparts and are less likely to accept hazardous working conditions [186]. It is
possible that the survey population in Manuscript 2 and 3 have safer driving behaviors
and better safety climate than non-union drivers in the U.S.
In Appendix 5, I describe the frequency with which drivers reported which
vehicles they drove. As discussed in the Methods section, I believe that the samples in
Manuscripts 2 and 3 are representative of the American truck drivers, although I had few
variables on which to test this hypothesis. While the Census data on the American truck
fleet provided a comprehensive picture of vehicles in the U.S., that particular series of
reports was ceased in 2004. The annual Highway Statistics reports from the FHWA
report on vehicle fleet composition by state, but these data are not comparable to the IBT
149��
industry groups used in this analysis [97]. While previous studies of commercial truck
drivers in the U.S. have provided demographic data on their study populations (see
Suzuki �����. as an example [190]), no national demographic data were available to which
I could compare my survey samples. Although I partnered with the IBT to conduct this
study, I have no data indicating how representative these samples are of IBT drivers.
A benefit of partnering with the IBT is that the union represents drivers across the
U.S., giving me the potential for a nationwide sample. However, as an attempt to keep the
data as anonymous as possible for the respondents, I did not ask in which state(s) they
drove or lived. So while Manuscripts 2 and 3 had the potential to be a nationally-
representative sample, I regret that I did not gather information on state or at least region
of the country from the respondents. Another limitation of the survey was that subjects
were able to skip some pages of the survey without penalty. This led to incomplete
answers to the TPB questions, the SCQ-MD, or both. Furthermore, the four crash and
near crash outcomes were at the end of the survey, and thus the most commonly skipped
items. It is possible that better organization of the survey might have produced stronger
quantitative results.
This selection of different populations resulted in a trade-off of study validity. By
not restricting interviews to only examine the driving experiences of union members prior
to the survey of IBT members reduces internal validity; yet, external validity is increased
when qualitative analysis of a broader driver population is used to elucidate surveys of
the chosen population [142]. Part of this decision about which populations to include was

150��
pragmatic: I was able to access a wide number of IBT drivers online via the
organization’s own online media, whereas contacting as large a population of non-union
drivers would have been more difficult. Furthermore, partnering with the IBT lent
increased legitimacy to my recruitment announcement. By posting the material on the
IBT’s website, members would understand that the study has gone through some sort of
vetting process by IBT leadership and that I wasn’t seeking to take advantage of them.
For both Manuscripts 2 and 3, ������ relationships (the TPB, Wills ������’s work
on the SCQ-MD) were hypothesized to describe distracted driving and safe driver
behavior. Because of the existing theoretical framework, these studies were conducted
using what Morse refers to as a deductive framework [138]. That is, while quantitative
and qualitative data were analyzed together in Manuscript 3, the underlying TPB
framework drives study design and data analysis. An alternative to this method would
have been to develop the theoretical framework ������ with the qualitative methods
being complemented by the surveys. This study did not allow for the time for developing
and pilot-testing new surveys that may have been developed from a grounded theory
approach [127127]. Furthermore, the use of TPB and safety climate frameworks allows
for the results of Manuscripts 2 and 3 to be placed more easily into the larger
occupational safety climate and health behavior literatures, respectively.
Conclusion
In this dissertation, I examined the effects of state and federal policies,
organizational safety climate, and driver behavior on distracted driving in commercial
151��
truck drivers. This study will make significant contributions to the growing literature on
distracted driving. By examining an occupational population, this study also contributes
to the greater research on occupational health and safety in the motor carrier industry.
While recent research on the motor carrier industry has focused on driver health and
wellness, this dissertation is a return to examining their occupational safety for a risk
factor that has been understudied in this population. Finally, by using a mixed methods
approach, I expanded this methodology into new areas of occupational health and driver
behavior. This dissertation has shown that federal policy, organizational safety climate,
and driver decision-making are important factors that should be considered when seeking
to reduce distracted driving in commercial truck drivers in the U.S.

152��
Appendix 1. Secondary and tertiary distractions undertaken by commercial truck drivers in the VTTI Study. Odds ratios and lower confidence limit (LCL) and upper confidence limit (UCL) are for safety critical events (Olson �����, Table 3, p xxi).
����
153��
Appendix 2. Approved key informant interview script used in phase 1 of mixed method data collection.
��

154��
�� �

155��
Appendix 3. Online survey administered to IBT drivers.

156��

157��
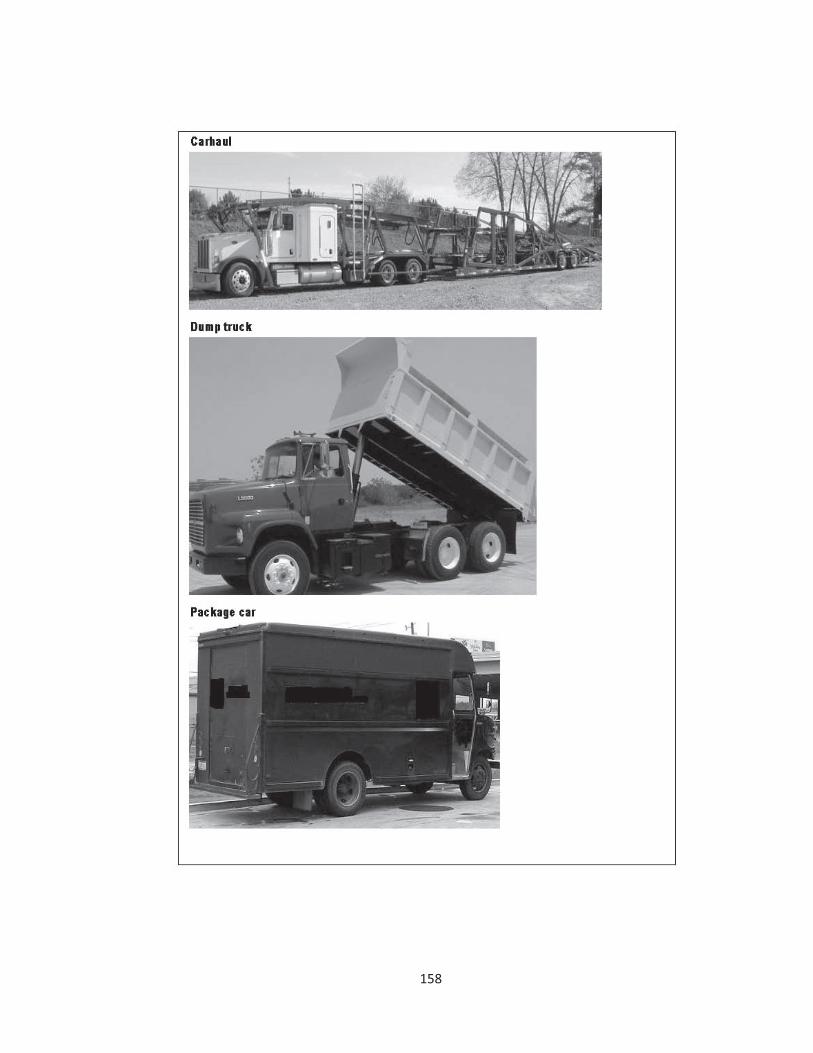
158��

159��

160��
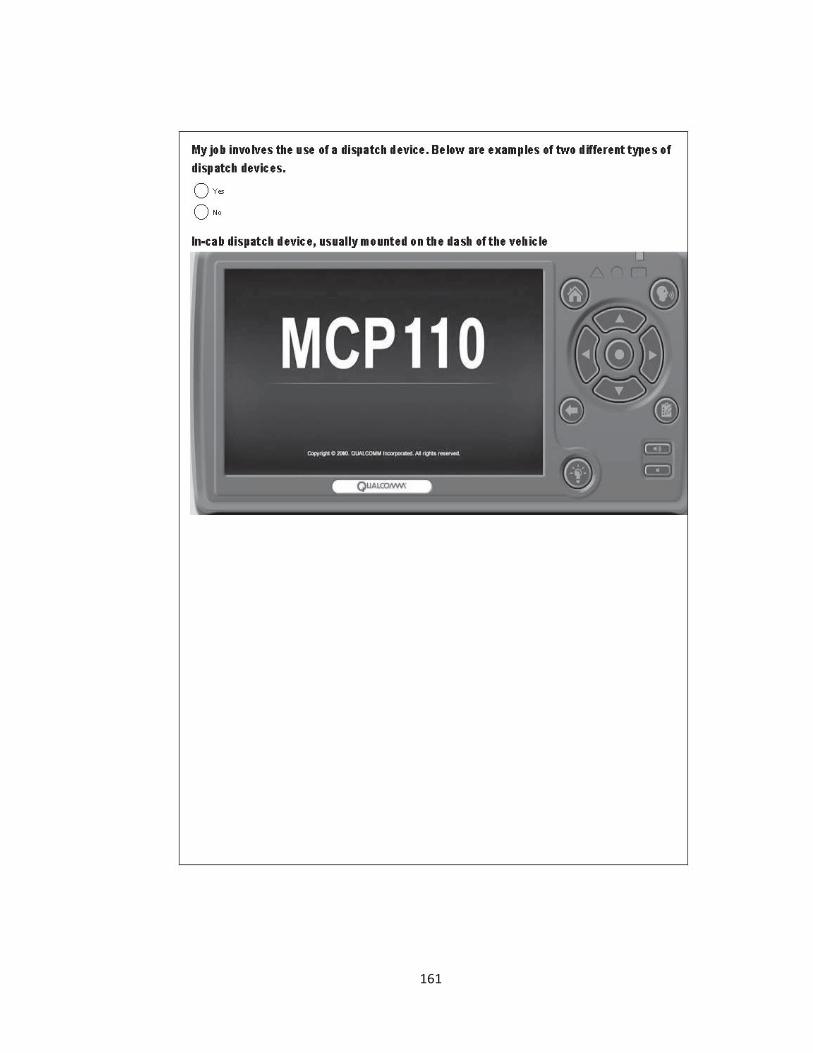
161��

162��

163��

164��

165��

166��

167��

168��

169��
�
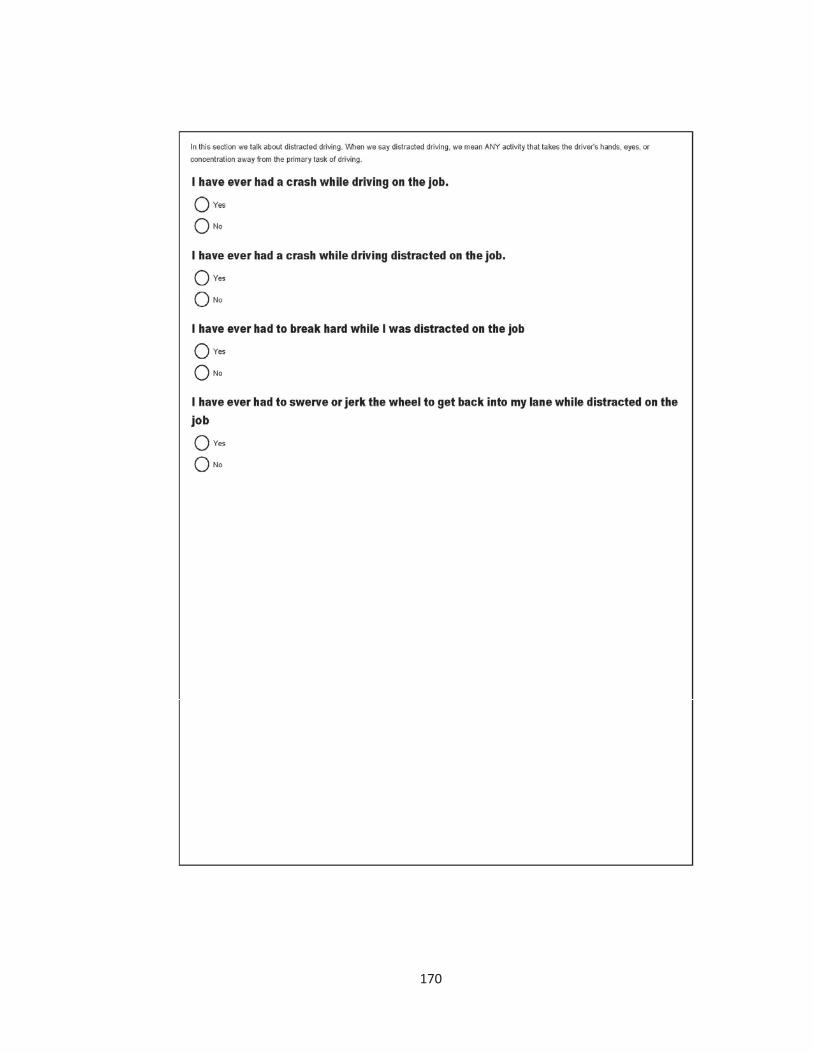
170��
��� �
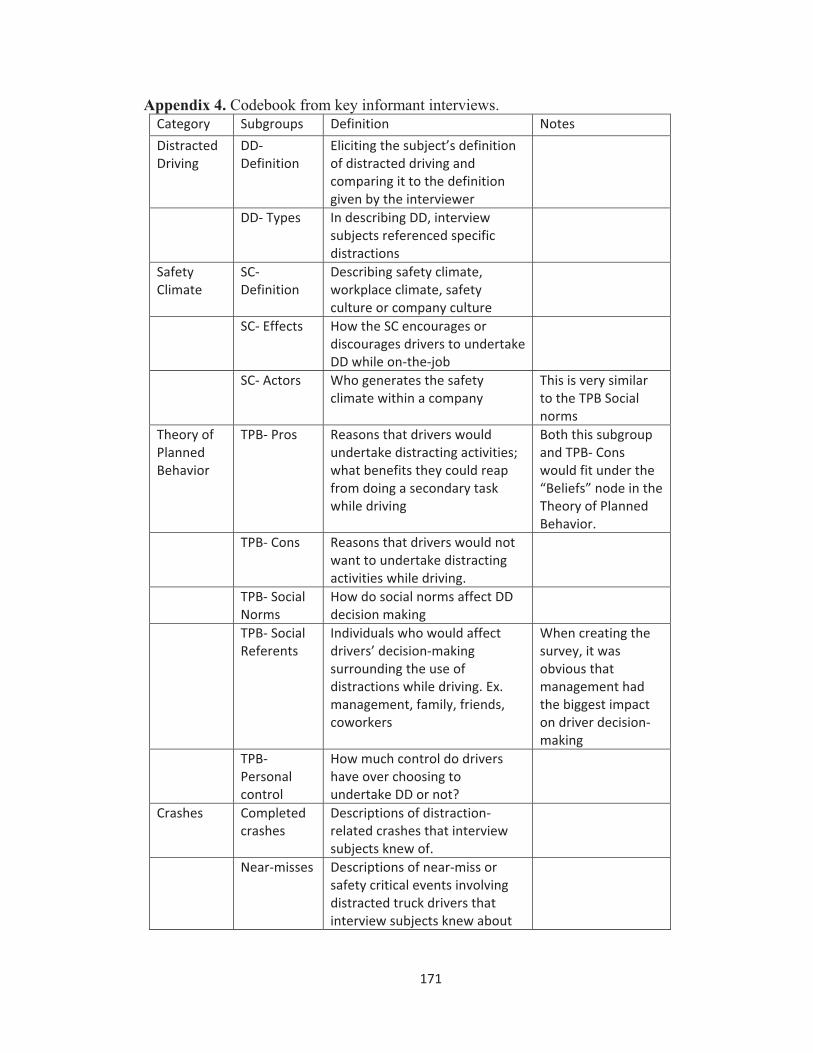
171��
Appendix 4. Codebook from key informant interviews. Category� Subgroups� Definition� Notes�Distracted�Driving�
DD��Definition�
Eliciting�the�subject’s�definition�of�distracted�driving�and�comparing�it�to�the�definition�given�by�the�interviewer�
�
� DD��Types� In�describing�DD,�interview�subjects�referenced�specific�distractions�
�
Safety�Climate�
SC��Definition�
Describing�safety�climate,�workplace�climate,�safety�culture�or�company�culture�
�
� SC��Effects� How�the�SC�encourages�or�discourages�drivers�to�undertake�DD�while�on�the�job�
�
� SC��Actors� Who�generates�the�safety�climate�within�a�company�
This�is�very�similar�to�the�TPB�Social�norms�
Theory�of�Planned�Behavior�
TPB��Pros� Reasons�that�drivers�would�undertake�distracting�activities;�what�benefits�they�could�reap�from�doing�a�secondary�task�while�driving�
Both�this�subgroup�and�TPB��Cons�would�fit�under�the�“Beliefs”�node�in�the�Theory�of�Planned�Behavior.�
� TPB��Cons� Reasons�that�drivers�would�not�want�to�undertake�distracting�activities�while�driving.�
�
� TPB��Social�Norms�
How�do�social�norms�affect�DD�decision�making�
�
� TPB��Social�Referents�
Individuals�who�would�affect�drivers’�decision�making�surrounding�the�use�of�distractions�while�driving.�Ex.�management,�family,�friends,�coworkers�
When�creating�the�survey,�it�was�obvious�that�management�had�the�biggest�impact�on�driver�decision�making�
� TPB��Personal�control�
How�much�control�do�drivers�have�over�choosing�to�undertake�DD�or�not?�
�
Crashes� Completed�crashes�
Descriptions�of�distraction�related�crashes�that�interview�subjects�knew�of.�
�
� Near�misses� Descriptions�of�near�miss�or�safety�critical�events�involving�distracted�truck�drivers�that�interview�subjects�knew�about�
�
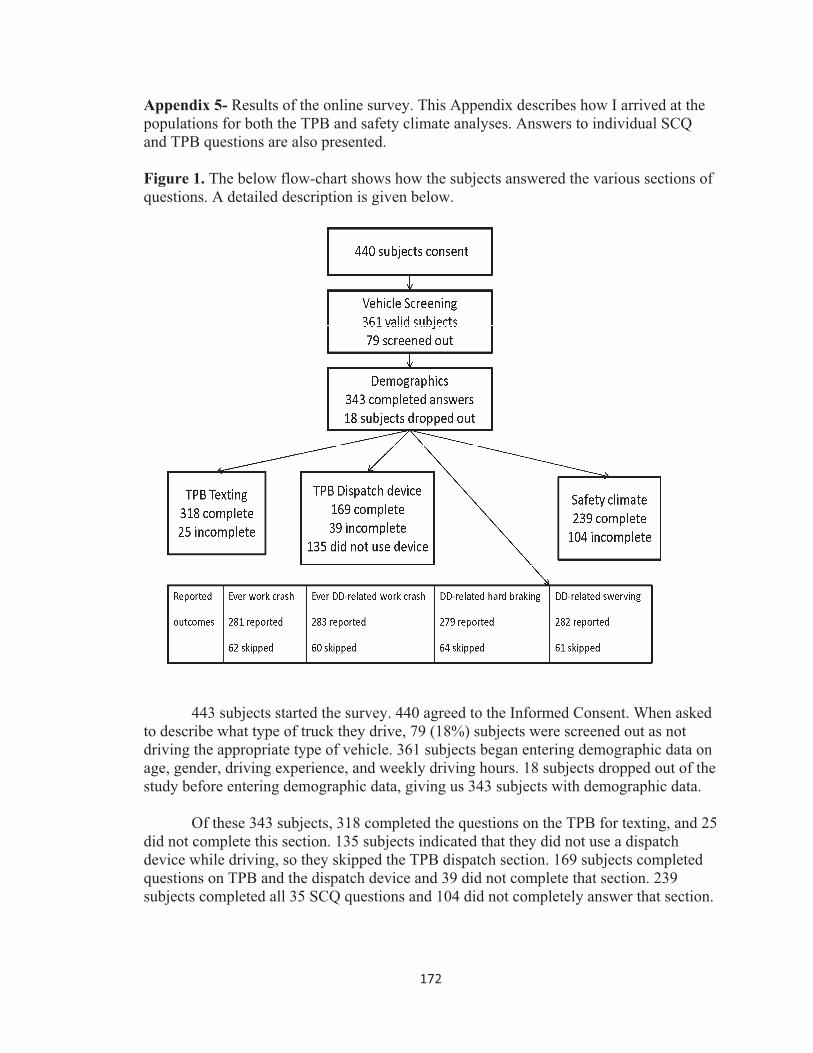
172��
Appendix 5- Results of the online survey. This Appendix describes how I arrived at the populations for both the TPB and safety climate analyses. Answers to individual SCQ and TPB questions are also presented. Figure 1. The below flow-chart shows how the subjects answered the various sections of questions. A detailed description is given below.
��
443 subjects started the survey. 440 agreed to the Informed Consent. When asked to describe what type of truck they drive, 79 (18%) subjects were screened out as not driving the appropriate type of vehicle. 361 subjects began entering demographic data on age, gender, driving experience, and weekly driving hours. 18 subjects dropped out of the study before entering demographic data, giving us 343 subjects with demographic data.
Of these 343 subjects, 318 completed the questions on the TPB for texting, and 25 did not complete this section. 135 subjects indicated that they did not use a dispatch device while driving, so they skipped the TPB dispatch section. 169 subjects completed questions on TPB and the dispatch device and 39 did not complete that section. 239 subjects completed all 35 SCQ questions and 104 did not completely answer that section.

173��
Of the 343 subjects who completed the demographic data, 283 answered at least one of the 4 outcome questions; 277 responded to all 4 outcomes. The exact number of respondents to each outcome were as follows: 281 reported if they had ever been in a crash on the job; 283 reported if they had ever had a distracted driving-related crash on the job; 279 reported whether or not they had ever had to undertake distraction-related hard or emergency braking on the job; and 282 reported whether or not they had to swerve due to distraction while on the job. ����������� ���
Table 1 displays the results of the demographic data for the total sample of 343 subjects that answered the demographic questions; those who completed the TPB sections on texting and dispatch device use (presented separately); and those who completed the safety climate questions. Using t-tests, all four groups reported in the table are statistically similar for each demographic variable. �Table�1.�
All�demographic�data�(n=343)�Gender� 328�male� 9�female� 6�unknown�� Mean� SD� Range�Age�(years)� 47.6� 8.8� 21�–�69�Driving�experience�(years)� 22.2� 10.1� 1�–�45�Weekly�driving�(hours)� 47.6� 11.8� 6�–�70��Theory�of�Planned�Behavior��Texting�(n=277)�Gender� 265�male� 9�female� 6�unknown�� Mean� SD� Minimum�Maximum�Age�(years)� 48.0� 8.8� 21�–�69�Driving�experience�(years)� 22.8� 10.1� 1�–�45�Weekly�driving�(hours)� 47.6� 11.6� 6�–�70�Theory�of�Planned�Behavior��Dispatch�device�(n=153)�Gender� 146�male� 5�female� 2�unknown�� Mean� SD� Minimum�Maximum�Age�(years)� 46.4� 8.4� 21�–�69�Driving�experience�(years)� 21.2� 9.3� 1�–�44�Weekly�driving�(hours)� 47.6� 11.3� 6�–�70��Safety�climate�questionnaire�(n=239)�Gender� 229�male� 7�female� 3�unknown�� Mean� SD� Minimum�Maximum�Age�(years)� 48.0� 8.9� 21�–�69�Driving�experience�(years)� 22.7� 10.1� 1�–�45�Weekly�driving�(hours)� 47.6� 11.4� 6�–�70�
�� �

174��
0������������"���������,���� ��� Table 2 shows the vehicle type that respondents stated was their primary vehicle in the screening question at the beginning of the survey (Appendix 3). Responses are listed for all subjects who began the survey, the population of drivers in Manuscript 2 (SCQ), and the texting and dispatch device populations from Manuscript 3. A Pearson’s �² found that the 4 populations are statistically similar (p=0.4). Table 2. Distribution of vehicle driven by survey respondents. Semi-truck Tank truck Carhaul Dump truck Package Van Began survey (n=358) 205 9 21 28 95 SCQ (n=239) 145 4 15 15 60 Texting (n=277) 166 6 16 17 72 Dispatch device (n=153) 88 3 4 4 54 ��������������,���� Table 3 shows the distribution for the answers to all the SCQ-MD questions used in the analysis. The mean and standard deviation of the factors are described in the safety climate manuscript.
Table 3. Distribution of answers to all SCQ-MD questions � 1�
Strongly�Agree�
2�Mostly�agree�
3�Agree�
4�Neutral�
5��Disagree�
6��Mostly�disagree�
7�Strongly�Disagree�
Changes�in�working�procedures�and�their�effects�on�safety�are�effectively�communicated�to�workers�
62 41 33 33 17� 20� 33
Employees�are�consulted�when�changes�to�driver�safety�practices�are�suggested�
55 34 17 27 23� 18� 65
Employees�are�told�when�changes�are�made�to�the�working�environment�such�as�the�vehicle,�maintenance�or�garaging�procedures�
45 38 32 29 20� 28� 47
Safety�policies�relating�to�the�use�of�motor�vehicles�are�effectively�communicated�to�the�workers�
67 45 36 31 13� 21� 26
Safety�procedures�relating�to�the�use�of�motor�vehicles�are�complete�and�comprehensive�
64 44 31 34 26� 15� 25
An�effective�documentation�management�system�ensures�the�availability�of�safety�procedures�relating�to�the�use�of�motor�vehicles�
71 39 32 34 19� 25� 19
Safety�problems�are�openly�discussed�between�employees�and�management/supervisors�
59 40 28 35 17� 22� 38
Safety�procedures�relating�to�the�use�of�motor�vehicles�match�the�way�tasks�are�done�in�practice�
41 36 26 50 23� 21� 42
Employees�can�discuss�important�driver�safety�policy�issues�
70 57 34 26 15� 11� 26
Employees�are�consulted�for�suggested�vehicle/driver�safety�improvements�
39 30 24 29 21� 30� 66
Employees�can�identify�relevant�procedures�for�each�job�
63 64 28 43 18� 6� 17

175��
Employees�can�express�views�about�safety�problems�
86 52 23 30 15� 13� 20
Time�schedules�for�completing�work�projects�are�realistic�
31 28 29 34 20� 27� 70
There�is�sufficient�'thinking�time'�to�enable�employees�to�plan�and�carry�out�their�work�to�an�adequate�standard�
37 32 35 34 19� 30� 52
Workload�is�reasonably�balanced� 32 36 24 37 24� 29� 57
There�are�enough�employees/drivers�to�carry�out�the�required�work�
22 30 23 35 28� 27� 74
Changes�in�workload,�which�have�been�made�on�short�notice,�can�be�dealt�with�in�a�way�that�does�not�affect�driver�safety�
30 32 22 37 29� 30� 59
When�driving�employees�have�enough�time�to�carry�out�their�tasks�
35 38 28 44 33� 22� 39
Problems�that�arise�outside�of�employees'�control�can�be�dealt�with�in�a�way�that�does�not�affect�driver�safety�
36 38 41 51 21� 28� 24
Management�are�committed�to�driver�safety 35 36 29 46 23� 27� 43
Management�are�committed�to�motor�vehicle�safety�
44 35 33 36 26� 22� 43
Driver�safety�is�central�to�managements'�values�and�philosophies�
38 30 35 40 24� 27� 45
Driver�safety�is�seen�as�an�important�part�of�fleet�management�in�this�organization�
46 34 38 35 23� 31� 32
����������������� �������� Table 4 shows the distribution for all the answers to the TPB questions for texting-while-driving on the job. 277 subjects completed this section. Table 4.
� Response�on�Likert�scale�1� 2� 3� 4� 5� 6� 7�
Texting�on�the�job�is��very�unpleasant/very�pleasant�
208� 34� 11� 19� 3� 1� 1�
Texting�on�the�job�is��very�harmful/very�beneficial�
232� 29� 8� 6� 1� 0� 1�
Texting�on�the�job�is��very�bad/very�good�
241� 19� 6� 6� 4� 1� 0�
My�supervisor�thinks�I�SHOULD�or�SHOULD�NOT�text�while�driving�on�the�job�
3� 2� 4� 10� 3� 11� 244�
How�important�is�your�supervisor's�opinion�about�texting�while�driving�on�the�job?�
39� 13� 5� 49� 13� 28� 130�
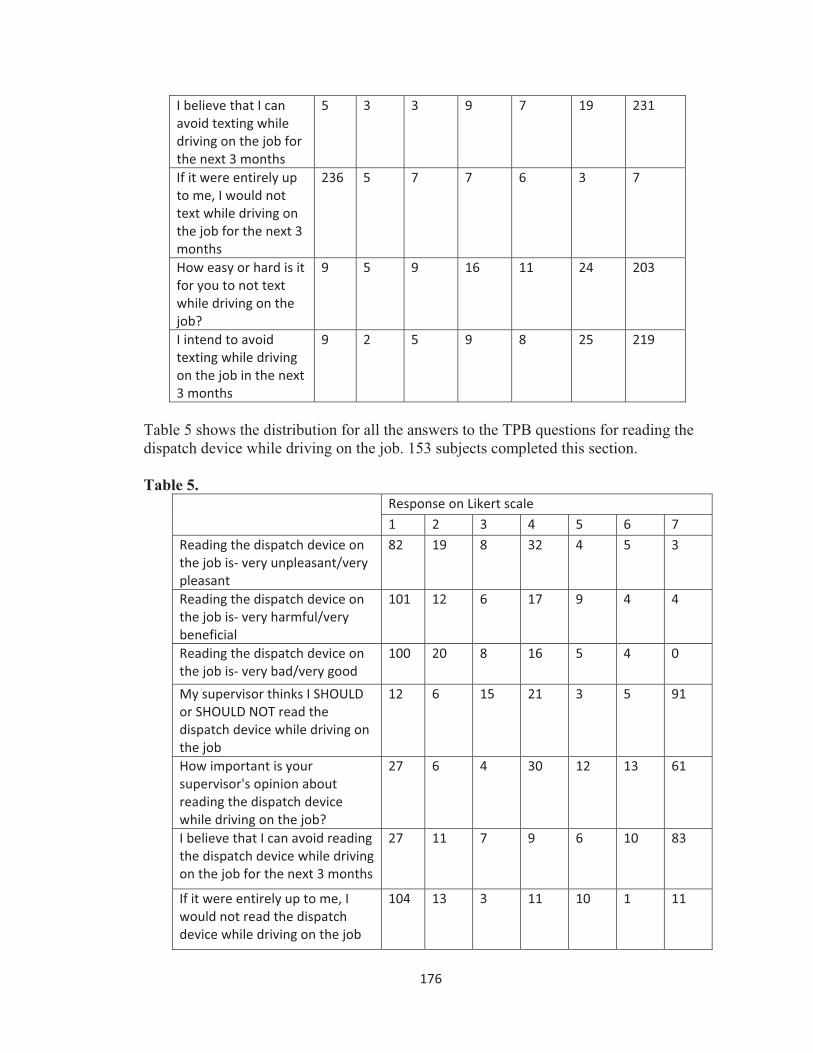
176��
I�believe�that�I�can�avoid�texting�while�driving�on�the�job�for�the�next�3�months�
5� 3� 3� 9� 7� 19� 231�
If�it�were�entirely�up�to�me,�I�would�not�text�while�driving�on�the�job�for�the�next�3�months�
236� 5� 7� 7� 6� 3� 7�
How�easy�or�hard�is�it�for�you�to�not�text�while�driving�on�the�job?�
9� 5� 9� 16� 11� 24� 203�
I�intend�to�avoid�texting�while�driving�on�the�job�in�the�next�3�months�
9� 2� 5� 9� 8� 25� 219�
�Table 5 shows the distribution for all the answers to the TPB questions for reading the dispatch device while driving on the job. 153 subjects completed this section. Table 5.
� Response�on�Likert�scale�1� 2� 3� 4� 5� 6� 7�
Reading�the�dispatch�device�on�the�job�is��very�unpleasant/very�pleasant�
82� 19� 8� 32� 4� 5� 3�
Reading�the�dispatch�device�on�the�job�is��very�harmful/very�beneficial�
101� 12� 6� 17� 9� 4� 4�
Reading�the�dispatch�device�on�the�job�is��very�bad/very�good�
100� 20� 8� 16� 5� 4� 0�
My�supervisor�thinks�I�SHOULD�or�SHOULD�NOT�read�the�dispatch�device�while�driving�on�the�job�
12� 6� 15� 21� 3� 5� 91�
How�important�is�your�supervisor's�opinion�about�reading�the�dispatch�device�while�driving�on�the�job?�
27� 6� 4� 30� 12� 13� 61�
I�believe�that�I�can�avoid�reading�the�dispatch�device�while�driving�on�the�job�for�the�next�3�months�
27� 11� 7� 9� 6� 10� 83�
If�it�were�entirely�up�to�me,�I�would�not�read�the�dispatch�device�while�driving�on�the�job�
104� 13� 3� 11� 10� 1� 11�
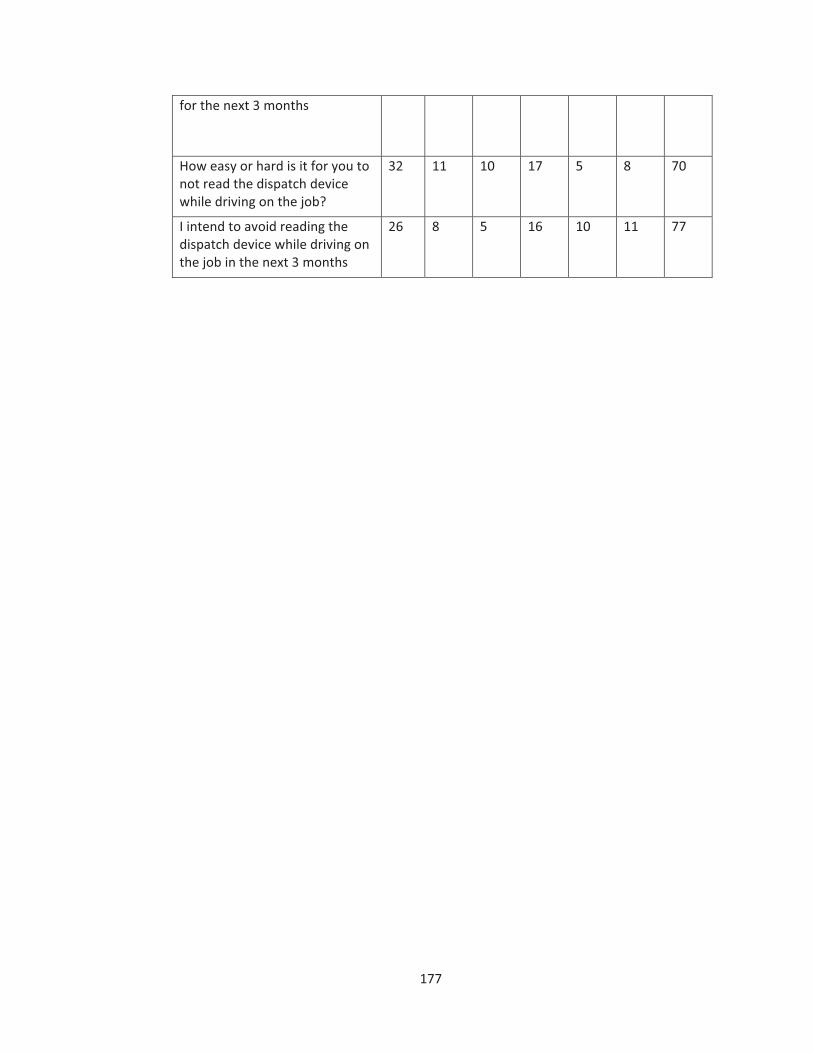
177��
for�the�next�3�months�
How�easy�or�hard�is�it�for�you�to�not�read�the�dispatch�device�while�driving�on�the�job?�
32� 11� 10� 17� 5� 8� 70�
I�intend�to�avoid�reading�the�dispatch�device�while�driving�on�the�job�in�the�next�3�months�
26� 8� 5� 16� 10� 11� 77�
��� �

178��
Appendix 6. Additional quantitative results from Manuscript 3. Distribution of scores for the dispatch device use TPB constructs in Manuscript 3. Histograms generated using Stata v12.1. Attitudes
Social Norms
���
����
������ �
� � � � � �������!����"��!��!����� #�!�� ���
���
����
���
�
�
$�� $�� � �� ��%� �� ������� ���
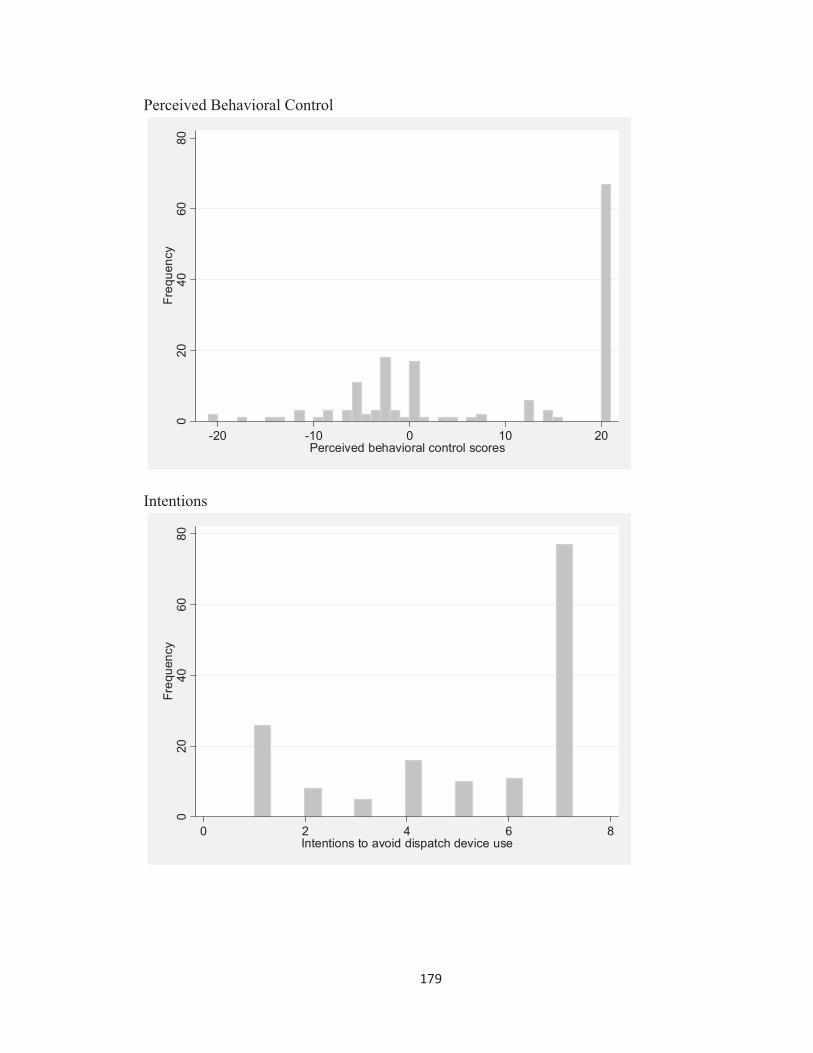
179��
Perceived Behavioral Control
Intentions
���
����
�����
�
�
$�� $�� � �� ���� ��!�&#������ � ���� �� ���
���
����
�����
�
�
� � � � �'�������������!�!����� #�!�� ���

180��
Univariate regression results. Univariate regression of demographic factors and the TPB components on crash or near crash for texting while driving or reading the dispatch device. Odds ratios (ORs) are expressed with subjects who never experienced a given event as the baseline. Bold ORs are significant at p�0.10 and were entered into multivariate regression.
Texting while driving (n=277)
Ever experience a crash on the job
Ever experience a distraction-related crash on the job
Ever undertake hard braking while distracted on the job
Ever had to swerve while distracted on the job
OR 95% CI OR 95% CI OR 95% CI OR 95% CI Gender* 0.10 0.01-0.76 2.38 0.57-9.87 0.93 0.24-3.55 2.67 0.65-10.92Age 1.02 0.99-1.04 1.06 1.02-1.10 0.99 0.96-1.02 1.02 0.99-1.05 Driving experience 1.02 1.00-1.05 1.05 1.01-1.08 1.00 0.98-1.02 1.01 0.99-1.04 Weekly driving 1.00 0.98-1.02 1.02 0.99-1.05 0.98 0.96-1.00 1.00 0.98-1.02 Texting Attitudes 1.02 0.60-1.76 0.55 0.25-1.20 1.26 0.75-2.16 1.46 0.86-2.49 Texting Norms 1.59 0.98-2.57 1.22 0.66-2.28 1.37 0.85-2.21 1.88 1.16-3.05 Texting PBC 1.36 0.81-2.30 0.61 0.30-1.27 2.32 1.37-3.92 2.03 1.20-3.41 Texting Intentions 1.11 0.62-1.99 0.82 0.37-1.81 2.71 1.48-4.97 2.81 1.54-5.13 *Odds ratios for Gender are odds for women divided by odds for men.
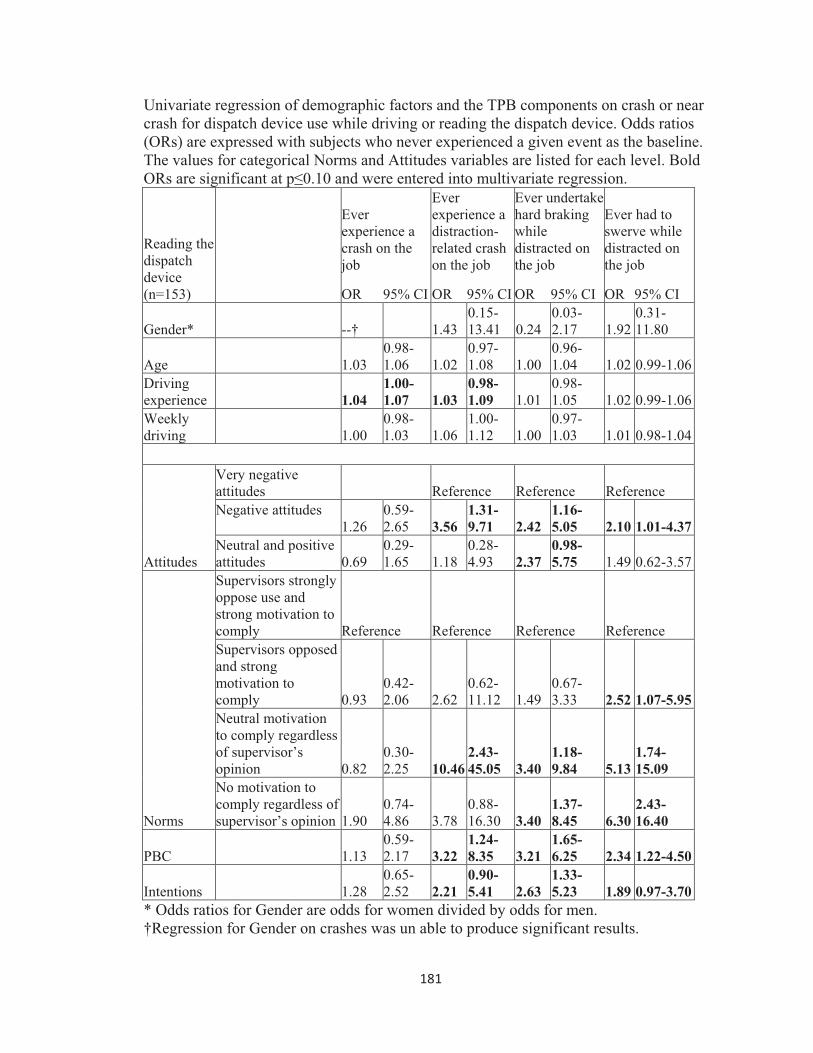
181��
Univariate regression of demographic factors and the TPB components on crash or near crash for dispatch device use while driving or reading the dispatch device. Odds ratios (ORs) are expressed with subjects who never experienced a given event as the baseline. The values for categorical Norms and Attitudes variables are listed for each level. Bold ORs are significant at p�0.10 and were entered into multivariate regression.
Reading the dispatch device (n=153)
Ever experience a crash on the job
Ever experience a distraction-related crash on the job
Ever undertake hard braking while distracted on the job
Ever had to swerve while distracted on the job
OR 95% CI OR 95% CI OR 95% CI OR 95% CI
Gender*
--† 1.43 0.15-13.41 0.24
0.03-2.17 1.92
0.31-11.80
Age
1.03 0.98-1.06 1.02
0.97-1.08 1.00
0.96-1.04 1.02 0.99-1.06
Driving experience 1.04
1.00-1.07 1.03
0.98-1.09 1.01
0.98-1.05 1.02 0.99-1.06
Weekly driving
1.00
0.98-1.03 1.06
1.00-1.12 1.00
0.97-1.03 1.01 0.98-1.04
Attitudes
Very negative attitudes Reference Reference Reference Negative attitudes
1.26 0.59-2.65 3.56
1.31-9.71 2.42
1.16-5.05 2.10 1.01-4.37
Neutral and positive attitudes 0.69
0.29-1.65 1.18
0.28-4.93 2.37
0.98-5.75 1.49 0.62-3.57
Norms
Supervisors strongly oppose use and strong motivation to comply Reference Reference Reference Reference Supervisors opposed and strong motivation to comply 0.93
0.42-2.06 2.62
0.62-11.12 1.49
0.67-3.33 2.52 1.07-5.95
Neutral motivation to comply regardless of supervisor’s opinion 0.82
0.30-2.25 10.46
2.43-45.05 3.40
1.18-9.84 5.13
1.74-15.09
No motivation to comply regardless of supervisor’s opinion 1.90
0.74-4.86 3.78
0.88-16.30 3.40
1.37-8.45 6.30
2.43-16.40
PBC 1.13 0.59-2.17 3.22
1.24-8.35 3.21
1.65-6.25 2.34 1.22-4.50
Intentions 1.28 0.65-2.52 2.21
0.90-5.41 2.63
1.33-5.23 1.89 0.97-3.70
* Odds ratios for Gender are odds for women divided by odds for men. †Regression for Gender on crashes was un able to produce significant results.

182��
183��
References
1. Ablassmeier, M., et al., %�����$���� �������������� '����� ���� ' �*�� �������������� 2007 Ieee International Conference on Multimedia and Expo, Vols 1-5, 2007: p. 2250-2252.
2. Governors Highway Safety Association, ������� ������1����������������*��� �*������������� �, 2011: Washington, DC.
3. Pettitt, M., G. Burnett, and A. Stevens. �������������� ������. in 23������� ���������������)����������������������������. 2005. San Francisco, CA: ITS America.
4. Hickman, J.S., R.J. Hanowski, and J. Bocanegra, ����������������������������� �"��1�#��������������������� ���������4�������*����������� �����������, Virginia Tech Transportation Institute, Editor 2010, Department of Transportation, Federal Motor Carrier Safety Administration: Blackburg, VA.
5. Klauer, S.G., et al., ����)���������������)�������������/���'����5�����,�1�#��#����� �������266'����/������������������ ������, NHTSA, Editor 2006, Department of Transportation: Washington, DC. p. 224.
6. Olson, R.L., et al., ������ �����������������������������������, Virginia Tech Transportation Institute, Editor 2009, Department of Transportation: Blackburg, VA.
7. Stutts, J., et al., ����������� �����7��������� ��������������� ��� ����� Annu Proc Assoc Adv Automot Med, 2003. 47: p. 235-51.
8. Farmer, C.M., K.A. Braitman, and A.K. Lund, ��������������*���� ������� �����"���"����������� Traffic Inj Prev, 2010. 11(5): p. 466-70.
9. Hafetz, J.S., et al., # �������� ����8������������������� ���������� � � ������������"�������������'��������������������� Accident Analysis and Prevention, 2010. 42: p. 1570-1576.
10. Eby, D.W., J.M. Vivoda, and R.M. St. Louis, ��������� '��� ������������������1�#�����'����������� Journal of Safety Research, 2006. 37: p. 261-265.
11. Collet, C., A. Guillot, and C. Petit, �������*���� �����)1�������*������ ���������9������������9�"����������� �������������� �� Ergonomics, 2010. 53(5): p. 589-601.
12. Crisler, C.C., et al., %���������*������������������� �������������� �������������� � ����������������� Transportation Research Record: Journal of the Transportation Research Board, 2008. 2069: p. 48-54.
13. Hosking, S.G., K.L. Young, and M.A. Regan, ����������������-������������������ ����� Hum Factors, 2009. 51(4): p. 582-92.
14. Wilson, F.A. and J.P. Stimpson, ���� ���������������� ������ � ����������� ��� ������9�2:::����366;� Am J Public Health, 2010. 100(11): p. 2213-9.
15. Neyens, D.M. and L.G. Boyle, �������������� ��������������������������������������� ����� Accident Analysis and Prevention, 2007. 39: p. 206-212.
16. Lam, L.T., ����������� ���������������������4���1��������������� ����8����� J Safety Res, 2002. 33(3): p. 411-9.

184��
17. Strayer, D.L. and F.A. Drews, ��������� ����� �������1���������������������������������������������� ��� ��� ����� Hum Factors, 2004. 46(4): p. 640-9.
18. Collet, C., A. Guillot, and C. Petit, �������*���� �����))1�������*���� �������� ������������� Ergonomics, 2010. 53(5): p. 602-616.
19. Beck, K.H., F. Yan, and M.Q. Wang, ��������������9�������� ��������9������� �����"��������� � �����1���������������������!������ � J Safety Res, 2007. 38(6): p. 683-8.
20. Beck, K.H., M.Q. Wang, and M.M. Mitchell, �������9� �������� �"������������������ ����1�*���� �����' ����� ��������� �����"�������"����������������< J Safety Res, 2006. 37(2): p. 159-65.
21. White, M.P., J.R. Eiser, and P.R. Harris, ,�����������������"������������*���� ����� Risk Anal, 2004. 24(2): p. 323-34.
22. Redelmeier, D.A. and R.J. Tibshirani, #�������"��*������������'����������������� ��������������������� N Engl J Med, 1997. 336(7): p. 453-8.
23. Violanti, J.M., ����������������� ��������������������� Accid Anal Prev, 1998. 30(4): p. 519-24.
24. McEvoy, S.P., M.R. Stevenson, and M. Woodward, ���������"�����������������������"�������������������������������������������������������� �����"������ ����� Accid Anal Prev, 2007. 39(6): p. 1170-6.
25. Federal Register, �����������������.� �����!�������������������# ���������, in =:��.,�2�;>2013, Code of Federal Rgulations: United States of America.
26. Leigh, J.P., et al., ��������������������4������ ������������ ����� Scand J Work Environ Health, 2004. 30(3): p. 199-205.
27. Philip, P., ����������������������� ����� Ind Health, 2005. 43(1): p. 30-3. 28. Taylor, A.H. and L. Dorn, ����9�������9�������9��� ���������� ��������
��� �������������������� ����1����������"����������������������� Annu Rev Public Health, 2006. 27: p. 371-91.
29. Anderson, J.E., et al., �"����������� �*����������������������������������������������*���������� ����������� ����� Accid Anal Prev, 2012. 49: p. 378-84.
30. Centers for Disease Control and Prevention, ���������������*���������������� �����'''� ��� ������9�366?''366;� MMWR Morb Mortal Wkly Rep, 2011. 60(16): p. 497-502.
31. Bureau of Labor Statistics, ��������.�����������������)�4���9�3626, Department of Labor, Editor 2012, BLS: Washington, DC.
32. Lyman, S. and E.R. Braver, ��������� ������������������������������� ��� ������1�3@����������-�������� Accident Analysis and Prevention, 2003. 35: p. 731-739.
33. Maryland Motor Vehicle Administration. ��+�)���������. 2013 2013 [cited 2013; Available from: http://www.mva.maryland.gov/Driver-Services/Apply/CDL/commercial.htm.
34. Evans, L. and M.C. Frick, !��������� ��������� �������������������*�'������������� Accid Anal Prev, 1993. 25(2): p. 213-24.
35. Walsh, S.P., et al., ��������� � ����1������������������������������������"���������*���� ����� Accid Anal Prev, 2008. 40(6): p. 1893-900.
185��
36. Caird, J.K. and T.J. Kline, ��������������"��*���������$��������� �� � ��������"��������'���'4�"� �������� ������ ���� ���'�������������� Ergonomics, 2004. 47(15): p. 1598-613.
37. Hof, I.A., �������1�����'�������1�%��������������4������ "��������������������� ���������������������������"���� Temple Law Review, 2012. 84: p. 701-742.
38. Hantula, D.A., et al., �������������*��������������1�#����'"�� ��������������� ��� Journal of Organizational Behavior Management, 2001. 21(2): p. 79-98.
39. Boyce, T.E. and E.S. Geller, #����������)�������0������������'����� ��#�����)� �����������1�������������+��������������.�����< Journal of Organizational Behavior Management, 1999. 19(3): p. 27-44.
40. Zohar, D., ����������������� �����������$����1�������������� ������ ���������� J Appl Psychol, 1980. 65(1): p. 96-102.
41. Zohar, D., ����������������������������������1������������� �������� ������� Accid Anal Prev, 2010. 42(5): p. 1517-22.
42. Flin, R., et al., !�������������������1�) ��������������������������� Safety Science, 2000. 34: p. 177-192.
43. Beus, J.M., et al., ���������������� ��4���1�#���-������������������������ ������������������� Journal of Applied Psychology, 2010. 95(4): p. 713-727.
44. Vredenburgh, A.G., �����$������������1�*�������������������������������������������� ���������������4��������< J Safety Res, 2002. 33(2): p. 259-76.
45. Clarke, S., ��������������"��*������������������� ������������������1�������'������������*� J Occup Health Psychol, 2006. 11(4): p. 315-27.
46. Wills, A.R., H.C. Biggs, and B. Watson, #����������������������������������������������������� ������� �������������������*��������� Australian Journal of Rehabilitation Counseling, 2005. 11(1): p. 8-21.
47. Wills, A.R., B. Watson, and H.C. Biggs, ���������������������������������� ��������*���'������ � �����"������� J Safety Res, 2006. 37(4): p. 375-83.
48. Geller, E.S., ������������)�4���������������� �#���� ���������#����, in )�4������ ������������������1�"���������������������9������ 9��� ����������, A.C. Gielen, D.A. Sleet, and R.J. DiClemente, Editors. 2006, Jossey-Bass: San Francisco. p. 297-322.
49. Elliott, M.A., C.J. Armitage, and C.J. Baughan, �����8�����������*������ ����1�#����������������������������������� ��������� Journal of Applied Psychology, 2003. 88(5): p. 964-972.
50. Poulter, D.R., et al., #����������������������������������� �"���������������� �����"��������� �����������*������������� Accident Analysis and Prevention, 2008. 40: p. 2058-2064.
51. Fishbein, M. and I. Ajzen, �����9�#���� �9�)���������� ��������1�#��)���� ������������������ �,������. Series in Social Psychology. 1975, Reading, MA: Addison-Wesley Publishing Co.
52. Montano, D. and D. Kasprzyk, ��������������,����� �#������� ��������������������� ��������, in A���������������� �A������% ������1�������9�,��������� ��������, K. Glanz, B. Rimer, and F. Lewis, Editors. 2002, Jossey- Bass: San Francisco. p. 67-98.
186��
53. Ajzen, I., #���� �9������������� ��������� 2nd ed. 2005, Maidenhead, UK: Open University Press.
54. Bandura, A., ����'������������������������������� American Psychologist, 1982. 37(2): p. 122-147.
55. Simons-Morton, B. and T. Nansel, �����������������������������������������4�������������, in )�4������ ������������������1�����������������������9������ 9��� ����������, A.C. Gielen, D.A. Sleet, and R.J. DiClemente, Editors. 2006, Jossey-Bass: San Francisco. p. 41-64.
56. Parker, D., et al., ������������������������������� ������������� Accident Analysis and Prevention, 1992. 24(2): p. 117-131.
57. International Brotherhood of Teamsters. .���.���. 2013 [cited 2013 April 3, 2013]; Available from: http://www.teamster.org/content/fast-facts.
58. International Brotherhood of Teamsters. )� ����. 2012 [cited 2012 June 12, 2012]; Available from: http://www.teamster.org/content/industries.
59. Bernstein, I., �������"�����������1����������������#�������*�����9�2:??'2:=2. 2010, Chicago, Ill. Minneapolis, Minn.: Haymarket Books ; Distribution in the U.S. through Consortium Book Sales and Distribution. xix, 873 p.
60. Moberg, D., ���� �������1�+��������+�"��� WorkingUSA, 1997. 1(3): p. 11-29.
61. Donnelly, P.G., ������������������������������������� �A������#������2:>6� Social Problems, 1982. 30(1): p. 13-25.
62. Steenland, N.K., D.T. Silverman, and R.W. Hornung, ���'���������� ������������������� ������� ������������������� ���� Am J Public Health, 1990. 80(6): p. 670-4.
63. Robinson, J.C., +�"����������������������������������������� �������9�2:@>'2:;>� J Health Polit Policy Law, 1988. 13(3): p. 453-68.
64. Brown, M.P., +�"��8���������������*������������������ �������������������� �"���� '�����"�������������9�*�����*������������ ��������< New Solutions, 2006. 16(3): p. 249-265.
65. Gillen, M., et al., ������� �������������9�4�"� ���� 9��� ���*�������������������������� ����������4��� ������������*������ J Safety Res, 2002. 33(1): p. 33-51.
66. Morantz, A.D., ��������������1� �������������� ��������� Industrial and Labor Relations Review, 2013. 66(1): p. 88-116.
67. Dedobbeleer, N., F. Champagne, and P. German, �������������������������������� ���������*������������������������ ����� J Occup Med, 1990. 32(11): p. 1099-103.
68. Gillen, M., et al., )�4����������������� �*���������������������������� Am J Ind Med, 1997. 32(6): p. 647-55.
69. Ibrahim, J.K., et al., ��������*���������� �������������"��������������� ����� ������ ' �����������9�2::3'3626� Am J Prev Med, 2011. 40(6): p. 659-65.
70. Governors Highway Safety Association. ���������������������� ���-����*���� �������*. 2013 2013 [cited 2013 June 29, 2013]; Available from: http://www.statehighwaysafety.org/html/stateinfo/laws/cellphone_laws.html.
187��
71. AAA Foundation for Traffic Safety, 3626�����������������������)� �-, 2010: Washington, DC. p. 23.
72. �������� '��� ���"��������������� ���"������������� �����"�������������������������� �������"�� ���������"�� ����������� ��%-�����������������#������������ ��������������, in �B��2='3:C��D�E2013, Connecticut General Statutes: United States.
73. Staples, A., #������������������#�����8�"������������ ����� ����1�A�*��������� ����������������� �������������������������� ����' ������������� New England Law Review, 2011. 46: p. 353-386.
74. National Highway Transportation Safety Administration. ������� �������F�����,���������F���-������ ������. 2013 March 1, 2013 [cited 2013 March 28, 2013]; Available from: http://www.distraction.gov/content/dot-action/regulations.html.
75. Department of Transportation, +��������� ����������������������������, in =:��.,������?;?9�?;=9�?:69�?:29��� �?:3, FMCSA, Editor 2010, Department of Transportation,: Washington, DC.
76. Franklin, T.M., �����*��� ������ � ����1�)����������������������8�"��������-�'"�� �������������*���� ������� ���������������������� Pennsylvania State Law Review, 2012. 117(1): p. 171-200.
77. Foss, R.D., et al., �����'������������������������� ������������������������� Accid Anal Prev, 2009. 41(3): p. 419-24.
78. Goodwin, A.H., N.P. O'Brien, and R.D. Foss, %���������/������������8��������������������� ��������������������*�������������������������� Accid Anal Prev, 2012. 48: p. 363-7.
79. Jacobson, P.D. and L.O. Gostin, ,� ����� ������ � ����1������������� �� ������������������������4������ ��������� JAMA, 2010. 303(14): p. 1419-20.
80. Cosgrove, L., N. Chaudhary, and I. Reagan, .�������'�"���������������� �����������*������������������� �/�*�G��������� ������� '��� ���������, N.H.T.S. Administration, Editor 2011, Department of Transportation: Washington, DC.
81. Federal Register, .� �����+�� ��������,� �������-��!����������������, 2009, Federal Register: United States of America.
82. Network of Employers for Transportation Safety, /%���!��"�������������������, 2009, NETS. p. 5.
83. Nemme, H.E. and K.M. White, ��-����*���� ����1�����������������������������������8���-�������������� �"������� Accident Analysis and Prevention, 2010. 42: p. 1257-1265.
84. Riquelme, H.E., F.S. Al-Sammak, and R.E. Rios, ��������������������������� ������������������������"���������*���� ����� Traffic Inj Prev, 2010. 11(2): p. 127-32.
85. Atchley, P., C. Hadlock, and S. Lane, ������������>61������������������������� ������ � ����� Accid Anal Prev, 2012. 48: p. 279-84.
86. National Highway Transportation Safety Administration. .#,��%�������� �. 2013 [cited 2013 March 30, 2013]; Available from: http://www-fars.nhtsa.dot.gov/Main/index.aspx.
188��
87. Neeley, G.W. and L.E. Richardson, �������������������������������������'������������� American Journal of Public Health, 2009. 99(3): p. 408-415.
88. McCarthy, M.L., et al., 0�� �����������'������� ����������������������������������������������������� ��� �������"��*����2:;3��� �366@� Journal of Safety Research, 2009. 40(3): p. 227-232.
89. Swedler, D.I., S.P. Baker, and S.M. Bowman, B�� ����� �#��������������������������������.����������� Annals of Advances in Automotive Medicine, 2012. 56: p. 97-106.
90. National Highway Transportation Safety Administration, .�������#�����,��������������D.#,�E1�#��������� ���!������2:>@'3626, 2011, Department of Transportation, : Washington, DC. p. 554.
91. Compton, C.P., ������������"�������� ������"������������������, in #�� ������)�4���1������������� ����������, A.M. Nahum and J.W. Melvin, Editors. 1993, Springer-Verlag: New York. p. 49-65.
92. National Highway Transportation Safety Administration, 366:�.#,���� ����� ���� �����������, Department of Transportation, Editor 2010: Washington, DC.
93. National Highway Transportation Safety Administration, ������� �������366:, Department of Transportation, Editor 2010: Washington, DC.
94. Vittinghoff, E., et al., ,�������!���� ����������1�+����9�+����9��������9��� �,������ �!������!� ��. Statistics for Biology and Health, ed. K. Dietz, et al. 2005, New York, NY: Springer Science+Business Media, Inc. 340.
95. Haskins, A.E., D.E. Clark, and L.L. Travis, ,����������������������#�����)�4��� ������� Am J Epidemiol, 2013.
96. Cheung, I. and A.T. McCartt, �������������������������� ��� ����1�������������������� ������"���� Accid Anal Prev, 2011. 43(3): p. 666-74.
97. Federal Highway Administration, A��*���������, DOT, Editor 2000-2010: Washington, DC.
98. Federal Highway Administration. ���������A��*���������)����������D�A�)E'�A��*��������������. 2013 [cited 2013; Available from: http://www.fhwa.dot.gov/policyinformation/statistics.cfm.
99. Babcock, M.W. and P.G. Gayle, ��������������������� ���������������������������������� Journal of Transportation Research Forum, 2009. 48(3): p. 77-95.
100. Bell, M.L. and F. Dominici, %�������� �������"����������������������������������'����������������$�����-�������� ������������:;� ����������� Am J Epidemiol, 2008. 167(8): p. 986-97.
101. Lord, D., S.P. Washington, and J.N. Ivan, ����9�����'�������� �$���'������ ����������� ������������������������1�"��������������������� �������� Accident Analysis and Prevention, 2005. 37: p. 35-46.
102. Woolridge, J.M., %����������#��������������������� �����������. 2002, Cambridge, MA: The MIT Press. 752.
103. Chin, H.C. and M.A. Quddus, #�������������� ������������������"�������� �������-�������� ����������������������$� ����������� Accident Analysis and Prevention, 2003. 35: p. 253-259.
189��
104. Shankar, V.N., et al., %����������� ������������������ �*���������� ���� ���������1�������������7��������������� ������������������"������ Transportation Research Record: Journal of the Transportation Research Board, 1998. 1185: p. 44-48.
105. Hausman, J., B.H. Hall, and Z. Griliches, %������������ ������������� ����*����������������������������',�H������������� Econometrica, 1984. 52(4): p. 909-938.
106. Noland, R.B., ����������������� ��4���1��������������������������������������� ����������� � Accident Analysis and Prevention, 2003. 35: p. 599-611.
107. Rabe-Hesketh, S. and A. Skrondal, !����������� �+����� ����!� ����� ��������. 2nd ed, ed. S. Press. 2008.
108. Fowles, R., P.D. Loeb, and W. Clarke, ���������������������������������� ���1�#�������������������������� Transportation Research Part E, 2013. 50: p. 18-28.
109. Federal Communications Commission. +��������������������������� ����� "�� �����������. 2013 March 5, 2013 [cited 2013; Available from: http://transition.fcc.gov/wcb/iatd/comp.html.
110. Longthorne, L., R. Subramanian, and C.L. Chen, #����������������������� ������������������������������������366;, NHTSA, Editor 2010, Department of Transportation: Washington, DC. p. 38.
111. LaVallee, R.A. and H. Yi, #�����������������������������������1�/������9�����9��� ������������� 9�2:>>'3626, 2012, National Institute on Alochol Abuse and Alcoholism: Arlington, VA.
112. Tisson, J., et al., ��������������,�����������������������������+�*����!�������������, 2011, NHTSA: Washington, DC. p. 52.
113. Shults, R.A., et al., �����������������������"������*�������������������������������������"������������ Accid Anal Prev, 2004. 36(3): p. 491-3.
114. Bolden, M., ����B� ����'�0������������������� ����, in ����B� ����, Washington Post, Editor 2010.
115. Royston, P., !����������������������������� Stata Journal, 2004. 4(3): p. 227-241.
116. Royston, P., !����������������������������1�.��������� ���������9�*������������������������������"��� Stata Journal, 2009. 9(3): p. 466-477.
117. Siddiqui, O., H.M. Hung, and R. O'Neill, !!,!����+��.1������������������������"�� �������������� ���� �3@�/�#� ������ J Biopharm Stat, 2009. 19(2): p. 227-46.
118. Hair, J.F. and R.E. Andersen, !���������� ���������. 7th ed. 2010, Upper Saddle River, NJ: Prentice Hall.
119. Maldonado, G. and S. Greenland, ����������� ������������ ��'���������������� Am J Epidemiol, 1993. 138(11): p. 923-36.
120. Stram, D.O. and J.W. Lee, 0����������������������������������� �����-� ���������� ��� Biometrics, 1994. 50(4): p. 1171-7.
121. Noland, R.B., ,���������"��*�������*������������� �� ��� ��������������� Transportation Research Part A, 2001. 35(1): p. 47-72.
122. Tashakkori, A. and C. Teddlie, �����������������-� ������ ��������, in ����!-� �!���� �,�� ��, V.L. Plano Clark and J.W. Creswell, Editors. 2008, Sage: Thousan Oaks, CA. p. 7-26.
190��
123. Morgan, D.L., ���� ��������� ���������������� 1�!���� �����������������������"����7����������� �7��������������� , in ����!-� �!���� �,�� ��, V.L. Plano Clark and J.W. Creswell, Editors. 2008, Sage: Thousand Oaks, CA. p. 29-65.
124. Jick, T.D., !-���7����������� �7��������������� 1��������������������, in ����!-� �!���� �,�� ��, V.L. Plano Clark and J.W. Creswell, Editors. 2008, Sage: Thousand Oaks, CA. p. 107-118.
125. Lofland, J., et al., #����$���������������1�#�B� �����&���������#����. 4th ed. 2006, Belmont, CA: Wadsworth/Thompson.
126. Yin, R., &���������,���������������������.��. 2011, New York: Guilford Press.
127. Emerson, R.M., ���������������� ��������1������������� �����������. 2nd ed. 2001, Prospect Heights, IL: Waveland Press. 395.
128. Frattaroli, S., et al., )������������������������1�������������������������������������������������� ���������������������"������������������� J Public Health Manag Pract, 2012. 18(4): p. 382-9.
129. Wills, A.R., B.C. Watson, and H.C. Biggs, #���-��������������������������������������� �*���'������ � ����� Work: a Journal of Prevention, Assessment and Rehabilitation, 2009. 32(1): p. 81-94.
130. Naumann, R.B., et al., )�� ������� ���������������������������������'������ ��������� �����������4����"����� ���������9� ��� ������9�366@� Traffic Injury and Prevention, 2010. 11(4): p. 353-360.
131. Census Bureau, 0������)����������� � ��������, in B���������#���������2004, Department of Commerce,: Washington, DC. p. 66.
132. MacCallum, R.C., et al., �������$����������������� Psychological Methods, 1999. 4(1): p. 84-99.
133. DeVellis, R.F., �����������������9���������� �#��������. 3rd ed. Applied Social Research Methods. 2012, Los Angles: Sage. 205.
134. Rashidian, A., et al., �������$���������������������������������������� �"���������� �1�������������"��������������������� Br J Health Psychol, 2006. 11(Pt 4): p. 581-93.
135. Green, S.B., A�*�������"4���� ������������� ���������������< Multivariate Behavioral Research, 1991. 26(3): p. 499-510.
136. Hsieh, F.Y., D.A. Bloch, and M.D. Larsen, #����������� ����������$������������������������� ��������������� Stat Med, 1998. 17(14): p. 1623-34.
137. Fisher, L.D. and G. Van Belle, �������1�#������ ��������������������������. Wiley Series in Probability and Mathematical Statistics. 1993, New York: John Wiley and Sons. 910.
138. Morse, J.M., #������������7��������'7�������������� �������������������, in ����!-� �!���� �,�� ��, V.L. Plano Clark and J.W. Creswell, Editors. 2008, Sage: Thousand Oaks, CA. p. 151-160.
139. Greene, J.C., V.J. Caracelli, and W.F. Graham, ��*�� �������������������*���������-� '����� ����������� ���, in ����!-� �!���� �,��� ��, V.L. Plano Clark and J.W. Creswell, Editors. 2008, Sage: Thousand Oaks, CA. p. 121-148.
140. Everitt, B.S. and G. Dunn, #���� �!���������������#����. 2001, London: Arnold.
191��
141. Fabrigar, L.R., et al., %��������������������-��������������������������������������������� Psychological Methods, 1999. 4(3): p. 272-299.
142. Onwuegbuzie, A.J. and R.B. Johnson, ������� ���������-� ������ ��������, in ����!-� �!���� �,�� ��, V.L. Plano Clark and J.W. Creswell, Editors. 2008, Sage: Thousand Oaks, CA. p. 271-298.
143. Tashakkori, A. and C. Teddlie, !-� �!���� �����1����"����&����������� �&����������#��������. Applied Soaicl Research Methods Series. 1998, Thousand Oaks, CA. 186.
144. Barg, F.K., et al., #��-� '����� ��������������� ����� ������������� � ����������� ���� ���� J Gerontol B Psychol Sci Soc Sci, 2006. 61(6): p. S329-39.
145. Luzzo, D.A., B�� ��� ��������������������� ���8������������������ �������� �"��������������� ����������, in ����!-� �!���� �,�� ��, V.L. Plano Clark and J.W. Creswell, Editors. 2008, Sage: Thousan Oaks, CA. p. 381-390.
146. Plano Clark, V.L. and J.W. Creswell, ����!-� �!���� �,�� ��. 2008, Thousand Oaks, CA: Sage. 617.
147. Moore, D.S. and G.P. McCabe, )���� ������������������������������. Fourth edition ed. 2003, New York: W.H. Freeman and Co.
148. Hanowski, R.J., et al., ����266'�������������� ������� �1��� ����������������������������'�������������������������������������������� ����I�����������, FMCSA, Editor 2006. p. 183.
149. Tashakkori, A. and C. Teddlie, A�� "�������!-� �!���� ����������� �����������,������. 2003, Thousand Oaks, CA: CA.
150. National Highway Transportation Safety Administration, 3626�!�����0�����������1�������*, Department of Transportation, Editor 2011: Washington, DC.
151. Ascone, D., T. Lindesy, and C. Varghese, ,�������/���1�#���-����������� ����� ��������������� � ���/A��#� ���"��, 2009, NHTSA: Washington, DC.
152. Royal, D., /���������������� ������ ��� � ��*�� ���������� ���� �"������1�3663J�0������)1�.� ��, National Highway Transportation Safety Administration, Editor 2003, Department of Transportation: Washington, DC.
153. Ranney, T., ������ �������1�#�����*��������������������'��'���*�� ��, National Highway Transportation Safety Administration, Editor 2008, Department of Transportation: Washington, DC.
154. Wierwille, W.W. and J.C. Gutman, ��������������������� ����� ������������������������������������ �������� �������� � �������� ���� Human Factors, 1978. 20(2): p. 233-244.
155. Jenness, J.W., et al., %�������������������������'������� � ����� ����������� � ����� Percept Mot Skills, 2002. 94(2): p. 363-79.
156. BLS, )�� ������������ ����"����������������������������4����"�������� �� ����� News, United States Bureau of Labor Statistics, 2005. http://www.bls.gov/news.release/osh.t05.htm: p. 17 November 2005.
157. National Highway Transportation Safety Administration, ��������������.���, 2010: Washington, DC. p. 232.

192��
158. Evans, L., ��������������������������� �$�� American Journal of Public Health, 2001. 91(7): p. 1076-1081.
159. McCartt, A.T., et al., +���'������������������ ��� ��������������*���� �������� ��� ��������������� Traffic Inj Prev, 2010. 11(2): p. 133-41.
160. Lim, S.H. and J. Chi, ����������"����� ������������������������������������ ��� ������� J Public Health Policy, 2013.
161. Department of Transportation, ���������������������������,���+�A�� �#��������.� ��������������-������������������������������FMCSA, Editor 2009: Washington, DC.
162. Chen, L.H., S.P. Baker, and G. Li, B�� ���� � ���������������������� ����������������2C'����'�� � ����1��������������������� Pediatrics, 2006. 35: p. 56-62.
163. Snowden, C.B., et al., ,�� ������������������� ��� ��������'������ ���������������� �������������������� J Stud Alcohol Drugs, 2007. 68(5): p. 634-40.
164. Morrisey, M.A. and D.C. Grabowski, B�� ���� � ��������������������� ������������������������������������ J Rural Health, 2006. 22(4): p. 300-7.
165. Amendola, A.F., ������������������*<1���������������� �����������������*���� ������� �����������8����� ������������������ �� Connecticut Law Review, 2008. 41(1): p. 341-381.
166. Mercer, S.L., et al., ������������ ��������������1������������ �������������������*���������������"��� ����������������� ����� Ann Epidemiol, 2010. 20(6): p. 412-20.
167. National Highway Transportation Safety Administration, 0���'�������/A��#� ����� ��������� ����������'������� ����, 2012: Washington, DC. p. 177.
168. Bureau of Labor Statistics, ��������.�����������������)�4�����������9�366:, Department of Labor, Editor 2010: Washington, DC.
169. Guldenmund, F.W., ���������������������������1�������*������������� ��������� Safety Science, 2000. 34: p. 215-257.
170. Glendon, A.I. and D.K. Litherland, ��������������������9������� ����������� �������"������������ ������������ Safety Science, 2001. 39: p. 157-188.
171. Guest, G., A. Bunce, and L. Johnson, A�*������������*�����������<�#���-��������*��� ��������������� �����"���� Field Methods, 2006. 18(1): p. 59 - 82.
172. Jackson, D.A., ��������������������������������������1�#������������������������ ������������������� Ecology, 1993. 74(8): p. 2204-2214.
173. Johnson, S.E., ������� ��������������������������� Journal of Safety Research, 2007. 38: p. 511-521.
174. Reason, J.T., A�����%����. 1990, Cambridge, England: Cambridge University Press.
175. Reason, J., et al., %������� ������������������� 1�������� ������< Ergonomics, 1990. 33(10/11): p. 1315-1332.
176. Reason, J., A����������1��� ����� ������������ British Medical Journal, 2000. 320: p. 768-770.
177. Huang, Y.H., et al., !������������������������������������������������ ���������������� ���������*�����������4���� Accident Analysis and Prevention, 2012. 42: p. 94-101.

193��
178. Zohar, D., ���������������� �"���� 1�#�����'����������'������������*���� Safety Science, 2008. 46(3): p. 376-387.
179. O'Toole, M., ��������������"��*������������8���������������������� ������$��������������� J Safety Res, 2002. 33(2): p. 231-43.
180. McEvoy, S.P., M.R. Stevenson, and M. Woodward, ������������� ����� �������������� ������1������������������������������������*��#������������� Inj Prev, 2006. 12(4): p. 242-7.
181. Centers for Disease Control and Prevention, !�"��� ��������*���� ����'� ��� ��������� ������%���������������9�3622� Morbidity and Mortality Weekly Report, 2013. 62(10): p. 177-182.
182. Federal Register, ,������ �,��������, Department of Transportation, Editor 2010: Washington, DC. p. 59118 - 59136.
183. Ware, J.E., Jr. and C.D. Sherbourne, ����!���?C'��������'������������������D�.'?CE��)������������������*������ ������������� Med Care, 1992. 30(6): p. 473-83.
184. McHorney, C.A., M. Kosinski, and J.E. Ware, Jr., ���������������������� �7�����������������������.'?C���������������������� �"���������������������������*1���������������������������� Med Care, 1994. 32(6): p. 551-67.
185. Braver, E.R., et al., +����������� �������1�������������������'������� ����� J Public Health Policy, 1992. 13(3): p. 341-66.
186. Breslin, F.C., et al., ��������������"��*����4�"���������� �*���� �"�����"������������ ���1��������������� �� Accident Analysis and Prevention, 2008. 40(1): p. 368-375.
187. Ajzen, I., �������������������� ��������� Organizational Behavior and Human Decision Processes, 1991. 50(2): p. 179-211.
188. Terry, D.J., �������������������� �"�������1����' �����9������ �����9��� ������������ British Journal of Social Psychology, 1999. 38(3): p. 225-244.
189. Verschuur, W.L.G. and K. Hurts, !� ����������� ������� �����"������� Accident Analysis and Prevention, 2008. 40: p. 644-656.
190. Suzuki, Y., M.R. Crum, and G.R. Pautsch, ��� �������������������� Transportation Research Part E, 2009. 45(4): p. 538-550.
191. Adams, C. and P. Webley, ���������������������� �����������������"�������������������� Psychology, Crime and Law, 1996. 3(2): p. 111-133.
192. West, R., et al., �������"����������� ����9��������������� �����"�������9��� ���� ��������������� Ergonomics, 1993. 36(5): p. 557-67.
193. Landen, D.D. and S. Hendricks, %���������������������������������'*�����4���� Public Health Reports, 1995. 110: p. 350-354.
194. Collins, K.M.T., A.J. Onwuegbuzie, and R.B. Johnson, �������������������������"��1�#�����*��� ��-��������������$����������������������� ��������-� ������ ��������� American Behavioral Scientist, 2012. 56(6): p. 849-865.
195. Sullman, M.J.M., M.L. Meadows, and K.B. Pajo, #"������� �����"��������������/�*�K����� ������� ����� Transportation Research Part F, 2002. 5(3): p. 217-232.
196. Cantor, D.E., T.M. Corsi, and C.M. Grimm, �������������������������������� ������������������ ����� Transportation Journal, 2006. 45(3): p. 20-45.

194��
197. Network of Employers for Transportation Safety. #"����/%��'����������������. 2013 [cited 2013; Available from: http://trafficsafety.org/about.
198. Network of Employers for Transportation Safety. ������� �������,������'���������������. 2013 2013; Available from: http://trafficsafety.org/safety/risk/distracted-driving-resources.
199. NIOSH. /)��A� � ���'���������� ����������� ������1�����',����� �A�$�� ��� �,�����������������. 2010 August 6, 2012 [cited 2013; Available from: http://www.cdc.gov/niosh/updates/upd-10-05-10.html.
200. Occupational Safety and Health Administration. ������� ������. 2013 [cited 2013; Available from: http://www.osha.gov/distracted-driving/.
201. Occupational Safety and Health Administration. ������� ������'�!� ��������5�������. 2013 [cited 2013; Available from: http://www.osha.gov/distracted-driving/modelpolicies.html.
202. Federal Communications Commission. ������� �������)���������������������F�.������. 2013 April 18, 2013 [cited 2013; Available from: http://www.fcc.gov/encyclopedia/distracted-driving-information-clearinghouse.
203. American Trucking Associations. #�#. 2013 June 24, 2013]; Available from: http://www.truckline.com/What_We_Do.aspx.
204. Health Care for America Now. !������ 8���������������)�������������!������#�������������"��������,��������. 2012 September 13, 2012 [cited 2013; Available from: http://healthcareforamericanow.org/2012/09/13/mcdonalds-posts-calorie-information/.
205. Brown, R.L. and H. Holmes, ������������������'������������� �������������������� ��������������������������������� ��� Accid Anal Prev, 1986. 18(6): p. 455-70.
206. Robson, L.S., et al., ��������������������������������������� ���������������������������������1�#�������������*� Safety Science, 2007. 45: p. 329-353.
207. Zanko, M. and P. Dawson, ��������������������� �����������������������������1�������*� International Journal of Management Reviews, 2012. 14: p. 328-344.
208. International Labor Office, B� ���������������������������� �����������������������, 2001: Geneva, Switzerland. p. 40.
209. Occupational Safety and Health Administration. %��������������������������� �A������!���������������. 2008 [cited 2013; Available from: www.osha.gov/Publications/safety-health-management-systems.pdf.
210. Occupational Safety and Health Administration. )���� ����������������!���������������. 2009 [cited 2013; Available from: http://www.osha.gov/dte/grant_materials/fy08/sh-17815-08/01_fg_module_1.pdf.
211. Occupational Safety and Health Administration. �����A��*�� ��������B������������. 2013; Available from: http://www.osha.gov/dte/sharwood/.
212. Federal Motor Carrier Safety Administration, .����,���1�+���������������*����������������� ����9���������������������, 2010, Department of Transportation: Washington, DC.
195��
213. Federal Register, ,�����������,����� �%�������8� �������������������������� �������%��������������, in =:��.,�336, Department of Transportation, Editor 2009: Washington, DC.
214. Kingdon, J.W., #��� �9�#���������9��� ���"��������. 2011, New York: Longman Publishing Group.
215. Harper, D.V., ������ �����!������������#������2:;61�,���*��� ������� Transportation Journal, 1980. 20(2): p. 5-33.
216. Solomon, M.G., R.G. Ulmer, and D.F. Preusser, %�����������������)�����������!� ����������, NHTSA, Editor 2002, Preusser Research Group: Washington, DC. p. 60.
217. Knoblach, R.L., et al., ������������ ����"������������!�����0�����������, FMCSA, Editor 2003: Washington, DC.
218. Forkenbrock, D.J., %-������������������������������������������������ Transportation Research Part A, 1999. 33(7-8): p. 505-526.
219. Federal Register, A���������������� ����9������������� ����������������������, Department of Transportation, Editor 2003. p. 22456 - 22517.
220. Wylie, C.D., �����9������9��� �������������� N Engl J Med, 2005. 352(2): p. 196-7.
221. McCartt, A.T., L.A. Hellinga, and M.G. Solomon, �������� �����������' ������������ �����"�������� �������366=�����'��'������������������ Traffic Inj Prev, 2008. 9(3): p. 201-10.
222. Hanowski, R.J., et al., %�������������366?����� �����'��'�������������������������� ����1�����������������'��'���������������� ������� Accid Anal Prev, 2009. 41(2): p. 268-75.
223. Soccolich, S.A., et al., #����������� ������� �*������������������������������������� ������������������������� �������������� Accid Anal Prev, 2012.
224. Federal Motor Carrier Safety Administration, 3626'3622�A�����������������������������������, Department of Transportation, Editor 2011: Washington, DC. p. 144.
225. Gielen, A.C. and D. Sleet, #������������"������'���������������� ������ �����4�������������� Epidemiol Rev, 2003. 25: p. 65-76.
226. Stewart, D.W., P.M. Shamdasani, and D.W. Rook, .����B����1���������� ��������. 2007, Thousands Oaks, CA: Sage. 188.
227. Carpenter, D. and J.C. Pressley, B�� ���� � ������������������������������� ��������� ����������� ���������������������������� Accid Anal Prev, 2013. 56: p. 110-7.
228. Zwerling, C., )�4�����������, in %� ����������������,����� �����, C. McDonald, Editor. 2000, BMJ Publishing Group: London. p. 267-282.
229. McLeod, A.I. and E.R. Vingilis, ��*����������������������������������������������������������� Accid Anal Prev, 2008. 40(3): p. 1244-8.
230. McLeod, A.I. and E.R. Vingilis, ��*������������������)�����������#����� Technometrics, 2005. 47(2): p. 174-181. 2006

196��
Curriculum Vitae June 25, 2013
David Ignatius Swedler, M.P.H.
PhD Candidate Department of Health Policy and Management Center for Injury Research and Policy Bloomberg School of Public Health Johns Hopkins University 624 N. Broadway St. Baltimore, MD 21205 Cell: (630) 254-5560 [email protected] Education2006 Master of Public Health, General Epidemiology University of Michigan Ann Arbor, Michigan 2004 Bachelor of Science, Liberal Arts and Sciences Concentration in Microbiology University of Illinois, Urbana-Champaign Urbana, Illinois Professional Certification 2011 Certificate in Injury Control Center for Injury Research and Policy Bloomberg School of Public Health Johns Hopkins University Baltimore, MD Post-graduate Education Fellowships 2009 – 2013 National Institute of Occupational Safety and Health
Occupational Injury Epidemiology and Prevention fellowship Johns Hopkins School of Public Health Baltimore, MD 21205 Internships 2007 – 2009 Oak Ridge Institute for Science and Education
Epidemiology Intern at US Army Center for Health Promotion and Preventive Medicine (now US Army Institute of Public Health)
Directorate of Epidemiology and Disease Surveillance Aberdeen Proving Ground, MD 21010
197��
2005 Cook County Department of Public Health Infection Control Intern
Communicable Disease Department Oak Park, IL 60301 Academic Positions 2012 – 2013 Department of Biostatistics Teaching Assistant -���������!���� �����"���A������) -���������!���� �����"���A������)) -���������!���� �����"���A������)))� Bloomberg School of Public Health 2011– 2013 Department of Health Policy and Management Teaching Assistant -B�� ��������������)�4����,������� Bloomberg School of Public Health 2010 Department of Health Policy and Management Teaching Assistant -�����9��������� �������������������� Bloomberg School of Public Health 2005 Program in Biology
Graduate Student Instructor -#)����� �������A��������� University of Michigan Research Positions 2010 – 2012 Center for Injury Research and Policy Research Assistant Bloomberg School of Public Health Johns Hopkins University Baltimore, MD 21205 2010 – 2012 Mine Safety and Health Administration Research Assistant Department of Labor Arlington, VA 22209 2003 – 2004 Spatial Epidemiology Laboratory Undergraduate Research Assistant School of Veterinary Medicine University of Illinois Urbana, IL 61820

198��
Professional Leadership Positions 2010 – 2011 Co-Chair, Student Coordinating Committee Department of Health Policy and Management Bloomberg School of Public Health Johns Hopkins University Baltimore, MD 2005 Co-Chair, Public Health Student Association School of Public Health University of Michigan Ann Arbor, MI Professional and Academic Societies 2012 – present Association for the Advancement for Automotive Medicine Student Member 2012 – present Society for Advancement of Violence and Injury Research 2011 – present Mixed Methods Interest Group Bloomberg School of Public Health 2011 – 2012 American Public Health Association Student Member 2010 – 2012 Student Coordinating Committee Department of Health Policy and Management Bloomberg School of Public Health 2004 – 2006 Public Health Student Association School of Public Health University of Michigan 2002 – 2003 Microbiology Club University of Illinois, Urbana-Champaign Professional and Academic Awards 2006 Outstanding Contributors Award Military Physical Training Footwear Study USACHPPM Aberdeen Proving Ground, MD 2004 Graduation with distinction, with concentration in Microbiology University of Illinois, Urbana-Champaign Urbana, IL 2001 Dean’s List, College of Liberal Arts and Sciences University of Illinois, Urbana-Champaign
199��
Urbana, IL Professional/Continuing Education 2009 Human Research Curriculum Collaborative Institutional Training Initiative University of Miami Miami, FL 2007 – 2009 HIPAA- Security 101: Introduction to HIPAA Security Military Health Sciences (online) 2007 Introduction to GIS using Arcview® 9.2 Geographic Information Systems Branch, DCSIM Aberdeen Proving Ground, MD Security Clearance Secret level government security clearance granted through USACHPPM (now USAIPH), October 29, 2008. Manuscript Peer Reviewer 2012 )������������L����������������!� ���, Thieme 2011 ��"���A�����, Elsevier 2011 #�������L����������)� ������!� ���, Wiley 2011 L������������������ ��,������, Wiley Research Grants #��������.�������A��� �����+�*�%�����������������, ERC Pilot Project Training Award ; Environmental Research Center for Occupational Safety and Health, Department of Environmental Health Sciences, Bloomberg School of Public Health, Johns Hopkins University- $7,500.00. 2011– 2012 #�!-� �!���� �%-������������������ ������������������������������ ERC Pilot Project Training Award; Environmental Research Center for Occupational Safety and Health, Department of Environmental Health Sciences, Bloomberg School of Public Health, Johns Hopkins University- $4,000.00. 2012 – 2013 Peer Reviewed Publications
1)� Swedler DI, Kercher C, Simmons MM, Pollack KM. Occupational homicide of law enforcement officers in the U.S., 1996 – 2010. Inj Prev, ���", 2013.
2)� Kercher C, Swedler DI, Pollack KM, Webster DW. Homicides of law
enforcement officers responding to domestic disturbance calls. Inj Prev, ���", 2013.

200��
3)� Tiesman HM, Swedler DI, Srinivas K, Pollack KM. Fatal occupational injuries among U.S. law enforcement officers: A comparison of national surveillance systems. Am J Ind Med, 56(6): 693-700, 2013.
4)� Swedler DI, Bowman SM, Baker SP. Gender and age differences among teen
drivers in fatal crashes. Ann Adv Automot Med, 56, 97-108, 2012�
5)� Galvangno S, Thomas S, Baker S, Swedler D, Stephens C, Floccare D, Provonost P, Haut E. Helicopter emergency medical services for adults with major trauma. Cochrane Review (protocol stage) Published Online: August, 2011.
6)� Knapik JJ, Grier T, Spiess A, Swedler DI, Hauret KG, Graham B, Yoder J, Jones
BH. Injury Rates and Injury Risk Factors Among Federal Bureau of Investigation New Agent Trainees. Biomed Centr Public Health, 11:920-935, 2011.
7)� Swedler DI, Knapik JJ, Williams KW, Grier TL, Jones BH. Risk factors for
medical discharge from US Army basic combat training. Milit Med, 176(10): 1104-1110, 2011�
8)� Knapik JJ, Spiess A, Swedler DI, Grier T, Hauret KG, Yoder J, Jones BH.
Retrospective examination of injuries and physical fitness during Federal Bureau of Investigation New Agent Training. J Occup Med Toxicol, 6(1): 26, 2011.
9)� Grier T, Knapik JJ, Swedler DI, Jones BH. Footwear in the United States Army
Band: Injury incidence and risk factors associated with foot pain. Foot (Edinb), 21(2): 60-65, 2011.
10)�Knapik JJ, Trone DW, Swedler DI, Villasenor A, Brockelman T, Schmied E,
Bullock SH, Han P, Jones BH. Injury reduction effectiveness of assigning running shoes based on plantar shape in Marine Corps basic training. Am J Sports Med, 38(9): 1759-1767, 2011.
11)�Swedler DI, Knapik JJ, Grier TL, Jones BH. Validity of plantar surface visual
assessment as an estimate of foot arch height. Med Sci Sport Exerc, 42(2): 375-380, 2010.
12)�Knapik JJ, Spiess A, Swedler DI, Grier T, Darakjy SS, Jones BH. Systematic
review of the parachute ankle brace: injury reduction and cost-effectiveness. Am J Prev Med, 38(s1): s182-s188, 2010.�
13)�Knapik JJ, Brosch LC, Venuto M, Swedler DI, Bullock SH, Gaines LS, Murphy
RJ, Tchandja J, Jones BH. Effect on Injuries of Assigning Shoes Based on Foot Shape in Air Force Basic Training. Am J Prev Med, 38(s1): s197-s211, 2010.
14)�Knapik JJ, Swedler DI, Grier TL, Hauret KG, Bullock SH, Williams KW,
Darakjy SS, Lester ME, Tobler SK, Jones BH. Injury reduction effectiveness of

201��
selecting running shoes based on plantar shape. J Strength Conditioning Res, 23(3):685-697, 2009.
15)�Knapik JJ, Spiess A, Swedler D, Grier T, Darakjy S, Amoroso P, Jones BH.
Injury Risk Factors in Parachuting and Acceptability of the Parachute Ankle Brace. Aviat Space Environ Med, 79 (7): 689-694, 2008.
16)�Knapik JJ, Darakjy S, Swedler D, Manning F, Hauret KG, Amoroso P, Jones BH.
Parachute Ankle Brace and Extrinsic Injury Risk Factors during Parachuting. Aviat Space Environ Med, 79 (4): 408-415, 2008.
Technical/Government Reports
1)� Grier T, Knapik JJ, Swedler D, Jones BH. Influence of a Viseolastic Insole on Foot, Knee and Back Pain among Members of the United States Army Band. US Army Public Health Command, Aberdeen Proving Ground, MD; Technical Report No. 12-HF-97G010-09, 2010.
2)� Knapik JJ, Grier T, Spiess A, Swedler DI, Hauret KG, Graham B, Jones BH.
Prospective Investigation of Injury Rates and Injury Risk Factors among Federal Bureau of Investigation New Agent Trainees, Quantico, Virginia, 2009-2010. US Army Public Health Command (Prov), Aberdeen Proving Ground, MD; Technical Report 12-HF-97HRF1A-10, 2010.
3)� Knapik JJ, Spiess A, Swedler D, Grier T, Hauret KG, Yoder J, Jones BH.
Retrospective Investigation of Injury Rates and Physical Fitness among Federal Bureau of Investigation New Agent Trainees, Quantico Virginia, 1999-2008. US Army Public Health Command (Prov), Aberdeen Proving Ground, MD; Technical Report No. 12-HF-97HRF1-09, 2010.
4)� Grier T, Knapik JJ, Swedler D, Spiess A, Jones BH. Injury prevention
effectiveness of modifications of shoe type on injuries and risk factors associated with pain and discomfort in the US Army Band 2007-2008. U.S. Army Center for Health Promotion and Preventive Medicine, Aberdeen Proving Ground, MD; USACHPPM Report No. 12-HF-05WC-07, 2009.
5)� Knapik JJ, Trone DW, Swedler DI, Bockelman T, Villasenor A, Schmied E,
Bullock S, Han P, Jones BH. Injury reduction effectiveness of assigning running shoes based on plantar shape in Marine Corps Basic Training, San Diego, CA, and Parris Island, SC March-October 2007. U.S. Army Center for Health Promotion and Preventive Medicine, Aberdeen Proving Ground MD; USACHPPM Report No. 12-HF-05SBA-07C, 2009.
6)� Knapik JJ, Spiess A, Grier TL, Lester ME, Sharp MA, Tobler SK, Swedler DI,
Jones BH. Injuries and Physical Fitness Before and After Deployments of the 10th Mountain Division to Afghanistan and the 1st Cavalry Division to Iraq, September 2005 – October 2008. US Army Center for Health Promotion and Preventive
202��
Medicine, Aberdeen Proving Ground, MD; USACHPPM Report No. 12-HF-05SR-05, 2009.
7)� Knapik JJ, Brosch LC, Venuto M, Swedler D, Bullock SH, Gaines L, Murphy R,
Canada S, Hoedebecke E, Tobler S, Tchandja J, Jones BH. Injury Reduction Effectiveness of Prescribing Running Shoes Based on Foot Shape in Air Force Basic Military Training. US Army Center for Health Promotion and Preventative Medicine, Aberdeen Proving Ground, MD; USACHPPM Report No. 12-MA-05SBA-08A, 2008.
8)� Knapik JJ, Swedler D, Grier T, Hauret KG, Bullock SH, Williams K, Darakjy S,
Lester M, Tobler S, Clemmons N, Jones BH. Injury Reduction Effectiveness of Prescribing Running Shoes Based on Foot Shape in Basic Combat Training. US Army Center for Health Promotion and Preventative Medicine, APG, MD; USACHPPM Report No. 12-MA-05SB-08, 2008.
9)� Knapik J, Spiess A, Darakjy S, Grier T, Manning F, Livingston E, Swedler D,
Amoroso P, Jones BH. A Survey of Parachute Ankle Brace Breakages. US Army Center for Health Promotion and Preventive Medicine, Aberdeen Proving Ground, MD. USACHPPM Report No. 12-MA01Q2A-08. 2008.
10)�Knapik JJ, Darakjy S, Swedler D, Manning F, Hauret KG, Amoroso P, Jones BH.
The Parachute Ankle Brace: Entanglements and Injuries after Controlling for Extrinsic Risk Factors. U.S. Army Center for Health Promotion and Preventative Medicine, Aberdeen Proving Ground, MD; USACHPPM Report No. 12-MA01Q2-07, 2007.
11)�Knapik JJ, Spiess A, Darakjy S, Grier T, Manning F, Livingston E, Swedler D,
Amoroso P, Jones BH. Risk Factors for Parachute Injuries and Airborne Student Operations on the parachute Ankle Brace. U.S. Army Center for Health Promotion and Preventative Medicine, Aberdeen Proving Ground, MD; USACHPPM Report No. 12-MA-01Q2-08B, 2007.
12)�Cook County Department of Public Health. West Nile Virus Prevention and
Response Plan. Ed, Swedler, D, 3rd Edition, 2005. Conference Presentations
1)� Roberts ET, DuGoff EH, Canudas-Romo V, Heins S, Swedler D, Feldman D, Wegner S, Castillo RC. Clinical practice guidelines and claims data: “Making the best of bad data.” June 25, 2013. Academy Health, Annual Research Meeting, Balimore, MD
2)� Swedler DI, Bowman SM, Baker SP. Gender and age differences among teen
drivers in fatal crashes. October 15, 2012. Association for the Advancement of Automotive Medicine, 56th Annual Conference, Seattle, WA.

203��
3)� Weeks J, Swedler D, Pollack KM, Agnew J. Risk factors for fatalities in small underground coal mines in the U.S. October 3, 2012. Safety 2012 (World Injury Conference), Wellington, New Zeleand.
4)� Swedler DI, Simmons MM, Kercher C, Pollack KM. Occupational homicide of
law enforcement officers in the United States, 1996-2009. November 2, 2011. American Public Health Association, Washington, DC.
5)� Knapik JJ, Spiess A, Swedler D, Grier T, Hauret K, Yoder J, Jones BH.
Association between injuries and physical fitness among Federal Bureau of Investigation New Agent Trainees. June 3, 2011. American College of Sports Medicine, Denver, CO.
6)� Grier T, Swedler D, Jones BH. Effect of Body Mass Index and Aerobic Fitness
on Injury Risks in U.S. Army Trainees. June 1, 2011. American College of Sports Medicine, Denver, CO (poster).
7)� Grier T, Knapik JJ, Swedler D, Jones BH. Association of fitness and injuries in
military basic training. June 3, 2010. American College of Sports Medicine, Baltimore, MD (poster).
8)� Swedler DI, Knapik JJ. Historical analysis of injury risk factors in U.S. Army
basic combat training. August 20, 2009. Force Health Protection Conference, Albuquerque, NM.
9)� Swedler DI, Knapik JJ, FASCM, Grier TL, Lester M, Williams KW, Bullock SH,
Jones BH, FASCM. Longitudinal Foot Arch and Risk of Injury in US Army Basic Combat Training. May 30, 2009. American College of Sports Medicine, Seattle, WA (poster).
10)�Knapik JJ, FASCM, Swedler DI, Grier TL, Bullock SH, Williams KW, Darakjy
S, Lester ME, Jones BH, FASCM. Injury Reduction Effectiveness of Selecting Running Shoes Based on Plantar Shape. May 28, 2009. American College of Sports Medicine, Seattle, WA.
11)�Swedler DI, Knapik JJ, Williams K, Bullock SH, Darakjy S, Grier T, Jones BH.
Risk Factors Associated with Medical Discharges from United States Army Basic Combat Training. Force Health Protection Conference. August 15, 2008. Albuquerque, NM.
12)�Grier T, Knapik JJ, Swedler D, Hauret KG, Williams K, Bullock SH, Darakjy S,
Lester M, Clemmons N, Jones BH. Effects of Age and Smoking Prior to Basic Combat Training (BCT) on Initial Fitness Levels on Entry to BCT. August 14, 2008. Force Health Protection Conference. Albuquerque, NM .

204��
13)�Knapik JJ, Swedler DI, Grier T, Hauret KG, Williams K, Bullock SH, Darakjy S, Lester M, Clemmons N, Brown J, Jones BH. Injury Risk in Basic Combat Training Following Prescription of Athletic Shoes On the Basis of Plantar Foot Surface Shape. Force Health Protection Conference. August 13, 2008. Albuquerque, NM (poster).
14)�Swedler DI, Knapik JJ, Hauret KG, Bullock SH, Williams K, Lester M, Darakjy
S, Grier T, Clemmons N, Brown J, Jones BH. Validity of Visual Assessment of the Plantar Surface as an Estimate of Foot Arch Height. May 30, 2008, American College of Sports Medicine, Indianapolis, IN.
15)�Knapik JJ, FASCM, Darakjy S, Swedler D, Hauret KG, Amoroso P, Jones BH,
FACSM. Injury Prevention Effectiveness of the Parachute Ankle Brace after Controlling for Extrinsic Risk Factors. May 29, 2008. American College of Sports Medicine, Indianapolis, IN (poster).
16)�Swedler D. Monitoring Aseptic Meningitis as Advanced Surveillance for West
Nile Virus in Humans in Cook County (IL). October 31, 2005. University of Michigan School of Public Health, Ann Arbor, MI (poster).
Published Abstracts
1)� Roberts ET, DuGoff EH, Canudas-Romo V, Heins S, Swedler D, Feldman D, Wegner S, Castillo RC. Clinical practice guidelines and claims data: “Making the best of bad data.” [online] http://academyhealth.org/files/ARM/2013/Poster Abstracts as of 6-7.pfd
2)� Weeks J, Swedler D, Pollack KM, Agnew J. Risk factors for fatalities in small
underground coal mines in the U.S. Inj Prev, 18(s1): A35, 2012.
3)� Swedler D, Simmons M, Kercher C, Pollack K. Occupational homicides of law enforcement officers in the United States, 1996-2009. [online] https://apha.confex.com/apha/139am/webprogram/Paper253600.html
4)� Knapik JJ, Spiess A, Swedler D, Grier T, Hauret K, Yoder J, Jones BH.
Association between injuries and physical fitness among Federal Bureau of Investigation New Agent Trainees. Medicine and Science in Sports and Exercise 43 (5): S67, 2011.
5)� Grier T, Swedler D, Jones BH. Effect of Body Mass Index and Aerobic Fitness
on Injury Risks in U.S. Army Trainees. Medicine and Science in Sports and Exercise 43 (5): S251, 2011.
6)� Grier T, Knapik JJ, Swedler D, Jones BH. Association of fitness and injuries in
military basic training. Med Sci Sports Exerc, 42(5):S332, 2010.
205��
7)� Swedler DI, Knapik JJ, FASCM, Grier TL, Lester M, Williams KW, Bullock SH, Jones BH, FASCM. Longitudinal Foot Arch and Risk of Injury in US Army Basic Combat Training. Med Sci Sports Exerc, 41(5): S575, 2009.
8)� Knapik JJ, FASCM, Swedler DI, Grier TL, Bullock SH, Williams KW, Darakjy
S, Lester ME, Jones BH, FASCM. Injury Reduction Effectiveness of Selecting Running Shoes Based on Plantar Shape. Med Sci Sports Exerc, 41(5): S73, 2009.
9)� Swedler DI, Knapik JJ, FASCM, Hauret KG, Bullock SH, Williams K, Lester M,
Darakjy S, Grier T, Clemmons N, Brown J, Jones BH, FASCM. Validity of Visual Assessment of the Plantar Surface as an Estimate of Foot Arch Height. Med Sci Sports Exerc, 20(5): S93, 2008.
10)�Knapik JJ, FASCM, Darakjy S, Swedler D, Hauret KG, Amoroso P, Jones BH,
FACSM. Injury Prevention Effectiveness of the Parachute Ankle Brace after Controlling for Extrinsic Risk Factors. Med Sci Sports Exerc, 20(5): S235, 2008.
Guest Lectures
1)� Mixed Methods Interest Group. “A Mixed Methods Examination of Distracted Driving in Commercial Truck Drivers.” Dave Swedler, MPH. Johns Hopkins Bloomberg School of Public Health. Baltimore, MD, April 11, 2013.
2)� Public Health Grand Rounds. “Multi-tasking Behind the Wheel: New Hazards
and Public Health Solutions.” David I. Swedler, MPH, Meg Gobrecht Miller. Mid-Atlantic Public Health Training Center. Baltimore, MD, March 20, 2013.
3)� Graduate Seminar in Injury Research and Policy. “Fatalities in Crashes Involving
Distracted Driving in Truck Drivers in the United States, 2000 – 2010.” DaveSwedler, MPH. Johns Hopkins Bloomberg School of Public Health, February 11, 2013.
4)� Graduate Seminar in Injury Research and Policy. “Hot Topics in Doctoral
Research.” Michael Kim, MPH and David Swedler, MPH. Johns Hopkins Bloomberg School of Public Health, February 21, 2012.
Popular/Magazine Articles 1) Hauret K and Swedler D. All Gain, No Pain. (��*�� ��. v3: 8-9, April 2009. Letters to the Editor
1)� “Try to prevent the worst from happening.” David Swedler. �����A���� . January 10, 2010.
Media 1)� “Most police murders involve guns, study finds.” NBC News (online) May 30,
2013

206��
MPH Capstone Thesis Analysis of the 2005 West Nile virus outbreak in suburban Cook County, IL. University of Michigan, School of Public Health, Department of Epidemiology, Ann Arbor, MI. April 2006. Senior Thesis Relation of the vector of Lyme disease, )-� ���������, and the reservoir of Lyme disease, ����������������, to the presence of ��������"��� �����. University of Illinois at Urbana-Champaign, College of Life Sciences, Urbana, IL. May 2004. Preliminary Oral Examination Completed February 23, 2012 Faculty Committee: Andrea Gielen (Chair), Karen Bandeen-Roche, Jacqueline Agnew, Stephen Bowman, Keshia M. Pollack (Mentor)