a model to integrate sustainability into the user-centered
TRANSCRIPT
University of Central Florida University of Central Florida
STARS STARS
Electronic Theses and Dissertations, 2004-2019
2011
A Model To Integrate Sustainability Into The User-centered Design A Model To Integrate Sustainability Into The User-centered Design
Process Process
Adrienne Shevonne Brown University of Central Florida
Part of the Industrial Engineering Commons
Find similar works at: https://stars.library.ucf.edu/etd
University of Central Florida Libraries http://library.ucf.edu
This Masters Thesis (Open Access) is brought to you for free and open access by STARS. It has been accepted for
inclusion in Electronic Theses and Dissertations, 2004-2019 by an authorized administrator of STARS. For more
information, please contact [email protected].
STARS Citation STARS Citation Brown, Adrienne Shevonne, "A Model To Integrate Sustainability Into The User-centered Design Process" (2011). Electronic Theses and Dissertations, 2004-2019. 1830. https://stars.library.ucf.edu/etd/1830

A MODEL TO INTEGRATE SUSTAINABILITY INTO THE USER-CENTERED DESIGN PROCESS
by
ADRIENNE SHEVONNE BROWN B.S. Florida Agricultural and Mechanical University, 2004
A thesis submitted in partial fulfillment of the requirements for the degree of Master of Science
in the Department of Industrial Engineering and Management Systems in the College of Engineering and Computer Science
at the University of Central Florida Orlando, Florida
Fall Term 2011

ii
© 2011 Adrienne S. Brown

iii
ABSTRACT
With concerns for the environment becoming more prevalent in business and the
government, it is increasingly important to re-evaluate and update processes to include
sustainability considerations early in the design process. In response to this charge,
this research effort was designed to integrate sustainability factors into the user-
centered design process. The results of this research highlight the benefits of
sustainability requirement planning, as well as those derived from integrating
sustainability into the current user-centered design model.
iv
I dedicate this work to my family, friends, and future generations. To my parents, Mr.
Waymon Brown III and Ms. Gina Powell, I thank you for always supporting me, no
matter what. Thank you for being my sounding boards, guiding forces, voices of reason,
and constant motivators. To my grandparents, Mr. Waymon Jr. and Mrs. J. Synovia
Brown thank you for instilling in me the importance of education and always pushing me
to achieve my dreams. Thank you for teaching me to be a "global citizen" before it was
the “in” thing to do. To future generations, be encouraged to work towards the world you
want to see.

v
ACKNOWLEDGMENTS
Special thanks to Dr. Crumpton-Young, Dr. McCauley-Bush, and Dr. Nazzal for
supporting me in completing this work. You have been great teachers, mentors, and
resources during my graduate education at UCF and I appreciate your influence on me.
I also want to thank my family and friends for supporting me when I needed it and gave
me boosts of encouragement to complete this document.
vi
TABLE OF CONTENTS
LIST OF FIGURES ......................................................................................................... vii
LIST OF TABLES .......................................................................................................... viii
CHAPTER 1: INTRODUCTION ....................................................................................... 1
CHAPTER 2: LITERATURE REVIEW ............................................................................. 7
2.1 User-Centered Design ........................................................................................... 7
2.2 Sustainability ....................................................................................................... 15
2.2.1 Three Factors of Sustainability ...................................................................... 23
2.2.2 Benefits of Sustainability in Design ............................................................... 27
2.3 Gaps Between Sustainability and User-Centered Design.................................... 31
CHAPTER 3: PROPOSED METHODOLOGY ............................................................... 33
3.1 Research Objectives............................................................................................ 33
3.2 Characterize Components and Sub-Components ............................................... 37
3.2.1 Environmental Sustainability in User-Centered Design ................................. 39
3.2.2 Economical Sustainability in User-Centered Design ..................................... 40
3.2.3 Social Sustainability in User-Centered Design .............................................. 40
3.3 Evaluation Tools .................................................................................................. 42
3.4 Data Collection .................................................................................................... 58
CHAPTER 4: RESULTS ................................................................................................ 65
4.1 Carpet .................................................................................................................. 71
4.2 Lancing Device .................................................................................................... 87
4.3 GPS Navigator ................................................................................................... 103
CHAPTER 5: DISCUSSION AND CONCLUDING REMARKS .................................... 121
5.1 Discussion ......................................................................................................... 121
5.2 Contribution to Body of Knowledge ................................................................... 124
5.3 Future Research ................................................................................................ 126
LIST OF REFERENCES ............................................................................................. 129

vii
LIST OF FIGURES
Figure 1: UCPCD Process (Kankainen, 2003) .............................................................. 10
Figure 2: IBM® UCD Report (IBM® Design: UCD Process, 2011) ................................ 14
Figure 3: Six Major Sustainability Elements (de Silva, Jawahir, Dillon Jr., & Russell, 2009) ............................................................................................................................. 21
Figure 4: A New Framework for Product Sustainability Model (de Silva, Jawahir, Dillon Jr., & Russell, 2009) ...................................................................................................... 22
Figure 5: Research Gaps between User-Centered Design and Sustainability .............. 32
Figure 6: ISO 13407: Human-centered design process (UsabilityNet: Methods: ISO 13407, 2006) ................................................................................................................. 34
Figure 7: User-centered design process ....................................................................... 35
Figure 8: Major Phases of Research Objectives ........................................................... 36
Figure 9: User-centered design for Sustainability (UCDS) methodology ....................... 38
Figure 10: Shaw© Living Carpet Tile, Golden Wheat, 12"x12" ...................................... 60
Figure 11: Lancing Device Packaging and Device (product not shown to scale with packaging in photo) ....................................................................................................... 61
Figure 12: GPS Navigator Packaging and Device (product not shown to scale with packaging in photo) ....................................................................................................... 62
Figure 13: Range of ages of ten user-centered design evaluation participants ............. 66
Figure 14: Research gaps and contributions to body of knowledge ............................ 126

viii
LIST OF TABLES
Table 1: NASA 5 Stages of UCD Process (National Aeronautics and Space Administration, 2011) ...................................................................................................... 9
Table 2: User-centered design components and sub-components (Meza, 2008) ......... 11
Table 3: Design for X Categories (Bishop, 2000) .......................................................... 24
Table 4: Economic, Environmental, and Societal Performance Indicators for Sustainability Assessment (Kutz, 2007) ........................................................................ 27
Table 5: Cognitive Design Evaluation Tool (Meza, 2008).............................................. 43
Table 6: Industrial Design Evaluation Tool (Meza, 2008) .............................................. 45
Table 7: Physical Design Evaluation Tool (Meza, 2008) ............................................... 48
Table 8: User Experience Design Evaluation Tool (Meza, 2008) .................................. 53
Table 9: Sustainable Design Evaluation Tool ................................................................ 55
Table 10: Scale used to rate product design ................................................................. 64
Table 11: Time to Complete Evaluations: Product - Carpet .......................................... 67
Table 12: Time to Complete Evaluations: Product - Lancing Device ............................. 68
Table 13: Time to Complete Evaluations: Product - GPS Navigator ............................. 68
Table 14: Average completion time for all products ...................................................... 69
Table 15: Time differences between Novice and Expert evaluators (Meza, 2008) ........ 69
Table 16: Results from Cognitive Design Evaluation Tool - Carpet ............................... 71
Table 17: Results from Industrial Design Evaluation Tool - Carpet ............................... 74
Table 18: Results from Physical Design Evaluation Tool - Carpet ................................ 78
Table 19: Results from User Experience Design Evaluation Tool - Carpet ................... 83
Table 20: Results from Sustainable Design Evaluation Tool - Carpet ........................... 86
Table 21: Results from Cognitive Design Evaluation Tool - Lancing Device ................. 88
Table 22: Results from Industrial Design Evaluation Tool - Lancing Device ................. 90
Table 23: Results from Physical Design Evaluation Tool - Lancing Device ................... 94
Table 24: Results from User Experience Design Evaluation Tool - Lancing Device ..... 99
Table 25: Results from Sustainable Design Evaluation Tool - Lancing Device ........... 102
Table 26: Comparisons of average time, Meza vs. Brown research ........................... 104
Table 27: Results from Cognitive Design Evaluation Tool - GPS Navigator ................ 105
Table 28: Results from Industrial Design Evaluation Tool - GPS Navigator ................ 107
Table 29: Results from Physical Design Evaluation Tool - GPS Navigator ................. 111

ix
Table 30: Results from User Experience Design Evaluation Tool - GPS Navigator .... 116
Table 31: Results from Sustainable Design Evaluation Tool - GPS Navigator ............ 119
Table 32: Overall averages of requirements/expectations of Sustainable Design Evaluation Tool ........................................................................................................... 123

1
CHAPTER 1: INTRODUCTION
This research will provide a model influenced by user-centered design, with modification
to the recognized user-centered design process to account for current trends in design,
in particular the integration of sustainability. User-centered design (UCD) is defined, “an
approach to design that grounds the process in information about the people who will
use the product” (Usability Professionals' Association, 2011).
In addition to user-centered design, many global organizations have made investments
in sustainability. Sustainable development, also known as sustainability, as defined by
the World Commission on Environment and Development‟s Our Common Future, is
“development that meets the needs of the present without compromising the ability of
future generations to meet their own needs” (World Commission on Environment and
Development, 1987). Greenwood (2011) puts the definition in simpler terms, stating,
"sustainability is the ability of a system to be sustained [indefinitely]". He also states that
sustainable design is "the design of systems that can be sustained [indefinitely]" and
sustainable product design as "the design of objects that aid the sustainability of the
systems in which they operate" (Greenwood, 2011). Taking into account the definitions
of user-centered design and sustainability, this model seeks to address sustainability, in
particular as it applies to user-centered design.

2
The vision of this research is to create a hybrid model of user-centered design by
incorporating sustainability components. Sustainability covers a variety of topics
including the environment, energy, agriculture, and water, to name a few. By
implementing the hybrid model created in this research, the desired effect is to influence
engineers and designers to produce sustainable products and systems, from a user-
centered design standpoint.
The challenge that this research seeks to address is the manufacture of goods
designed with sustainability in mind. By addressing sustainability in the analysis phase
of the process, a product or system that reflects the core aim of “designing for the
environment” will become the norm and not the exception. The implementation of the
hybrid model of user-centered design will lead to a shift in mindset; achieved by
eliminating a post-manufacture test to determine if consideration for sustainability
occurred, because the process will encompass sustainability from the initial concept of
the design.
Additionally, the intent is that in developing new designs, products, and systems to
reflect the core of what sustainability conveys, the technology used to create said
designs, products, and systems, will reflect sustainability. An option for achieving this
goal is to implement green technologies, such as renewable energy and environmental

3
construction, into the manufacturing process. Environmental construction is an initiative
led by the U.S. Green Building Council (USGBC). As stated on their website, the
USGBC is a "non-profit community of leaders working to make green buildings available
to everyone within a generation" (U.S. Green Building Council, 2011).
The proposed research will fill a gap on the national and international levels. By defining
a model that sets out to be sustainably responsible, its adoption by organizations will
lead to the fulfillment of sustainable user-centered design. The target is for the hybrid
model to be widely accepted, as is the current user-centered design model. This
research will strive to meet the needs of many national and international organizations.
The following organizations currently incorporate sustainability into their business goals:
1. Apple – An electronics producer of computers, laptops, MP3 players and other
items considers the impact of their products, particularly what happens when
they are designed, what happens when they are manufactured, and what
happens when they bought and used by the consumer (Apple, Inc., 2011).
2. IDEO – "An award-winning global design firm that takes a human-centered,
design-based approach to helping organizations in the public and private sectors
innovate and grow" (IDEO, Inc., 2011). IDEO is also responsible for developing
the Human-Centered Design Toolkit, "an open-source toolkit to inspire new
solutions in the developing world" (IDEO, Inc., 2011).

4
3. Boeing – Boeing is “the world's largest aerospace company and leading
manufacturer of commercial jetliners and defense, space and security systems"
(Boeing, 2011). Boeing recently introduced the 787 Dreamliner, an aircraft that
"incorporates advanced composite materials, systems and engines to provide
unprecedented performance levels, including a 20 percent improvement in fuel
efficiency over existing small twin-aisle airplanes" (Boeing, 2011). The
Dreamliner and other product initiatives incorporate more sustainable
technologies.
4. Arup – Arup is "an independent firm of designers, planners, engineers,
consultants and technical specialists offering a broad range of professional
services" (Arup, 2011). Arup offers sustainability consulting, "comprehensive
services aimed at developing and implementing policies, plans, strategies and
management systems, assessing impacts, managing risk, designing mitigation
measures, gaining regulatory approvals, undertaking audits and reviews,
reporting publicly and controlling costs" (Arup, 2011). As part of the sustainability
consulting services, Arup developed SPeAR® (Sustainable Project Appraisal
Routine), "an integrated decision-making tool used to support project
development" and "assist with improving the social, economical, and
environmental performance of projects" (Arup, 2011).
The U.S. is a developed country with extensive manufacturing ventures, providing the
opportunity to alter how to conduct business, by ensuring to adopt a culture of

5
sustainability. Much like the way that many large organizations implement Lean Six
Sigma, the objective of the hybrid user-centered design model is to improve business
systems. The key is to find the balance between the three main pillars of sustainability:
social, environmental, and economical.
Adoption of the hybrid model will influence organizations in the U.S. and other countries
to address sustainability in their user-centered design processes. Developing countries
who implement the hybrid model that focuses on sustainability can make strides
towards equality in the area of product and system developments with developed
countries. One way to achieve this goal is introducing the hybrid model into the
educational system; the target is the hybrid model will influence students to think
proactively about sustainability and implement it into their design concepts.
One of the specific aims of this research is to create a shift in focus of user-centered
design. Although the goal is not to replace users as the focus of the design process, the
objective is to elevate the importance of sustainability to the same level as user focus.
Specific areas to address with the aim of reaching the goals of this research are to
define the hybrid model, create a visual, and show the benefits. By defining the hybrid
model, persons in industry will be able to determine if it is applicable to their
organization and apply it to their processes. Having a visual of the hybrid model allows

6
individuals to see the similarities and differences to the traditional user-centered design
process. By applying this research to already existing products or systems, evaluation
of the hybrid model can assess if it has an added benefit to the original design process.
The outcomes of this research include creation of a hybrid model that integrates
multiple components of traditional user-centered design processes used by various
organizations, with the main areas of sustainability. In addition to the hybrid model,
another outcome will be an evaluation tool to measure the level of sustainability that a
product possesses.

7
CHAPTER 2: LITERATURE REVIEW
This chapter provides background information on user-centered design and
sustainability, such as definitions, historical background, methodology used for user-
centered design and benefits achieved through implementing user-centered design into
product and/or system design. Additionally, this chapter includes observation of the
gaps that exist between user-centered design and sustainability, and how this research
effort addresses these gaps.
2.1 User-Centered Design
User-centered design (UCD) is a term used to describe the design process in which the
user is the central focus. The aim of this philosophy is to create a product that focuses
on what the user really wants. According to Abras et al (Abras, Maloney-Krichmar, &
Preece, 2004), “the term 'user-centered design' originated in Donald Norman's research
laboratory at the University of California San Diego (UCSD) in the 1980s and became
widely used after the publication of a co-authored book entitled: User Centered System
Design: New Perspectives on Human-Computer Interaction” (Norman & Draper, 1986).
This book focuses on the designs of computers and how the user should be the center
consideration from which the design springs.

8
In Norman's The Psychology of Everyday Things, he suggests that there are four things
driving the intent of designing for users:
Make it easy to determine what actions are possible at any moment.
Make things visible, including the conceptual model of the system, the alternative
actions, and results of the actions.
Make it easy to evaluate the current state of the system.
Follow natural mappings between intentions and the required actions; between
actions and the resulting effect; and between the information that is visible and
the interpretation of the system state (Norman, 1988).
Meza (2008) states that, "the usability of the product and the user experience must be
included in the design requirements" for successful user-centered design. Usability is
defined by the following characteristics: efficiency, effectiveness, safety, must have
good utility, and must be easy to remember and learn (Meza, 2008). Additionally, the
user experience goals are "product being satisfying, fun, emotionally, fulfilling,
rewarding, supportive of creativity, aesthetically pleasing, motivating, helpful,
entertaining, enjoyable" (Meza, 2008).
The application of user-centered design in different industries leads to a model that best
fits the requirements of the business; many times, this leads to customization of the

9
process. The National Aeronautic and Space Administration (NASA) implement a five-
stage process to develop user-centered web sites, as seen in Table 1.
Table 1: NASA 5 Stages of UCD Process (National Aeronautics and Space Administration, 2011)
REQUIREMENTS AND PLANNING: Getting Started
Tasks and Activities Deliverables Usability Test Methods
site strategy
user needs assessment
project plan (that includes usability testing)
schedule
build project team
set high level site goals
personal interview
contextual inquiry
surveys
focus groups
CONCEPTUAL DESIGN: Creating the Framework and Flow
Tasks and Activities Deliverables Usability Test Methods
task design
information architecture
audit existing content
outline new content
usability testing
develop site map
define navigation framework
set naming conventions
storyboards
content delivery plan
exploratory tests
task flow storyboards
card sort/reverse card sort
DETAILED DESIGN: Designing the Look and Feel
Task and Activities Deliverables Usability Test Methods
review site goals
presentation design
content design
interaction design
508 accessibility compliance assessment
usability testing
paper prototypes
wireframes
high fidelity mock-ups
functioning prototypes
write style guide
design graphical templates
usability test plan and recommendations
launch and implementation plan
user performance tests on mock-ups and prototypes
task modeling assessment
usability questionnaires
review templates against style guide
PRODUCTION: Building the Site
Task and Activities Deliverables Usability Test Methods
review and follow style guide
build HTML templates
populate pages
integrate with back end
final 508 accessibility compliance assessment
final usability testing
launch site
usability test plan and recommendations
optimized graphics
user performance tests on functioning development site
MAINTENANCE: Monitoring and Updating
Task and Activities Deliverables Usability Test Methods
launch site
monitor user feedback
monitor web stats
usability test new features and changes prior to launch
maintenance plan
assign maintenance team
user comments
user surveys
server logs
expert review
user performance tests on live site
user performance tests on new feature prototypes

10
Another model that focuses on product design, instead of web site design, is that of
Kankainen (2003). Kankainen's objective is to create a process that focuses on user-
centered product concept design (UCPCD). The UCPCD process is shown in Figure 1.
Figure 1: UCPCD Process (Kankainen, 2003)
Kankainen's process studies the motivational-level needs, as well as action-level needs,
with a commonality of the two being narratives; narratives are used through the whole
DESIGN BRIEF
USER RESEARCH
Motivational level needs
GENERATING PRODUCT
CONCEPT IDEAS
BUILDING AND EVALUATING LOW-
FIDELITY UE PROBES
REFINEMENT
SELECTION
USER RESEARCH
Main action level needs
BUILDING AND EVALUATING
HIGH-FIDELITY UE PROBES
REFINEMENT
SELECTION

11
process. "Narratives can be used in all activities of user-centered product concept
design, from user research that, in this view, is for collecting user narratives, and ending
with UE [user experience] probe evaluation that provides narratives on how users could
use the product concepts in the future" (Kankainen, 2003).
Meza's (2008) model is different in comparison to Kankainen's model, but it too grasps
the essence of user-centered design. Meza characterized user-centered design into
components and subcomponents to illustrate the relationships for her taxonomy built to
measure the impact of user-centered design. Table 2 outlines the components and sub-
components of the taxonomy application.
Table 2: User-centered design components and sub-components (Meza, 2008)
User - Centered Design Components
Component Sub-components
Physical Design Anthropometry
Muscular Activity
Body Position
Body Posture
Repetitive Motion
Strength Needed
Industrial Design Illumination/Lighting
Function
Vibration
Sound/Noise
Temperature
Form
Cognitive Design Memorability
Ease of use
Usability
User Experience Design Desirable
Valuable
Usable
Findable
Credible
Accessible
Useful

12
With differing ways to implement user-centered design, it may be hard to determine the
potential benefits of incorporating user-centered design into product or system design.
Kuniavsky shares that the user experience is a long-term commitment, "a solution that
makes immediate financial and corporate sense" (2003). By focusing on the user,
businesses develop a product or system that customers want, thus increasing their
profits. Additional reasons for including user-centered design into the overall
development process include:
1. Efficiency - use of resources, clear road map before launch, reduced support
after launch
2. Reputation - user satisfaction leads to continued use of product and sharing with
others
3. Competitive advantage - ability to identify gaps in user needs of competition,
which leads to innovation drive (proactive)
4. Trust - product delivers on what it says it will, user is loyal, satisfied, and patient
5. Profit - lower costs without sacrificing quality leads to more customers and better
value to stakeholders (Kuniavsky, 2003).
To support the claims of Kuniavsky, Abras et al state that advantages of including
consideration for user-centered design are "a deeper understanding of the
psychological, organizational, social and ergonomics factors" that affect users, which in
turn leads to "the development of products that are more effective, efficient, and safe"
(Abras, Maloney-Krichmar, & Preece, 2004).

13
There are many different approaches used to assess the degree to which a product
adheres to user-centered design specifications. Many designers choose to use product
or system evaluation tools to gauge how user-centered design criteria are met. Van
Velsen et al. (2008) state that user-centered evaluation (UCE) serves three goals,
including: "verifying quality of a product, detecting problems and supporting decisions.
They also defined UCE as the following
"an empirical evaluation obtained by assessing user performance and
user attitudes towards a system, by gathering subjective user feedback on
effectiveness and satisfaction, quality of work, support and training costs
or user health and well-being" (Van Velsen, Van der Geest, Klaasen, &
Steehouder, 2008).
Meza (2008) used evaluations based on Cognitive, Industrial, Physical, and User
Experience design to determine how a product met user-centered design goals. IBM®
uses a UCD Progress Report, where goals and progress are charted to determine the
status of a project (IBM® Design: UCD Process, 2011). Figure 2 shows what the UCD
report looks like; some of the information captured is project leader, schedule, budget,
and user problems, among others.

14
Figure 2: IBM® UCD Report (IBM® Design: UCD Process, 2011)
Additional methods of validating the application of the user-centered design process for
the creation of a product are by surveys and checklists. Often, the surveys and
checklists highlight the major principles of user-centered design and observe measures
based on a scale, much like an evaluation.
15
2.2 Sustainability
Merriam-Webster defines sustainability as "capable of being sustained; of, relating to, or
being a method of harvesting or using a resource so that the resource is not depleted or
permanently damaged" (Merriam-Webster, 2011). The Environmental Protection
Agency (EPA) states sustainability is a simple principle: "everything that we need for
survival and well-being depends, either directly or indirectly, on the natural environment"
(Environmental Protection Agency, 2011). In essence, sustainability seeks to address
the use of resources currently available without compromising the ability to utilize the
same resources in the future. Additionally, sustainability addresses the ability to recycle
and/or reclaim materials. Three main factors generally characterize the focus of
sustainability: economics, environment and social.
Sustainability in design is a recent concept, emerging in the last couple of decades.
Pushes for environmental awareness, such as the Clean Air Act, signed by then
President Richard Nixon, increased the public's awareness of environmental issues.
The United Nations has also been instrumental in the increase of awareness of
environmental preservation over the course of recent decades. The United Nations
Conference on the Human Environment (better known as the Stockholm Conference),
was held in Stockholm, Sweden in 1972 (Environmental Protection Agency, 2011). At
this conference, the term "sustainable development" was first introduced. From the
Stockholm conference, was born the United Nations Environment Programme (UNEP).

16
The mandate of UNEP is "to promote the idea of environmentally-sound development"
(Environmental Protection Agency, 2011).
The most noted introduction of the concept of sustainability was in 1987 at the United
Nations conference, World Commission on Environment and Development (WCED),
also known as the "Brundtland Commission". In the Report of the World Commission on
Environment and Development: Our Common Future sustainable development, or
sustainability, is defined as "development that meets the needs of the present without
compromising the ability of future generations to meet their own needs" (World
Commission on Environment and Development, 1987).
According to the EPA, many other conferences and initiatives began in order to discuss
environmental, sustainability, and development issues. A notable conference is the UN
Conference on Environment and Development (UNCED) and Rio Earth Summit (1992),
which in turn led to Agenda 21, President's Council on Sustainable Development
(PCSD) (1993), Kyoto Climate Change Agreement (1997), and the World Summit on
Sustainable Development (WSSD) (2001) (Environmental Protection Agency, 2011).
These major events led to an increase of considering sustainability in many different
areas, including, but not limited to architecture, business, agriculture, and engineering.

17
Architecture often exhibits sustainability in its efforts to promote green building,
spearheaded by organizations such as the U.S. Green Building Council. Additionally,
sustainability in business is becoming increasingly important, even spurring the creation
of MBA programs with a sustainability focus. Closely tied to environmental sustainability
is the field of agricultural. Frequently the focus of agricultural sustainability is the
ecosystem and how chemicals. Engineering disciplines are now seeking to understand
how sustainability can be included and implemented to better execute objectives.
Pereira states that sustainability in engineering requires "a holistic approach that uses
an integral engineering method to provide for the primary needs of the population -
shelter, water, food, energy and education" (Pereira, 2009). Although sustainability
came to the forefront of concerns for international leaders in 1987, Pereira's concept for
sustainability in engineering and sustainability in design are relatively new concepts.
Architect William McDonough asserts the following, that "designing for sustainability
requires awareness of the full short and long-term consequences of any transformation
of the environment; sustainable design is the conception and realization of
environmentally sensitive and responsible expression as a part of the evolving matrix of
nature" (William McDonough Architects, 1992). Achieving sustainability is a short and
long-term goal across different design fields, such as building design, urban design, and
interaction design.

18
The initiative of the U.S. Green Building Council is one of the most well known instances
of sustainability in design, introducing LEED, or Leadership in Energy and
Environmental Design. LEED is an "internationally-recognized green building
certification system" (U.S. Green Building Council, 2011). This program provides the
tools for builders in the process of "green construction" and most notably provides a
rating scale based on the aspects of the building that are based on sustainable design.
Another design initiative that seeks to incorporate sustainability into the process is that
of urban design. Planners are often met with the challenge of integrating the three main
factors of sustainability (economics, environment, and social) into a community design.
Porta and Renne state that, "the concept of sustainability is only useful if we can gauge
the impact of development upon the economy, the environment, and the wellness of the
community" (Porta & Renne, 2005). The result was a development of an urban design
tool that enables a "bridge between urban design and sustainability", using "Sustainable
Development Indicators (SDI) to evaluate the environment (Porta & Renne, 2005).
Many models have been developed to incorporate sustainability into design processes.
One such model is that of Sustainable Interaction Design (SID) introduced by Blevis.
Blevis proposes that sustainability be the central focus of interaction design. Key items
to consider in the model are "disposal, salvage, recycling, remanufacturing for reuse,

19
reuse as is, achieving longevity of use, sharing for maximal use, achieving heirloom
status, finding wholesome alternatives to use, and active repair of misuse" (Blevis,
2007). "A goal of SID is to suggest ways in which sustainability concerns can be
integrated into existing design methods or new design methods in a manner that yields
sustainable interaction design as a practice" (Blevis, 2007).
Another area of design where sustainability is considered for integration is product
design. Bras (1997) suggests that there are "several motivating factors for a company or
organization to become more environmentally responsible". The factors that are "most
notable" are legislation, customer demand, eco-labeling programs, and ISO 14000
(Bras, 1997). The goal of environmentally conscious design is the development of new
tools to gauge the process. Bras (1997) states that such a tool to gauge the process
should have seven characteristics. The characteristics are:
Simple - they should be easy to use
Easily Obtainable - at a reasonable cost
Precisely Definable - it is clear as to how they can be evaluated
Objective - two or more qualified observers should arrive at the same
result
Valid - they should measure, indicate, or predict correctly what they are
intended to measure, indicate, or predict
Robust - relatively insensitive to changes in the domain application, and

20
Enhancement of Understanding and Prediction - good metrics, models
and decision support tools should foster insight and assist in predicting
process and product parameters (Bras, 1997).
Important to note is that although the development of tools is important in making the
change in design towards sustainability, but also "perhaps the most important issue in
moving towards integrating environmental issues in product design is education" (Bras,
1997).
Another concept to consider is the proposed methodology to evaluate product
sustainability in the design and development stage of products introduced by Silva et al.
Many products are disposed by two options: landfill or incineration. The method
proposed, "provides a simplified product sustainability scoring technique where the
inputs of the model consist of data available at a design stage of product development"
(de Silva, Jawahir, Dillon Jr., & Russell, 2009). The model has acknowledged six
"Sustainability Elements": product's environmental impact, societal impact, functionality,
resource utilization and economy, manufacturability and recyclability/remanufacturability
(de Silva, Jawahir, Dillon Jr., & Russell, 2009). Figure 3 shows six major "Sustainability
Elements" of the Product Sustainability Scoring Model.

21
Figure 3: Six Major Sustainability Elements (de Silva, Jawahir, Dillon Jr., & Russell, 2009)
The elements of the model are then inserted into the framework suggested by Silva et
al. which includes "44 influencing factors, 24 sub-elements, 6 sustainability elements,
and product sustainability index", as shown in Figure 4.
Product Sustainability Scoring Model
Environmental
Impact
Functionality
Manufacturability
Recyclability/
Remanufacturability
Resource Utilization/Economy
Societal Impact

22
Figure 4: A New Framework for Product Sustainability Model (de Silva, Jawahir, Dillon Jr., & Russell, 2009)
A concluding remark from the team that developed this new methodology is it is a
"simple model which is useful in decision making at the design stage of product
development" (de Silva, Jawahir, Dillon Jr., & Russell, 2009).
Rouse (1991) describes the prerequisites of successful human-centered design as:
1. Long-term Perspective - planning for viability, acceptability, and validity
measurements, for which closure will not be reached for several years
2. Sense of Accountability - both ethical and legal accountability are needed
throughout design life cycle; motivates designers, as well as managers, to assure
that they are meeting the needs of users, customers, and other stakeholders.
6 Sustainability Elements
24 Sub-Elements
44 Influencing Factors These factors are equally weighed
The index is the weighted average of these sub elements
Product Sustainability Index

23
3. Flexible Design Process - that enables feedback of measurements into design
refinements prior to production.
4. Cooperative User-Producer Relationships - the naturalist and marketing phases
afford opportunities for building relationships, and the sales and service phase
supplies the means for maintaining them (Rouse, 1991).
By incorporating sustainability into Rouse's prerequisites for successful human-centered
design, the benefits are quite evident. When taking into consideration the economic
benefits of sustainability, the launch of the Dow Jones Sustainability Index (DJSI) is a
marker that sustainability is good business. Economics play an important role in
sustainable development and it is important to explore "from an economic perspective a
sustainable development path that maximizes the long-term net benefits to humankind,
taking into account the costs of environmental and natural resource degradation"
(Asefa, 2005). Thus, the economics of sustainability address, at least, the first two
prerequisites of Rouse for successful design.
2.2.1 Three Factors of Sustainability
Three factors characterize sustainability: environmental, economical, and social.
Environmental sustainability is probably the most popular and easily understood of the
three factors of sustainability. The overall goal of environmental sustainability is to

24
preserve resources provided by the environment for future generations and not to
produce waste that destroys the current environment. That goal is synonymous with a
term that is familiar with environment sustainability: "design for environment". Two goals
of design for the environment, also known as DfE, are waste prevention and materials
management (Bishop, 2000). Bishop (2000) also asserts other categories, which he
calls "Design for X"; additional categories are shown in Table 3.
Table 3: Design for X Categories (Bishop, 2000)
Category Acronym Description
Environment DfE Implement pollution prevention, energy efficiency, and other resource conservation measures to reduce adverse impacts on human health and the environment
Manufacturability DfM Integrate a product's manufacturing requirements into fabrication and assembly processes available in the factory
Disassembly DfA Design the product for ease of disassembly and component/material reuse/recycling after the product's useful life is over
Recycle DfR Design the product so that it can be easily recycled
Serviceability DfS Design the product so that it can be easily installed, serviced, or repaired
Compliance DfC Design the product so that it meets all regulatory requirements
The aspect of sustainability that is of highest interest, especially to companies worried
about profit, is economics. Economic sustainability is closely related to environmental
for various reasons. One reason is liability associated with air pollution, water
contamination, and health problems (Kutz, 2007). Another reason is the poverty level
found in developing countries. Many impoverished persons in developing countries
utilize the agriculture around them for sustenance and often participate in "slash-and-
burn" techniques.

25
In addition to liability for government regulations and poverty in developing countries,
other aspects that influence economic sustainability are product life cycle and product
innovation. By taking into account the life cycle of a product, organizations can factor
costs and savings in "product, waste treatment, and disposal" (Kutz, 2007). Leading in
those areas may also lead to admission to the Dow Jones Sustainability Index, a
confirming sign of the organization's commitment to sustainability. Product innovation
lends itself to economics because the development of environmentally conscious
products meets the current trend and demand, therefore increasing profit for an
organization.
The social aspect is often the least defined regarded of sustainability. Environment and
economics often take the forefront of one's understanding of the overall aspect of
sustainability, while social sustainability is loosely defined. Magis and Shinn (2009)
shared the belief that social sustainability is based on four principles: human well-being,
equity, democratic government, and democratic civil society. Kutz (2007) shared similar
views, stating that the social aspect of sustainability has a goal to ensure "health, well
being, security, and a high quality of life". Based on the knowledge shared by Magis and
Shinn and Kutz about social sustainability, it is evident human well-being and equity are
two key factors; these are also key in user-centered design, always ensuring the well-
being of the users and that the product exhibits reasonable accommodations for the
intended population for which it was designed.

26
Another viewpoint of how social sustainability defined is from Hawkins (2006), who
suggests that the basis of sustainability has many more factors:
Culture - balance cultural diversity, while improving community well-being;
globalization
Age - Western culture is an aging community, despite expected population
growth expected to exceed 7 billion in 20 years
Urbanization - brought on by economic and political instability
Religion - predominant religions of the world will be Christianity and Islam in next
20 years
Education - increased numbers in large developing countries (India, China,
Indonesia)
Health - the spread of diseases such as HIV/AIDS and SARS
Technology - digital communication and social media have bridge the global gap
(Hawkins, 2006).
Kutz (2007) explores the three aspects of sustainability and the indicators of each.
Table 4 shows the three factors of sustainability and some indicators that characterize
each factor.

27
Table 4: Economic, Environmental, and Societal Performance Indicators for Sustainability Assessment (Kutz, 2007)
Economic Environmental Societal
Direct
Raw material Cost
Labor Cost
Capital Cost
Material Consumption
Product & packaging mass
Useful product lifetime
Hazardous materials used
Quality of Life
Breadth of product availability
Knowledge or skill enhancement
Potentially Hidden
Recycling Revenue
Product disposition cost
Energy Consumption
Life-cycle energy
Power use during operation
Peace of Mind
Perceived risk
Complaints
Contingent
Employee injury cost
Customer warranty cost
Local Impacts
Product recyclability
Impact upon local streams
Illness & Disease Reduction
Illnesses avoided
Mortality reduction
Relationship
Loss of goodwill due to customer concerns
Business interruption due to stakeholder interventions
Regional Impacts
Smog creation
Acid rain precursors
Biodiversity reduction
Accident & Injury reduction
Lost-time injuries
Reportable releases
Number of incidents
Externalities
Ecosystem productivity loss
Resource depletion
Global Impacts
COe emissions
Ozone depletion
Health & Wellness
Nutritional value provided
Food costs
2.2.2 Benefits of Sustainability in Design
The environmental benefits of sustainability in design, as it applies to the prerequisites
of Rouse, appeal to the sense of accountability. Ethics plays an important part "because
of the impact designers have on [...] quality of life, the environment, and the future"
(Russ, 2010). The "do-no harm" concept is an oath that many believe should be
adopted by all designer; mainly because designers are responsible for balancing "the
interests of clients, community, economics, the environment, end users, and regulators
to synthesize a design" (Russ, 2010).
There are social benefits also when considering sustainability in design. As Magis and
Shinn (2009) state, economics and environment are the main factors of sustainability

28
that many focus on (Magis & Shinn, 2009). Albeit that the three factors are all inter-
related, those two are easiest to define. Social sustainability is in fact, promoting social
well-being. Magis & Shinn (2009) share that Robert Prescott-Allen (in 2001) "describes
social well-being as the fulfillment of basic needs and the exercise of political,
economic, and social freedoms". "Three traditions of research and practice add
definition to the concept of social well-being and, hence, social sustainability: Human-
Centered Development, Sustainability, and Community Well-Being" (Magis & Shinn,
2009). This theory supports that the social aspect of sustainability is an important part of
human (user)-centered design.
In recent years, recycling has become a mainstay in everyday life; from homeowners
filling their green recycle bins with plastics and cardboard, to offices encouraging
employees to place their empty cans and bottles in designated areas. Recycling of
products is touted as being a solution towards sustainability. Some would say that
recycling requires a certain social state of mind, a concern for the environment that
influences an action. Carlson postulates that, "recyclers get either intrinsic satisfaction
for doing the right thing, approval from friends and neighbors for their environmentally
correct behavior, or both" (Carlson, 2001). Many recycle without receiving
compensation or being told recycling is mandatory.

29
On the contrary, product manufacturers are held to a different standard; "regulations
may force manufacturers to recycle even before the process becomes economically
viable. Because the products to be recycled a few years from now are the ones
designed and built today, we need to account for their recyclability in our current design
process" (Beardsley, Kroll, & Parulian, 1996). Due to this potential regulation, it
behooves manufactures to consider recycling and reclamation as additions to the
design process.
A concept that Beardsley et al suggest is "design for disassembly", or "DFD", closely
related to the well-known "design for assembly", or "DFA". While the aim of DFA is to
simply the product so that the cost of assembly is reduced (Chan & Salustri, 2003),
Beardsley et al suggest that DFD would encourage redesign of certain products so that
disassembling them at their end of life would be conducive towards recycling.
In 2002, William McDonough and Michael Braungart, an architect and chemist,
respectively, introduced to the world the idea of "cradle to cradle". Normally, a product's
life cycle is "cradle to grave", where the grave is usually a landfill. McDonough and
Braungart introduced their new concept as a charge to designers to remake the way
things are made.
30
Albeit that recycling is a noble effort, it usually leads to lower quality materials that will
eventually lead to their final resting place in a landfill. Instead, "products can be
designed from the outset so that, after their useful lives, they will provide nourishment
for something new" (McDonough & Braungart, 2002). The guiding principle of
McDonough and Braungart is that "waste equals food". An excerpt from the book Cradle
to Cradle shares that at the end of a product's life cycle, it becomes
"'biological nutrients' that will easily reenter the water or soil without
depositing synthetic materials and toxins. Or they can be 'technical
nutrients' that will continually circulate as pure and valuable materials
within closed-loop industrial cycles, rather than being 'recycled' - really,
downcycled - into low-grade materials and uses" (McDonough &
Braungart, 2002).
The "cradle to cradle" principle should be considered for the design process, because it
factors from the beginning, what the product should consist of material wise, as well as
what will happen with the materials at the end of life for the product. This principle is a
proactive approach to achieving sustainability in design.
31
2.3 Gaps Between Sustainability and User-Centered Design
The goal of the research is to address the gaps between an accepted user-centered
design process and sustainability factors to add to the model to ensure the design of
products and systems meet the user‟s needs, expectations, and engagement with
products and systems. Figure 5 illustrates the research gaps identified in the literature
review and the contributions gained from conducting this research.

32
Figure 5: Research Gaps between User-Centered Design and Sustainability
"With sustainable product design having a solid tradition in technical disciplines (in particular
mechanical engineering), research that has addressed the demand side or human of products, and how this can contribute to energy-efficient product use, is very
limited" (Weever et al., 2008)
Research Gaps My Research Contributions
New User-centered Design Model
Updated User Centered Design Evaluation Tool
Understand the relationship between User-Centered Design
and Sustainability
"User behaviour is a significant determinant of a product‟s environmental impact; while engineering advances permit increased efficiency of product
operation, the user‟s decisions and habits ultimately have a major effect on the energy or other resources used by the product. There is thus a need to change
users‟ behaviour. A range of design techniques developed in diverse contexts suggest opportunities for engineers, designers and other stakeholders working in
the field of sustainable innovation to affect users‟ behaviour at the point of interaction with the product or
system, in effect „making the user more efficient'" (Lockton, 2008).
"The U.S. Congress's Office of Technology Assessment (OTA) coined the phrase 'green design' to
signify a design process in which environmental attributes of a product are treated as design
opportunities, rather than design constraints...The ultimate goal should be 'sustainable development'"
(Bishop, 2000).
"Once you understand the destruction taking place, unless you do something to change it, even if you
never intended to cause such destruction, you become involved in a strategy of tragedy. You can continue to
be engaged in that strategy of tragedy, or you can design and implement a strategy of change"
(McDonough & Braungart, 2002).
“With sustainable product design having a solid tradition in technical disciplines (in particular mechanical
engineering), research that has addressed the demand side or human side of products, and how this can contribute to energy-efficient product use, is very
limited” (Wever, van Kuijk, & Boks, 2008).

33
CHAPTER 3: PROPOSED METHODOLOGY
This chapter discusses the objectives of this research, the development of the model
integrating sustainability into the user-centered design process, the validation of
sustainability integration for each factor (economical, environmental, and social) and the
creation of a Sustainable Design Evaluation Tool to append to the User Centered
Design Evaluation Tool developed by Meza. Additionally, this chapter states the
products used to conduct the research.
3.1 Research Objectives
The purpose of this research is to integrate the three primary aspects of sustainability
into an existing methodology of user-centered design. The objective is to create a hybrid
model based on user-centered design, but also focusing on sustainability. Additionally,
the use of three sustainability factors to develop a Sustainable Design Evaluation Tool,
appended to the tool developed by Meza.
Sustainability is comprised of three factors: those factors are social, environmental, and
economical. The goal is to emphasize the importance of sustainability, while suggesting
intertwining sustainability into the process user-centered design. It is important to
address the international standard of the design process, aptly titled human-centered
design, instead of user-centered design. The International Organization for

34
Standardization (ISO) defines the development cycle for the human-centered design
process in six steps (ISO 13407: Human-centered design process) (UsabilityNet:
Methods: ISO 13407, 2006):
1. Identify need for human centered design
2. Specify context of use
3. Specify requirements
4. Produce design solutions
5. Evaluate designs
6. System satisfies specified requirements
Figure 6 shows the relationship of the six steps of the process. It is important to note
that the process loops at the "Evaluate designs" phase and returns to "Specify context
of use" until the system meets the requirements specified.
Figure 6: ISO 13407: Human-centered design process (UsabilityNet: Methods: ISO 13407, 2006)
Identify need Specify use Specify
requirements
Produce solutions
Evaluate Designs
Satisfies requirements

35
The current methodology of user-centered design is well known and as stated by the
Usability Professionals' Association follows a four-phase process: analysis, design,
implementation, and deployment (Usability Professionals' Association, 2011), as shown
in Figure 7.
Figure 7: User-centered design process
The hybrid model developed in this research uses the four-phase user-centered design
process as the main components and expands on the sub-components, utilizing the
methodologies of two well-known organizations.
The steps taken to achieve objectives in this research were part of a four-phase
process. The phases outline the research approach to achieve goals and objectives in
User
Analysis Phase
Design Phase
Implementation
Phase
Deployment Phase

36
this research. Figure 8 depicts the four phases and the accompanying objectives. The
goal of Phase 1 was to characterize the components and sub-components for the user-
centered design model integrating sustainability. Achievement of this objective was
through literature review. Phase 2 objective was to select the appropriate tool to assess
the components and sub-components. The next phase, Phase 3, the objective was to
develop a tool to quantify the components and sub-components. The final phase, Phase
4, is to validate the research objectives.
Figure 8: Major Phases of Research Objectives
PHASE I - CHARACTERIZE COMPONENTS, SUB-COMPONENTS FOR USER-CENTERED DESIGN INTEGRATING SUSTAINABILITY
• Literature Review
PHASE 2 - SELECT TOOL TO ASSESS COMPONENTS, SUB-COMPONENTS
• Literature Review
• Meza User Centered Design Evaluation Tool
PHASE 3 - DEVELOP TOOL TO QUANTIFY COMPONENTS, SUB-COMPONENTS
• Sustainable Design Assessment Evaluation Tool
PHASE 4 - VALIDATION

37
3.2 Characterize Components and Sub-Components
Sustainability factors of importance as evidenced by the existing literature were
incorporated into the research model generated during this research effort. The main
components are the same as components of the user-centered design model outlined
by the Usability Professionals‟ Association. The sub-components of the hybrid model
developed in this research are a mixture of the methodology followed by the National
Aeronautics and Space Administration (NASA) (Planning, Concept Design, Detailed
Design, Production, Maintenance (National Aeronautics and Space Administration,
2011)) and SAP Software Solutions (Plan, Research, Design, Adapt, Measure (SAP,
2009)). The sub-components shown in Figure 9 have the additional components for
sustainability; thus, the model is named User-Centered Design for Sustainability
(UCDS). The sustainability components shown in Figure 9 have asterisks to
differentiate from the usual sub-components of user-centered design.

38
Figure 9: User-centered design for Sustainability (UCDS) methodology
The rationale for incorporating the three primary aspects of sustainability into the
different phases of the user-centered design process is to ensure when designing a
product or system, application of considerations for sustainability are throughout the
process. In order for this to happen, weaving the three sustainability factors into the
traditional user-centered design process is necessary. This is achieved by showing how
and where each factor fits into the UCD process. Evidence from existing literature led to
Analysis
Plan
Research
Social*
Environment*
Economic*
Design
Concept
Social*
Environment*
Economic* Detailed
Implementation
Adapt
Production
Environment*
Economic*
Deployment
Measure
Maintenance
Recycle*
Reclaim*

39
the development of the sustainability sub-components in this research and development
of an evaluation tool for sustainable design.
3.2.1 Environmental Sustainability in User-Centered Design
Environmental sustainability is the easiest factor to integrate in user-centered design,
because it is the most known aspect of sustainability. The environmental factor of
sustainability is most useful in three categories of the user-centered design model. As
seen in Figure 9, the components of environment sustainability are in included, which
encompass analysis, design, and deployment.
The goal is to determine where the product or system fits, if at all, into the
environmental factors that makes up sustainability. The following questions meet the
research objectives to determine if the product or system meets the goals of
environment al sustainability.
1. Is the product easy to disassemble?
2. Does the product come with sufficient information for recovery by the original
equipment manufacturer (OEM) or third party?
3. Does the product come with minimal packaging?
4. Does the product design allow for all or parts of the product to be recycled?

40
A goal of this research is to incorporate these questions into a Sustainable Design
Evaluation Tool, along with the two other factors of sustainability. Next is an
examination of economic sustainability to determine how it fits into the user-centered
design model, much like how environmental sustainability fits into the model.
3.2.2 Economical Sustainability in User-Centered Design
Using the literature as a basis, this research develops how economic sustainability fits
into user-centered design; the rationale of the research states economic sustainability
often examines the relationship between the consumer (user) and the producer.
Understanding the user's needs and being able to meet those needs with a product or
system leads to higher sales and a larger profit. The following questions meet the
research objectives to determine if the product or system meets the goals of economic
sustainability.
1. Does the development of the product include a risk management plan?
2. Does the manufacture of the product take into consideration stakeholder returns?
3. Does the manufacture of the product support profitable growth?
4. Is the product innovative?
3.2.3 Social Sustainability in User-Centered Design
It is clear to see that it is necessary to consider social sustainability early in the UCD
process to take into account all of the social factors. This is why placement of social

41
sustainability is in the Analysis phase of the model (shown in Figure 9). The challenge
for engineers and designers is to determine where their product fits, if at all, into the
societal considerations pertinent to sustainability. Social sustainability is the hardest of
the three factors to define. Even literature describing sustainability factors has limited
details on social sustainability. The following questions attempt to fill the gap in literature
and meet the research objectives to determine if the product or system meets the goals
of social sustainability.
1. Does the product support Equal Opportunity use?
2. Does the product meet the goal for its intended population?
3. Does the product foster an awareness of community?
4. Does the product come with sufficient information to educate the user with
product use?
One technique to determine if the design of a product meets the criteria of user-
centered design is to utilize evaluation tools and rate how the product meets the needs.
Based on the information gained from the three components of sustainability, an
evaluation tool (sustainable design) was developed, incorporating knowledge about
sustainability to complete the user-centered design evaluation.
42
3.3 Evaluation Tools
In order to verify the UCDS model stated in the previous section, an additional
evaluation tool was added to the User Centered Design Evaluation Tool introduced by
Meza (2008). The questions stated in the social sustainability, environmental
sustainability and economic sustainability sections of this research were used to
develop the Sustainable Design Evaluation Tool. The evaluation tool created in this
research joins the other evaluation tools from Meza‟s User Centered Design Evaluation
Tool: cognitive design, industrial design, physical design, and user experience design.
Tables 5-8 show the evaluation created by Meza. Table 9 is the Sustainable Design
Evaluation Tool developed in this research.

43
Table 5: Cognitive Design Evaluation Tool (Meza, 2008)
COGNITIVE DESIGN EVALUATION TOOL
Design Goals Requirement/Expectation
Not Applicable
Does Not
Meet
Barely Meets
Somewhat Meets
Meets Strongly Meets
Very Strongly Meets
Exceeds Design Comments/Recommendation
EASE OF USE
The design uses population stereotypes that users can relate
NA 1 2 3 4 5 6 7
Tasks/Procedures required are consistent
NA 1 2 3 4 5 6 7
Tasks/Procedures required are intuitive
NA 1 2 3 4 5 6 7
New tasks/Procedures required are easy to learn
NA 1 2 3 4 5 6 7
Small amount of time required to learn how to perform a task
NA 1 2 3 4 5 6 7
Features are familiar NA 1 2 3 4 5 6 7
MEMORABILITY
Memorability – Maximum number of items a person needs to remember is between 5-9
NA 1 2 3 4 5 6 7
Sensory storage-encoding (visual, auditory)
NA 1 2 3 4 5 6 7
Coding – For high accuracy identification the number of colors used on a display are 5. Red, yellow, and green are reserved for “danger”, “caution”,
NA 1 2 3 4 5 6 7

44
COGNITIVE DESIGN EVALUATION TOOL
Design Goals Requirement/Expectation
Not Applicable
Does Not
Meet
Barely Meets
Somewhat Meets
Meets Strongly Meets
Very Strongly Meets
Exceeds Design Comments/Recommendation
and “safe”, respectively.
Working memory (short term – capacity, duration: visual, phonetic, semantic)
NA 1 2 3 4 5 6 7
Long term memory – Steps and items can be remembered easily after a long period of time
NA 1 2 3 4 5 6 7
USABILITY
Short performance time is required to complete a task
NA 1 2 3 4 5 6 7
Short amount of time is required to locate specific information
NA 1 2 3 4 5 6 7
Output/Input – Large percentage of tasks successfully completed
NA 1 2 3 4 5 6 7
Small number of times help is required
NA 1 2 3 4 5 6 7
Small number of errors made performing a task
NA 1 2 3 4 5 6 7
Short time spent recovering from errors
NA 1 2 3 4 5 6 7
Additional Comments/Notes

45
Table 6: Industrial Design Evaluation Tool (Meza, 2008)
INDUSTRIAL DESIGN EVALUATION TOOL
Design Goals Requirement/Expectation
Not Applicable
Does Not
Meet
Barely Meets
Somewhat Meets
Meets Strongly Meets
Very Strongly Meets
Exceeds Design Comments/Recommendation
FORM
Color contrast ratio – Ration of object luminance over the background luminance. Measured with Modular Transfer Function Area (MTFA). High contrast must be 10 MTFA.
NA 1 2 3 4 5 6 7
Appearance – Durable yet attractive finish
NA 1 2 3 4 5 6 7
Font size – Observer‟s visual angle should be between 14-22 minutes of arc
NA 1 2 3 4 5 6 7
Size of alert – Visual signals should subtend at least 1 degree of visual angle
NA 1 2 3 4 5 6 7
Contrast ratio – Visual signals are at least twice as bright as other displays
NA 1 2 3 4 5 6 7
Touchscreen sensor Size 19 mm square
NA 1 2 3 4 5 6 7
Touchscreen size has a matrix of 5x6 or 6x7
NA 1 2 3 4 5 6 7
Meets design requirements for the shape (length, width, height)
NA 1 2 3 4 5 6 7
Meets design requirements for the texture (coarse, fine, even)
NA 1 2 3 4 5 6 7
Design provides flexibility NA 1 2 3 4 5 6 7

46
INDUSTRIAL DESIGN EVALUATION TOOL
Design Goals Requirement/Expectation
Not Applicable
Does Not
Meet
Barely Meets
Somewhat Meets
Meets Strongly Meets
Very Strongly Meets
Exceeds Design Comments/Recommendation
(design allowances, tolerances, universal design considerations)
SOUND/NOISE LEVEL
Duration of signal sounds are appropriate for receival and recognition
NA 1 2 3 4 5 6 7
Maximum signal levels – Level of auditory signal is 30 dB above masking threshold
NA 1 2 3 4 5 6 7
Alarm signal minimum duration is 100ms
NA 1 2 3 4 5 6 7
Pitch – The pitch of warming sounds is between 15-1000Hz
NA 1 2 3 4 5 6 7
ILLUMINATION/LIGHTING
Adaptation NA 1 2 3 4 5 6 7
Limited exposure to extreme radiant energy
NA 1 2 3 4 5 6 7
Limited exposure to extreme irradiance
NA 1 2 3 4 5 6 7
Limited exposure to extreme glare
NA 1 2 3 4 5 6 7
Limited exposure to extreme brightness
NA 1 2 3 4 5 6 7
Limited exposure to extreme reflectance
NA 1 2 3 4 5 6 7
Limited exposure to extreme energy
NA 1 2 3 4 5 6 7
VIBRATION

47
INDUSTRIAL DESIGN EVALUATION TOOL
Design Goals Requirement/Expectation
Not Applicable
Does Not
Meet
Barely Meets
Somewhat Meets
Meets Strongly Meets
Very Strongly Meets
Exceeds Design Comments/Recommendation
Limited exposure to extreme vibration frequency
NA 1 2 3 4 5 6 7
Limited exposure to extreme vibration intensity
NA 1 2 3 4 5 6 7
Amplitude NA 1 2 3 4 5 6 7
Displacement NA 1 2 3 4 5 6 7
Limited exposure to impact forces
NA 1 2 3 4 5 6 7
Velocity NA 1 2 3 4 5 6 7
Acceleration NA 1 2 3 4 5 6 7
TEMPERATURE
Limited exposure to extreme environmental temperature
NA 1 2 3 4 5 6 7
Limited exposure to extreme surface temperature
NA 1 2 3 4 5 6 7
FUNCTION
Features are consistent NA 1 2 3 4 5 6 7
Features are durable NA 1 2 3 4 5 6 7
Easy maintenance – Easy to clean
NA 1 2 3 4 5 6 7
Features are precise NA 1 2 3 4 5 6 7
Features are comfortable NA 1 2 3 4 5 6 7
Features are predictable NA 1 2 3 4 5 6 7
Additional Comments/Notes

48
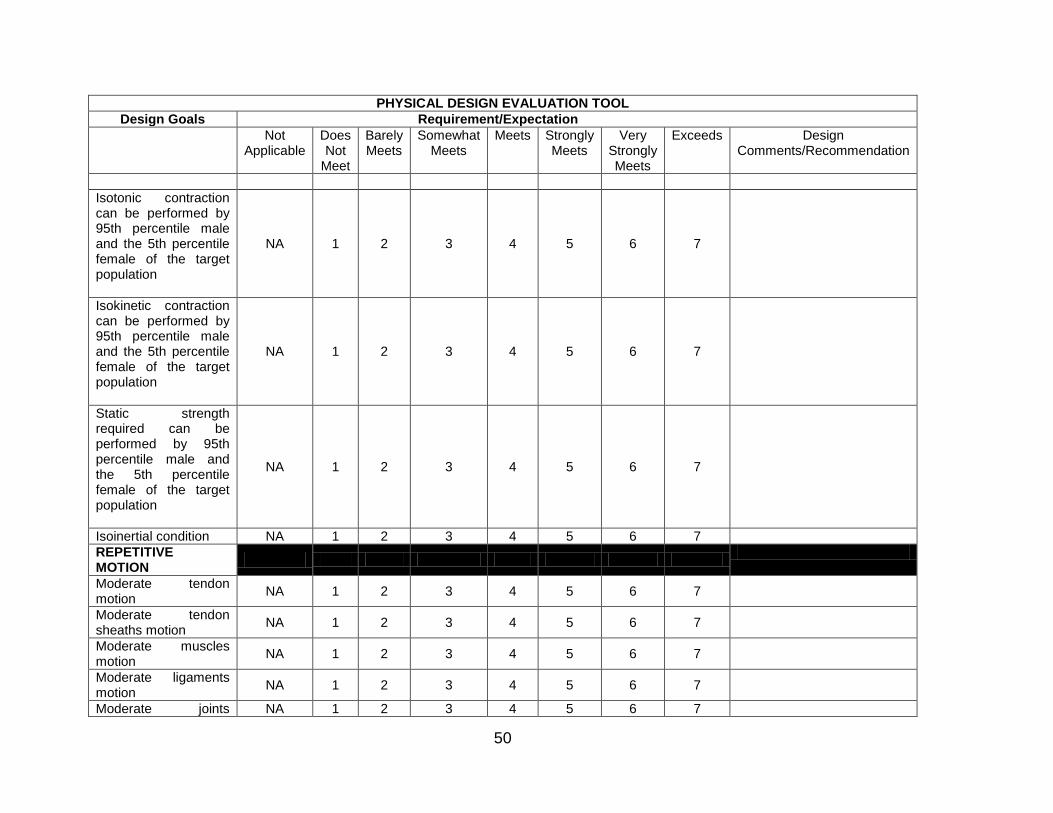
Table 7: Physical Design Evaluation Tool (Meza, 2008)
PHYSICAL DESIGN EVALUATION TOOL
Design Goals Requirement/Expectation
Not Applicable
Does Not
Meet
Barely Meets
Somewhat Meets
Meets Strongly Meets
Very Strongly Meets
Exceeds Design Comments/Recommendation
ANTHROPOMETRY
The design accommodates the 95
th percentile male
and the 5th percentile
female of the population Body Segment Length (Width, Circumference)
NA 1 2 3 4 5 6 7
The design accommodates the 95
th percentile male
and the 5th percentile
female of the population Body Segment Mass (Volume, Weight, Density)
NA 1 2 3 4 5 6 7
The design accommodates the 95
th percentile male
and the 5th percentile
female of the population Body Segment Center of Mass
NA 1 2 3 4 5 6 7

49
PHYSICAL DESIGN EVALUATION TOOL
Design Goals Requirement/Expectation
Not Applicable
Does Not
Meet
Barely Meets
Somewhat Meets
Meets Strongly Meets
Very Strongly Meets
Exceeds Design Comments/Recommendation
The design accommodates the 95
th percentile male
and the 5th percentile
female of the population Range of Motion
NA 1 2 3 4 5 6 7
The design accommodates the 95
th percentile male
and the 5th percentile
female of the population Strength Capabilities
NA 1 2 3 4 5 6 7
The design accommodates the 95
th percentile male
and the 5th percentile
female of the population Moments
NA 1 2 3 4 5 6 7
Muscular Activity can be performed by 95th percentile male and the 5th percentile female of the target population
NA 1 2 3 4 5 6 7
STRENGTH NEEDED
Neutral body position NA 1 2 3 4 5 6 7
Isometric contraction can be performed by 95th percentile male and the 5th percentile female of the target population
NA 1 2 3 4 5 6 7
50
PHYSICAL DESIGN EVALUATION TOOL
Design Goals Requirement/Expectation
Not Applicable
Does Not
Meet
Barely Meets
Somewhat Meets
Meets Strongly Meets
Very Strongly Meets
Exceeds Design Comments/Recommendation
Isotonic contraction can be performed by 95th percentile male and the 5th percentile female of the target population
NA 1 2 3 4 5 6 7
Isokinetic contraction can be performed by 95th percentile male and the 5th percentile female of the target population
NA 1 2 3 4 5 6 7
Static strength required can be performed by 95th percentile male and the 5th percentile female of the target population
NA 1 2 3 4 5 6 7
Isoinertial condition NA 1 2 3 4 5 6 7
REPETITIVE MOTION
Moderate tendon motion
NA 1 2 3 4 5 6 7
Moderate tendon sheaths motion
NA 1 2 3 4 5 6 7
Moderate muscles motion
NA 1 2 3 4 5 6 7
Moderate ligaments motion
NA 1 2 3 4 5 6 7
Moderate joints NA 1 2 3 4 5 6 7

51
PHYSICAL DESIGN EVALUATION TOOL
Design Goals Requirement/Expectation
Not Applicable
Does Not
Meet
Barely Meets
Somewhat Meets
Meets Strongly Meets
Very Strongly Meets
Exceeds Design Comments/Recommendation
motion
Moderate nerves motion
NA 1 2 3 4 5 6 7
MUSCULAR ACTIVITY
Minimum static loading
NA 1 2 3 4 5 6 7
Moderate endurance requirement
NA 1 2 3 4 5 6 7
Moderate repetition requirement
NA 1 2 3 4 5 6 7
Moderate frequency requirement
NA 1 2 3 4 5 6 7
BODY POSTURE
Neutral body plane NA 1 2 3 4 5 6 7
Neutral extension (No twisting required while extending)
NA 1 2 3 4 5 6 7
Neutral flexion (No twisting required while flexing the muscles)
NA 1 2 3 4 5 6 7
Neutral abduction NA 1 2 3 4 5 6 7
Neutral adduction NA 1 2 3 4 5 6 7
Neutral posture NA 1 2 3 4 5 6 7
BODY POSITION
Neutral sitting position required
NA 1 2 3 4 5 6 7
Neutral standing position required
NA 1 2 3 4 5 6 7
Limited stooping required
NA 1 2 3 4 5 6 7
Limited crouching required
NA 1 2 3 4 5 6 7
Supine (lying down) NA 1 2 3 4 5 6 7

52
PHYSICAL DESIGN EVALUATION TOOL
Design Goals Requirement/Expectation
Not Applicable
Does Not
Meet
Barely Meets
Somewhat Meets
Meets Strongly Meets
Very Strongly Meets
Exceeds Design Comments/Recommendation
Limited kneeling required
NA 1 2 3 4 5 6 7
Walking NA 1 2 3 4 5 6 7
Limited overhead reaching required
NA 1 2 3 4 5 6 7
Activation is easy NA 1 2 3 4 5 6 7
Limited extended reach required
NA 1 2 3 4 5 6 7
Signal levels – Signal levels are 15-16 dB above masking threshold for rapid response to a signal
NA 1 2 3 4 5 6 7
Location of alert – 15 degrees of maximum deviation for high priority alerts and 30 degrees for low priority alerts
NA 1 2 3 4 5 6 7
Additional Comments/Notes

53
Table 8: User Experience Design Evaluation Tool (Meza, 2008)
USER EXPERIENCE DESIGN EVALUATION TOOL
Design Goals Requirement/Expectation
Not Applicable
Does Not
Meet
Barely Meets
Somewhat Meets
Meets Strongly Meets
Very Strongly Meets
Exceeds Design Comments/Recommendation
EASE OF USE
The design is helpful NA 1 2 3 4 5 6 7
The design is supporting
NA 1 2 3 4 5 6 7
USABLE
The design is enjoyable to use
NA 1 2 3 4 5 6 7
The design is handy to use
NA 1 2 3 4 5 6 7
The design is practical NA 1 2 3 4 5 6 7
The design is convenient
NA 1 2 3 4 5 6 7
The design provides control
NA 1 2 3 4 5 6 7
FINDABLE
The design is predictable
NA 1 2 3 4 5 6 7
The design is clear to use
NA 1 2 3 4 5 6 7
The design is familiar NA 1 2 3 4 5 6 7
DESIRABLE
The design is emotionally fulfilling
NA 1 2 3 4 5 6 7
The design is satisfying
NA 1 2 3 4 5 6 7
The design is motivating
NA 1 2 3 4 5 6 7
The design is aesthetically pleasing
NA 1 2 3 4 5 6 7
The design is entertaining to use
NA 1 2 3 4 5 6 7
The design is NA 1 2 3 4 5 6 7

54
USER EXPERIENCE DESIGN EVALUATION TOOL
Design Goals Requirement/Expectation
Not Applicable
Does Not
Meet
Barely Meets
Somewhat Meets
Meets Strongly Meets
Very Strongly Meets
Exceeds Design Comments/Recommendation
interesting to use
The design is exciting to use
NA 1 2 3 4 5 6 7
The design is attractive
NA 1 2 3 4 5 6 7
The design is pleasant to use
NA 1 2 3 4 5 6 7
CREDIBLE
The design is comprehensible
NA 1 2 3 4 5 6 7
The design is trustworthy
NA 1 2 3 4 5 6 7
The design is reliable NA 1 2 3 4 5 6 7
ACCESSIBLE
The design is simple to use
NA 1 2 3 4 5 6 7
The design is inviting NA 1 2 3 4 5 6 7
VALUABLE
The design is rewarding
NA 1 2 3 4 5 6 7
The design is impressive
NA 1 2 3 4 5 6 7
The design is innovative
NA 1 2 3 4 5 6 7
The design is good creativity
NA 1 2 3 4 5 6 7
Additional Comments/Notes

55
The development of this tool is designed to meet the goal outlined in this research and capture the designers‟
perceptions of how well the product meets sustainable design goals. The Sustainable Design Evaluation Tool is
fashioned after the evaluation tools developed by Meza (2008), so that the overall evaluation tool (integrated with
this Sustainable Design Evaluation Tool) has continuity. The Sustainable Design Evaluation Tool is divided into
three sections: social, environmental and economical. Each section addresses the questions previously stated in
the social sustainability, environmental sustainability, and economical sustainability in user-centered design
sections of this research.
Table 9: Sustainable Design Evaluation Tool
SUSTAINABLE DESIGN EVALUATION TOOL
Design Goals Requirement/Expectation
Not Applicable
Does Not
Meet
Barely Meets
Somewhat Meets
Meets Strongly Meets
Very Strongly Meets
Exceeds Design Comments/Recommendation
SOCIAL
The product supports Equal Opportunity use NA 1 2 3 4 5 6 7

56
SUSTAINABLE DESIGN EVALUATION TOOL
Design Goals Requirement/Expectation
Not Applicable
Does Not
Meet
Barely Meets
Somewhat Meets
Meets Strongly Meets
Very Strongly Meets
Exceeds Design Comments/Recommendation
The product design meets its goal for intended population NA 1 2 3 4 5 6 7
The product fosters an awareness of community NA 1 2 3 4 5 6 7
The product comes with sufficient information for the user to educate themselves with product use NA 1 2 3 4 5 6 7
ENVIRONMENTAL
The product is easy to disassemble NA 1 2 3 4 5 6 7
The product comes with sufficient information for recovery by OEM or third party NA 1 2 3 4 5 6 7
The product comes with minimal packaging NA 1 2 3 4 5 6 7
The product design allows for all or parts to be recycled NA 1 2 3 4 5 6 7
ECONOMICAL

57
SUSTAINABLE DESIGN EVALUATION TOOL
Design Goals Requirement/Expectation
Not Applicable
Does Not
Meet
Barely Meets
Somewhat Meets
Meets Strongly Meets
Very Strongly Meets
Exceeds Design Comments/Recommendation
The development of this product includes a risk management plan NA 1 2 3 4 5 6 7
The manufacture of this product takes into consideration stakeholder returns
NA 1 2 3 4 5 6 7
The manufacture of this product supports profitable growth NA 1 2 3 4 5 6 7
The product is innovative NA 1 2 3 4 5 6 7
Additional Comments/Notes

58
3.4 Data Collection
The User Centered Design Evaluation Tool developed by Meza, with the addition of the
Sustainable Design Evaluation Tool developed in this research, were administered to
participants for three types of products: residential flooring, medical device, and
electronic device. The data was collected on how well the products met the
expectations of the particular design area being assessed, in particular, cognitive
design, industrial design, physical design, user experience design, and sustainable
design. The reason for the addition of the Sustainable Design Evaluation Tool is to
evaluate if sustainability aspects are captured during the design process. The ultimate
goal is for engineers and designers to use the hybrid model prior to a performed
evaluation, so that the product would reflect exceeding expectations in the sustainability
areas of economics, environment, and social.
The three products evaluated are the following: Shaw© Living Carpet Tile (flooring),
OneTouch® Delica™ Lancing Device (medical device), and Garmin nüvi 1450T GPS
Navigator (electronic device). These products were selected for purposes of this
research to reflect objects that participants would be familiar, to highlight products in
different areas (electronic device, medical device, and flooring), as well as objects that
represent different levels of sustainability, from the viewpoint of the researcher.
Sustainability of the products prior to evaluation appear to be low (medical device),
medium (flooring), and high (electronic device). The scale rating used in the evaluation

59
tools (1 = “does not meet” to 7 = “exceeds”), are equivalent to the following values: low
= 1 or 2, medium = 3, 4 or 5, and high = 6 or 7.
Each product was evaluated using the User Centered Design Product Evaluation Tools
from Meza (2008), with the inclusion of the Sustainable Design Evaluation Tool,
developed with the information collected in the literature review. The purpose of the
Sustainable Design Evaluation Tool is to evaluate how products not previously designed
using the hybrid user-centered design model fit sustainable expectations. The
Sustainable Design Evaluation Tool adds the missing element to identify a product's
degree of sustainability.
Figures 10-12 show the three evaluated products. Figure 10 is an image of the carpet
tile produced by Shaw©. The intended use of the carpet is residential, with ease of
installation due to the adhesive backing. This product was selected due to its perceived
sustainability; traditional carpeting must be totally removed if worn or damaged, while
the carpet tile is able to removed by one square if necessary (medium sustainability).

60
Figure 10: Shaw© Living Carpet Tile, Golden Wheat, 12"x12"
Figure 11 is an image of the OneTouch® lancing device and packaging. The intended
use of the lancing device is to puncture the finger of persons with diabetes to draw
blood for blood sugar testing. The selection of this product was due to its perceived
sustainability; this product appears to have low sustainability, because due to its size,
users may easily lose or break the product, which results in high disposal.

61
Figure 11: Lancing Device Packaging and Device (product not shown to scale with packaging in photo)
Figure 12 is an image of the Garmin nüvi 1450T GPS Navigator and packaging. The
intended use of the product is a navigational tool to assist its user with directions,
whether in a vehicle or on foot. The tool is able to provide navigation for roads in the
United States and Canada. The selection of this product is due to its high perception of
sustainability. Due to the technology of the GPS, the maps are updated electronically;
therefore, the only reason to dispose of the product is damage or inability to charge.

62
Figure 12: GPS Navigator Packaging and Device (product not shown to scale with packaging in photo)
Ten participants from various backgrounds were selected to participate in the
evaluations. The participants were selected due to availability to complete the
evaluation. The majority of participants are students at the University of Central Florida,
with the exception of two. Half of the participants completed the evaluation in a research
office at the University of Central Florida and the other participants conducted the

63
evaluation in a residential setting. The environment for both groups was quiet with no
distractions.
Each participant was asked to take as much time as needed to become familiar with the
three products. Participants were able to read accompanying literature as well as test
the products and see how they worked. After the participants were familiar with the
products, instructions for the evaluation were delivered. Each participant was given
instruction to complete the evaluation to the best of their knowledge; participants were
delivered the evaluations in the same order for product and evaluation tool.
The product order was carpet tile, lancing device, and GPS navigator. The order used
for each participant in regards to the evaluation tools is as follows: cognitive design,
industrial design, physical design, industrial design, user experience design, and
sustainable design. The proctor timed each participant as they completed each
evaluation; participants rated each product based on how the product met expectations
of each design evaluation, on a scale from 1 to 7. Participants were also instructed to
place any comments in the comments/recommendations columns of each evaluation
tool. Table 10 gives details of the scale equivalencies for each evaluation tool.

64
Table 10: Scale used to rate product design
Product Requirements Expectation Scale
Requirement/Expectation Scale
Not Applicable NA
Does Not Meet 1
Barely Meets 2
Somewhat Meets 3
Meets 4
Strongly Meets 5
Very Strongly Meets 6
Exceeds 7

65
CHAPTER 4: RESULTS
This chapter discusses the research results of the user centered design evaluations,
using five evaluation tools (four tools developed by Meza and one tool developed in this
research) which revealed the following demographics for the ten participants: age, sex,
educational level and expertise in product design. Of the 10 participants, 60% were in
the 18-24 age groups, 20% were in the 25-31 age groups, 10% were in the 32-38 age
groups, and 10% were in the 39-45 age group. Figure 13 shows a chart of the
percentages of each age group. Additional demographics of the evaluation participants
include the percentage of each sex: 80% female, 20% male. The educational
background of the participants ranged from some high school to some graduate school.
The participants were also classified into two groups, novice and expert; novices were
classified as having no background in human factors and ergonomics and experts have
some background in human factors and ergonomics.

66
Figure 13: Range of ages of ten user-centered design evaluation participants
Tables 11-13 are the results for average time to complete the evaluations for each tool.
The tables follow the same format as Meza, in order make comparisons of results.
Meza‟s format to reflect time results were separated into three categories: novice
average, expert average, and overall average. The time averages were for each
evaluation tool. Meza used the following products in her research study: blood pressure
monitor, blender, learning toy, GPS system and chair. The products Meza used can be
separated into the following categories: medical device, electronics, and household
furniture. The rationale behind choosing the products in this research was to select
products that were similar to Meza‟s products.
60% 20%
10%
10%
Ages of User-Centered design Evaluation Participants
18-24 25-31 32-38 39-45

67
The participants were given the evaluations in order of product and evaluation tool.
Each participant evaluated the three products in the same order and each evaluation
was given in the same order to each participant. The order the products were evaluated
were carpet, lancing device, and GPS navigator. The order the evaluation tools were
delivered to the participants was cognitive design, industrial design, physical design,
user experience design, and sustainable design. One of the most notable results from
the evaluations is that as the participants became familiar with the tools, the time to
complete the evaluations decreased. This is similar to Meza's findings (2008), where
she stated that "the values decrease significantly for both novice and expert users as
the participant became familiar with using the evaluation tools.
Table 11: Time to Complete Evaluations: Product - Carpet
Evaluation Tool Novice Average (minutes) Expert Average (minutes) Overall Average (minutes)
Cognitive Design 4.321 3.330 4.026
Industrial Design 3.263 4.413 4.038
Physical Design 2.462 4.347 3.404
User Experience Design
1.550 1.423 1.262
Sustainable Design 1.191 1.333 1.262
The differences in time between novice and expert participants when evaluating the
carpet for cognitive, industrial, physical, user experience and sustainable design are
0.991, -1.150, -1.885, 0.127, and -0.142, respectively.

68
Table 12: Time to Complete Evaluations: Product - Lancing Device
Evaluation Tool Novice Average (minutes) Expert Average (minutes) Overall Average (minutes)
Cognitive Design 1.335 1.288 1.311
Industrial Design 2.114 2.190 2.152
Physical Design 2.273 2.189 2.231
User Experience Design
1.192 1.281 1.236
Sustainable Design 1.047 1.049 1.048
The differences in time between novice and expert participants when evaluating the
lancing device for cognitive, industrial, physical, user experience and sustainable design
are 0.047, -0.076, 0.084, -0.089, and -0.002, respectively.
Table 13: Time to Complete Evaluations: Product - GPS Navigator
Evaluation Tool Novice Average (minutes) Expert Average (minutes) Overall Average (minutes)
Cognitive Design 1.174 1.168 1.171
Industrial Design 2.173 2.474 2.323
Physical Design 1.478 2.150 2.014
User Experience Design
0.538 1.107 1.022
Sustainable Design 0.576 1.015 0.595
The differences in time between novice and expert participants when evaluating the
GPS Navigator for cognitive, industrial, physical, user experience and sustainable
design are 0.006, -0.301, -0.672, -0.569, and -0.439, respectively. Overall, average
completion times for all three products used in this research are shown in Table 14.

69
Table 14: Average completion time for all products
Evaluation Tool
Average Completion Time
Novice Average (minutes) Expert Average (minutes)
Cognitive Design 2.277 1.929
Industrial Design 2.517 3.026
Physical Design 2.071 2.895
User Experience Design 1.093 1.270
Sustainable Design 0.938 1.132
The differences in time between novice and expert for Meza‟s results are shown in
Table 15. According to her research, it appears that, in general, the novice evaluators
averaged more time in completing the evaluations than the expert evaluators.
Table 15: Time differences between Novice and Expert evaluators (Meza, 2008)
Evaluation Tool Product Novice Average
(minutes)
Expert Average
(minutes)
Difference (minutes)
Blood Pressure Monitor
Cognitive Design 3.013 2.097 0.916
Industrial Design 8.692 6.329 2.363
Physical Design 9.358 6.510 2.848
User Experience Design 5.271 2.097 3.174
Blender
Cognitive Design 1.913 1.487 0.426
Industrial Design 4.267 4.277 -0.010
Physical Design 4.842 4.777 0.065
User Experience Design 2.425 1.993 0.432
Learning Toy
Cognitive Design 1.688 1.317 0.371
Industrial Design 3.021 2.203 0.818
Physical Design 3.483 2.973 0.510
User Experience Design 1.850 1.863 -0.013

70
Evaluation Tool Product Novice Average
(minutes)
Expert Average
(minutes)
Difference (minutes)
GPS System
Cognitive Design 1.513 2.043 -0.530
Industrial Design 2.900 1.913 0.987
Physical Design 3.896 2.130 1.766
User Experience Design 1.829 1.263 0.566
Chair
Cognitive Design 0.929 0.960 -0.031
Industrial Design 1.742 1.730 0.012
Physical Design 3.650 1.667 1.983
User Experience Design 1.796 1.497 0.299
In Meza's research, she found that the physical design evaluation tool took the longest
to complete, with an average completion time of 9.358 minutes. On the contrary, in this
research, the evaluation tool that took the longest to complete was industrial design, for
both novices and experts. The differences in values between this research and Meza
may be due to the level of expertise of the participants. In general, the participants in
this study who had some level of expertise with user-centered design took longer to
perform the evaluations, as opposed to Meza‟s research where the novice evaluators,
on average had more completion times. Another difference to point out, the participants
in this study who were experts, were not designers with years of experience working in
their field as in Meza‟s research, but instead students with some knowledge of user-
centered design.

71
The evaluation tools used a scale from "1" to "7" to evaluate how the products met the
design goals; "1" equals "Does Not Meet" requirement/expectation and "7" equals
"Exceeds" requirement/expectation. The tables in sections 4.1 through 4.3 represent the
overall averages, expert averages, and novice averages based on the evaluation tool
scale for each product. Participants were also encouraged to provide any design
comments or recommendations in the side columns provided on each evaluation tool.
4.1 Carpet
Tables 16-20 represent the cognitive design, industrial design, physical design, user
experience design, and sustainable design averages from the evaluation tools for the
carpet sample. The carpet used in this research is most comparable to the chair used in
Meza‟s research. The justification for this rationale is they are both household (or
residential) products and exhibit high use.
Table 16: Results from Cognitive Design Evaluation Tool - Carpet
COGNITIVE DESIGN OVERALL AVERAGE EXPERT NOVICE
EASE OF USE
The design uses population
stereotypes that users can relate
3.3 4.4 2.2

72
COGNITIVE DESIGN OVERALL AVERAGE EXPERT NOVICE
Tasks/Procedures required are consistent
4 3.8 4.2
Tasks/Procedures required are
intuitive 2.9 2.8 3
New tasks/Procedures
required are easy to learn
3.7 3.8 3.6
Small amount of time required to
learn how to perform a task
4.4 4.8 4
Features are familiar
3.9 4.6 3.2
MEMORABILITY
Memorability – Maximum number of items a person
needs to remember is between 5-9
2.7 3.2 2.2
Sensory storage-encoding (visual,
auditory) 3.2 3.4 3
Coding – For high accuracy
identification the number of colors used on a display are 5. Red, yellow,
and green are reserved for
“danger”, “caution”, and
“safe”, respectively.
1 2 0
Working memory (short term –
capacity, duration: visual, phonetic,
semantic)
1.8 1.8 1.8
Long term memory – Steps and items
can be remembered easily after a long
2.2 1.4 3
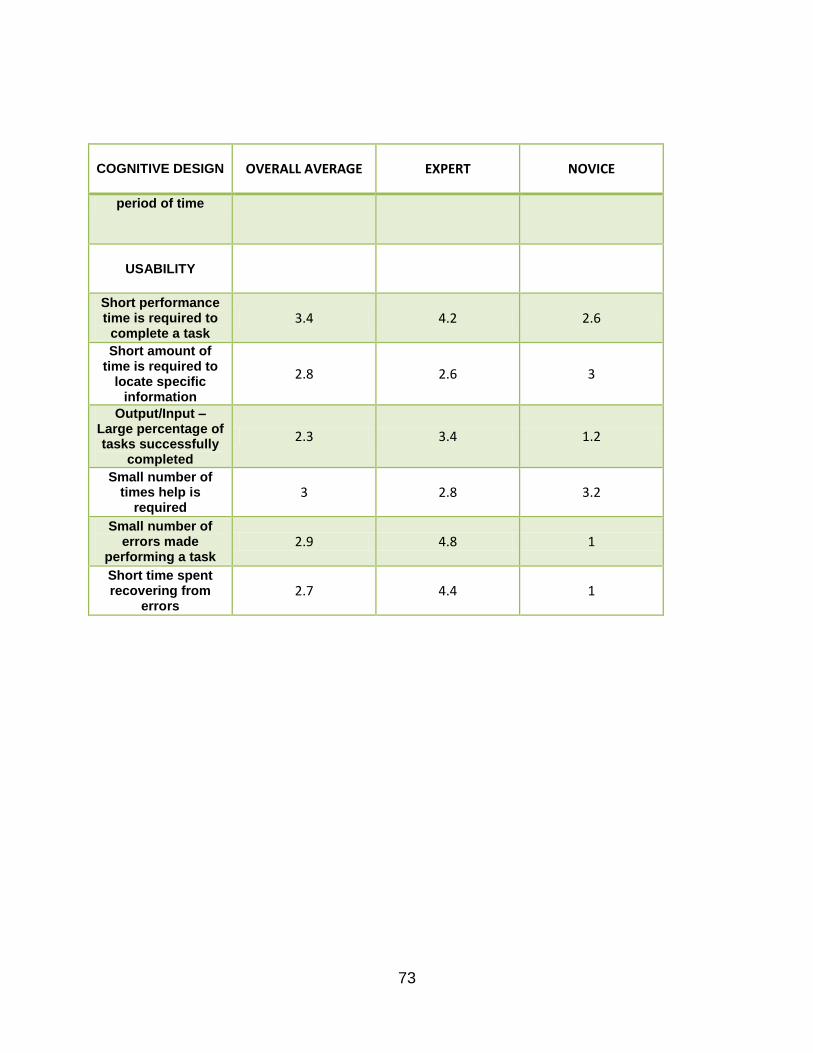
73
COGNITIVE DESIGN OVERALL AVERAGE EXPERT NOVICE
period of time
USABILITY
Short performance time is required to
complete a task 3.4 4.2 2.6
Short amount of time is required to
locate specific information
2.8 2.6 3
Output/Input – Large percentage of tasks successfully
completed
2.3 3.4 1.2
Small number of times help is
required 3 2.8 3.2
Small number of errors made
performing a task 2.9 4.8 1
Short time spent recovering from
errors 2.7 4.4 1

74
Table 17: Results from Industrial Design Evaluation Tool - Carpet
INDUSTRIAL DESIGN OVERALL AVERAGE EXPERT NOVICE
FORM
Color contrast ratio – Ration of object
luminance over the background luminance. Measured with Modular Transfer Function Area (MTFA). High contrast
must be 10 MTFA.
1.2 2.4 0
Appearance – Durable yet attractive finish
5 5 5
Font size – Observer’s visual angle should be
between 14-22 minutes of arc
0.5 0 1
Size of alert – Visual signals should subtend
at least 1 degree of visual angle
0.3 0 0.6
Contrast ratio – Visual signals are at least twice
as bright as other displays
0.8 1 0.6
Touchscreen sensor Size 19 mm square
0.3 0 0.6
Touchscreen size has a matrix of 5x6 or 6x7
0.1 0 0.2
Meets design requirements for the shape (length, width,
height)
3.4 4.8 2
Meets design requirements for the texture (coarse, fine,
even)
4.5 4.4 4.6
Design provides flexibility (design
allowances, tolerances, universal design considerations)
4.4 4 4.8

75
INDUSTRIAL DESIGN OVERALL AVERAGE EXPERT NOVICE
SOUND/NOISE LEVEL
Duration of signal sounds are appropriate
for receival and recognition
0 0 0
Maximum signal levels – Level of auditory signal is 30 dB above masking
threshold
0 0 0
Alarm signal minimum duration is 100ms
0 0 0
Pitch – The pitch of warming sounds is between 15-1000Hz
0 0 0
ILLUMINATION/LIGHTING
Adaptation 1.7 3.4 0
Limited exposure to extreme radiant energy
0.9 1.8 0
Limited exposure to extreme irradiance
0.5 1 0
Limited exposure to extreme glare
0.4 0.8 0
Limited exposure to extreme brightness
0.2 0.4 0
Limited exposure to extreme reflectance
0.4 0.8 0
Limited exposure to extreme energy
0.8 1.6 0
VIBRATION

76
INDUSTRIAL DESIGN OVERALL AVERAGE EXPERT NOVICE
Limited exposure to extreme vibration
frequency 1.7 2.6 0.8
Limited exposure to extreme vibration
intensity 1.3 1.8 0.8
Amplitude 0 0 0
Displacement 0.5 1 0
Limited exposure to impact forces
0.9 1 0.8
Velocity 0.3 0 0.6
Acceleration 0.3 0.6 0
TEMPERATURE
Limited exposure to extreme environmental
temperature 2.4 3.8 1
Limited exposure to extreme surface
temperature 2.6 3.4 1.8
FUNCTION
Features are consistent 5.4 5.4 5.4
Features are durable 4.9 5.2 4.6
Easy maintenance – Easy to clean
5.3 5.6 5
Features are precise 4.4 4.4 4.4

77
INDUSTRIAL DESIGN OVERALL AVERAGE EXPERT NOVICE
Features are comfortable 5 5.6 4.4
Features are predictable 5 5.4 4.6

78
Table 18: Results from Physical Design Evaluation Tool - Carpet
PHYSICAL DESIGN AVERAGE EXPERT NOVICE
ANTHROPOMETRY
The design accommodates the 95
th percentile male and the 5
th
percentile female of the population Body
Segment Length (Width,
Circumference)
1.2 2.4 0
The design accommodates the 95
th percentile male and the 5
th
percentile female of the population Body
Segment Mass (Volume, Weight,
Density)
1.2 2.4 0
The design accommodates the 95
th percentile male and the 5
th
percentile female of the population Body Segment Center of
Mass
0.6 1.2 0
The design accommodates the 95
th percentile male and the 5
th
percentile female of the population
Range of Motion
1.1 2.2 0
The design accommodates the 95
th percentile male and the 5
th
percentile female of the population
Strength Capabilities
1.6 3.2 0.8
The design accommodates the 95
th percentile male
0.6 1.2 0
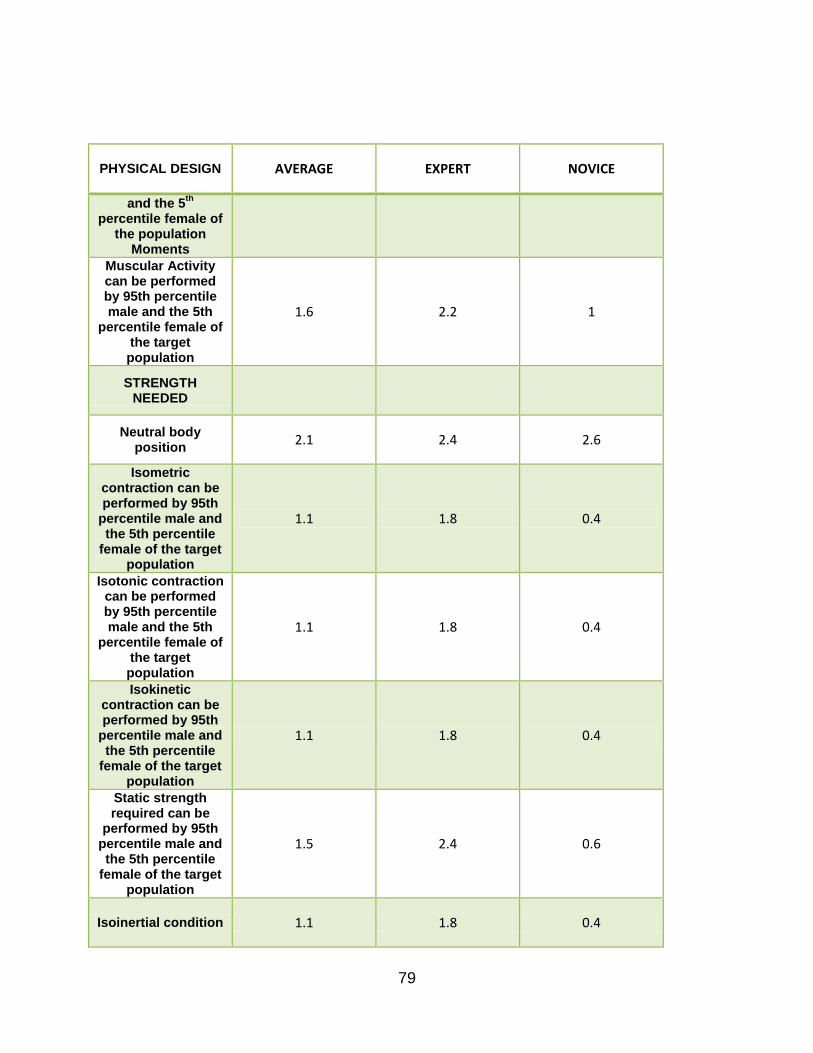
79
PHYSICAL DESIGN AVERAGE EXPERT NOVICE
and the 5th
percentile female of
the population Moments
Muscular Activity can be performed by 95th percentile male and the 5th
percentile female of the target population
1.6 2.2 1
STRENGTH NEEDED
Neutral body position
2.1 2.4 2.6
Isometric contraction can be performed by 95th
percentile male and the 5th percentile
female of the target population
1.1 1.8 0.4
Isotonic contraction can be performed by 95th percentile male and the 5th
percentile female of the target population
1.1 1.8 0.4
Isokinetic contraction can be performed by 95th
percentile male and the 5th percentile
female of the target population
1.1 1.8 0.4
Static strength required can be
performed by 95th percentile male and the 5th percentile
female of the target population
1.5 2.4 0.6
Isoinertial condition 1.1 1.8 0.4

80
PHYSICAL DESIGN AVERAGE EXPERT NOVICE
REPETITIVE MOTION
Moderate tendon motion
2.1 3.4 0.8
Moderate tendon sheaths motion
1.9 3 0.8
Moderate muscles motion
2.1 3.4 0.8
Moderate ligaments motion
2 3.2 0.8
Moderate joints motion
2.1 3.4 0.8
Moderate nerves motion
1.6 2.4 0.8
MUSCULAR ACTIVITY
Minimum static loading
1.8 2.8 0.8
Moderate endurance
requirement 1.9 2.8 1
Moderate repetition requirement
2.2 3 1.4
Moderate frequency requirement
2.4 4 1.6
BODY POSTURE
Neutral body plane 1.6 2.4 0.8
Neutral extension (No twisting
required while extending)
1.7 2.6 0.8
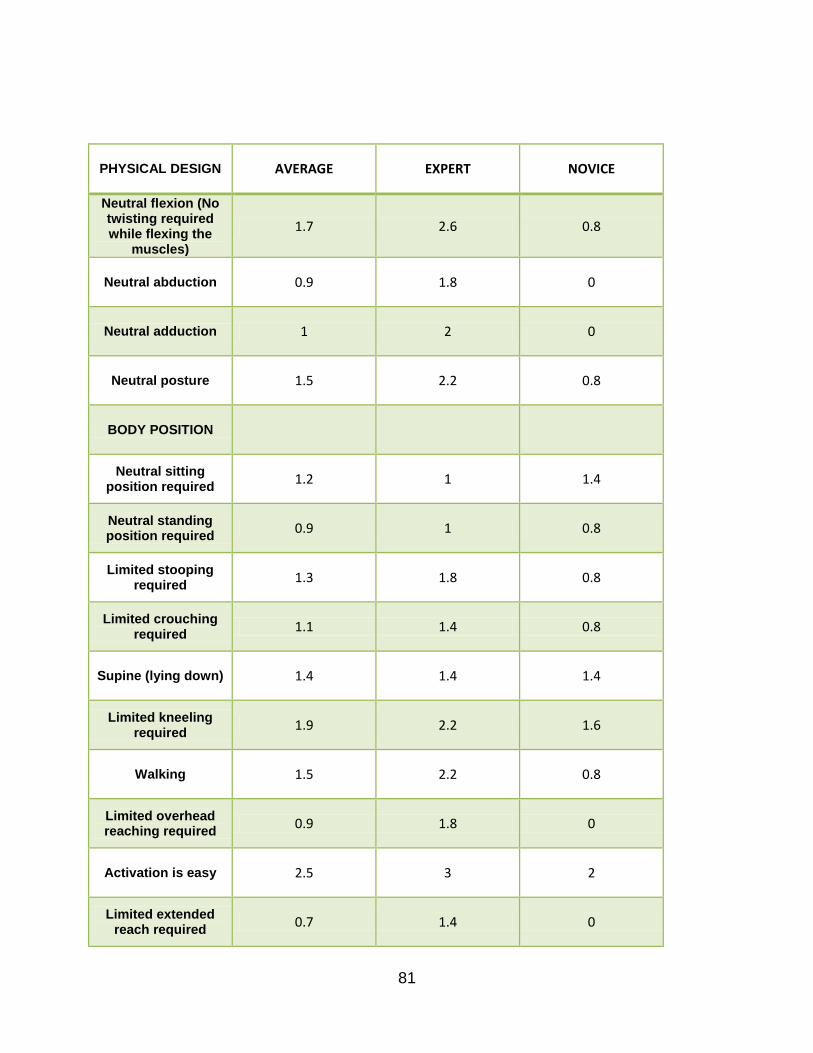
81
PHYSICAL DESIGN AVERAGE EXPERT NOVICE
Neutral flexion (No twisting required while flexing the
muscles)
1.7 2.6 0.8
Neutral abduction 0.9 1.8 0
Neutral adduction 1 2 0
Neutral posture 1.5 2.2 0.8
BODY POSITION
Neutral sitting position required
1.2 1 1.4
Neutral standing position required
0.9 1 0.8
Limited stooping required
1.3 1.8 0.8
Limited crouching required
1.1 1.4 0.8
Supine (lying down) 1.4 1.4 1.4
Limited kneeling required
1.9 2.2 1.6
Walking 1.5 2.2 0.8
Limited overhead reaching required
0.9 1.8 0
Activation is easy 2.5 3 2
Limited extended reach required
0.7 1.4 0

82
PHYSICAL DESIGN AVERAGE EXPERT NOVICE
Signal levels – Signal levels are 15-
16 dB above masking threshold for rapid response
to a signal
0 0 0
Location of alert – 15 degrees of
maximum deviation for high priority
alerts and 30 degrees for low priority alerts
0.4 0.8 0

83
Table 19: Results from User Experience Design Evaluation Tool - Carpet
USER EXPERIENCE DESIGN
OVERALL AVERAGE EXPERT NOVICE
EASE OF USE
The design is helpful 5.1 4.8 5.4
The design is supporting
4.2 4.2 4.2
USABLE
The design is enjoyable to use
5 4.2 5.8
The design is handy to use
5.4 5 5.8
The design is practical
5.5 5.2 5.8
The design is convenient
5.2 4.6 5.8
The design provides control
4.7 5.2 4.2
FINDABLE
The design is predictable
5.7 5.6 5.8
The design is clear to use
5.7 5.8 5.6
The design is familiar
5.3 5 5.6
DESIRABLE

84
USER EXPERIENCE DESIGN
OVERALL AVERAGE EXPERT NOVICE
The design is emotionally
fulfilling 3.6 3.6 3.6
The design is satisfying
3.8 4.8 2.8
The design is motivating
3 3.4 2.6
The design is aesthetically
pleasing 3.8 5 2.6
The design is entertaining to use
3.4 2.8 4
The design is interesting to use
4.3 4 4.6
The design is exciting to use
3.7 3.8 3.6
The design is attractive
4.3 4.8 3.8
The design is pleasant to use
4.7 4.6 4.8
CREDIBLE
The design is comprehensible
4.3 5 3.6
The design is trustworthy
3.7 4.4 3
The design is reliable
4.5 4.4 4.6
ACCESSIBLE
The design is simple to use
5.5 5.4 5.6

85
USER EXPERIENCE DESIGN
OVERALL AVERAGE EXPERT NOVICE
The design is inviting
4 4.6 3.4
VALUABLE
The design is rewarding
3.3 4 2.6
The design is impressive
4.6 5 4.2
The design is innovative
4.8 5 4.6
The design is good creativity
4.9 5 4.8

86
Table 20: Results from Sustainable Design Evaluation Tool - Carpet
SUSTAINABLE DESIGN
OVERALL AVERAGE EXPERT NOVICE
SOCIAL
The product supports Equal Opportunity use
4.9 4.6 5.2
The product design meets its goal for
intended population 5.5 5.6 5.4
The product fosters an awareness of
community 2 3.8 0.2
The product comes with sufficient
information for the user to educate themselves with
product use
4.4 4.6 4.2
ENVIRONMENTAL
The product is easy to disassemble
4.2 5 3.4
The product comes with sufficient information for
recovery by OEM or third party
2.2 3 1.4
The product comes with minimal
packaging 3.6 4.8 2.4
The product design allows for all or
parts to be recycled 3 3 3
ECONOMICAL
The development of this product
includes a risk management plan
1.2 1.6 0.8
The manufacture of this product takes into consideration
1.7 2.2 1.2

87
SUSTAINABLE DESIGN
OVERALL AVERAGE EXPERT NOVICE
stakeholder returns
The manufacture of this product
supports profitable growth
2.6 2.4 2.8
The product is innovative
3.5 4.2 2.8
4.2 Lancing Device
Tables 21-25 represent the cognitive design, industrial design, physical design, user
experience design, and sustainable design averages from the evaluation tools for the
lancing device. The lancing device used in this research is most comparable to the
blood pressure monitor used in Meza‟s research. The justification for this rationale is
they are both medical devices used to gather information about the user.

88
Table 21: Results from Cognitive Design Evaluation Tool - Lancing Device
COGNITIVE DESIGN OVERALL AVERAGE EXPERT NOVICE
EASE OF USE
The design uses population
stereotypes that users can relate
3.9 4.2 3.6
Tasks/Procedures required are consistent
5 5.2 4.8
Tasks/Procedures required are
intuitive 3.3 3.8 2.8
New tasks/Procedures
required are easy to learn
4.4 4 4.8
Small amount of time required to
learn how to perform a task
4.9 5 4.8
Features are familiar
4.2 3.8 4.6
MEMORABILITY
Memorability – Maximum number of items a person
needs to remember is between 5-9
4.2 4.4 4
Sensory storage-encoding (visual,
auditory) 2.9 3.4 2.4
Coding – For high accuracy
identification the number of colors used on a display are 5. Red, yellow,
and green are reserved for
“danger”, “caution”, and
“safe”, respectively.
1.2 1.6 0.8

89
COGNITIVE DESIGN OVERALL AVERAGE EXPERT NOVICE
Working memory (short term –
capacity, duration: visual, phonetic,
semantic)
3.6 3.8 3.4
Long term memory – Steps and items
can be remembered easily after a long
period of time
3.9 4 3.8
USABILITY
Short performance time is required to
complete a task 5 5.6 4.4
Short amount of time is required to
locate specific information
4.8 5.2 4.4
Output/Input – Large percentage of tasks successfully
completed
5 5.6 4.4
Small number of times help is
required 5 5.6 4.4
Small number of errors made
performing a task 4.5 4.8 4.2
Short time spent recovering from
errors 4.1 3.8 4.4

90
Table 22: Results from Industrial Design Evaluation Tool - Lancing Device
INDUSTRIAL DESIGN OVERALL AVERAGE EXPERT NOVICE
FORM
Color contrast ratio – Ration of object
luminance over the background luminance. Measured with Modular Transfer Function Area (MTFA). High contrast
must be 10 MTFA.
1.8 3 0.6
Appearance – Durable yet attractive finish
4.9 5.4 4.4
Font size – Observer’s visual angle should be
between 14-22 minutes of arc
3 4.4 1.6
Size of alert – Visual signals should subtend
at least 1 degree of visual angle
1.3 2 0.6
Contrast ratio – Visual signals are at least twice
as bright as other displays
1.5 2.4 0.6
Touchscreen sensor Size 19 mm square
0.2 0 0.4
Touchscreen size has a matrix of 5x6 or 6x7
0.1 0 0.2
Meets design requirements for the shape (length, width,
height)
4.6 5 4.2
Meets design requirements for the texture (coarse, fine,
even)
3.7 4 3.4
Design provides flexibility (design
allowances, tolerances, universal design considerations)
3 2.8 3.2

91
INDUSTRIAL DESIGN OVERALL AVERAGE EXPERT NOVICE
SOUND/NOISE LEVEL
Duration of signal sounds are appropriate
for receival and recognition
1.8 2 1.6
Maximum signal levels – Level of auditory signal is 30 dB above masking
threshold
0 0 0
Alarm signal minimum duration is 100ms
0 0 0
Pitch – The pitch of warming sounds is between 15-1000Hz
0 0 0
ILLUMINATION/LIGHTING
Adaptation 0.6 1.2 0
Limited exposure to extreme radiant energy
0 0 0
Limited exposure to extreme irradiance
0 0 0
Limited exposure to extreme glare
0 0 0
Limited exposure to extreme brightness
0 0 0
Limited exposure to extreme reflectance
0 0 0
Limited exposure to extreme energy
0 0 0
VIBRATION

92
INDUSTRIAL DESIGN OVERALL AVERAGE EXPERT NOVICE
Limited exposure to extreme vibration
frequency 2 3.2 0.8
Limited exposure to extreme vibration
intensity 2 3.2 0.8
Amplitude 1.4 2.8 0
Displacement 1.5 3 0
Limited exposure to impact forces
1.7 2.8 0.6
Velocity 1.3 2.6 0
Acceleration 1.3 2.6 0
TEMPERATURE
Limited exposure to extreme environmental
temperature 1.6 2.2 1
Limited exposure to extreme surface
temperature 1.6 2.2 1
FUNCTION
Features are consistent 4.6 5.4 3.8
Features are durable 4.4 5 3.8
Easy maintenance – Easy to clean
5 4.6 5.4
Features are precise 5.4 5.2 5.6

93
INDUSTRIAL DESIGN OVERALL AVERAGE EXPERT NOVICE
Features are comfortable 5.2 4.8 5.6
Features are predictable 5.3 5 5.6
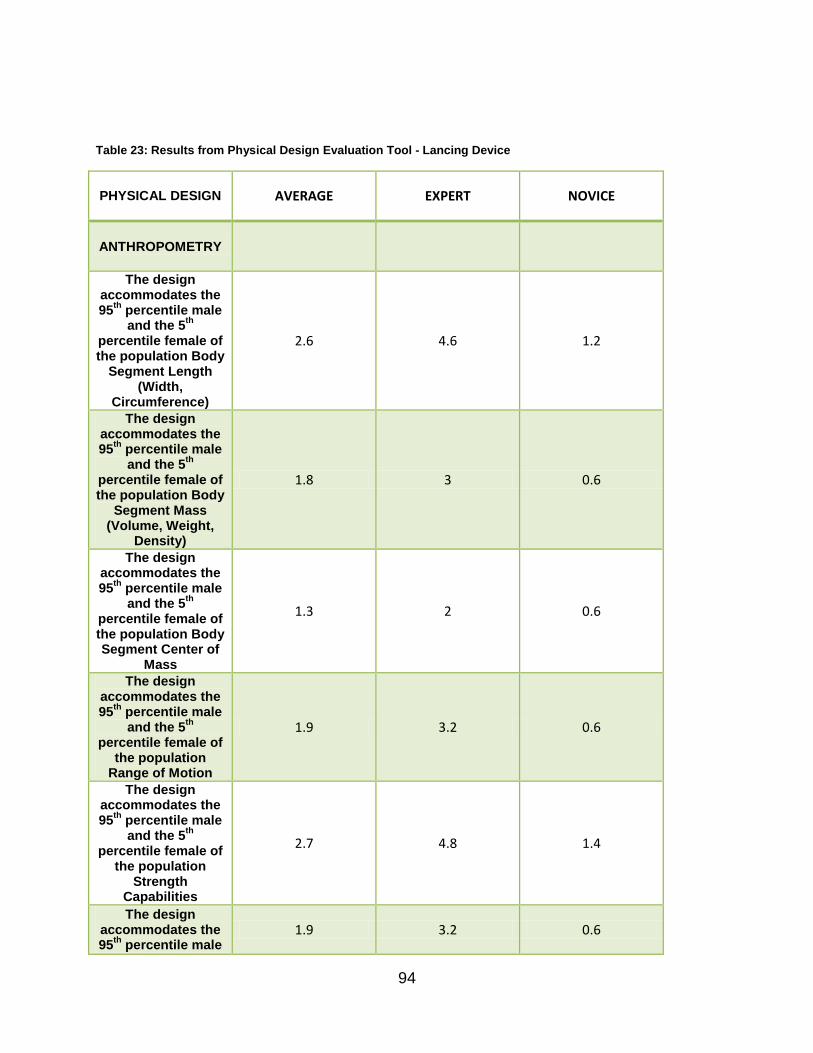
94
Table 23: Results from Physical Design Evaluation Tool - Lancing Device
PHYSICAL DESIGN AVERAGE EXPERT NOVICE
ANTHROPOMETRY
The design accommodates the 95
th percentile male and the 5
th
percentile female of the population Body
Segment Length (Width,
Circumference)
2.6 4.6 1.2
The design accommodates the 95
th percentile male and the 5
th
percentile female of the population Body
Segment Mass (Volume, Weight,
Density)
1.8 3 0.6
The design accommodates the 95
th percentile male and the 5
th
percentile female of the population Body Segment Center of
Mass
1.3 2 0.6
The design accommodates the 95
th percentile male and the 5
th
percentile female of the population
Range of Motion
1.9 3.2 0.6
The design accommodates the 95
th percentile male and the 5
th
percentile female of the population
Strength Capabilities
2.7 4.8 1.4
The design accommodates the 95
th percentile male
1.9 3.2 0.6

95
PHYSICAL DESIGN AVERAGE EXPERT NOVICE
and the 5th
percentile female of
the population Moments
Muscular Activity can be performed by 95th percentile male and the 5th
percentile female of the target population
2.5 5 0.8
STRENGTH NEEDED
Neutral body position
2.8 4.8 1.6
Isometric contraction can be performed by 95th
percentile male and the 5th percentile
female of the target population
2.2 3.6 1.6
Isotonic contraction can be performed by 95th percentile male and the 5th
percentile female of the target population
2.2 3.6 1.6
Isokinetic contraction can be performed by 95th
percentile male and the 5th percentile
female of the target population
2.2 3.6 1.6
Static strength required can be
performed by 95th percentile male and the 5th percentile
female of the target population
2.8 4.8 1.6
Isoinertial condition 1.8 2.8 0.8
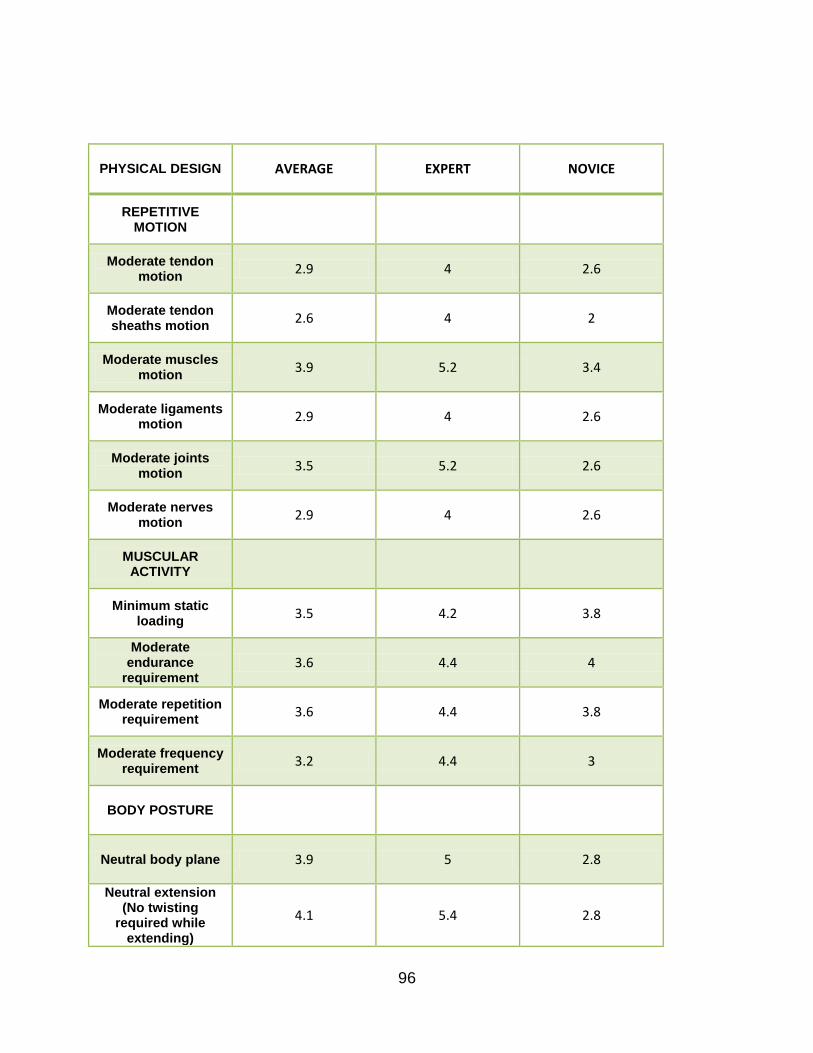
96
PHYSICAL DESIGN AVERAGE EXPERT NOVICE
REPETITIVE MOTION
Moderate tendon motion
2.9 4 2.6
Moderate tendon sheaths motion
2.6 4 2
Moderate muscles motion
3.9 5.2 3.4
Moderate ligaments motion
2.9 4 2.6
Moderate joints motion
3.5 5.2 2.6
Moderate nerves motion
2.9 4 2.6
MUSCULAR ACTIVITY
Minimum static loading
3.5 4.2 3.8
Moderate endurance
requirement 3.6 4.4 4
Moderate repetition requirement
3.6 4.4 3.8
Moderate frequency requirement
3.2 4.4 3
BODY POSTURE
Neutral body plane 3.9 5 2.8
Neutral extension (No twisting
required while extending)
4.1 5.4 2.8

97
PHYSICAL DESIGN AVERAGE EXPERT NOVICE
Neutral flexion (No twisting required while flexing the
muscles)
4.1 5.4 2.8
Neutral abduction 3.6 4.4 2.8
Neutral adduction 3.3 4.2 2.4
Neutral posture 4.1 5.4 2.8
BODY POSITION
Neutral sitting position required
2.4 3 1.8
Neutral standing position required
2.2 1.8 2.6
Limited stooping required
1.8 2.4 1.2
Limited crouching required
1.8 2.4 1.2
Supine (lying down) 1.2 1.2 1.2
Limited kneeling required
2.1 2.4 1.8
Walking 1.2 1.2 1.2
Limited overhead reaching required
1.9 2.6 1.2
Activation is easy 3.5 4.2 2.8
Limited extended reach required
1.1 2.2 0

98
PHYSICAL DESIGN AVERAGE EXPERT NOVICE
Signal levels – Signal levels are 15-
16 dB above masking threshold for rapid response
to a signal
0 0 0
Location of alert – 15 degrees of
maximum deviation for high priority
alerts and 30 degrees for low priority alerts
0 0 0

99
Table 24: Results from User Experience Design Evaluation Tool - Lancing Device
USER EXPERIENCE DESIGN
OVERALL AVERAGE EXPERT NOVICE
EASE OF USE
The design is helpful 5.1 5.2 5
The design is supporting
5.1 5.2 5
USABLE
The design is enjoyable to use
3.9 4.4 3.4
The design is handy to use
5.4 5.6 5.2
The design is practical
5.6 5.8 5.4
The design is convenient
5.5 5.6 5.4
The design provides control
5.5 5.6 5.4
FINDABLE
The design is predictable
5.1 5 5.2
The design is clear to use
5 4.6 5.4
The design is familiar
5.1 4.8 5.4

100
USER EXPERIENCE DESIGN
OVERALL AVERAGE EXPERT NOVICE
DESIRABLE
The design is emotionally
fulfilling 3.2 3.2 3.2
The design is satisfying
4.1 4.4 3.8
The design is motivating
2.9 3.2 2.6
The design is aesthetically
pleasing 2.7 3.6 1.8
The design is entertaining to use
2 1.6 2.4
The design is interesting to use
4.2 4.2 4.2
The design is exciting to use
2 1.8 2.2
The design is attractive
3.5 3.6 3.4
The design is pleasant to use
3 3.6 2.4
CREDIBLE
The design is comprehensible
3.8 4 3.6
The design is trustworthy
4.2 4.2 4.2
The design is reliable
4.1 4.4 3.8
ACCESSIBLE

101
USER EXPERIENCE DESIGN
OVERALL AVERAGE EXPERT NOVICE
The design is simple to use
5.2 5 5.4
The design is inviting
3 3.6 2.4
VALUABLE
The design is rewarding
3.6 3.6 3.6
The design is impressive
3.4 3.6 3.2
The design is innovative
4.3 4 4.6
The design is good creativity
4.1 3.4 4.8

102
Table 25: Results from Sustainable Design Evaluation Tool - Lancing Device
SUSTAINABLE DESIGN
OVERALL AVERAGE EXPERT NOVICE
SOCIAL
The product supports Equal Opportunity use
4.2 4.6 3.8
The product design meets its goal for
intended population 4.9 5.8 4
The product fosters an awareness of
community 3.3 3.4 3.2
The product comes with sufficient
information for the user to educate themselves with
product use
5.4 5.6 5.2
ENVIRONMENTAL
The product is easy to disassemble
3.1 2.8 3.4
The product comes with sufficient information for
recovery by OEM or third party
1.7 2 1.4
The product comes with minimal
packaging 4.8 4.8 4.8
The product design allows for all or
parts to be recycled 3.4 3.6 3.2
ECONOMICAL
The development of this product
includes a risk management plan
1.5 1.4 1.6
The manufacture of this product takes into consideration
2 2.8 1.2

103
SUSTAINABLE DESIGN
OVERALL AVERAGE EXPERT NOVICE
stakeholder returns
The manufacture of this product
supports profitable growth
2.2 2.4 2
The product is innovative
4 3.4 4.6
4.3 GPS Navigator
The GPS Navigator used in this research is most comparable to the GPS System used
in Meza‟s research. Although not identical products, these products are the most similar
of all the products evaluated in Meza‟s and this research; thus, allowing direct
comparisons. Table 26 shows the differences in average times of evaluators in Meza‟s
research and this research.

104
Table 26: Comparisons of average time, Meza vs. Brown research
GPS System (Meza) GPS Navigator (Brown)
Assessment Tool Novice Average
(minutes)
Expert Average
(minutes)
Overall Average
(minutes)
Novice Average
(minutes)
Expert Average
(Minutes)
Overall Average
(minutes)
Cognitive Design 1.513 2.043 1.838 1.174 1.168 1.171
Industrial Design 2.900 1.913 2.475 2.173 2.474 2.323
Physical Design 3.896 2.130 3.096 1.478 2.150 2.014
User Experience Design 1.829 1.263 1.544 0.538 1.107 1.022
Sustainable Design N/A N/A N/A 0.576 1.015 0.595
Tables 27-31 represent the cognitive design, industrial design, physical design, user
experience design, and sustainable design averages from the evaluation tools for the
GPS Navigator.

105
Table 27: Results from Cognitive Design Evaluation Tool - GPS Navigator
COGNITIVE DESIGN OVERALL AVERAGE EXPERT NOVICE
EASE OF USE
The design uses population
stereotypes that users can relate
3.9 5 2.8
Tasks/Procedures required are consistent
4.3 5 3.6
Tasks/Procedures required are
intuitive 3.5 4.6 2.4
New tasks/Procedures
required are easy to learn
4.8 4.8 4.8
Small amount of time required to
learn how to perform a task
4.4 4.6 4.2
Features are familiar
4.7 4.8 4.6
MEMORABILITY
Memorability – Maximum number of items a person
needs to remember is between 5-9
3.4 3 3.8
Sensory storage-encoding (visual,
auditory) 3.7 3.8 3.6
Coding – For high accuracy
identification the number of colors used on a display are 5. Red, yellow,
and green are reserved for
“danger”, “caution”, and
“safe”, respectively.
2.4 3.4 1.4

106
COGNITIVE DESIGN OVERALL AVERAGE EXPERT NOVICE
Working memory (short term –
capacity, duration: visual, phonetic,
semantic)
4.1 4.6 3.6
Long term memory – Steps and items
can be remembered easily after a long
period of time
4.1 4.6 3.6
USABILITY
Short performance time is required to
complete a task 4.3 4 4.6
Short amount of time is required to
locate specific information
4.4 4.2 4.6
Output/Input – Large percentage of tasks successfully
completed
4.3 4.6 4
Small number of times help is
required 4.1 4.4 3.8
Small number of errors made
performing a task 3.1 3.2 3
Short time spent recovering from
errors 3.5 3.8 3.2

107
Table 28: Results from Industrial Design Evaluation Tool - GPS Navigator
INDUSTRIAL DESIGN OVERALL AVERAGE EXPERT NOVICE
FORM
Color contrast ratio – Ration of object
luminance over the background luminance. Measured with Modular Transfer Function Area (MTFA). High contrast
must be 10 MTFA.
2.8 4.4 1.2
Appearance – Durable yet attractive finish
5.3 5.2 5.4
Font size – Observer’s visual angle should be
between 14-22 minutes of arc
4.2 5 3.4
Size of alert – Visual signals should subtend
at least 1 degree of visual angle
2.3 2.4 2.2
Contrast ratio – Visual signals are at least twice
as bright as other displays
3.9 4.6 3.2
Touchscreen sensor Size 19 mm square
4.5 4.6 4.4
Touchscreen size has a matrix of 5x6 or 6x7
4.7 5 4.4
Meets design requirements for the shape (length, width,
height)
4.7 5 4.4
Meets design requirements for the texture (coarse, fine,
even)
4.4 5 3.8
Design provides flexibility (design
allowances, tolerances, universal design considerations)
3.9 4 3.8

108
INDUSTRIAL DESIGN OVERALL AVERAGE EXPERT NOVICE
SOUND/NOISE LEVEL
Duration of signal sounds are appropriate
for receival and recognition
4.8 5.2 4.4
Maximum signal levels – Level of auditory signal is 30 dB above masking
threshold
2.9 2.6 3.2
Alarm signal minimum duration is 100ms
0.9 0.4 1.4
Pitch – The pitch of warming sounds is between 15-1000Hz
1.4 1.6 1.2
ILLUMINATION/LIGHTING
Adaptation 3.4 4.4 2.4
Limited exposure to extreme radiant energy
2.4 2.4 2.4
Limited exposure to extreme irradiance
2.4 2.4 2.4
Limited exposure to extreme glare
2.8 2.4 3.2
Limited exposure to extreme brightness
2.8 3.2 2.4
Limited exposure to extreme reflectance
3.2 3.2 3.2
Limited exposure to extreme energy
2.4 2.4 2.4
VIBRATION
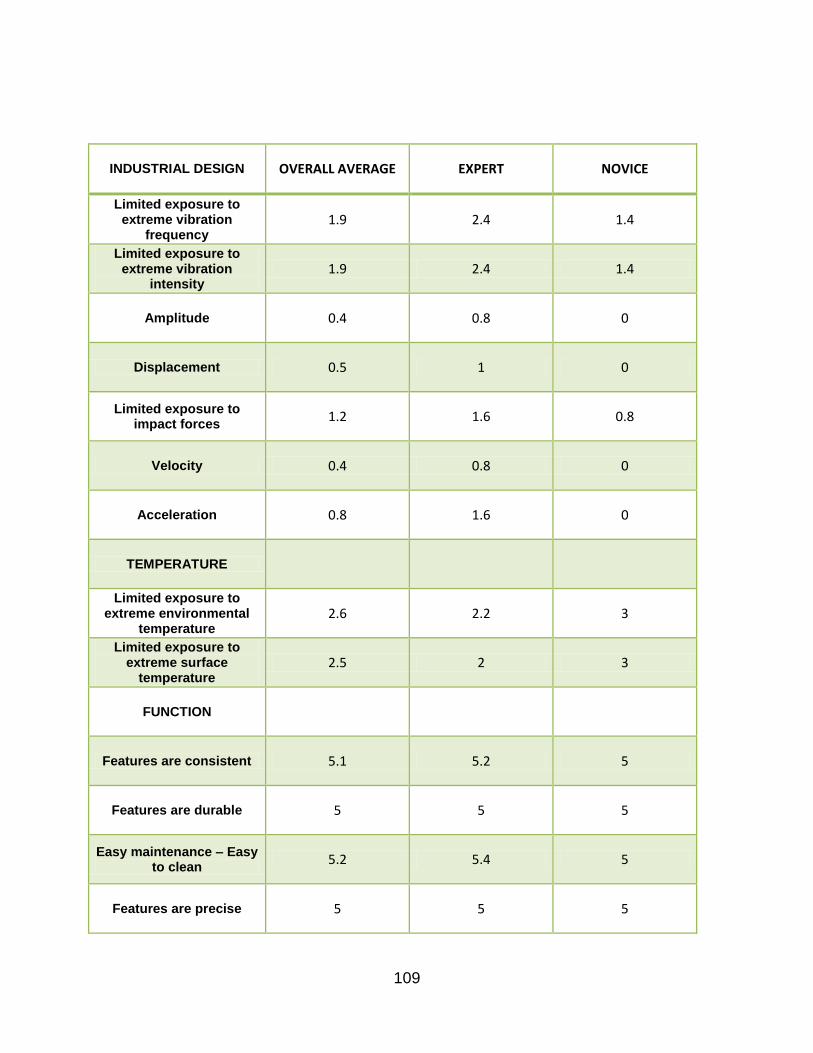
109
INDUSTRIAL DESIGN OVERALL AVERAGE EXPERT NOVICE
Limited exposure to extreme vibration
frequency 1.9 2.4 1.4
Limited exposure to extreme vibration
intensity 1.9 2.4 1.4
Amplitude 0.4 0.8 0
Displacement 0.5 1 0
Limited exposure to impact forces
1.2 1.6 0.8
Velocity 0.4 0.8 0
Acceleration 0.8 1.6 0
TEMPERATURE
Limited exposure to extreme environmental
temperature 2.6 2.2 3
Limited exposure to extreme surface
temperature 2.5 2 3
FUNCTION
Features are consistent 5.1 5.2 5
Features are durable 5 5 5
Easy maintenance – Easy to clean
5.2 5.4 5
Features are precise 5 5 5
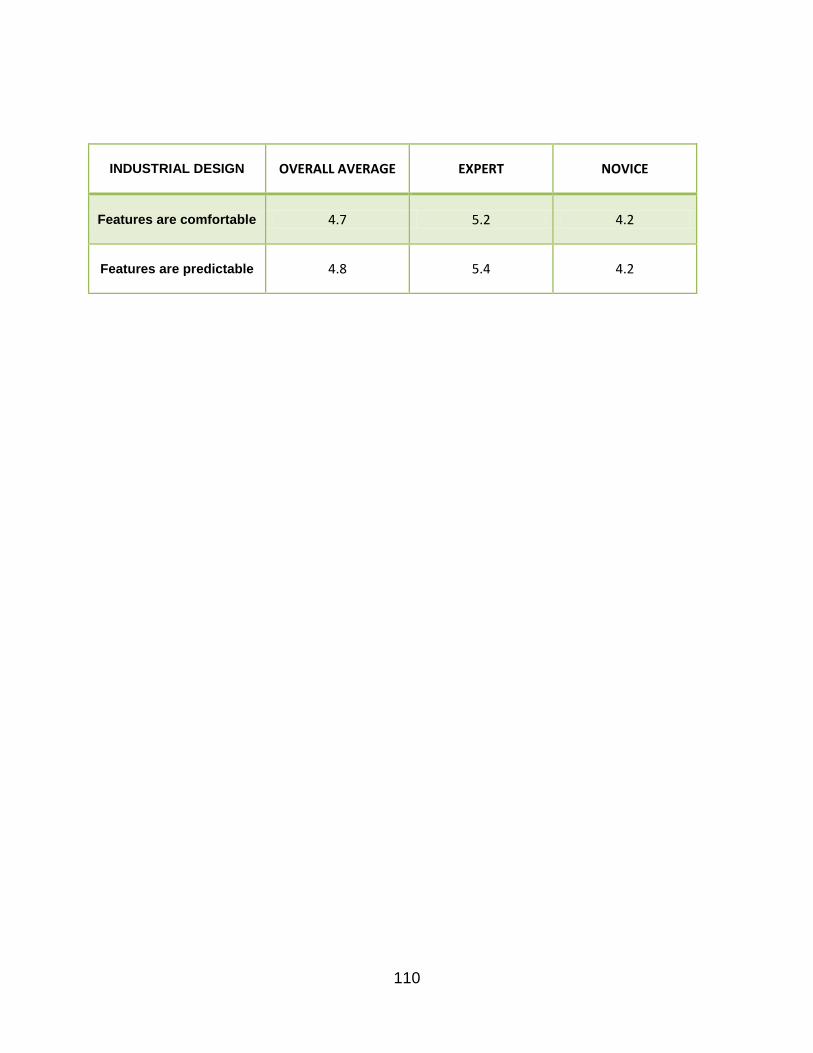
110
INDUSTRIAL DESIGN OVERALL AVERAGE EXPERT NOVICE
Features are comfortable 4.7 5.2 4.2
Features are predictable 4.8 5.4 4.2

111
Table 29: Results from Physical Design Evaluation Tool - GPS Navigator
PHYSICAL DESIGN AVERAGE EXPERT NOVICE
ANTHROPOMETRY
The design accommodates the 95
th percentile male and the 5
th
percentile female of the population Body
Segment Length (Width,
Circumference)
1.9 3.2 0.6
The design accommodates the 95
th percentile male and the 5
th
percentile female of the population Body
Segment Mass (Volume, Weight,
Density)
2 3.4 0.6
The design accommodates the 95
th percentile male and the 5
th
percentile female of the population Body Segment Center of
Mass
1.3 2 0.6
The design accommodates the 95
th percentile male and the 5
th
percentile female of the population
Range of Motion
2.7 4.8 1.4
The design accommodates the 95
th percentile male and the 5
th
percentile female of the population
Strength Capabilities
2.3 4 1.4
The design accommodates the 95
th percentile male
1.9 3.2 0.6

112
PHYSICAL DESIGN AVERAGE EXPERT NOVICE
and the 5th
percentile female of
the population Moments
Muscular Activity can be performed by 95th percentile male and the 5th
percentile female of the target population
2.7 4.8 1.4
STRENGTH NEEDED
Neutral body position
3.2 4.6 2.6
Isometric contraction can be performed by 95th
percentile male and the 5th percentile
female of the target population
2.1 3.6 1.6
Isotonic contraction can be performed by 95th percentile male and the 5th
percentile female of the target population
2.1 3.6 1.6
Isokinetic contraction can be performed by 95th
percentile male and the 5th percentile
female of the target population
2.1 3.6 1.6
Static strength required can be
performed by 95th percentile male and the 5th percentile
female of the target population
2.2 3.8 1.6
Isoinertial condition 2.3 3.6 2

113
PHYSICAL DESIGN AVERAGE EXPERT NOVICE
REPETITIVE MOTION
Moderate tendon motion
3.4 4.4 3.2
Moderate tendon sheaths motion
2.8 3.8 2.6
Moderate muscles motion
3.5 3.8 4
Moderate ligaments motion
3.1 3.8 3.2
Moderate joints motion
3.3 4.2 3.2
Moderate nerves motion
3.2 3.8 3.4
MUSCULAR ACTIVITY
Minimum static loading
3.3 5 2.4
Moderate endurance
requirement 4.1 5 4
Moderate repetition requirement
3.2 4 3.2
Moderate frequency requirement
3 3.6 3.2
BODY POSTURE
Neutral body plane 3.1 5 2.2
Neutral extension (No twisting
required while extending)
3.7 4 2.8
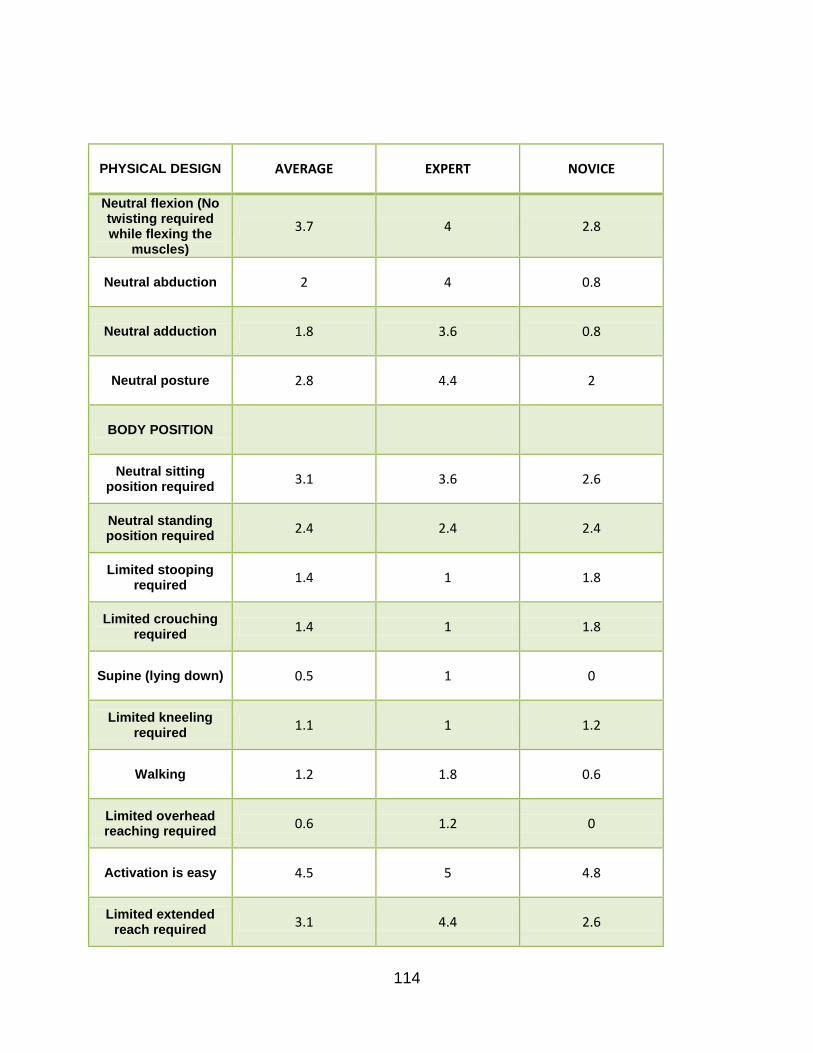
114
PHYSICAL DESIGN AVERAGE EXPERT NOVICE
Neutral flexion (No twisting required while flexing the
muscles)
3.7 4 2.8
Neutral abduction 2 4 0.8
Neutral adduction 1.8 3.6 0.8
Neutral posture 2.8 4.4 2
BODY POSITION
Neutral sitting position required
3.1 3.6 2.6
Neutral standing position required
2.4 2.4 2.4
Limited stooping required
1.4 1 1.8
Limited crouching required
1.4 1 1.8
Supine (lying down) 0.5 1 0
Limited kneeling required
1.1 1 1.2
Walking 1.2 1.8 0.6
Limited overhead reaching required
0.6 1.2 0
Activation is easy 4.5 5 4.8
Limited extended reach required
3.1 4.4 2.6
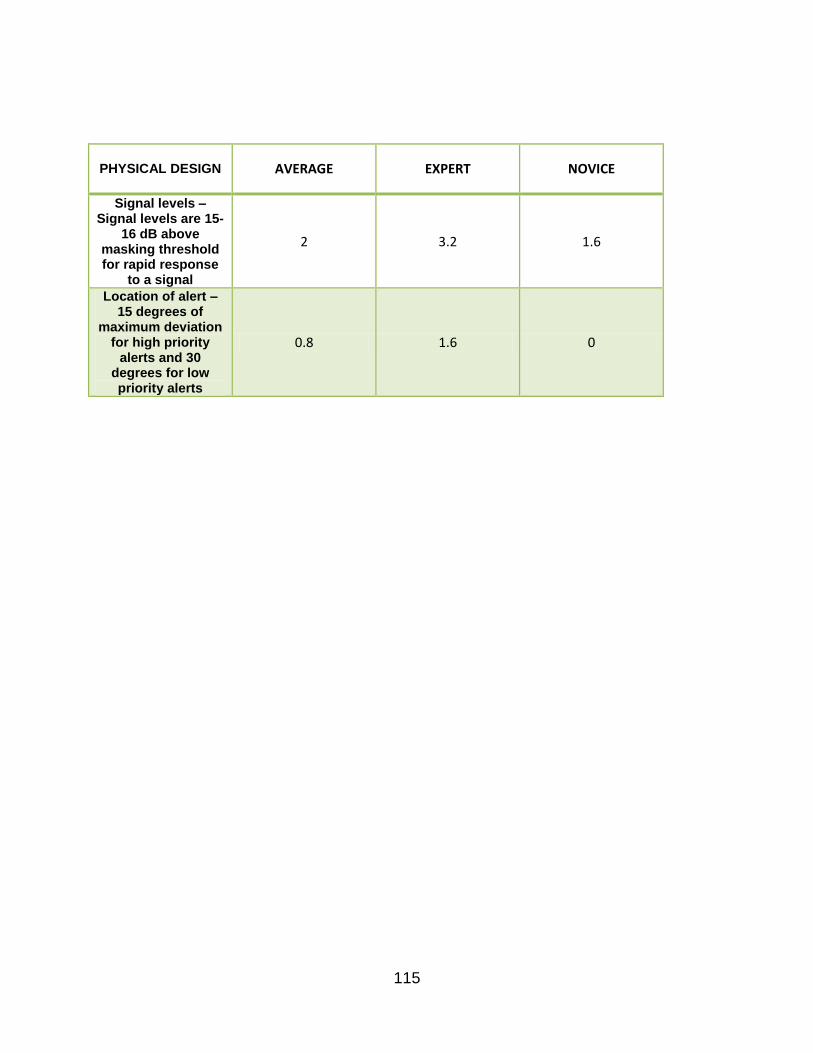
115
PHYSICAL DESIGN AVERAGE EXPERT NOVICE
Signal levels – Signal levels are 15-
16 dB above masking threshold for rapid response
to a signal
2 3.2 1.6
Location of alert – 15 degrees of
maximum deviation for high priority
alerts and 30 degrees for low priority alerts
0.8 1.6 0

116
Table 30: Results from User Experience Design Evaluation Tool - GPS Navigator
USER EXPERIENCE DESIGN
OVERALL AVERAGE EXPERT NOVICE
EASE OF USE
The design is helpful 5.1 5 5.2
The design is supporting
5.1 5 5.2
USABLE
The design is enjoyable to use
5.1 5 5.2
The design is handy to use
5.1 5 5.2
The design is practical
5.3 5.4 5.2
The design is convenient
5.3 5.4 5.2
The design provides control
5.2 5.2 5.2
FINDABLE
The design is predictable
5.2 5.4 5
The design is clear to use
5.2 5.2 5.2
The design is familiar
5.3 5.4 5.2
DESIRABLE

117
USER EXPERIENCE DESIGN
OVERALL AVERAGE EXPERT NOVICE
The design is emotionally
fulfilling 4.8 4.4 5.2
The design is satisfying
4.8 4.6 5
The design is motivating
3.9 4.2 3.6
The design is aesthetically
pleasing 3.6 3.8 3.4
The design is entertaining to use
4.6 4 5.2
The design is interesting to use
4.5 3.8 5.2
The design is exciting to use
4.6 3.8 5.4
The design is attractive
4.1 4.2 4
The design is pleasant to use
5 4.6 5.4
CREDIBLE
The design is comprehensible
4.2 4.6 3.8
The design is trustworthy
5 4.8 5.2
The design is reliable
5.2 5 5.4
ACCESSIBLE
The design is simple to use
5.2 5 5.4

118
USER EXPERIENCE DESIGN
OVERALL AVERAGE EXPERT NOVICE
The design is inviting
4.4 4.8 4
VALUABLE
The design is rewarding
4.2 4.6 3.8
The design is impressive
4.5 4.4 4.6
The design is innovative
4.7 4.2 5.2
The design is good creativity
4.4 3.6 5.2

119
Table 31: Results from Sustainable Design Evaluation Tool - GPS Navigator
SUSTAINABLE DESIGN
OVERALL AVERAGE EXPERT NOVICE
SOCIAL
The product supports Equal Opportunity use
4.4 5 3.8
The product design meets its goal for
intended population 4.6 5.2 4
The product fosters an awareness of
community 3.2 3.6 2.8
The product comes with sufficient
information for the user to educate themselves with
product use
5.1 5.2 5
ENVIRONMENTAL
The product is easy to disassemble
2 3.2 0.8
The product comes with sufficient information for
recovery by OEM or third party
1.8 2.8 0.8
The product comes with minimal
packaging 3.3 3.8 2.8
The product design allows for all or
parts to be recycled 3.1 2 4.2
ECONOMICAL
The development of this product
includes a risk management plan
2 1.8 2.2

120
SUSTAINABLE DESIGN
OVERALL AVERAGE EXPERT NOVICE
The manufacture of this product takes into consideration
stakeholder returns
2.9 3.6 2.2
The manufacture of this product
supports profitable growth
2.7 2.4 3
The product is innovative
4.1 3.4 4.8
It is interesting to note, that areas where the value is "0" either meant that the particular
design requirement/expectation was not applicable or the participant did not know what
the design requirement/expectation meant; the latter was often the case with the novice
participants who were not familiar with the terms.
121
CHAPTER 5: DISCUSSION AND CONCLUDING REMARKS
This chapter is a discussion of the research findings from the Sustainable Design
Evaluation Tool developed. It also includes the contributions to the body of knowledge
and future research opportunities resulting from this research.
5.1 Discussion
The purpose of this research was to develop a hybrid model of user-centered design
integrating sustainability, create an updated version of Meza's User Centered Design
Evaluation Tool, and provide understanding of the relationship between user-centered
design and sustainability. The user-centered design for sustainability (UCDS) model
was developed to be used as a guideline for incorporating sustainability into a traditional
user-centered design model. The purpose of integrating sustainability into the process is
to address the growing need for sustainable products and systems. By integrating the
specific areas of sustainability (economic, environment, and social) into the model, it
allows for designers and engineers to take into account sustainability from the onset of
design, rather than the end. Implementing the hybrid model leads to a product or
system that the user wants and is satisfied with, while additionally showing a
commitment to the overall well-being of the community (economically, environmentally,
and socially) in which the product or system will be used.

122
Furthermore, added to the User Centered Design Evaluation Tool developed by Meza
(2008) was a Sustainable Design Evaluation Tool. The User Centered Design
Evaluation Tool developed by Meza indentifies “quantitative measures to assess the
significant factors of user-centered design” (Meza, 2008). The Sustainable Design
Evaluation Tool enables designers and users to evaluate the product to ensure it is
meeting sustainable needs, requirements, and expectations. The evaluation tools were
used to evaluate products from three different categories: residential flooring, medical
device, and electronic device. The reason for the various categories was to capture
common everyday items of which users would be familiar and categories that would
have varying levels of sustainability.
Table 32 details the averages of each product (carpet, lancing device, and GPS
Navigator). Prior to the results of this study, the three products were ranked on their
perceived ability to meet sustainable expectations. The carpet was ranked medium, the
lancing device ranked low, and the GPS Navigator ranked high. The scale rating used in
the evaluation tools (1 = “does not meet” to 7 = “exceeds”), are equivalent to the
following values: low = 1 or 2, medium = 3, 4 or 5, and high = 6 or 7. It is difficult to
determine if this research satisfies the objective that the Sustainable Design Evaluation
Tool is a viable tool to assess sustainability factors, according to the results in Table 32.
Further research and development of the Sustainable Design Evaluation Tool may
support that it is a viable tool to assess sustainability factors.

123
Table 32: Overall averages of requirements/expectations of Sustainable Design Evaluation Tool
SUSTAINABLE DESIGN
OVERALL AVERAGES
SOCIAL Carpet Lancing Device GPS Navigator
The product supports Equal Opportunity use
4.9 (medium) 4.2 (medium) 4.4 (medium)
The product design meets its goal for
intended population 5.5 (medium to high) 4.9 (medium) 4.6 (medium)
The product fosters an awareness of
community 2 (low) 3.3 (medium) 3.2 (medium)
The product comes with sufficient
information for the user to educate themselves with
product use
4.4 (medium) 5.4 (medium to high) 5.1 (medium to high)
ENVIRONMENTAL
The product is easy to disassemble
4.2 (medium) 3.1 (medium) 2 (low)
The product comes with sufficient information for
recovery by OEM or third party
2.2 (low) 1.7 (low) 1.8 (low)
The product comes with minimal
packaging 3.6 (medium) 4.8 (medium) 3.3 (medium)
The product design allows for all or
parts to be recycled 3 (medium) 3.4 (medium) 3.1 (medium)
ECONOMICAL
The development of this product
includes a risk management plan
1.2 (low) 1.5 (low) 2 (low)
The manufacture of this product takes into consideration
1.7 (low) 2 (low) 2.9 (low to medium)

124
SUSTAINABLE DESIGN
OVERALL AVERAGES
stakeholder returns
The manufacture of this product
supports profitable growth
2.6 (low to medium) 2.2 (low to medium) 2.7 (low to medium)
The product is innovative
3.5 (medium) 4 (medium) 4.1 (medium)
5.2 Contribution to Body of Knowledge
The purpose of this research was to contribute to the body of knowledge and fill gaps
that are present in the current user-centered design process and sustainability. Some of
the gaps that existed, based on the literature review, included limited availability of
research in sustainable product design, a need to change user behavior by designing
sustainable products and systems, and limited “strategies of change” towards
sustainable development. The development of the hybrid model of user-centered design
and Sustainable Design Evaluation Tool contribute to the research gaps by addressing
the need for a “change in strategy”, as well as influencing a traditional user-centered
design model towards “green design”, by integrating sustainability aspects into the pre-
existing model. Below is a summary of the resulting research contributions:
Increased understanding of the relationship between user-centered design and
sustainability
125
Development of user-centered design model for sustainability (UCDS)
Development of qualitative descriptors to define sustainable components in user-
centered design for sustainability (UCDS) model (Economical, Environmental,
Social, Recycle, Reclaim)
Creation of an evaluation tool for sustainable design (Sustainable Design
Evaluation Tool) to enhance established evaluation tools evaluating cognitive
design, industrial design, physical design, and user experience design
Development of a quantitative tool for assessing the degree of sustainability
design considerations present in products and systems
As stated in the literature review, Figure 14 represents the research gaps and
contributions resulting from this research.

126
Figure 14: Research gaps and contributions to body of knowledge
5.3 Future Research
This research is a step towards incorporating sustainability into design, in particular
user-centered design. Future research should include a larger data sample size to
validate conclusions. In addition to a larger sample size, a more diverse population is
needed for data validation. Incorporation of other sustainability models may also be a

127
consideration for future research; additionally, consideration for comparison of
additional models that are available.
Another research effort that should be included for future purposes is to analyze if the
UCDS methodology has any positive differences in product and system design for
capturing sustainable requirements and expectations. For instance, an organization in
industry could develop the same product side-by-side with the traditional user-centered
design methodology and determine the results. An option to encourage organizations to
participate in future research is to automate the Sustainable Design Evaluation Tool;
this could be achieved by creating software for the Sustainable Design Evaluation Tool.
Another area to consider for future research would be to incorporate the hybrid UCDS
methodology into education, in particular engineering education, and use it as a tool for
teaching future engineers and designers. Comparisons could be made to prior class
projects administered by professors in user-centered design based courses and how
project ideas change with implementation of the hybrid UCDS method.
Additional ways to improve the validity of this research include the development and
incorporation of a technique to validate the evaluation tool. The technique should
include a tool to assess the robustness of the tool given factors of product complexity.
128
Another way to improve validity is the development of a technique and/or equations to
optimize the components of the Sustainable Design Evaluation Tool. This may be
achieved by assigning weights to factors of the Sustainable Design Evaluation Tool.
The opinion of subject matter experts (SME) is another consideration to verify this
research, in particular the Sustainable Design Evaluation Tool.
Limitations encountered during the course of this research include deficiency of diversity
in evaluation participants, time constraint, and limited number (small population) of
evaluation participants. Steps to alleviate these limitations in future research consist of
increasing the number of participants, in addition to obtaining a more diverse population
to participate in the product evaluations. Another solution may include addressing the
time constraint by allotting more time to conduct the research.
129
LIST OF REFERENCES
Abras, C., Maloney-Krichmar, D., & Preece, J. (2004). User-Centered Design. In W. Encyclopedia of Human-Computer Interaction. Thousand Oaks: Sage Publications.
Apple, Inc. (2011). The Story Behind Apple's Environmenal Footprint. Retrieved October 22, 2011, from Apple: http://www.apple.com/environment/
Arup. (2011). About Us. Retrieved October 22, 2011, from Arup: http://www.arup.com/About_us.aspx
Arup. (2011). Sustainability Consulting. Retrieved October 22, 2011, from Arup: http://www.arup.com/Services/Sustainability_Consulting.aspx
Asefa, S. (2005). The Concept of Sustainable Development: An Introduction. In S. e. Asefa, The Economics of Sustainable Development (pp. 1-18). Kalamazoo: W.E. Upjohn Institute for Employment Research.
Beardsley, B., Kroll, E., & Parulian, A. (1996). A methodology to evaluate ease of disassembly for product recycling. IIE Transactions , 837.
Bishop, P. L. (2000). Pollution Prevention: Fundamentals and Practice. Boston: McGraw-Hill.
Blevis, E. (2007). Sustainable Interaction Design: Invention & Disposal, Renewal & Reuse. Proceedings of the SIGCHI conference on Human factors in computing systems (CHI '07) (pp. 503-512). New York: ACM.
Boeing. (2011). Boeing in Brief Home. Retrieved October 22, 2011, from Boeing: http://www.boeing.com/companyoffices/aboutus/brief.html
Boeing. (2011). Commercial Airplanes - Overview Home. Retrieved October 22, 2011, from Boeing: http://www.boeing.com/companyoffices/aboutus/brief/commercial.html
Bras, B. (1997). Incorporating Environmental Issues in Product Design and Realization. Industry and Environment .
Carlson, A. E. (2001). Recycling Norms. California Law Review , 1231-1300.
Chan, V., & Salustri, F. (2003). Design for Assembly. Retrieved September 29, 2011, from http://deed.ryerson.ca/~fil/t/dfmdfa.html
de Silva, N., Jawahir, I., Dillon Jr., O., & Russell, M. (2009). A new comprehensive methodology for the evaluation of product sustainability at the design and development

130
stage of consumer electronic products. International Journal of Sustainable Manufacturing , 251-264.
Environmental Protection Agency. (2011). History of Sustainability. Retrieved October 2, 2011, from U.S. Environment Protection Agency: http://yosemite.epa.gov/r10/oi.nsf/8bb15fe43a5fb81788256b58005ff079/398761d6c3c7184988256fc40078499b!OpenDocument
Greenwood, T. (2011). Sustainability. Retrieved October 21, 2011, from espdesign.org: http://www.espdesign.org/sustainability-definition/
Hawkins, D. E. (2006). Corporate social sustainability: Balancing tomorrow's sustainability and today's profitability. New York: Palgrave Macmillan.
IBM® Design: UCD Process. (n.d.). Retrieved September 29, 2011, from IBM® Design: http://www-01.ibm.com/software/ucd/ucd.html
IDEO, Inc. (2011). About IDEO. Retrieved October 21, 2011, from IDEO: http://www.ideo.com/about/
IDEO, Inc. (2011). Human-Centered Design Toolkit. Retrieved October 22, 2011, from IDEO: http://www.ideo.com/work/human-centered-design-toolkit/
Kankainen, A. (2003). UCPCD: User-Centered Product Concept Design. Proceedings of the 2003 conference on Designing for user experiences (DUX '03) (pp. 1-13). New York: ACM.
Kuniavsky, M. (2003). Observing the User Experience: A practitioner's guide to user research. San Francisco: Morgan Kaufmann Publishers.
Kutz, M. (2007). Environmentally Conscious Mechanical Design. Hoboken: John Wiley & Sons.
Lockton, D. (2008). Making the user more efficient: Design for sustainable behaviour. International Journal of Sustainable Engineering , 3-8.
Magis, K., & Shinn, C. (2009). Emergent Principles of Social Sustainability. In J. Dillard, V. Dujon, & M. C. King, Understanding the Social Dimension of Sustainability (pp. 15-44). New York: Routledge.
McDonough, W., & Braungart, M. (2002). Cradle to Cradle: Remaking the Way We Make Things. New York: North Point Press.
Merriam-Webster, Incorporated. (2011). Sustainability - Definition and More. Retrieved October 4, 2011, from Dictionary and Thesaurus - Merriam-Webster Online: http://www.merriam-webster.com/dictionary/sustainability

131
Meza, K. I. (2008). The creation of tools and models to characterize and quantify user-centered design considerations in product and system development. Orlando: University of Central Florida.
National Aeronautics and Space Administration. (n.d.). NASA - Process: Usability and User Centered Design Process. Retrieved August 14, 2011, from NASA's Usability Toolkit: http://www.hq.nasa.gov/pao/portal/usability/process/index.htm
Norman, D. A. (1988). The Psychology of Everyday Things. New York: Basic Books.
Norman, D. A., & Draper, S. W. (1986). User centered system design: New perspectives on human-computer interaction. Hillsdale: Elrbaum Associates.
Pereira, T. (2009). Sustainability: An integral engineering design approach. Renewable and Sustainable Energy Reviews , 1133-1137.
Porta, S., & Renne, J. L. (2005). Linking urban design to sustainability: formal indicators of social urban sustainability field research in Perth, Western Australia. Urban Design International , 51-64.
Rouse, W. B. (1991). Design for Success: A human-centered approach for designing successful products and systems. New York: Wiley.
Russ, T. H. (2010). Sustainability and Design Ethics. Boca Raton: CRC Press, Taylor & Francis.
SAP. (2009, January 16). SAP User-Centered Design. Retrieved August 14, 2011, from SAP Design Guild: http://www.sapdesignguild.org/resources/ucd_process.asp
U.S. Green Building Council. (2011). Retrieved October 21, 2011, from USGBC: U.S. Green Building Council: www.usgbc.org
Usability Professionals' Association. (n.d.). What is User-Centered Design. Retrieved August 7, 2011, from About Usability: UPA Resources: http://www.upassoc.org/usability_resources/about_usability/what_is_ucd.html
UsabilityNet: Methods: ISO 13407. (2006). Retrieved October 14, 2011, from UsabilityNet: http://www.usabilitynet.org/tools/13407stds.htm
Van Velsen, L., Van der Geest, T., Klaasen, R., & Steehouder, M. (2008). User-centered evaluation of adaptive and adaptable systems: a literature review. The Knowledge Engineering Review , 261-281.
Wever, R., van Kuijk, J., & Boks, C. (2008). User-centred design for sustainable behaviour. International Journal of Sustainable Engineering , 9-20.

132
William McDonough Architects. (1992). The Hanover Principles: Design for Sustainability. Retrieved October 5, 2011, from William McDonough - Being Less Bad is Not Being Good: http://www.mcdonough.com/principles.pdf
World Commission on Environment and Development. (1987). Our Common Future. Oxford: Oxford University Press.