a new apparatus for modelling excavations - civil … new apparatus for modelling excavations ......
TRANSCRIPT

A new apparatus for modellingexcavations
Sze Yue LamResearch Associate, University of Cambridge, Cambridge, UK
Mohammed Z. E. B. ElshafieResearch Associate, University of Cambridge, Cambridge, UK
Stuart K. HaighLecturer, University of Cambridge, Cambridge, UK
Malcolm D. BoltonProfessor, University of Cambridge, Cambridge, UK
Underground space is commonly exploited both to maximise the utility of costly land in urban development and to
reduce the vertical load acting on the ground. Deep excavations are carried out to construct various types of
underground infrastructure such as deep basements, subways and service tunnels. Although the soil response to
excavation is known in principle, designers lack practical calculation methods for predicting both short- and long-term
ground movements. As the understanding of how soil behaves around an excavation in both the short and long term
is insufficient and usually empirical, the judgements used in design are also empirical and serious accidents are
common. To gain a better understanding of the mechanisms involved in soil excavation, a new apparatus for the
centrifuge model testing of deep excavations in soft clay has been developed. This apparatus simulates the field
construction sequence of a multi-propped retaining wall during centrifuge flight. A comparison is given between the
new technique and the previously used method of draining heavy fluid to simulate excavation in a centrifuge model.
The new system has the benefit of giving the correct initial ground conditions before excavation and the proper earth
pressure distribution on the retaining structures during excavation, whereas heavy fluid only gives an earth pressure
coefficient of unity and is unable to capture any changes in the earth pressure coefficient of soil inside the zone of
excavation, for example owing to wall movements. Settlements of the ground surface, changes in pore water
pressure, variations in earth pressure, prop forces and bending moments in the retaining wall are all monitored
during excavation. Furthermore, digital images taken of a cross-section during the test are analysed using particle
image velocimetry to illustrate ground deformation and soil–structure interaction mechanisms. The significance of
these observations is discussed.
NotationD10 diameter of the soil particles for which 10%
of the particles are finer
D50 mean grain size
D60 diameter of the soil particles for which 60%
of the particles are finer
EI bending stiffness of the retaining wall
H excavation depth
Hf final excavation depth
K coefficient of earth pressure
Ka coefficient of earth pressure at active failure
state
Ko coefficient of earth pressure at rest
Kp coefficient of earth pressure at passive
failure state
s prop spacing
su undrained shear strength
ct unit weight of soil
cw unit weight of water
sh horizontal total stress
sho horizontal total stress at rest before excava-
tion
sv vertical total stress
s0
v vertical effective stress
1. Introduction
In order to obtain the reliable data that are essential for a
better understanding of the behaviour of soils during the
process of excavation, the simulation of that process should be
realistic and reproducible. Although the instrumentation of
actual excavations in the field is authoritative for the particular
structure concerned, a major drawback to using field data in a
scientific study is the difficulty of accurately characterising the
soils that are present. Soil conditions and construction
sequence will differ from site to site, and no experiment can
hence ever be repeated. Furthermore, it would require an
extraordinary array of inclinometers and extensometers to
define the complete deformation mechanism of the ground.
International Journal of Physical Modellingin GeotechnicsVolume 12 Issue 1
A new apparatus for modellingexcavationsLam, Elshafie, Haigh and Bolton
International Journal of Physical Modelling in Geotechnics,
2012, 12(1), 24–38
http://dx.doi.org/10.1680/ijpmg.2012.12.1.24
Paper 1100005
Received 17/03/2011 Accepted 29/08/2011
Keywords: centrifuge modelling/geotechnical engineering/retaining wall
ICE Publishing: All rights reserved
24
However, field measurements remain important as a means of
calibration and verification of any calculations that emerge
from physical and numerical model studies.
The most widely attempted method of assessing soil–structure
interaction problems is by continuum numerical analysis, using
finite-element or finite-difference computer programs. These
offer powerful tools to model complex construction processes,
with a chosen structural system progressively put in place
within a detailed ground stratigraphy. However, the ability to
predict ground movements reliably is wholly dictated by the
input of representative parameters for the various soils, and
existing numerical codes are extremely demanding of such
prior information. A more practical alternative is to discover
simplified mechanisms of behaviour, and to use those in
decision making. Such mechanisms universally form the basis
of judgements that engineers make regarding possible collapse,
but there has been relatively little information available on
mechanisms that can be used to predict deformations under
working conditions. The first step must be to observe them.
Small-scale centrifuge models can be used to simulate the
prototype behaviour of an excavation in soil. A centrifugal
acceleration field is used in a small-scale model to match the
stresses induced by gravity in the prototype. The principal
challenges are to design a test package to simulate the
construction sequence of a braced excavation in the field, so
that a cross-section can be used for the remote measurement of
the resulting ground movements. The advantage is that tests
can be repeated with planned variations, and that the model
can be observed continuously from the occurrence of small
deformations up to complete collapse, which is generally not
allowed to happen in the field.
To model an excavation in a centrifuge, some method must be
found of simulating soil removal in flight. The following four
methods have been previously used to model in-flight
excavation in a centrifuge
(a) increasing centrifugal acceleration until failure (Lyndon
and Schofield, 1970)
(b) draining of a heavy fluid (Bolton and Powrie, 1987;
Powrie, 1986)
(c) removal of a bag of material from the excavation area
(Azevedo, 1983)
(d) an in-flight excavator (Kimura et al., 1993; Loh et al.,
1998; Takemura et al., 1999).
In the first method, soil in the excavation area is initially
removed during model-making at 1g, before the model is
subjected to increasing centrifuge acceleration up to failure.
Although the total vertical stress in a prototype can ultimately
be reproduced, the scale factor continually changes with the
acceleration, and it is not possible to simulate the progressive
ground movements owing to excavation in the field.
For the second method employed, the key idea is to replace the
soil to be excavated by a fluid of identical density, retained in a
rubber bag. The main drawback of simulation using a fluid is
that the coefficient of lateral stress (K) is always one. This may
approximate earth pressures adjacent to a cast-in-place wall
(Richard et al., 2006), but it would not be an appropriate
technique for sheet pile walls inserted into clays, whether
normally consolidated (Ko,1) or heavily overconsolidated
(Ko.1). Even so it must be recognised that, during the
excavation, K within the zone of future excavation will remain
at unity in a heavy fluid, which is not consistent with what
happens in the field where K below the excavation level may
approach the passive earth pressure coefficient Kp. Thus, the
technique of using liquid does not correctly reproduce the
prototype deformations and stresses with respect to the
progress of excavation.
In the third method, soil bags were placed in the zone to be
excavated and were removed during the excavation process.
This has one advantage over the first two methods, as the
modelling of stress history is more realistic. Since the soil
used in the bags is similar to the soil in the rest of the model,
the initial coefficient of lateral stress should be consistent.
Nonetheless, the interaction between the interfaces of the soil
bags and the retaining wall would be very difficult to
quantify.
Therefore, the first three methods cannot satisfactorily model a
field excavation in clay soil in the centrifuge because the
process of soil removal has not correctly been simulated. In
view of this, in-flight excavation and bracing methods should
be developed. Previous types of in-flight excavator modelled
open cuttings with retaining walls, with or without ties that
were placed initially at 1g (Loh et al., 1998; Takamura et al.,
1999). These excavators produced interesting results, but the
modelling of more realistic construction sequences that include
wall and prop installation remains a challenge for physical
modellers.
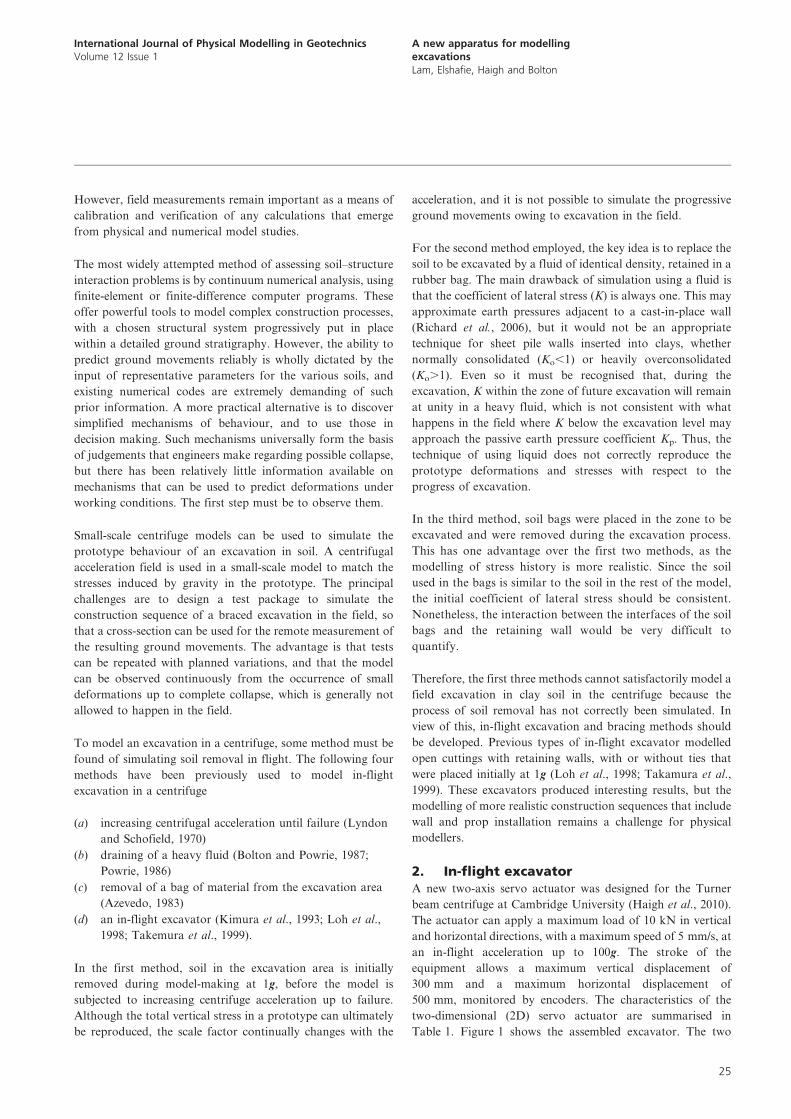
2. In-flight excavatorA new two-axis servo actuator was designed for the Turner
beam centrifuge at Cambridge University (Haigh et al., 2010).
The actuator can apply a maximum load of 10 kN in vertical
and horizontal directions, with a maximum speed of 5 mm/s, at
an in-flight acceleration up to 100g. The stroke of the
equipment allows a maximum vertical displacement of
300 mm and a maximum horizontal displacement of
500 mm, monitored by encoders. The characteristics of the
two-dimensional (2D) servo actuator are summarised in
Table 1. Figure 1 shows the assembled excavator. The two
International Journal of Physical Modelling in GeotechnicsVolume 12 Issue 1
A new apparatus for modellingexcavationsLam, Elshafie, Haigh and Bolton
25
DC servo-controlled motor-encoder units drive step-down
gearboxes to increase the torque. Ball screws are used to
convert these rotary motions into linear vertical and horizontal
movements. The vertical screw system drives a ball nut carrier
plate which slides along vertical guide rails, while the
horizontal screw system shifts the whole actuator housing
along horizontal guide rails. The whole frame was designed to
be stiff enough to ensure good control of movements.
3. Experimental set-up
Figure 2 shows the experimental set-up of the present study.
The rectangular model container is made of aluminium alloy
with internal dimensions 790 mm long, 180 mm wide and
470 mm deep. The front face of the container consists of a
poly(methyl methacrylate) (PMMA) window, which enables
the whole testing process to be monitored by cameras mounted
in front. The back of the container has holes at specific
locations with respect to the position of the retaining wall, for
the installation of pore pressure transducers and the provision
of drainage. The servo actuator stands above the rim of the
model container. The carrier plate of the actuator is connected
through a screw fitting to an inverted T-shaped scraper which
performs in-flight excavation at 60g.
Instrumentation comprising pore pressure transducers in the
soil, earth pressure cells on the retaining wall, bending moment
strain gauges on the wall, load cells on the props, laser sensors
and linear variable transformers for displacement measure-
ments were installed. Digital cameras were mounted in front of
the PMMA window and LED (light-emitting diode) arrays
were situated to illuminate the clay cross-section without
causing glare or shadows.
In this paper, the results of two centrifuge tests on excavations
with different support system stiffness are discussed. For test 1,
a 6 mm thick aluminium plate is used to model an excavation
with a 1?1 m thick diaphragm wall. For test 2, a 2 mm thick
plate is used to model excavation using a sheet pile wall. The
test programme is summarised in Table 2.
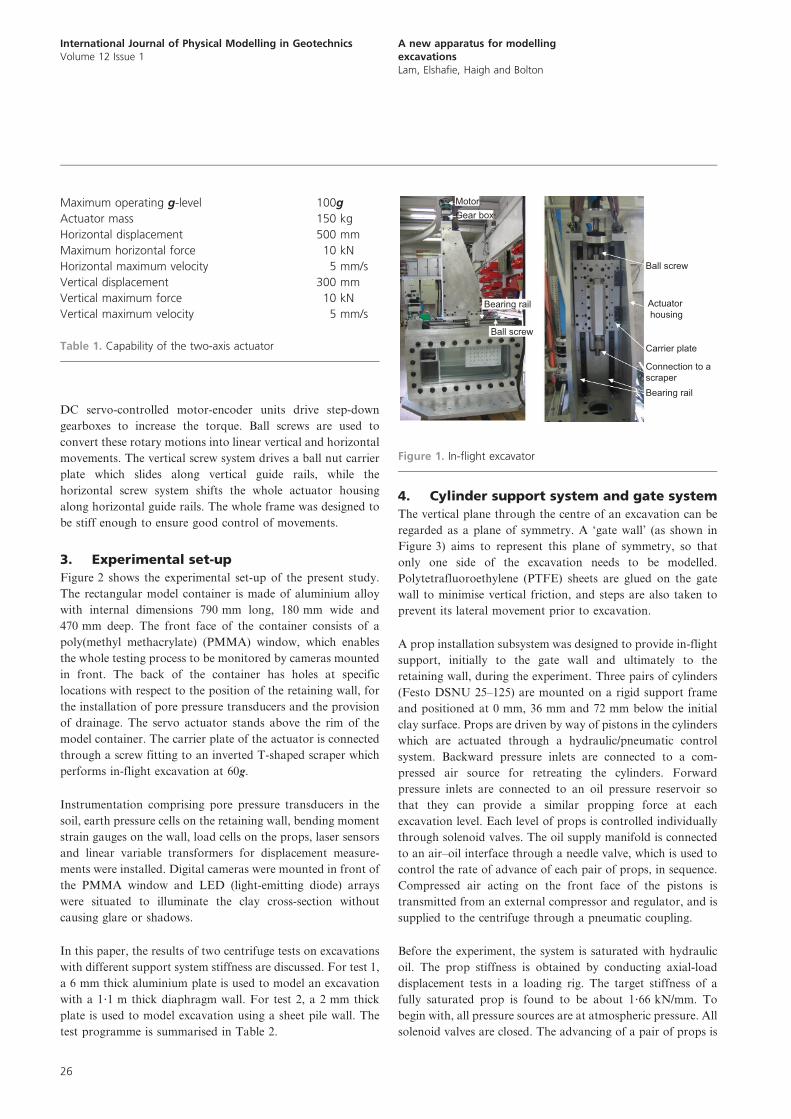
4. Cylinder support system and gate system
The vertical plane through the centre of an excavation can be
regarded as a plane of symmetry. A ‘gate wall’ (as shown in
Figure 3) aims to represent this plane of symmetry, so that
only one side of the excavation needs to be modelled.
Polytetrafluoroethylene (PTFE) sheets are glued on the gate
wall to minimise vertical friction, and steps are also taken to
prevent its lateral movement prior to excavation.
A prop installation subsystem was designed to provide in-flight
support, initially to the gate wall and ultimately to the
retaining wall, during the experiment. Three pairs of cylinders
(Festo DSNU 25–125) are mounted on a rigid support frame
and positioned at 0 mm, 36 mm and 72 mm below the initial
clay surface. Props are driven by way of pistons in the cylinders
which are actuated through a hydraulic/pneumatic control
system. Backward pressure inlets are connected to a com-
pressed air source for retreating the cylinders. Forward
pressure inlets are connected to an oil pressure reservoir so
that they can provide a similar propping force at each
excavation level. Each level of props is controlled individually
through solenoid valves. The oil supply manifold is connected
to an air–oil interface through a needle valve, which is used to
control the rate of advance of each pair of props, in sequence.
Compressed air acting on the front face of the pistons is
transmitted from an external compressor and regulator, and is
supplied to the centrifuge through a pneumatic coupling.
Before the experiment, the system is saturated with hydraulic
oil. The prop stiffness is obtained by conducting axial-load
displacement tests in a loading rig. The target stiffness of a
fully saturated prop is found to be about 1?66 kN/mm. To
begin with, all pressure sources are at atmospheric pressure. All
solenoid valves are closed. The advancing of a pair of props is
Maximum operating g-level 100g
Actuator mass 150 kg
Horizontal displacement 500 mm
Maximum horizontal force 10 kN
Horizontal maximum velocity 5 mm/s
Vertical displacement 300 mm
Vertical maximum force 10 kN
Vertical maximum velocity 5 mm/s
Table 1. Capability of the two-axis actuator
MotorGear box
Bearing rail
Bearing rail
Ball screw
Ball screw
Actuator housing
Carrier plate
Connection to ascraper
Figure 1. In-flight excavator
International Journal of Physical Modelling in GeotechnicsVolume 12 Issue 1
A new apparatus for modellingexcavationsLam, Elshafie, Haigh and Bolton
26

achieved by increasing air pressure at the air–oil interface and
activating the solenoid valve for that specific pair of props. The
propping force can be controlled by adjusting the air pressure
at the air–oil interface. That solenoid valve is then closed and
the associated props remain stiff owing to the incompressibility
of hydraulic oil. On the other hand, retreating cylinders
requires the reduction of air pressure at the air–oil interface
and the increase in air pressure at the backward pressure inlet
of the cylinders.
Figure 4 shows the gate system. At the start of the experiment,
three pairs of sacrificial gates, each 36 mm high, sit on the top
of the gate wall. They act as a support to retain the soil to be
excavated. The gates are temporarily supported by the pairs of
cylinders throughout the initial reconsolidation stage before
excavation. The forces required to support the gate segments
are monitored by axial load cells attached at the end of each
prop. Figure 5 shows the sequence of the first excavation stage.
At the start of excavation, the first pair of cylinders is retracted
so that the first layer of gates is in an unstable condition and is
easily knocked down by the scraper of the in-flight excavator.
The in-flight excavator then makes a 4 mm cut into the soil,
which is scraped off into the open space inside the cylinder
support system. The scraper then returns to its initial position
and makes another 4 mm cut, repeating until the excavation
level reaches the top of the second level of gates. At that
Direction of motion
Screwrod
StandpipeGroundwatertable
PPTs
LVDTs
Scraper Scraper
Soft clay
Dense sand layerPorous plastic
Line of symmetry
Loadcells
Gatewall
Gatewall
PMMAwindow
PTFESheets
Gatesegments Segmental
gates
Side view
Open space
Soleniodvalve
3 2 134
21
Airpressure
Air–oilinterface
Step motor
Figure 2. Schematic diagram of experimental set-up with in-flight
excavator
International Journal of Physical Modelling in GeotechnicsVolume 12 Issue 1
A new apparatus for modellingexcavationsLam, Elshafie, Haigh and Bolton
27
moment, the first level of props is advanced over the top of the
scraper to support the retaining wall. The prop force required
can be adjusted by looking at the readings given by the prop
load cells. This completes the first stage of excavation. As the
scraper is made in an inverted T-shape, it can continue
scraping below the first pair of props. The second and third
stages of excavation can therefore proceed by repeating the
same steps carried out for the first level.
5. Preparation of model ground
Standardisation of experimental procedures is very important
as it determines the ability to reproduce similar soil stress states
in each experiment. Both clay and sand were used in the
present experiments.
A base layer of fine fraction E sand was formed by pluviation
using an automatic pouring machine (Madabhushi et al., 2006;
Zhao et al., 2006). A constant fall height of 600 mm was used
to achieve a uniform layer with a relative density above 95%
and a dry unit weight of 16?0 kN/m3. The properties of the
sand are shown in Table 3. The sand was saturated with water
by connecting the bottom drainage hole to a standpipe.
Since the objective of these particular tests was to monitor
excavation in soft clay and to compare different bracing
schemes, lightly over-consolidated kaolin clay was used in the
models. A standard procedure was adopted to ensure repetitive
reproduction of the model ground with similar strength profiles
in each test. Speswhite kaolin clay was chosen for the tests
because the parameters are well defined in the literature: some
mineralogy and properties are given Table 4. Clay powder was
mixed with water to about twice the liquid limit (i.e. 120%
moisture content), the mixing taking place under vacuum for at
least 2 h. The inner surface of the test container was coated with
silicone grease to minimise friction against the clay. The clay
slurry was carefully poured on the bearing layer, which consisted
of a sheet of filter material placed over the base layer of sand.
The final height of the slurry was 550 mm. The container was
placed in a hydraulic press, and pressure was applied to the clay
in seven loading steps (to 2 kPa, 5 kPa, 10 kPa, 20 kPa, 40 kPa,
80 kPa and 160 kPa).
The final pressure of 160 kPa was intended to achieve an
estimated cu of 25 kPa for the clay at mid-depth in the
centrifuge model when it had swollen back into equilibrium at
60g.
When the settlement of the clay in the press became steady
under 80 kPa vertical stress, the clay was unloaded. Nine pore
Centrifuge tests 1 2
Rigid wall Flexible wall
Objective Baseline test Wall stiffness
Clay depth in model
scale: mm
300 300
Prop stiffness: kN/mm 1?66 1?66
Wall stiffness, EI: MNm2/m 280?4 10?8
System stiffness EI/cws4 2860 106
Table 2. A summary of centrifuge testing programme
PPTs
Soft clay
Bearing stratumPorous plastic
Line ofsymmetry
ScraperLasersensor LVDTs Standpipe
Groundwater table
Load cells
Gate wall
O-ringseal PTFE
sheets
Gatesegments
Open space
Soleniodvalve3 2 1
34
21Air
pressure
Air–oilinterface
Hydraulicoil
Figure 3. General arrangement of main apparatus
International Journal of Physical Modelling in GeotechnicsVolume 12 Issue 1
A new apparatus for modellingexcavationsLam, Elshafie, Haigh and Bolton
28

pressure transducers (PPTs) were inserted through pre-drilled
openings in the back wall of the container. PPTs were installed
through 90 mm long holes augured horizontally into the clay
using a hand drill. Unconsolidated slurry was then injected to
fill the holes, and the openings were sealed. The final locations
of the PPTs are shown in Figure 6(a). The spacing between
PPTs was about 30 mm. After installation, the vertical stress
was brought back to 80 kPa. After equilibration, the vertical
stress was further increased to 160 kPa. After settlement was
steady, the stress was reduced again to 80 kPa and the clay was
allowed to swell into equilibrium. Removal of this final
pressure was known by experience to be possible without
drawing air into the clay.
6. Model making and instrumentationThe loading plate was removed. After trimming the clay
surface, the resulting clay thickness was 295 mm. The front
wall of the model container was then removed. The clay and
base layer were then removed from that half of the package
that would contain the cylinder support system. An O-ring seal
was placed along the edges of the gate wall to seal the gap at
the side walls of the box. The retaining wall, in the particular
test to be described here, is made of either a 6 mm or 2 mm
thick aluminium alloy plate with an equivalent stiffness (EI) of
280?8 or 10?4 MNm/m2 at prototype scale. This wall simulates
a 0?5 m thick concrete diaphragm wall or a sheet pile wall (US
steel, PDA-27) in the field.
Aluminium alloy was chosen as it is stiff and light. This reduces
the effect of excessive settlement of the wall in soft ground
during self-weight consolidation. Six slots are made to
accommodate total pressure cells (Entran EPL-D1-X-7BAR).
The wall was instrumented with bending moment strain gauges
arranged in Wheatstone bridges at 32 mm intervals. Greased
wiper seals were used to prevent water from seeping past the
sides of the wall and to ensure a free sliding condition with
minimal friction. The wall was installed at a depth of 160 mm
(equivalent to 10?6 m prototype). A set of vertical guides and a
cutter were used to dig a trench with the same thickness as the
wall. The wall was then pushed into the trench using a vertical
guide.
With the clay cross-section uppermost, grains of black-dyed
fraction E sand were blown onto the clay to provide texture for
image tracking. Lubricant was then applied to the PMMA
window to reduce friction against the soil cross-section. The
hollow frame, PMMA window and window frame were then
bolted to the main body of the container.
Linear variable differential transformers (LVDTs) were
assembled at 30 mm spacing intervals from the wall to measure
the soil settlement profile of the ground surface. A laser sensor
was used to monitor the lateral displacement of the top of the
wall. Finally, the water table in the clay was to be maintained
at the ground surface by permitting overflow from a standpipe
that would be supplied continuously throughout the experi-
ment. Two 8 megapixel cameras took pictures throughout the
(a) (b)
Figure 4. Propping and gate system: (a) before and (b) after
excavation
ScraperScraper Scraper
Scraper Scraper
Load cellsLoad cellsLoad cellsLoad cells
Figure 5. Modelling sequences of excavation
International Journal of Physical Modelling in GeotechnicsVolume 12 Issue 1
A new apparatus for modellingexcavationsLam, Elshafie, Haigh and Bolton
29
experiment with the provision of suitable lighting. A close-
circuit television (CCTV) camera and a webcam were used to
observe the behaviour of the propping system during the
excavation. The detailed locations of the instruments are
shown in Figures 6 and 7.
7. Excavation testing procedures
The in-flight excavator was bolted above the model container,
and the integrated assembly was transferred onto the
centrifuge swing platform. This was fixed to the torsion-bar
catches which permit the package to rotate into a fixed-end
condition at a centrifuge acceleration of about 10g. The model
was then brought to its scale acceleration of 60g. There are
three test phases for a typical centrifuge test of deep
excavation–reconsolidation, in-flight excavation and long-term
equilibration.
As an increase in soil self-weight leads to an increase in excess
pore pressure, the model ground first had to undergo about 5 h
of reconsolidation until at least 90% of the consequential
consolidation was achieved. The degree of consolidation was
monitored by judging whether PPT readings were approaching
their hydrostatic state.
The excavation was then started. The in-flight excavator
operated at a rate of 5 mm/s horizontally and with 4 mm
vertical increments. In order to ensure that realistic quasi-
undrained responses were observed, the excavation process
should be finished within a reasonably short period of time.
Figure 8 shows the progress of excavation in all tests.
Excavation to an excavation depth of 5?5 m finished within
72–96 days in prototype scale (30–40 min in model scale),
which is similar to the rate of excavation in the field. It is
debatable, of course, whether a field profile in typical soft clay
with sand and silt layers would be more or less permeable than
the kaolin in the model.
Following excavation, the test was allowed to continue and
excess pore pressures that had been generated by excavation
were observed to dissipate as long-term deformations were
monitored.
8. Results and discussion
There are three test phases for a typical centrifuge test of
excavation. First, the soil sample is allowed to reconsolidate
under its enhanced self-weight. Then, in-flight excavation is
carried out. Finally, the soil sample is allowed to reconsolidate
for dissipation of excess pore pressures generated during the
excavation stage.
Figure 9 shows the response in pore water pressure, bending
moment and ground settlement with respect to time for a
typical excavation test. During the spin-up, excess pore water
pressures were generated owing to the enhanced self-weight of
the soil. The soil sample was then allowed to consolidate and
pore water pressure approached hydrostatic equilibrium after
5 h (Figure 9(a)). Similarly, the surface settlement stabilises
after the dissipation of excess pore water pressure is complete
(Figure 9(b)). During the reconsolidation phrase, bending
moments observed in the retaining wall were found to remain
minimal, as required (Figure 9(c)). Richards and Powrie (1998)
reported that some bending moments were observed during
their reconsolidation phrase, amounting to more than 20% of
the later excavation-induced bending moments. This was
attributed to the mismatch between the total horizontal stress
profile in the soil and the hydrostatic pressure in the heavy
fluid used to support the wall. Thus, the wall retaining heavy
fluid bends to fulfil the force equilibrium requirement. No such
problem has occurred with the new actuation system.
With the benefit of a time-scaling factor of n2 for consolidation
problems in the centrifuge, the long-term behaviour of the
retaining wall system is investigated. Dissipation of excess pore
water pressure is allowed owing to water discharge from the
double drainage boundaries, which eventually leads to a
constant seepage condition around the wall toe. Swelling and
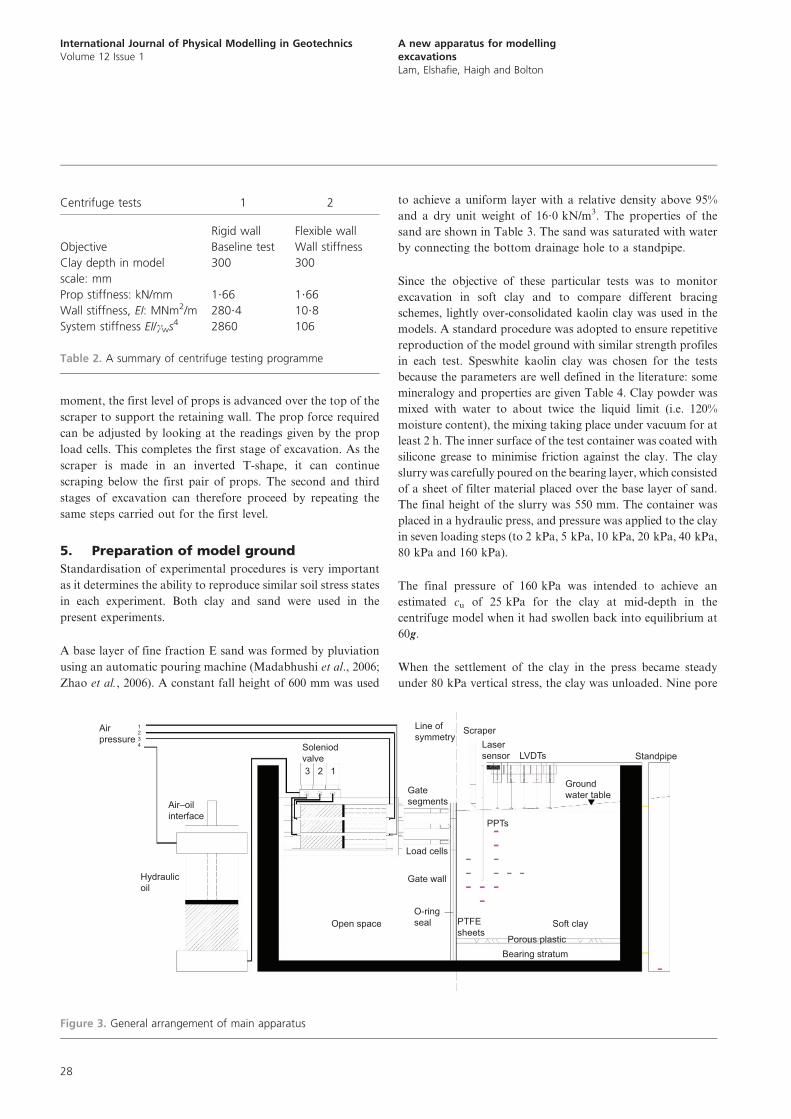
Mineralogy/properties Value
Silicon dioxide (SiO2) 47%
Aluminium oxide (Al2O3) 38%
300 mesh residue 0?02% maximum
>10 mm 0?5% maximum
#2 mm 80¡3%
Specific gravity 2?6
Surface area 14 m2/g
pH 5?0 ¡ 0?5
Oil absorption 42 g/100 g
Water-soluble salts content 0?2%
Table 4. Mineralogy and properties of Speswhite kaolin
Properties Value
Minimum void ratio 0?613
Maximum void ratio 1?014
Minimum dry unit weight 12?9 kN/m3
Maximum dry unit weight 16?1 kN/m3
Specific gravity of solids 2?65
D10 124 mm
D50 218 mm
D60 360 mm
Table 3. Properties of fraction E sand
International Journal of Physical Modelling in GeotechnicsVolume 12 Issue 1
A new apparatus for modellingexcavationsLam, Elshafie, Haigh and Bolton
30

60·00 @30·00 c/c32·00 c/c
12 c/c
15 c/c
13 c/c
48·00
295·00
@32·00 c/c
@30·00 c/c
30·00
Lasersensor
LVDT1
LVDT2
LVDT3 LVDT5 Groundwater table
LVDT4
Scraper
O–ringseal
PPT 1
PPT 2
PPT 3 PPT4
PPT 5PPT 6
PPT 9
PPT 8
PPT 7
Gate wallsegments
LC1 and LC2
LC3 and LC4
LC5 and LC6
Soft clay
Standpipe
Overflowpipe
PPT SP
(b)
(a)
Bearing stratum
2
Porous plastic
260
EPC P1
EPC A1EPC A1
SG1 SG1GroundlevelSG2 SG2
SG3 SG3SG4 SG4SG5 SG5
SG6SG6
SG7SG7
SG8 SG8
SG9 SG9
SG10 SG10SG11 SG11SG12 SG12
EPC A2EPC A2
EPC A3EPC A3EPC P1
1648
80
112144
EPC P2EPC A4EPC A4
Totalpressure cell BM strain
gauge
EPC P2
Figure 6. Positions of instruments: (a) elevation view; (b) plan view
(dimensions in model scale in mm)
International Journal of Physical Modelling in GeotechnicsVolume 12 Issue 1
A new apparatus for modellingexcavationsLam, Elshafie, Haigh and Bolton
31

softening of the soft clay occurs on the excavation side owing
to the removal of the overburden stress and the up-welling of
ground water. This leads to the redistribution of total
horizontal stress along the wall.
8.1 Apparent earth pressure
The design of bracing systems usually involves the calculation
of prop forces using apparent earth pressure envelopes
developed empirically by Peck (1969) from field measurement
of maximum strut forces and tributary areas of soil, which
were obtained from early projects supported by sheet pile or
soldier pile and lagging walls in the 1960s. Figure 10(a) shows
the development of measured average earth pressure profiles
calculated from the ratio of the measured prop load to the
tributary area for each prop (i.e. horizontal prop spacing 6vertical prop spacing). The maximum strut force is usually
observed just before the installation of the next deeper level of
strut. Strut forces at higher elevations would then usually
relieve.
Hashash and Whittle (2002) propose that an arching mechan-
ism forms with the major principal stresses directed toward the
lowest level of strut, while an underlying compressive arch also
transfers load onto the embedded section of the wall. After
installation of the lowest strut, a deeper arching mechanism
forms. This agrees well with the centrifuge observation that the
apparent earth pressure drops after installation of the lowest
prop. Figure 10(b) shows the profile of apparent earth pressure
at an excavation depth of 5?5 m, with three levels of bracing
above. The measured pressures are compared with Peck’s
design recommendations for soft to firm clay. The model data
clearly show the influence of structural stiffness. The maximum
apparent earth pressure for depths beyond 25% of the final
excavation depth can, according to Peck (1969), be taken as
1. sAh ~KactH with Ka~1{m
4su
ctH
� �
where ct is the representative unit weight of the soil, su is the
undrained shear strength averaged over the depth of excava-
tion and the factor m is 0?4.
Results show that the recommended design values agree with
the measurements in the top 2 m of soils for all cases.
However, the recommended values under-predict the values
measured below the top struts by 30% for the case of
excavations supported by diaphragm walls. Similar findings
were reported for excavations supported by stiff well-
embedded diaphragm walls in numerical studies by Goldberg
et al. (1976) and Hashash and Whittle (2002). On the other
hand, reducing the bending stiffness of the retaining wall or
axial stiffness of the propping system causes a reduction in
apparent earth pressures and a close agreement with Peck’s
design envelope as revealed in Figure 10(b).
8.2 Pore pressure behaviour
As the excavation proceeded, the ground water level in front of
the wall was lowered simultaneously with the soil. However,
the bottom drainage layer was connected throughout each test
to a standpipe which maintained a hydrostatic water pressure
measured from the soil surface at the back of the wall. Water
flow past the sides of the wall was prevented by greased seals.
Under such conditions, downward seepage should ultimately
be expected at the back of the wall providing upward seepage
Figure 7. Configuration of PIV cameras and webcam (front) 1600400 800
Time: s
Exc
avat
ion
dept
h h:
mm
Excavation progress using flexible wall
1200
100
80
60
40
20
00
Figure 8. Progress of excavation
International Journal of Physical Modelling in GeotechnicsVolume 12 Issue 1
A new apparatus for modellingexcavationsLam, Elshafie, Haigh and Bolton
32

in front of the wall. However, transient pore pressures must be
expected during the excavation process.
Figure 11 shows the variation of pore water pressure observed
for different instances of time as the excavation progressed,
using a sheet pile wall in test 2. The variation of pore pressure
with depth at different stages of excavation is shown in
Figure 11. In front of the wall, a negative pore pressure built
up (PPT 9 and PPT 8) due to the reduction in total mean stress
induced by the excavation. The reduction in total vertical stress
in the passive zone is also plotted in the same figure for
comparison. However, the magnitude of the negative pore
pressures was less than half of the effective overburden
pressure lost by excavation. This is attributed to the negative
pore pressure being partially cancelled by positive pore
pressures generated by shear deformation of soft clay. On the
other hand, the changes in pore pressure measured at the back
of the retaining wall (PPT 1, PPT 2, PPT 3, PPT5 and PPT6)
were relatively small because the stiff prop supports limited
lateral wall deformation, and thus limited any reduction in
lateral horizontal stress.
In the long term, the dissipation of excess pore water pressure
leads to the long-term steady-state seepage condition. The
drainage path at the particular location of the PPTs governs
the rate of excess pore pressure dissipation accordingly. In
general, all the readings stabilise for the development of steady
seepage condition after 200 days. For the present studies, since
the pore pressure within the bottom drainage layer is
maintained as hydrostatic with a water table at the ground
surface, this would represent cases of excavation site where
there is a high-pressure water aquifer located below the soft
clay stratum. Design against hydraulic failure would become a
critical issue for engineers. The pore water pressure on the
retained side recovers to slightly lower than its original level
owing to seepage effects. Most importantly, the pore water
pressure inside the excavation drops tremendously due to the
drawdown of water table in the pit, as would be achieved by
dewatering. Both soil softening in the excavation pit owing to
overburden vertical stress removal with consolidation and
seepage forces lead to a reduction in passive resistance of the
soil in the excavation pit. This would possibly cause gradual
long-term wall toe kick-out scenarios.
8.3 Earth pressures
The variation of measured total earth pressure during
excavation and the final earth pressure profile on both sides
of the sheet pile wall are shown in Figures 12 and 13
respectively. In Figure 13, the pressure under Ko conditions
before excavation and Rankine’s active and passive pressure at
an excavation depth of 5?5 m are also presented. In the
calculation of Rankine’s pressure, an undrained condition is
assumed with an estimated undrained shear strength of 27 kPa
using the empirical correlation by Jamiolkowski et al. (1985)
defined as follows
400Swung-up Consolidation Swung down
PPT 1PPT 3PPT 5PPT 7PPT 9
ConsolidationExcavation
300
200
100
00
(a)
(b)
(c)
10 000 20 000 30 000 40 000
Time: s
0Ben
ding
mom
ent:
kN m
Gro
und
settl
emen
t: m
Por
e pr
essu
re: k
Pa
10 000 20 000 30 000 40 000
Time: s
0
LVDT 2LVDT 3LVDT 4
0SG1SG3SG5SG7SG9SG11
–10
–0.20–0.16–0.12–0.08–0.04
0.00
–20
–30
10 000 20 000 30 000 40 000Time: s
Figure 9. Typical centrifuge test responses for: (a) pore water
pressure; (b) ground settlement; (c) bending moment on retaining
wall
150FW1FW2FW3RW1RW2RW3
120
90
60
30
012060 80 100
Peck’s max. pressure
0 20 400 1 2Excavation depth, H: m
Dep
th: m
Apparent earth pressure: kPa
App
aren
t ear
th p
ress
ure:
kN
/m2
3 4
(a) (b)
5 6
0
1
Flexible wallRigid wall
2
3
4
5
6
Figure 10. Development of prop forces during excavation: (a) with
excavation depth; (b) with depth
International Journal of Physical Modelling in GeotechnicsVolume 12 Issue 1
A new apparatus for modellingexcavationsLam, Elshafie, Haigh and Bolton
33

2. cu~0:22sv0 OCRð Þ0
:8
At the back of the wall, there is a gradual decrease in total
pressure with excavation depth. As the excavation depth
increases, a larger decrease in total pressure is observed owing
to deep-seated soil movement below the lowest prop. At the
front of the wall, there are two opposing effects, a decrease in
total earth pressure owing to the removal of soil and an
increase due to the progressive mobilisation of passive
pressure.
Effective earth pressure coefficient is derived from the earth
pressure cell data and the pore pressure data with the
assumption of constant vertical total stress on a stress element
at a depth throughout the excavation process. K is calculated
as follows
3. K~sh{u
csatd{u
where sh, csat, d and u are total horizontal stress measured by
earth pressure cell, saturated unit weight, depth of pressure cell
and pore water pressure measured by pore pressure transducer,
respectively.
As shown in Figure 14(a), in the early stage of excavation the
earth pressure in front of the wall registered by stress cell EPC
P1 (Figure 6(b)) stays constant (h , 0?5 Hf where h and Hf are
the excavation depth and the final excavation depth, respec-
tively) but it eventually drops with an increasing rate as the
excavation progresses to full depth (h. 0?5 Hf). For the
simulation method of excavation using heavy fluid, K within
the zone of future excavation will in theory remain at unity,
which is not consistent with what happens in the field where K
below the excavation level may approach the passive earth
pressure coefficient Kp as shown in Figure 14(b). Thus, the
technique of using heavy fluid does not accurately reproduce
the prototype deformations and stresses with respect to the
progress of excavation. This confirms the necessity of
excavating real soil in-flight, rather than draining heavy fluid,
if pressures and bending moments are to be precisely
simulated.
8.4 Observed bending moment
Figure 15 shows the development of bending moment per
metre run during in-flight excavation in a deep clay stratum.
For the first stage of unpropped excavation, negative bending
moments developed near the toe of the cantilever wall. After
introduction of the first layer of struts, the wall was allowed to
rotate about the wall crest and developed a bulge below the
excavation. Positive bending moments therefore developed. On
the other hand, installation of deeper props induced a slight
reduction of wall bending moments at higher elevations. As the
excavation proceeded, the lateral restraint imposed by the
support system on the retaining wall led to the development of
a deep-seated deformation mechanism below the lowest strut.
Positive bending moments were induced below the lowest
props. The maximum bending moment induced by the
undrained excavation amounted to about 200 kNm/m. In the
long term, after swelling, the magnitude of maximum bending
moment decreased to 150 kNm/m as a result of the clay
softening and stress redistribution on the excavation side. In
the long term it is the overall stability of the softening clay,
rather than the bending moments and reactions in the
supporting structure, that are the cause for concern in
excavations that have been left open to groundwater flow.
20
10
0
PPT1PPT2PPT3PPT5PPT6PPT7PPT8PPT9
0
Varia
tion
of p
ore
wat
er p
ress
ure:
kP
a
–10
–20
–30
–40
–501 2 3 4 5 6
Excavation depth: m
Figure 11. Variation of pore water pressure with excavation depth
00
20
40
60
80
100
120
140
160
180
1 2
Tota
l ear
th p
ress
ure:
kP
a
EPC1EPC2EPC4EPC5
3 4 5 6Excavation depth: m
Figure 12. Variation of total pressure with depth of excavation
International Journal of Physical Modelling in GeotechnicsVolume 12 Issue 1
A new apparatus for modellingexcavationsLam, Elshafie, Haigh and Bolton
34

8.5 Ground settlement and wall displacement
The magnitude of wall deflection and the ground settlement
profile during undrained excavation are vital in assessing
potential damage to neighbouring structures and buried
services. In an ideal excavation process, the first level of
support is installed at an early stage in order to minimise
cantilever deflections. However, this may not always be
possible in practice owing to a variety of site constraints
and construction sequences. In the present studies, the
excavation procedures initiated with a cantilever stage of
excavation, which was then followed by singly propped and
finally multi-propped excavation stages. Ground movements
were captured by the particle image velocimetry (PIV)
technique. Some discrete measurements monitored by
LVDTs are included for comparison. In general, the results
obtained by LVDTs and the PIV technique are comparable,
which confirms that the model is deforming under plane strain
conditions.
Figure 16 shows the PIV results of lateral wall displacement
and ground settlement developing around a deep excavation
supported by a flexible sheet pile wall. The PIV results are
compared with the LVDT data to ensure a plane strain testing
condition in Figure 16. Consistent with results shown by
previous researchers (Powrie, 1986), a rotation of the wall
about its toe was observed in the cantilever excavation stage.
A maximum incremental prototype cantilever wall deflection
of about 10 mm was inferred at the wall crest (0?167 mm at
model scale), which is equivalent to 0?2% of average
engineering shear strain in the 45˚ triangular zone behind
the wall (as shown in Figure 17(a)) according to Osman and
Bolton (2004). The settlement trough extends some way
beyond the triangular trough pattern observed by Powrie
(1986). The subsequent stages of excavation involve a deep-
seated soil flow mechanism (shown in Figures 17(b) and 17(c))
1060 600
0Before excavation
Total pressure: kPa Total pressure: kPa
H = 2.2 mH = 3.6 mH = 5.5 m
0Ko pressurebeforeexcavationRankinepressurefor H = 5.5 massumingundrainedconditions
0180 120
(a) (b)
120 180
2
4
6
8
10
2
4
6
8
Dep
th: m
Figure 13. Distribution of total pressure on: (a) excavation side;
(b) retained side
Total earth pressure simulated by heavy fluidKp lineKa line
1.2
1.0
0.8
0.6
0.4
0.2
01.00.80.60.4
(a)h/Hf
h/Hf
0.20
0
0.5
1.0
2.0
3.0
2.5
1.5
1.00.80.60.4
(b)
0.20
Ear
th p
ress
ure
coef
ficie
nt, K
Nor
mal
ised
hor
izon
tal s
tress
sh/s
ho
Actual total earth pressurein front of wall at final excavation level
Figure 14. Variation of (a) normalised horizontal earth pressure
and (b) earth pressure coefficient with normalised excavation depth
0StartH = 0.4 m
H = 4.4 mH = 5.4 mAfter 3 h
2nd prop
1st propH = 0.8 m
H = 1.8 mH = 3.0 m
2
4
6
8
100
Dep
th: m
50Bending moment: kN m/m
–50–100–200 –150
Figure 15. Development of bending moment
International Journal of Physical Modelling in GeotechnicsVolume 12 Issue 1
A new apparatus for modellingexcavationsLam, Elshafie, Haigh and Bolton
35

and bulging of the retaining wall below the lowest level of
struts. The maximum incremental lateral wall displacements
for the second and the third stages were 30 mm and 90 mm
(0?5 mm and 1?5 mm at model scale), respectively. These
movements were, respectively, equivalent to about 0?6% and
1?5% of average incremental engineering shear strain within
the deformation zone, according to Bolton et al. (2008). These
findings emphasise the importance of soil stiffness measured
prior to failure, when attempting to predict the deformations
around multi-propped excavations.
The development of the settlement profile in Figure 16 is
characterised by the development of a deep settlement trough
near the wall. It is also consistent with the observation of
Clough and O’Rourke (1990) that the settlement trough of a
multi-propped excavation is bounded by a trapezoidal zone
extending up to two times the maximum excavation depth. It is
also noted that the area swept by the retaining wall is roughly
equal to the area underneath the settlement trough, consistent
with zero volumetric strain in the undrained conditions of
rapid excavation in clay.
9. Conclusions
Centrifuge model tests of excavations in lightly over-
consolidated clay were carried out using a newly developed
actuation system which could simulate a realistic sequence of
excavation and propping. The new method provides appro-
priate initial ground conditions before excavation starts, so
that no pre-excavation bending moments develop during
reconsolidation. The actual removal of soil also enables the
realistic, progressive development of passive resistance on the
excavation side. The previously favoured centrifuge modelling
technique of draining heavy fluid as a substitute for soil
removal suffers from the introduction of pre-excavation
lateral wall movements and bending moments, and also
imposes a constant earth pressure coefficient of unity in the
zone of excavation, which distorts the responses of model
retaining systems. Nevertheless, the simple techniques such as
draining of heavy fluid would offer a quick and easy
alternative modelling technique though compromising a
certain degree of accuracy, whereas an in-flight excavator
required demanding efforts and resources in the development
of equipment.
0 0Wall displacement: mm Distance behind wall: m
Gro
und
settl
emen
t: m
m
2 4 6 8
0
2
4
6
8
10
10 12120
100
80
60LVDTStartH = 0.96 m
H = 2.16
H = 4.32 mH = 5.14 m
40
20
0
12
14
16–120 –80 –40
2nd prop
3rd prop
1st prop
Dep
th: m
Figure 16. Development of lateral wall displacement and ground
surface settlement during excavation
(a) (b) (c)
Figure 17. Incremental deformation mechanism observed for
different stages of excavation (length of vectors not to scale):
(a) cantilever stage; (b) prop installed at crest; (c) multi-propped
stage
International Journal of Physical Modelling in GeotechnicsVolume 12 Issue 1
A new apparatus for modellingexcavationsLam, Elshafie, Haigh and Bolton
36
The performance of a typical model excavation procedure was
monitored using a variety of instruments. Changes in prop
loads, pore pressures, total earth pressures, ground settlements
and bending moments on the retaining wall were successfully
demonstrated. Results confirm that stiffer retaining systems
attract higher apparent earth pressure than a flexible retaining
system. Negative excessive pore water pressures induced by
excavation were smaller than might have been expected from
purely elastic unloading. This was attributed to positive pore
pressure increments generated from shearing the soft soil;
these ultimately alter the drained swelling response. In
addition, the development of bending stresses in the retaining
wall was obtained in both the short and long term. Finally,
and most usefully, digital image analysis using the PIV
technique enabled the development of the complete soil
deformation mechanism to be displayed as an incremental
process dependent on the propping conditions applicable
during each stage of excavation. The accuracy of PIV in
determining the development of lateral wall movements and
ground settlements was cross-checked by the use of LVDTs,
and plane strain test conditions were confirmed. The observed
deformation mechanisms confirm that a potentially damaging
settlement trough could develop in the retained soil well
before the mobilisation of peak soil strength, and well before
failure of the retaining wall. The practical importance of
knowing the soil stiffness prior to failure is therefore
emphasised. Quick and efficient methods of predicting ground
movements, based on such observed deformation mechan-
isms, are becoming available (Bolton et al., 2008; Lam and
Bolton, 2011).
AcknowledgementsThe authors would like to thank all staff at the Schofield
Centre, and especially the technicians, Steve Chandler, John
Chandler, Richard Adams, Kristian Pether and Chris
McGinnie for their help with the experimental set-up. The
authors would also like to acknowledge the Platform grant
(GR/T18660/01) awarded by the UK Engineering and Physical
Sciences Research Council.
REFERENCES
Azevedo RF (1983) Centrifuge and Analytical Modelling of
Excavation in Sand. PhD thesis, University of Colorado,
Boulder, CO, USA.
Bolton MD and Powrie W (1987) The collapse of
diaphragm walls retaining clay. Geotechnique 37(3): 335–
353.
Bolton MD, Lam SY and Osman AS (2008) Supporting
excavations in clay – from analysis to decision-
making. Special Lecture. Proceedings of the 6th
International Symposium of Geotechnical Aspects of
Underground Construction in Soft Ground, Shanghai,
pp. 15–28.
Clough GW and O’Rourke TD (1990) Construction
induced movements of in situ walls. In Design and
Performance of Earth Retaining Structures (Lambe P
and Hansesn LA (eds)). ASCE, New York, NY, USA,
Geotechnical Special Publication no. 25, pp. 439–
470.
Goldberg DT, Jaworski WE and Gordon MD (1976) Lateral
Support Systems and Underpinning. Federal Highway
Administration, Washington, DC, USA, Report FHWA-
RD-75–128.
Haigh SK, Houghton NE, Lam SY, Li Z and Wallbridge PW (2010)
Development of a double-axis servo-actuator for novel
centrifuge modeling. Proceedings of ICPMG 2010, Zurich,
Switzerland, pp. 239–244.
Hashash YMA and Whittle AJ (2002) Mechanisms of load
transfer and arching for braced excavations in clay. Journal
of Geotechnical and Geoenvironmental Engineering, ASCE
128(3): 187–197.
Jamiolkowski M, Ladd CC, Germaine JT and Lancellotta R (1985)
New developments in field and laboratory testing of
soils. Proceedings of the 11th ICSMFE, San Francisco, CA,
USA, vol. 1, pp. 57–153.
Kimura T, Takemura J, Hiro-pka A, Suemasa N and Kouda N
(1993) Stability of unsupported and supported vertical cuts
in soft clay. Proceedings of the 11th SEAGC, Singapore,
pp. 61–70.
Lam SY and Bolton MD (2011) Energy conservation as a
principle underlying mobilizable strength design for deep
excavations. Journal of Geotechnical and Geoenvironmental
Engineering, ASCE 137(11): 1062–1074.
Loh CK, Tan TS and Lee FH (1998) Three dimensional excavation
tests in the centrifuge. Proceedings of Centrifuge 98, Tokyo,
Japan, pp. 649–652.
Lyndon A and Schofield AN (1970) Centrifuge model test of
short term failure in London clay. Geotechnique 20(4): 440–
442.
Madabhushi SPG, Houghton NE and Haigh SK (2006) A new
automatic sand pourer for model preparation at University
of Cambridge. Proceedings of ICPMG 2006, Hong Kong,
pp. 217–222.
Osman AS and Bolton MD (2004) A new design method for
retaining walls in clay. Canadian Geotechnical Journal
41(3): 453–469.
Peck RB (1969) Deep excavation and tunnelling in soft ground.
Proceedings of the 7th ICSMFE, State-of-the-art Volume,
Mexico City, Mexico, pp. 225–290.
Powrie W (1986) The Behavior of Diaphragm Walls in Clay.
PhD thesis, University of Cambridge, UK.
Richards DJ and Powrie W (1998) Centrifuge model tests
on doubly propped embedded retaining walls in over-
consolidated kaolin clay. Geotechnique 48(6): 833–
846.
International Journal of Physical Modelling in GeotechnicsVolume 12 Issue 1
A new apparatus for modellingexcavationsLam, Elshafie, Haigh and Bolton
37

Richards DJ, Clark J and Powrie W (2006) Installation effects of a
bored pile wall in overconsolidated clay. Geotechnique
56(6): 411–425.
Takemura J, Kondoh M, Esaki T, Kouda and M Kusakabe (1999)
Centrifuge model tests on double propped wall
excavation in soft clay. Soils and Foundations 39(3): 75–
87.
Zhao Y, Gafar K, Elshafie MZEB et al. (2006) Calibration and use
of a new automatic sand pourer. Proceedings of ICPMG
2006, Hong Kong, pp. 265–270.
WHAT DO YOU THINK?
To discuss this paper, please email up to 500 words to the
editor at [email protected]. Your contribution will be
forwarded to the author(s) for a reply and, if considered
appropriate by the editorial panel, will be published as
discussion in a future issue of the journal.
International Journal of Physical Modelling in Geotechnics
relies entirely on contributions sent in by civil engineering
professionals, academics and students. Papers should be
2000–5000 words long (briefing papers should be 1000–
2000 words long), with adequate illustrations and refer-
ences. You can submit your paper online via www.icevir-
tuallibrary.com/content/journals, where you will also find
detailed author guidelines.
International Journal of Physical Modelling in GeotechnicsVolume 12 Issue 1
A new apparatus for modellingexcavationsLam, Elshafie, Haigh and Bolton
38