a new approach to property valuation using remote sensing
TRANSCRIPT

A New Approach to Property Valuationusing Remote Sensing Data andMachine Learning in Kigali, Rwanda
Jonathan Bower, International Growth Center (IGC)Felix Bachofer, German Aerospace Center (DLR)Andreas Braun, University of TuebingenPaul Brimble, Rwanda Ministry of Finance & Economic Planning (MINECOFIN)Patrick McSharry, Carnegie Mellon University (CMU)
1

- Country and Policy Context- State of the Art- Methodology- EO Data / Geospatial Data- Results- Policy uses of the Model- Outlook
Contents
2Kigali, Rwanda

Context: the importance of landvaluation in Kigali● Rwanda is one of most densely populated countries in Africa● Rwanda urbanising from a low base of 16.5% (Census 2012),
predicted to grow fast to 30% by 2032. 1.7m ⇒ 4.9m● Kigali is the primary city (popn. 1.1m - Census 2012, likely
1.5m in 2018), ten times the second largest city● Rwanda had low land taxes which recently increased: new
property tax law, comes into force on 1st January 2019● Along with Rwanda’s good land governance, the new tax law
may represent an opportunity to generate municipal revenue.● To calculate revenue potential, and to regulate tax collection,
Rwanda needs a cost-effective, corruption-proofvaluation method. This study proposes one.
3

Policy context of this study● Demand for this study comes from:
• Ministry of Finance and Economic Planning (MINECOFIN)• Rwanda Revenue Authority,• City of Kigali (because they will receive municipal
revenues)• Ministry of Infrastructure and Rwanda Land Management
Authority (kindly provided land transactions data)● The valuation model may be used to regulate tax collection by
checking model estimates of property values against self-declared property values and triggering an inspection bythe Institute of Real Property Valuers (IRPV) if there is alarge inconsistancy
● The model will also be able to estimate the revenue potentialof the new tax using the valuation estimates
4

State of the Art● 25 papers used spatial characteristics to predict land values,
house values, or combined house and land values (the dependentvariable)
● 16 of these papers studied cities in USA or Europe; othercountries covered included China, United Arab Emirates, South Korea and Malaysia; not Africa except:− One World Bank paper did study Kigali using building heights
● They varied greatly in the number and range of characteristicsused as independent variables
● Our study is novel because it: covers rapidly growing city in Africa, uses range of spatial characteristics, uses innovative buildingfootprint dataset (more later), uses machine learning approach andhas interesting potential policy application
5

Inside red boundary: High-resolution area with a Pleiades Satellite scene from 09.08.2015Outside red boundary: Low-resolution area with RapidEye satellite images
Study Area
6

Methodological approach
EO derivation of urban morphology, Geospatial analysis & Statistical data preparation
Data Cleansing: selecting transactions for statistical learning
Cross-validation: ensuring the approach identifies a parsimoniousmodel and can generalise to new plots
Feature selection: identifying a subset of features by accountingfor both relevance and redundancy (mRMR - Minimum Redundancy Maximum Relevance)
Model construction: estimating a model with statisticallysignificant parameters (OLS – Ordinary Least Squares)
7
Statistical data
8
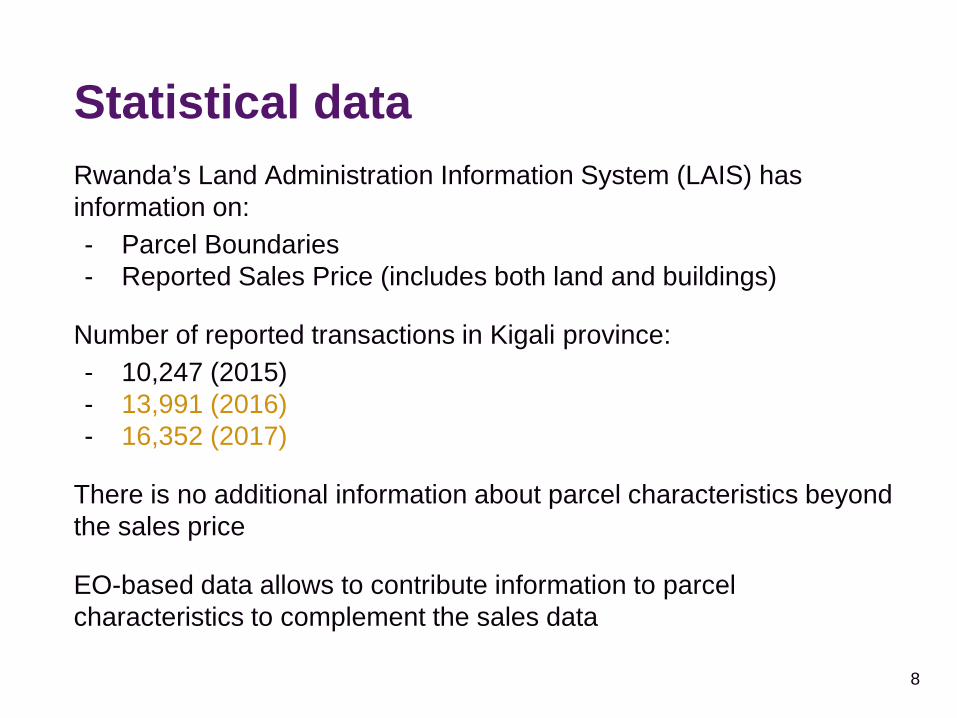
Rwanda’s Land Administration Information System (LAIS) has information on:- Parcel Boundaries- Reported Sales Price (includes both land and buildings)
Number of reported transactions in Kigali province: - 10,247 (2015)- 13,991 (2016)- 16,352 (2017)
There is no additional information about parcel characteristics beyond the sales price
EO-based data allows to contribute information to parcel characteristics to complement the sales data
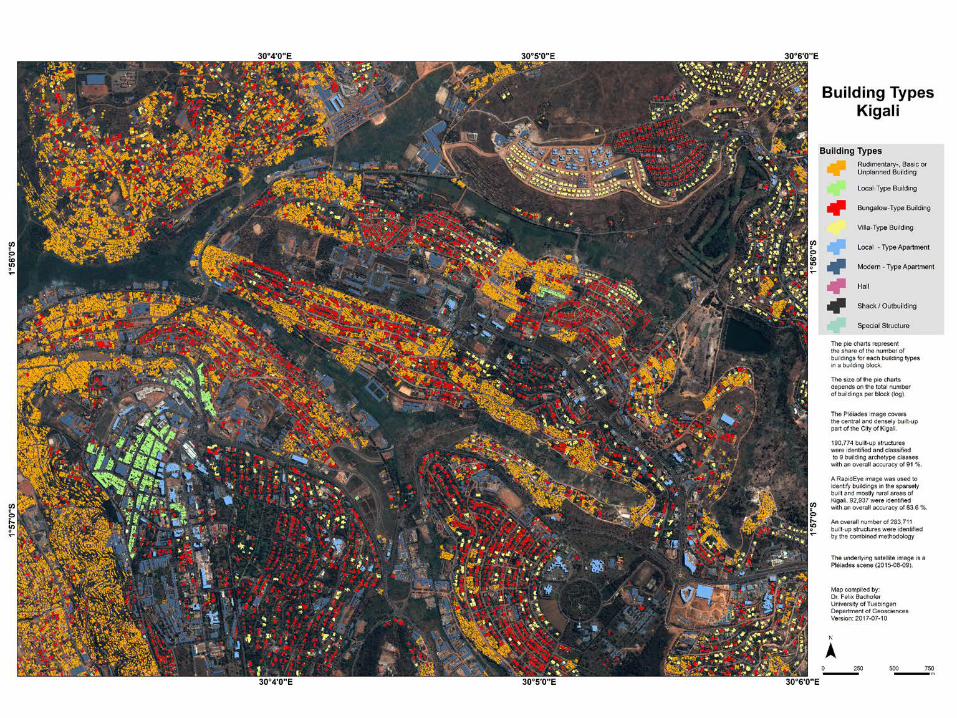
EO-based building typology
9

10

1111

1212

Geospatial dataAdministrative units (parcels, blocks, villages, cells, sectors)Land use and zoning according to the Kigali City Master PlanInfrastructures (schools, markets, bus stops, markets)
Spatial data was provided by● Kigali construction and urban planning One Stop Centre● Ministry of Infrastructure Rwanda (MININFRA)● National Institute for Statistics (NISR)● Open Street Map
13

Spatial data processing
For each parcel, block, village, cell and sector (administrative units):● number of building types and their spatial share● spatial share of land-use / zoning● mean distance to schools, markets, bus stops, markets● changes regarding the buildings between 2008/09 and 2015● mean distance between the buildings within each unit● topographic parameters (elevation, slope, topographic position…)
14

Data Preparation
Pre-filtering rules for selecting transactions that will be used in theanalysis:
PPSM > 500 RWFPPSM < 10,000,000 RWFDeviation between transaction and parcel area of less than 1%
Transactions from 2015 were employed for estimating the models.
Feature selection by maximising relevance and minimising redundancy(mRMR) and ensuring statistical significance.
15

Feature Selection
Graph shows 10-fold cross-validated performance of linear models versus number of features. Selection of 18 features was optimal offering a compromise between accuracy and complexity.
16

Feature DescriptionsStructural Variables:- Building volume*, building footprint, parcel perimeter
Locational Variables:- Distances to roads, bus stops and public transport
Land Use Variables:- Residential land use
Neighbourhood Variables:- Block level urban structure type and bungalow density- Block level vegetation and agricultural areas- Cell level zoning of single family residential parcels- Village level of bungalow building footprints
*Volume calculated by determining building type and using the average height
17

Results for 2015The 18 features selected by MRMR were then considered for furtherrefinement.
Stepwise regression was used toremove features that had parametervalues that were not statisticallysignificant.
18
This resulted in a linear model with 17 features with the same adjusted R² of 0.62.
This model had a MAE of 0.58 and a RMSE of 0.77 for 2015 data.
Predictions versus Actuals

19
Results
19

Temporal Trend
20
A total of 19,516 transactions were available over multiple years as shown below:
An upward trend in price per square metre is evident
Year 2015 2016 2017 2018
Number of transactions
4733 5882 6037 2864
Average price, RWF 22374526 28497032 20816386 23996893
Average price/m2, RWF
34681 36670 38118 40032

Forecast Accuracy
The forecast accuracy decreases with each additional year awayfrom the training year of 2015.
The MAE was found to increase an average of 7% per year.
Including the trend improves the forecast accuracy by reducing theMAE.
21
Policy uses of the model (1 of 2)Fraud detection● When a property owner declares a parcel value, this can be
cross-checked against value from model. If difference isgreater than a certain percentage this triggers a double-inspection:○ A check whether a key local-level variable changed that
reduced the property value according to the model sincethe building footprint dataset was collected
○ Institute of Real Property Valuers can also inspect theproperty using their traditional valuation methods (can bemore accurate, more expensive, human error)
○ After this, we will know better if this case is a fraud
22

Policy uses of the model (2 of 2)
Calculating revenue potential of the new property tax● The Government of Rwanda is interested to know whether the
new property tax is likely to raise more municipal revenue thanthe previous tax
● The property valuation estimates in this model, combined withownership data, will be used to estimate this
23

24
Training data. Example of10°Rotation of all entities.
• Reduce manual effort: Convolutional Neural Networks (CNN)
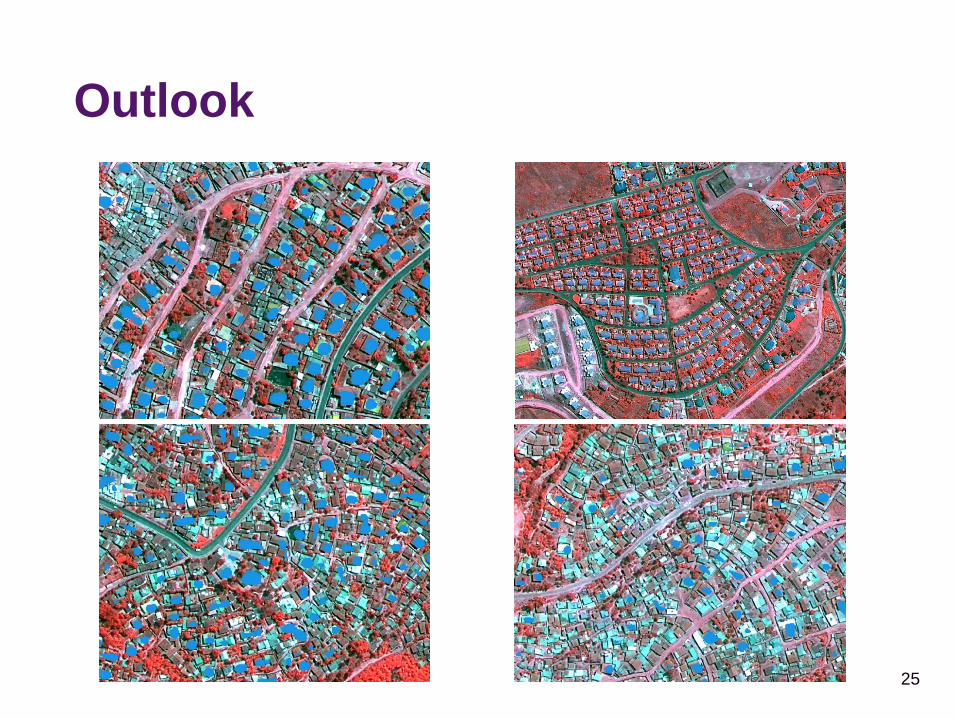
Outlook• Updated building footprint data for Kigali (WV 2018) can be plugged
into the model, to generate updated property price predictions• Submitted proposal to WorldBank Data Initiative
25
Outlook

Conclusions• Transactions from 2015 used to construct a predictive model
based on a range of features.• Feature selection combined with statistical significance yielded
a model with 17 features.• MAE was 0.58 and this measure of forecast accuracy decrease,
on average, by 6.5% with each additional year of the forecasthorizon.
26
• Extracting and including thetemporal trend was found toimprove the forecast accuracy.

International Growth CentreLondon School of Economics
and Political ScienceHoughton Street
London WC2 2AE
www.theigc.org
27
Contact Details:
Jonathan Bower
Country Economist (Urbanisation) | RwandaInternational Growth [email protected]
Dr. Felix Bachofer
Senior ResearcherGerman Aerospace Center (DLR)Land Surface Dynamics (LAX)[email protected]
Study was co-funded by:
FKZ: 01LG1301K