a new evaluation of seismic hazard for the central america...
TRANSCRIPT
PROJECT RESIS II
A new evaluation of Seismic Hazard for
the Central America Region in the frame of the
RESIS II Project.
Mª Belén Benito, Wilfredo Rojas, Alvaro Climent, Enrique Molina,
Griselda Marroquin, EmilioTalavera, José Jorge Escobar,
Eduardo Camacho, Conrad Lindholm
Introduction
Seismotectonic
context
Methodology
INPUTS
Catalogue
Zonation
Atenuattion
Hazard
estimation
Results
Conclusions
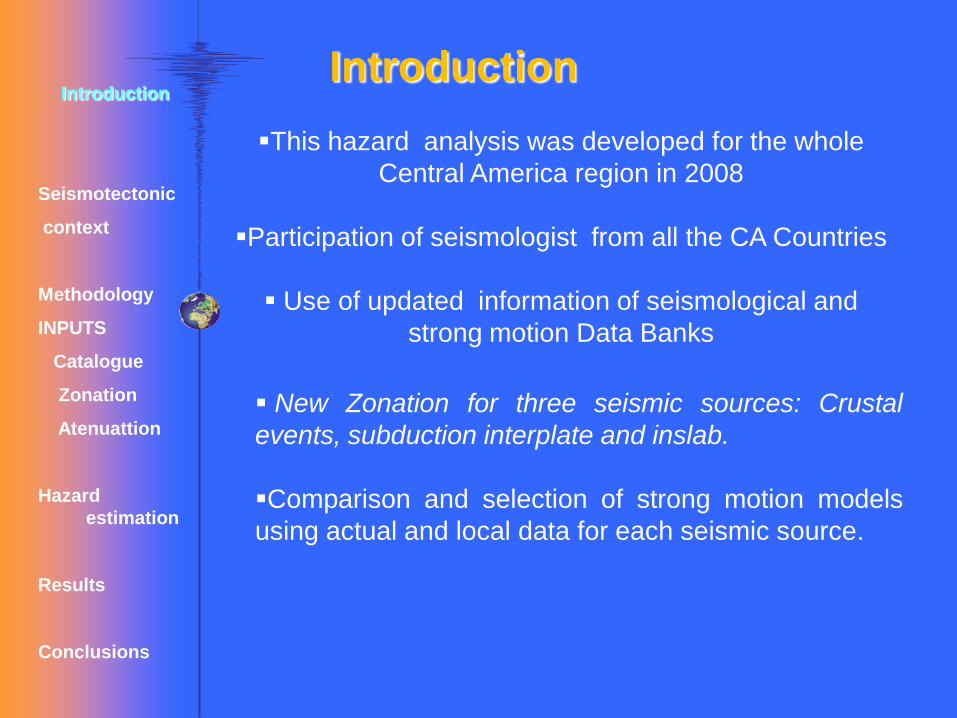
Introduction
New Zonation for three seismic sources: Crustal
events, subduction interplate and inslab.
Comparison and selection of strong motion models
using actual and local data for each seismic source.
This hazard analysis was developed for the whole
Central America region in 2008
Participation of seismologist from all the CA Countries
Use of updated information of seismological and
strong motion Data Banks
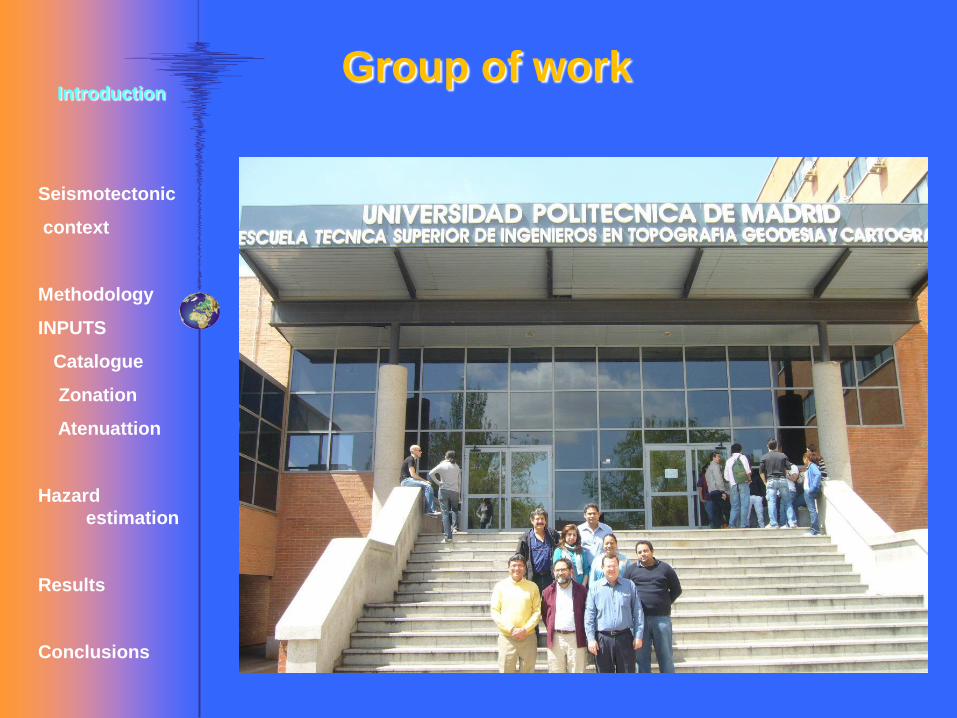
Group of workIntroduction
Seismotectonic
context
Methodology
INPUTS
Catalogue
Zonation
Atenuattion
Hazard
estimation
Results
Conclusions

Subduction zone
Coco’s Caribe plates
Earthquakes with high
magnitude and epicenters
offshore
Local faults aligned with the
volcanic chain
Earthquakes with moderate
magnitude, surface depth and
epicenters near of population
centers. More damaging earth.
Noth American Caribe
system faults:
Chixoy- Polochic -Motagua
Seismotectonic contex
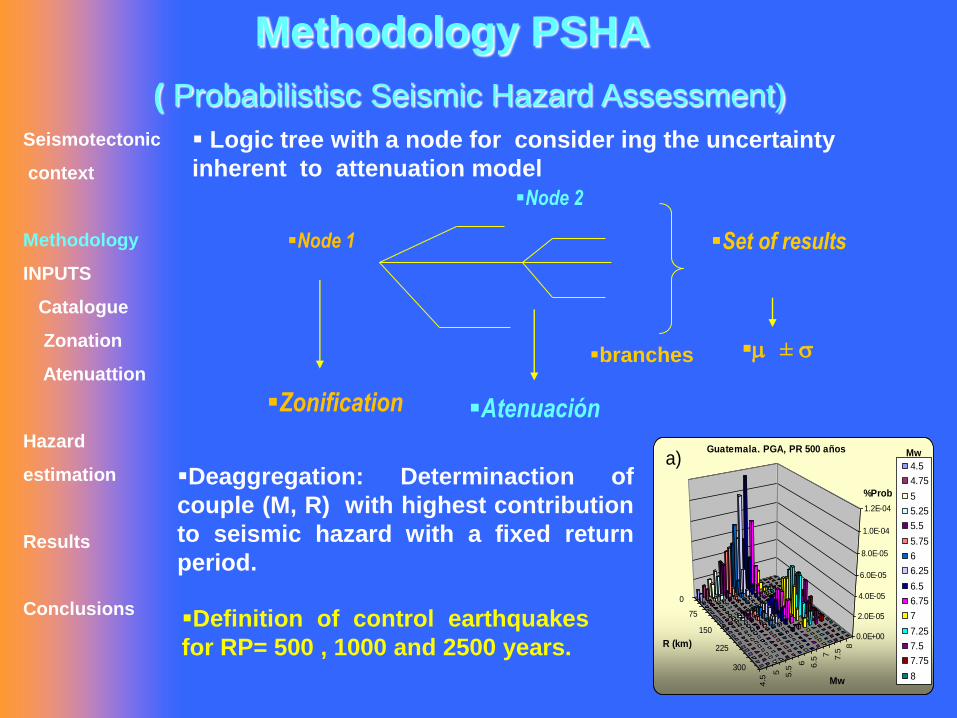
Methodology PSHA
( Probabilistisc Seismic Hazard Assessment)
Logic tree with a node for consider ing the uncertainty
inherent to attenuation model
Deaggregation: Determinaction of
couple (M, R) with highest contribution
to seismic hazard with a fixed return
period.
0
75
150
225
300
4.5
5 5.5
6 6.5
7 7.5
8
0.0E+00
2.0E-05
4.0E-05
6.0E-05
8.0E-05
1.0E-04
1.2E-04
%Prob
R (km)
Mw
Guatemala. PGA, PR 500 años
4.5
4.75
5
5.25
5.5
5.75
6
6.25
6.5
6.75
7
7.25
7.5
7.75
8
Mw
0
75
150
225
300
4.5
5 5.5
6 6.5
7 7.5
8
0.0E+00
2.0E-05
4.0E-05
6.0E-05
8.0E-05
1.0E-04
1.2E-04
%Prob
R (km)
Mw
Guatemala. SA(1.0s), PR 500 años
4.5
4.75
5
5.25
5.5
5.75
6
6.25
6.5
6.75
7
7.25
7.5
7.75
8
Mw
0
75
150
225
300
4.5
5 5.5
6 6.5
7 7.5
8
0.0E+00
5.0E-06
1.0E-05
1.5E-05
2.0E-05
2.5E-05
3.0E-05
3.5E-05
%Prob
R (km)
Mw
Guatemala. SA(1.0s), PR 2500 años
4.5
4.75
5
5.25
5.5
5.75
6
6.25
6.5
6.75
7
7.25
7.5
7.75
8
Mw
0
75
150
225
300
4.5
5 5.5
6 6.5
7 7.5
8
0.0E+00
5.0E-06
1.0E-05
1.5E-05
2.0E-05
2.5E-05
3.0E-05
3.5E-05
%Prob
R (km)
Mw
Guatemala. PGA, PR 2500 años
4.5
4.75
5
5.25
5.5
5.75
6
6.25
6.5
6.75
7
7.25
7.5
7.75
8
Mw
a) b)
c) d)
Definition of control earthquakes
for RP= 500 , 1000 and 2500 years.
Node 1
Node 2
branches
Set of results
m ± s
Zonification Atenuación
Seismotectonic
context
Methodology
INPUTS
Catalogue
Zonation
Atenuattion
Hazard
estimation
Results
Conclusions
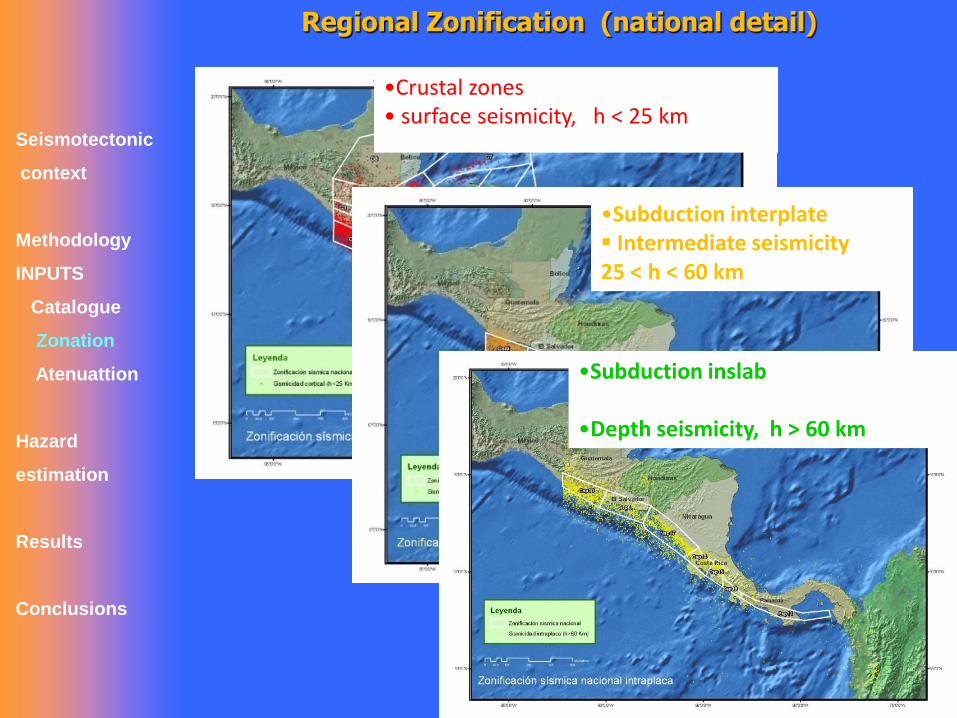
Regional Zonification (national detail)
•Crustal zones• surface seismicity, h < 25 km
•Subduction interplate Intermediate seismicity 25 < h < 60 km
•Subduction inslab
•Depth seismicity, h > 60 km
Seismotectonic
context
Methodology
INPUTS
Catalogue
Zonation
Atenuattion
Hazard
estimation
Results
Conclusions
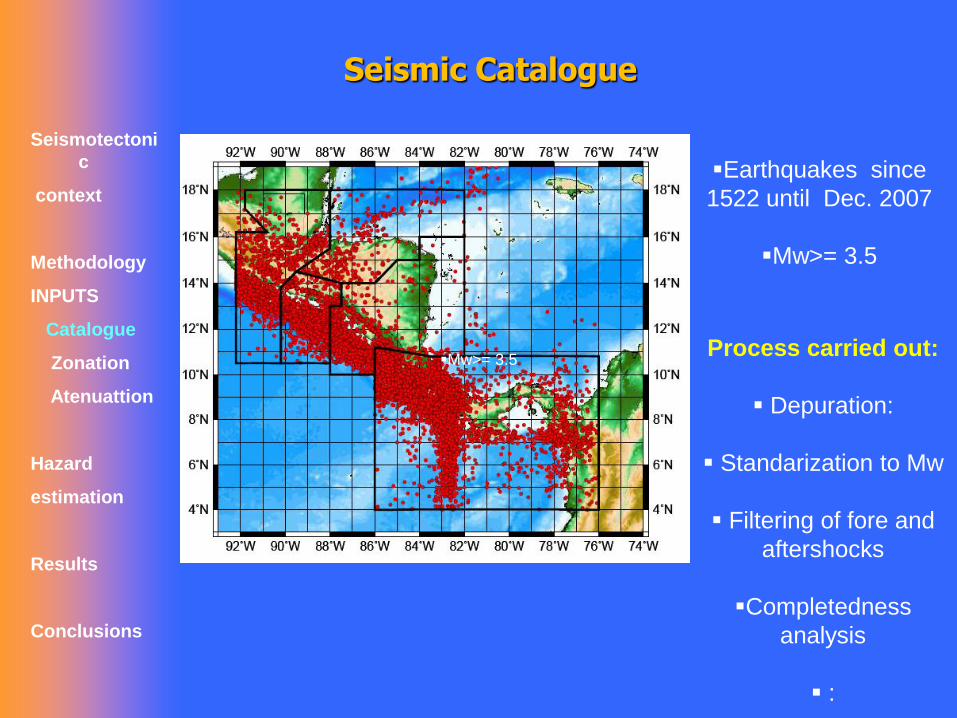
Seismic Catalogue
Earthquakes since
1522 until Dec. 2007
Mw>= 3.5
Process carried out:
Depuration:
Standarization to Mw
Filtering of fore and
aftershocks
Completedness
analysis
:
Mw>= 3.5
Seismotectoni
c
context
Methodology
INPUTS
Catalogue
Zonation
Atenuattion
Hazard
estimation
Results
Conclusions
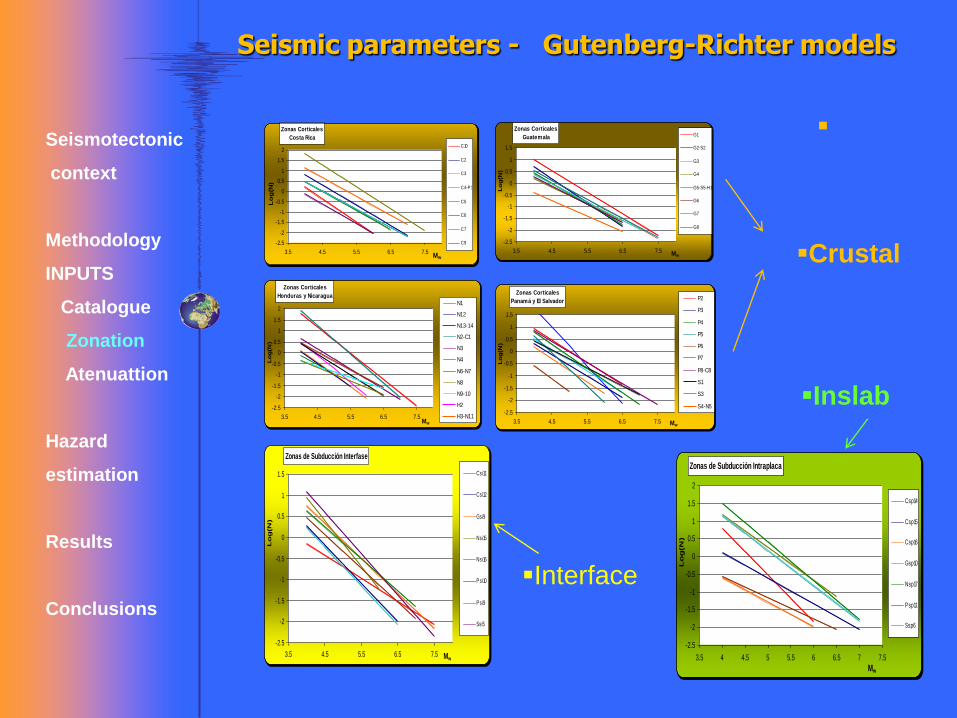
Seismic parameters - Gutenberg-Richter models
Zonas Corticales
Costa Rica
-2.5
-2
-1.5
-1
-0.5
0
0.5
1
1.5
2
3.5 4.5 5.5 6.5 7.5Mw
Lo
g(N
)
C10
C2
C3
C4-P1
C5
C6
C7
C9
Zonas Corticales
Honduras y Nicaragua
-2.5
-2
-1.5
-1
-0.5
0
0.5
1
1.5
2
3.5 4.5 5.5 6.5 7.5Mw
Lo
g(N
)
N1
N12
N13-14
N2-C1
N3
N4
N6-N7
N8
N9-10
H2
H3-N11
Zonas Corticales
Guatemala
-2.5
-2
-1.5
-1
-0.5
0
0.5
1
1.5
3.5 4.5 5.5 6.5 7.5 Mw
Lo
g(N
)
G1
G2-S2
G3
G4
G5-S5-H1
G6
G7
G8
Zonas Corticales
Panamá y El Salvador
-2.5
-2
-1.5
-1
-0.5
0
0.5
1
1.5
3.5 4.5 5.5 6.5 7.5 Mw
Lo
g(N
)
P2
P3
P4
P5
P6
P7
P8-C8
S1
S3
S4-N5
Zonas de Subducción Interfase
-2.5
-2
-1.5
-1
-0.5
0
0.5
1
1.5
3.5 4.5 5.5 6.5 7.5 Mw
Lo
g(N
)
Csi11
Csi12
Gsi9
Nsi15
Nsi16
Psi10
Psi9
Ssi5
Zonas de Subducción Intraplaca
-2.5
-2
-1.5
-1
-0.5
0
0.5
1
1.5
2
3.5 4 4.5 5 5.5 6 6.5 7 7.5
Mw
Lo
g(N
)
Csp14
Csp15
Csp16
Gsp10
Nsp17
Psp11
Ssp6
Crustal
Interface
Inslab
Seismotectonic
context
Methodology
INPUTS
Catalogue
Zonation
Atenuattion
Hazard
estimation
Results
Conclusions
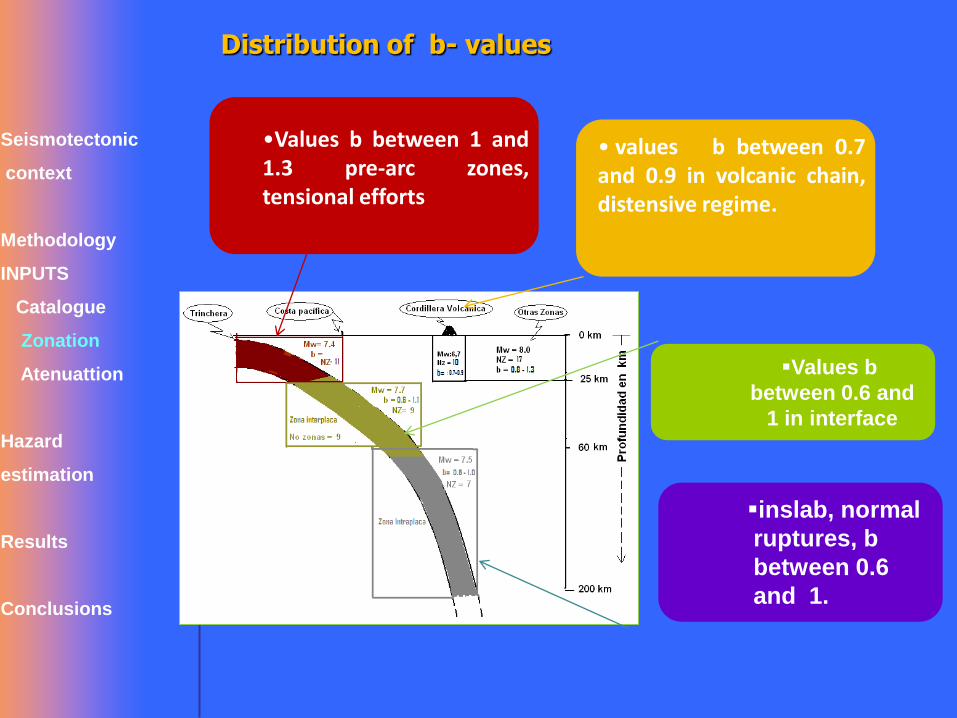
Values b
between 0.6 and
1 in interface
Distribution of b- values
•Values b between 1 and1.3 pre-arc zones,tensional efforts
• values b between 0.7and 0.9 in volcanic chain,distensive regime.
inslab, normal
ruptures, b
between 0.6
and 1.
Seismotectonic
context
Methodology
INPUTS
Catalogue
Zonation
Atenuattion
Hazard
estimation
Results
Conclusions

Attenuation
Identification of the suitable GM models
model Data BaseComponent
used (PGA, Sa)sources
Dist. (km)
Mw
Youngs et al.(1997)
(YOUN97)Mundial
Media geométrica
Interplaca Intraplaca
500 5,0 - 8.2
Atkinson y Boore 2003
(AYB03)Mundial
Las dos horizontals (Aleatoria)
Interplaca Intraplaca
10-400 5,0 - 8,3
Garcia et al.(2005)
(GAR05)México
Media cuadrática
Intraplaca 4 - 400 5,2 – 7,4
Cepeda et al.(2004) (CEP04)
El Salvador Aleatoria
Media geométrica
Intraplaca Corteza Superficial
10 –400
0-100
5,0 – 8,35,1 – 7,2
Climent et al.1994 (CLI94)
América Central and México
Mayor de las horizontales
Interplaca Corteza superficial
5 - 400 4,0 - 8,0
Zhao et al.(2006)(ZH06)
JapónMedia
geométrica
InterplacaIntraplaca Corteza
superficial10-300 5,0 – 8,2
Spudich et al.(1999) (SEA99)
MundialMedia
geométricaCorteza superficial 0 - 100 5,1 – 7,2
Schmidt et al.(1997)
(SCH97)
Mayor de lashorizontales
Corteza superficial 6 - 200 3,7 – 7,6
Seismotectonic
context
Methodology
INPUTS
Catalogue
Zonation
Atenuattion
Hazard
estimation
Results
Conclusions

Youngs et al., 1997
-3
-2
-1
0
1
2
3
0 100 200 300 400 500
Distancia (km)
Re
sid
uo
s
Atkinson y Boore, 2003
-3
-2
-1
0
1
2
3
0 100 200 300 400 500
Distancia (km)
Re
sid
uo
s
Climent et al., 1994
-3
-2
-1
0
1
2
3
0 100 200 300 400 500
Distancia (km)
Re
sid
uo
s
Zhao et al., 2006
-3
-2
-1
0
1
2
3
0 100 200 300 400 500
Distancia (km)
Re
sid
uo
s
Calibration of models with local data ( ID-02-0143)
Residual analysis (r = Ln GM* - Ln GM)
Seismotectonic
context
Methodology
INPUTS
Catalogue
Zonation
Atenuattion
Hazard
estimation
Results
Conclusions

Selected attenuation models :
Crustal, interface, inslab
0.001
0.01
0.1
1
1 10 100 1000
Distancia (km)
PG
A (
g)
Zhao et al., 2006
Climent et al., 1994
PGA
0.001
0.01
0.1
1
10 100 1000
Distancia (km)
PG
A (
g)
Youngs et al., 1997
0.001
0.01
0.1
1
10
10 100 1000
Distancia (km)
PG
A (
g)
Zhao et al., 2006
Youngs et al., 1997
PGA
Mw 7.0
Mw 6.0
Mw 5.0
Crustal: Climent et al (1994)
Zhao et al, (2006)
Subduction interface:
Youngs et al (1997 )
Subduction inslab:
Youngs et al
Zhao et al (2006)
Seismotectonic
context
Methodology
INPUTS
Catalogue
Zonation
Atenuattion
Hazard
estimation
Results
Conclusions
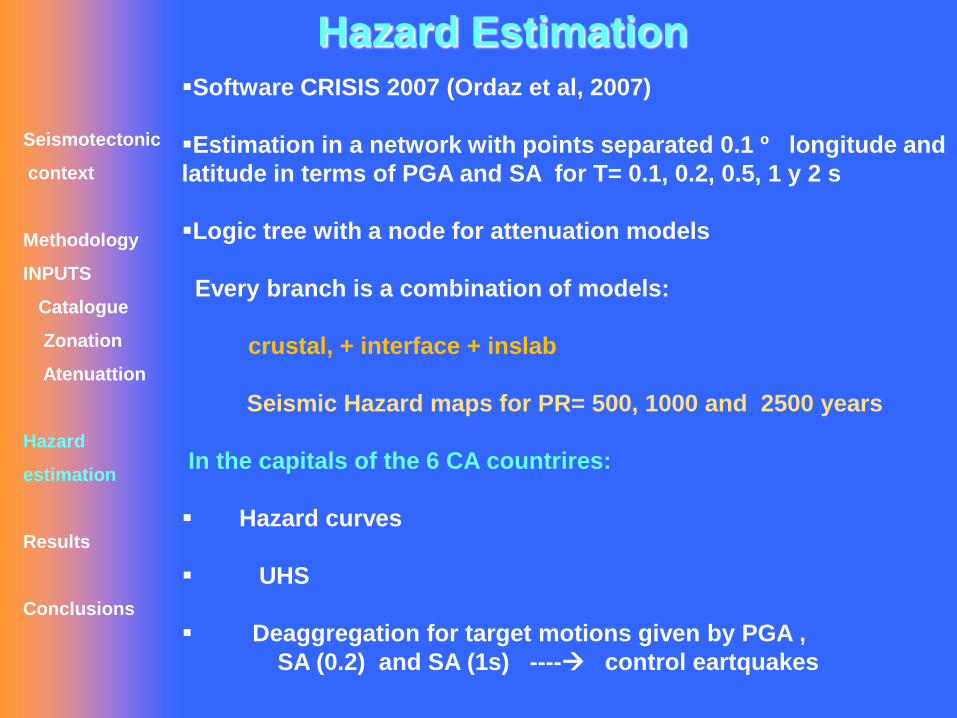
Hazard EstimationSoftware CRISIS 2007 (Ordaz et al, 2007)
Estimation in a network with points separated 0.1 º longitude and
latitude in terms of PGA and SA for T= 0.1, 0.2, 0.5, 1 y 2 s
Logic tree with a node for attenuation models
Every branch is a combination of models:
crustal, + interface + inslab
Seismic Hazard maps for PR= 500, 1000 and 2500 years
In the capitals of the 6 CA countrires:
Hazard curves
UHS
Deaggregation for target motions given by PGA ,
SA (0.2) and SA (1s) ---- control eartquakes
Seismotectonic
context
Methodology
INPUTS
Catalogue
Zonation
Atenuattion
Hazard
estimation
Results
Conclusions
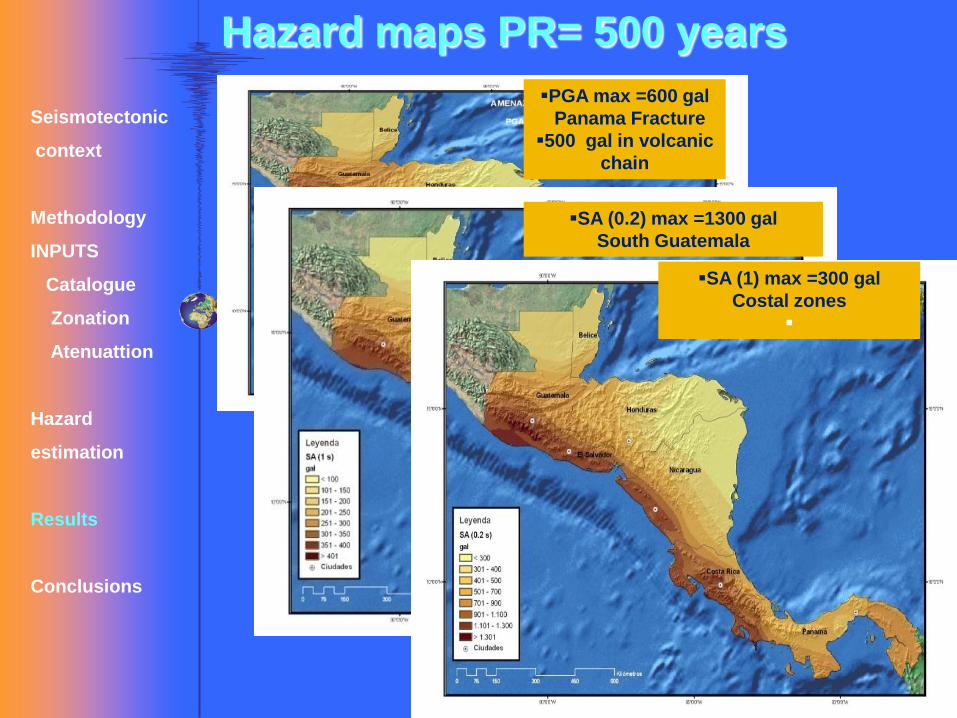
Hazard maps PR= 500 years
PGA max =600 gal
Panama Fracture
500 gal in volcanic
chain
SA (0.2) max =1300 gal
South Guatemala
SA (1) max =300 gal
Costal zones
Seismotectonic
context
Methodology
INPUTS
Catalogue
Zonation
Atenuattion
Hazard
estimation
Results
Conclusions

Hazard Maps RP=1000 years
PGA max =700 gal
Panama Fracture, South
Guatemala and volcanic
chain
SA (0.2) max =1600 gal
Panama Fracture, South
Guatemala and volcanic
chain
SA (1) max =400 gal
Panama Fracture, South
Guatemala and volcanic
chain
Seismotectonic
context
Methodology
INPUTS
Catalogue
Zonation
Atenuattion
Hazard
estimation
Results
Conclusions

HAZARD MAPS PR=2500 years
PGA max = 850 gal
South Guatemala
SA (0.2) max = 2000 gal
South Guatemala
SA (1) max = 500 gal
South Guatemala
Seismotectonic
context
Methodology
INPUTS
Catalogue
Zonation
Atenuattion
Hazard
estimation
Results
Conclusions
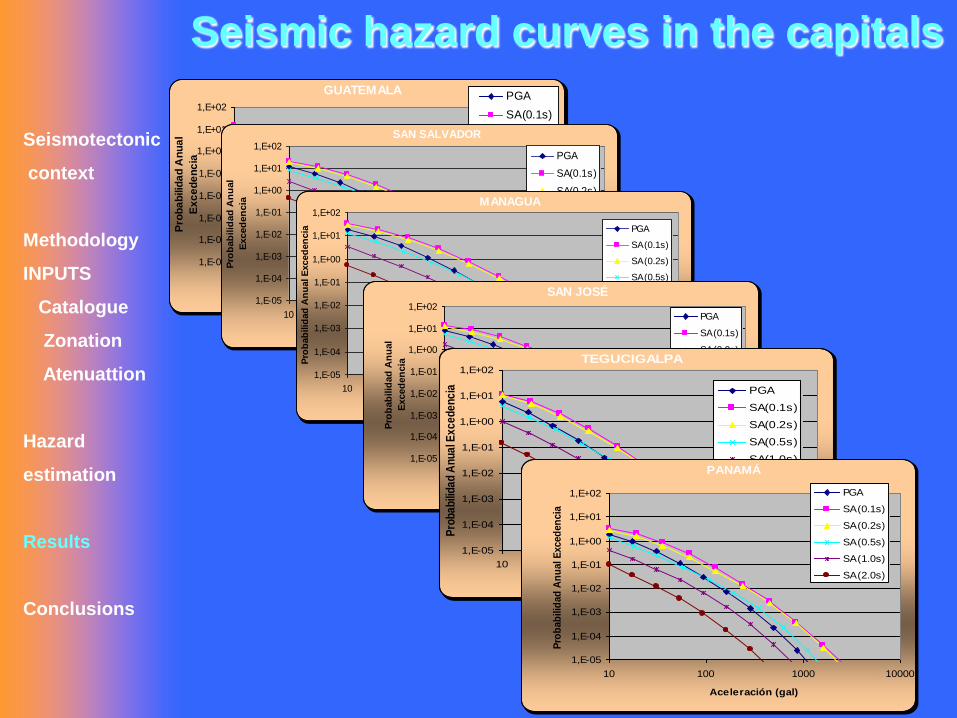
Seismic hazard curves in the capitalsGUATEMALA
1,E-05
1,E-04
1,E-03
1,E-02
1,E-01
1,E+00
1,E+01
1,E+02
10 100 1000 10000
Aceleración (gal)
Pro
ba
bilid
ad
An
ua
l
Ex
ce
de
nc
ia
PGA
SA(0.1s)
SA(0.2s)
SA(0.5s)
SA(1.0s)
SA(2.0s)
SAN SALVADOR
1,E-05
1,E-04
1,E-03
1,E-02
1,E-01
1,E+00
1,E+01
1,E+02
10 100 1000 10000
Aceleración (gal)
Pro
bab
ilid
ad
An
ual
Exced
en
cia
PGA
SA(0.1s)
SA(0.2s)
SA(0.5s)
SA(1.0s)
SA(2.0s)
MANAGUA
1,E-05
1,E-04
1,E-03
1,E-02
1,E-01
1,E+00
1,E+01
1,E+02
10 100 1000 10000
Aceleración (gal2)
Pro
bab
ilid
ad
An
ual E
xced
en
cia PGA
SA(0.1s)
SA(0.2s)
SA(0.5s)
SA(1.0s)
SA(2.0s)
SAN JOSÉ
1,E-05
1,E-04
1,E-03
1,E-02
1,E-01
1,E+00
1,E+01
1,E+02
10 100 1000 10000
Aceleración (gal)
Pro
bab
ilid
ad
An
ual
Exced
en
cia
PGA
SA(0.1s)
SA(0.2s)
SA(0.5s)
SA(1.0s)
SA(2.0s)
TEGUCIGALPA
1,E-05
1,E-04
1,E-03
1,E-02
1,E-01
1,E+00
1,E+01
1,E+02
10 100 1000 10000
Aceleración (gal)
Pro
ba
bili
da
d A
nu
al E
xc
ed
en
cia PGA
SA(0.1s)
SA(0.2s)
SA(0.5s)
SA(1.0s)
SA(2.0s)PANAMÁ
1,E-05
1,E-04
1,E-03
1,E-02
1,E-01
1,E+00
1,E+01
1,E+02
10 100 1000 10000
Aceleración (gal)
Pro
bab
ilid
ad
An
ual E
xced
en
cia
PGA
SA(0.1s)
SA(0.2s)
SA(0.5s)
SA(1.0s)
SA(2.0s)
Seismotectonic
context
Methodology
INPUTS
Catalogue
Zonation
Atenuattion
Hazard
estimation
Results
Conclusions
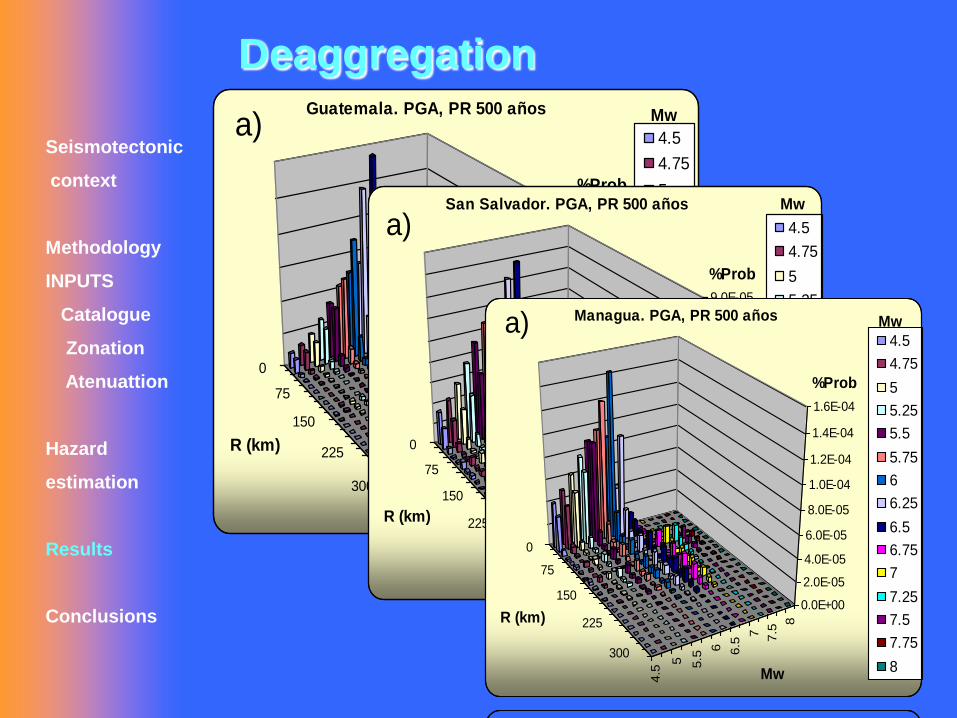
Deaggregation
0
75
150
225
300
4.5
5 5.5
6 6.5
7 7.5
8
0.0E+00
2.0E-05
4.0E-05
6.0E-05
8.0E-05
1.0E-04
1.2E-04
%Prob
R (km)
Mw
Guatemala. PGA, PR 500 años
4.5
4.75
5
5.25
5.5
5.75
6
6.25
6.5
6.75
7
7.25
7.5
7.75
8
Mw
0
75
150
225
300
4.5
5 5.5
6 6.5
7 7.5
8
0.0E+00
2.0E-05
4.0E-05
6.0E-05
8.0E-05
1.0E-04
1.2E-04
%Prob
R (km)
Mw
Guatemala. SA(1.0s), PR 500 años
4.5
4.75
5
5.25
5.5
5.75
6
6.25
6.5
6.75
7
7.25
7.5
7.75
8
Mw
0
75
150
225
300
4.5
5 5.5
6 6.5
7 7.5
8
0.0E+00
5.0E-06
1.0E-05
1.5E-05
2.0E-05
2.5E-05
3.0E-05
3.5E-05
%Prob
R (km)
Mw
Guatemala. SA(1.0s), PR 2500 años
4.5
4.75
5
5.25
5.5
5.75
6
6.25
6.5
6.75
7
7.25
7.5
7.75
8
Mw
0
75
150
225
300
4.5
5 5.5
6 6.5
7 7.5
8
0.0E+00
5.0E-06
1.0E-05
1.5E-05
2.0E-05
2.5E-05
3.0E-05
3.5E-05
%Prob
R (km)
Mw
Guatemala. PGA, PR 2500 años
4.5
4.75
5
5.25
5.5
5.75
6
6.25
6.5
6.75
7
7.25
7.5
7.75
8
Mw
a) b)
c) d)
0
75
150
225
300
4.5
5 5.5
6 6.5
7 7.5
8
0.0E+00
5.0E-06
1.0E-05
1.5E-05
2.0E-05
2.5E-05
%Prob
R (km)
Mw
San Salvador. SA(1.0s), PR 2500 años
4.5
4.75
5
5.25
5.5
5.75
6
6.25
6.5
6.75
7
7.25
7.5
7.75
8
Mw
0
75
150
225
300
4.5
5 5.5
6 6.5
7 7.5
8
0.0E+00
5.0E-06
1.0E-05
1.5E-05
2.0E-05
2.5E-05
%Prob
R (km)
Mw
San Salvador. PGA, PR 2500 años
4.5
4.75
5
5.25
5.5
5.75
6
6.25
6.5
6.75
7
7.25
7.5
7.75
8
Mw
0
75
150
225
3004.5
5 5.5
6 6.5
7 7.5
8
0.0E+00
1.0E-05
2.0E-05
3.0E-05
4.0E-05
5.0E-05
6.0E-05
7.0E-05
8.0E-05
9.0E-05
%Prob
R (km)
Mw
San Salvador. PGA, PR 500 años
4.5
4.75
5
5.25
5.5
5.75
6
6.25
6.5
6.75
7
7.25
7.5
7.75
8
Mw
0
75
150
225
300
4.5
5 5.5
6 6.5
7 7.5
8
0.0E+00
1.0E-05
2.0E-05
3.0E-05
4.0E-05
5.0E-05
6.0E-05
7.0E-05
8.0E-05
9.0E-05
%Prob
R (km)
Mw
San Salvador. SA(1.0s), PR 500 años
4.5
4.75
5
5.25
5.5
5.75
6
6.25
6.5
6.75
7
7.25
7.5
7.75
8
Mw
a) b)
c) d)
0
75
150
225
300
4.5
5 5.5
6 6.5
7 7.5
8
0.0E+00
2.0E-05
4.0E-05
6.0E-05
8.0E-05
1.0E-04
1.2E-04
%Prob
R (km)
Mw
Managua. SA(1.0s), PR 500 años
4.5
4.75
5
5.25
5.5
5.75
6
6.25
6.5
6.75
7
7.25
7.5
7.75
8
Mw
0
75
150
225
3004.5
5 5.5
6 6.5
7 7.5
8
0.0E+00
2.0E-05
4.0E-05
6.0E-05
8.0E-05
1.0E-04
1.2E-04
1.4E-04
1.6E-04
%Prob
R (km)
Mw
Managua. PGA, PR 500 años
4.5
4.75
5
5.25
5.5
5.75
6
6.25
6.5
6.75
7
7.25
7.5
7.75
8
Mw
0
75
150
225
300
4.5
5 5.5
6 6.5
7 7.5
8
0.0E+00
5.0E-06
1.0E-05
1.5E-05
2.0E-05
2.5E-05
3.0E-05
3.5E-05
4.0E-05
%Prob
R (km)
Mw
Managua. PGA, PR 2500 años
4.5
4.75
5
5.25
5.5
5.75
6
6.25
6.5
6.75
7
7.25
7.5
7.75
8
Mw
0
75
150
225
300
4.5
5 5.5
6 6.5
7 7.5
8
0.0E+00
5.0E-06
1.0E-05
1.5E-05
2.0E-05
2.5E-05
3.0E-05
%Prob
R (km)
Mw
Managua. SA(1.0s), PR 2500 años
4.5
4.75
5
5.25
5.5
5.75
6
6.25
6.5
6.75
7
7.25
7.5
7.75
8
Mw
a) b)
c) d)
Seismotectonic
context
Methodology
INPUTS
Catalogue
Zonation
Atenuattion
Hazard
estimation
Results
Conclusions

Deaggregation
0
75
150
225
300
4.5
5 5.5
6 6.5
7 7.5
8
0.0E+00
2.0E-05
4.0E-05
6.0E-05
8.0E-05
1.0E-04
1.2E-04
1.4E-04
1.6E-04
%Prob
R (km)
Mw
San José. SA(1.0s), PR 500 años
4.5
4.75
5
5.25
5.5
5.75
6
6.25
6.5
6.75
7
7.25
7.5
7.75
8
Mw
0
75
150
225
300
4.5
5 5.5
6 6.5
7 7.5
8
0.0E+00
2.0E-05
4.0E-05
6.0E-05
8.0E-05
1.0E-04
1.2E-04
%Prob
R (km)
Mw
San José. PGA, PR 500 años
4.5
4.75
5
5.25
5.5
5.75
6
6.25
6.5
6.75
7
7.25
7.5
7.75
8
Mw
0
75
150
225
300
4.5
5 5.5
6 6.5
7 7.5
8
0.0E+00
5.0E-06
1.0E-05
1.5E-05
2.0E-05
2.5E-05
3.0E-05
3.5E-05
%Prob
R (km)
Mw
San José. PGA, PR 2500 años
4.5
4.75
5
5.25
5.5
5.75
6
6.25
6.5
6.75
7
7.25
7.5
7.75
8
Mw
0
75
150
225
300
4.5
5 5.5
6 6.5
7 7.5
8
0.0E+00
5.0E-06
1.0E-05
1.5E-05
2.0E-05
2.5E-05
3.0E-05
3.5E-05
4.0E-05
4.5E-05
5.0E-05
%Prob
R (km)
Mw
San José. SA(1.0s), PR 2500 años
4.5
4.75
5
5.25
5.5
5.75
6
6.25
6.5
6.75
7
7.25
7.5
7.75
8
Mw
a) b)
c) d)
0
75
150
225
300
4.5
5 5.5
6 6.5
7 7.5
8
0.0E+00
5.0E-06
1.0E-05
1.5E-05
2.0E-05
2.5E-05
%Prob
R (km)
Mw
Tegucigalpa. SA(1.0s), PR 2500 años
4.5
4.75
5
5.25
5.5
5.75
6
6.25
6.5
6.75
7
7.25
7.5
7.75
8
Mw
0
75
150
225
300
4.5
5 5.5
6 6.5
7 7.5
8
0.0E+00
2.0E-06
4.0E-06
6.0E-06
8.0E-06
1.0E-05
1.2E-05
1.4E-05
%Prob
R (km)
Mw
Tegucigalpa. PGA, PR 2500 años
4.5
4.75
5
5.25
5.5
5.75
6
6.25
6.5
6.75
7
7.25
7.5
7.75
8
Mw
0
75
150
225
300
4.5
5 5.5
6 6.5
7 7.5
8
0.0E+00
1.0E-05
2.0E-05
3.0E-05
4.0E-05
5.0E-05
6.0E-05
7.0E-05
%Prob
R (km)
Mw
Tegucigalpa. PGA, PR 500 años
4.5
4.75
5
5.25
5.5
5.75
6
6.25
6.5
6.75
7
7.25
7.5
7.75
8
Mw
0
75
150
225
300
4.5
5 5.5
6 6.5
7 7.5
8
0.0E+00
1.0E-05
2.0E-05
3.0E-05
4.0E-05
5.0E-05
6.0E-05
7.0E-05
8.0E-05
9.0E-05
%Prob
R (km)
Mw
Tegucigalpa. SA(1.0s), PR 500 años
4.5
4.75
5
5.25
5.5
5.75
6
6.25
6.5
6.75
7
7.25
7.5
7.75
8
Mwa) b)
c) d)
0
75
150
225
300
4.5
5 5.5
6 6.5
7 7.5
8
0.0E+00
5.0E-06
1.0E-05
1.5E-05
2.0E-05
2.5E-05
%Prob
R (km)
Mw
Panamá. SA(1.0s), PR 2500 años
4.5
4.75
5
5.25
5.5
5.75
6
6.25
6.5
6.75
7
7.25
7.5
7.75
8
Mw
0
75
150
225
300
4.5
5 5.5
6 6.5
7 7.5
8
0.0E+00
2.0E-06
4.0E-06
6.0E-06
8.0E-06
1.0E-05
1.2E-05
1.4E-05
1.6E-05
%Prob
R (km)
Mw
Panamá. PGA, PR 2500 años
4.5
4.75
5
5.25
5.5
5.75
6
6.25
6.5
6.75
7
7.25
7.5
7.75
8
Mw
0
75
150
225
300
4.5
5 5.5
6 6.5
7 7.5
8
0.0E+00
1.0E-05
2.0E-05
3.0E-05
4.0E-05
5.0E-05
6.0E-05
%Prob
R (km)
Mw
Panamá. PGA, PR 500 años
4.5
4.75
5
5.25
5.5
5.75
6
6.25
6.5
6.75
7
7.25
7.5
7.75
8
Mw
0
75
150
225
300
4.5
5 5.5
6 6.5
7 7.5
8
0.0E+00
1.0E-05
2.0E-05
3.0E-05
4.0E-05
5.0E-05
6.0E-05
7.0E-05
8.0E-05
9.0E-05
%Prob
R (km)
Mw
Panamá. SA(1.0s), PR 500 años
4.5
4.75
5
5.25
5.5
5.75
6
6.25
6.5
6.75
7
7.25
7.5
7.75
8
Mwa) b)
c) d)
Seismotectonic
context
Methodology
INPUTS
Catalogue
Zonation
Atenuattion
Hazard
estimation
Results
Conclusions

CONCLUSIONS (I)
For all return periods the highest values of PGA are
predicted in Panamá Fracture zone, South Guatemala
and certain zones of volcanic chain.
Maximun PGA :
RP = 500 years, 500 gal
RP=1000 years, 700 gal
RP = 2500 years, 850 gal
Similar morphology for maps of SA (0.2 s) with
maximun values
RP = 500 años, 1300 gal
RP=1000 años, 1600 gal
R P= 2500 años, 2000 gal
Maps of SA (1 s) with maximun in coastal zones, due to
the highest influence of the subduction events.
Seismotectonic
context
Methodology
INPUTS
Catalogue
Zonation
Atenuattion
Hazard
estimation
Results
Conclusions
CONCLUSIONS (II):
Specific results in the capitals:
Highest hazard in Guatemala City and San Salvador,
followed by San José and Managua and minor hazard in
Panamá and Tegucigalpa.
Deaggregation
Control earthquakes are identified in the capitals :
( Target motion given by PGA and RP= 500 y)
In general, a near shock is dominant (M 6-6.5; R 15 km) identified
with a volcanic chain event. Exception of Tegucigalpa where a far
event is dominant (M 6.7, R 210 km) and Panamá, where neither
clear event is found .
In Guatemala City, San Salvador and Managua a second long-
distance earthquake M ~ 7 is found with important contribution,
identified with a subduction event.
Seismotectonic
context
Methodology
INPUTS
Catalogue
Zonation
Atenuattion
Hazard
estimation
Results
Conclusions

How to get the project results:
http://www.norsar.no/c-123-Seismic-Hazard-Updates.aspx
CA country reports (in spanish)
Regional CA report (in spaniish)
Seismic hazard maps in ArcGis Format
Book: Seismic Hazard in Central America (in spanish)
Benito and Torres (eds),
2010
Entimema Press, Madrid
A new evaluation of Seismic Hazard for the Central America
Region in the frame of the RESIS II Project.
The 14 th World Conference on Earthquake Engineering
October 12-17, 2008, Beijing, China

THANKS FOR YOUR
ATTENTION !!!