a novel method to analyze risk and performance …
TRANSCRIPT

A NOVEL METHOD TO ANALYZE RISK AND PERFORMANCE ANALYSIS FOR MUTUAL FUNDS
Payal Das, Siddharth Nanda School of Engineering, Ajeenkya D.Y. Patil University Pune, India -412105
Journal Samvakti Journal of Research in Information Technology https://www.sjrit.samvaktijournals.com Volume 1 Issue 1 (2020); Page No : 62 - 76
Discipline Artificial intelligence and Machine Learning
Date Received : July 22, 2020 ID : 202007.50.278 Publication Date : November 03, 2020 doi : 10.46402/202007.50.278 Paper Type : Dissertation doi URL : dx.doi.org/10.46402/202007.50.278 Access Type : Open Access (Attribution-NonCommercial-NoDerivatives 4.0 International) © 2020 Ms. Payal Das, Siddharth Nanda; with publication rights granted to Samvakti Journals
ABSTRACT
Mutual Funds investments have attracted attention and interest in the recent times as it is considered to be safe and has provided investors with less risk at returns. The Indian market, in a similar manner, has witnessed the diversified growth of mutual funds throughout many years. From 2016 onwards, the Indian market is thronged with more than 2,500 mutual fund plans, and each plan is expected to bring higher returns than its peers. For ordinary investors, this is a challenge to choose the best investment portfolio, so it is essential to analyze the performance of these funds. In understanding and analyzing the historical performance of mutual funds, it does not assure future performance, but this may give some insight into the performance of the fund under different market conditions. In this research work, we analyzed the data and solved several research problems with the use of R Studio tool. These include measuring the performance of specific plans based on risks and returns, and compare the performance of these selected plans with the benchmark index to see if the plan's performance is better than the benchmark. We also introspect which parameters affect the schemes in a particular way based on performance and propose strategies for investing in mutual funds. Therefore, our findings are of great relevance to the investment public.
Keywords: Mutual Funds, NAV, Performance, Risk, Analysis, R Studio.
INTRODUCTION
Savings is the abundance of earning over expenditure. When this kind of savings investment generates more money, it is called investment. Land, livestock and precious metals are some

Payal Das, Siddharth Nanda
Page No. 63
traditional investment options. In the 19th century, the investment revolution occurred through the banking system because it provided investors with many investment options, such as fix deposits (FD), government bonds, and public provident funds (PPF) [3]. With the development of the capital market, stock investment has become a good choice for generating higher returns. However, related to this are greater risk and an understanding of stock price movements. Therefore, mutual funds have turned out to be an ultra-modern investment method, which can reduce the risk at low cost with the help of expert knowledge.
The mutual fund is the concept of portfolios. The fund pooled in by numerous investors makes up Mutual Funds. The money is then managed by a dedicated fund manager, who uses his investing management skills to invest it in numerous financial instruments of their choice, such as:
a) Equity funds: This type of mutual fund invests the aggregated amount in the shares of listed companies. Equity fund managers use different styles to select stocks while deciding how to invest for their portfolios. They are risky and provide standard high returns.
b) Debt funds: Debt mutual fund is the kind of mutual fund which is specially designed for low-risk investors. Its main objectives are capital appreciation and considerable investment return. These are aimed at investors who prefer less volatility and want fixed income.
c) Balanced funds: They are a combination of both of the above funds. They invest in equities as well as in fixed income assured funds, which is consistent with the plan's intended investment objectives. The equity part provides growth, and the debt part provides stability of returns. This type of fund aims to diversify some equity risks by assuming debt, while also maintaining considerable returns.
Since its establishment, the Indian industry of mutual funds has been quite mature and has witnessed growth and structural changes. Following the drive of the Indian Government and the RBI, the Unit Trust Fund (UTI) of India launched the first ever mutual fund in 1963. This is the first stage of the Indian Mutual Fund (1964-1987). During this period, UTI witnessed an exclusive monopoly. Later, in the second stage (1987-1993), the State Bank of India (SBI) joined UTI in 1987, and the Indian government allowed financial institutions and public sector banks to authorize mutual funds. With the expansion of the business, an unprofitable association, the Mutual Fund Association of India (AMFI) was established in 1995[10]. The goal of the association is to promote sound and righteous marketing practices in the Indian MF industry. After the Securities and Exchange Board of India (SEBI) Act passed in 1992, the SEBI Mutual Funds Regulations were introduced in Dec, 1996[11]. Thenceforth, the mutual fund organization's acquisitions and joint efforts to enter India through foreign companies have grown exponentially. Since 2012, a large number of mutual fund companies have provided more than 1,000 plans, including closed-end, open-end, growth, interval, balance, income, stock-linked savings plans (ELSS) and so on as of which, retail investors are facing problems in choosing the right fund. Therefore, it is very important to examine the performance of mutual funds and their improvement methods in terms of efficiency.
A novel method to analyze risk and performance analysis for mutual funds
Page No. 64
Generally, the net asset value (NAV) is used as the standard for performance evaluation, and it comes at the cost of risk-reward. In addition to risks, mutual fund programs also have some characteristics or attributes that may affect their performance. It is necessary to know which attributes will cause effective performance and which will cause performance degradation. Compared with other developed countries, the overall assets of the mutual fund industry in our country are still far behind. One of the dominant reasons for the slow growth is lack of awareness and investor trust in companies and decision makers. India's industry of mutual funds is in a growing phase with huge room for development.
This paper can be sectioned off as per the following: Section 1 and Section 2 gives an introduction and literature review of the referred research work respectively; Section 3 provides information about the proposed approach and work; Section 4 shows a detailed look at our results and outcome and the paper ends off by presenting the conclusion and references.
LITERATURE SURVEY
Panwar S. et. al [1] used examples of public sector supported and private sector supported mutual funds of shifted net assets for examining the distinctions in qualities of benefits held, portfolio broadening, and variable impacts of expansion on venture execution for the period 2002-2005. The investigation found a noteworthy contrast between public sector supported and private sector supported mutual funds with respect to average variance, average standard deviation, and average coefficient of variety (COV). The examination additionally noted a statistical distinction between sponsorship classes with regard to e SDAR (abundance standard deviation balanced returns) as a presentation measure and residual variance (RV), which is utilized as the proportion of MF portfolio expansion trademark. However, RV directly affects Sharpe fund execution measures.
Jain S. et. al [2] investigated the presentation of equity in India's shared mutual funds using CAPM. The results show an investigation on risk-adjusted execution of mutual funds Corporation in India that over the long haul, the presentation of private sector organizations' MFs has been way better than the public sector. Out of the pool of test organizations, HDFC and ICICI were the best performers while LIC didn't do well. In this way, the general examination finds that the mutual funds plans of the private sector are less risky but more rewarding as compared to the public sector.
Bhavsar A.C. et. al [4] contributed by giving a near investigation of the performance of select private and public sector mutual funds and the ends are that mutual funds with public sector possessions have been more noteworthy performers when compared with their private sector complements. Likewise, with Jensen's Alpha, private sector funds have been positioned better however a higher position was given to public sector funds under Sharpe and Treynor ratio.
Kumar R. [5] evaluated the performance of mutual fund industries of India based on the 51 mutual fund schemes somewhere in the range of 2006 and 2014 by utilizing contingent
Payal Das, Siddharth Nanda
Page No. 65
models based on the semi - solid type of market productivity model of Fama. The study revealed that Indian fund administrators have strong stock picking capacity. In some case, they are not skilled to time the market and even open data couldn't help in this specific situation. In addition, there is a tradeoff among the preciseness and market time capacity because it is unable to show skills in both the categories simultaneously. Also, fund returns are delicate to market moments.
Tripathy N. [6] used every day perception of NAV and NIFTY index over the time of August 2008 to 2014. The results of the examination proposed that the vast majority of mutual fund schemes show great execution and expert administration selectivity adeptness in fund analysis according to Treynor proportion, Sortino proportion, Sharpe proportion, Jensen's alpha and M square model. The study additionally found the proof of reversal performance and perseverance of mutual funds according to data proportion showing nearness of market productivity over the long run. It likewise revealed that 43% mutual fund administrators can time the market effectively during the time of study under both the models. The examination inferred that a speculator is required to make wise investment choices by dissecting the return and risk boundaries of the MFs to accomplish their investment objectives.
Vidal-García J. et. al [8] analyzed the momentary market proficiency of the MF industry around the world. Using a distinctive database of overall private equity funds, it utilizes a regression model and DEA model to set up a connection between cost and benefit of mutual funds. The experimental results of the parametric methodology demonstrated a statistically huge negative connection among costs and risk-adjusted performance across nations. In the wake of reevaluating this relationship using a non-parametric methodology, they showed, in contrast to the past outcome, a positive connection among costs and risk-adjusted performance. Therefore, utilizing the DEA approach, solid evidence, equity mutual funds around the globe are roughly mean–variance proficient, was discovered by them.
Dong X. et. al [9] demonstrated that the capacity of fund managers to make esteem relies upon the conditions of market liquidity, which thus presents a liquidity risk presentation (beta) for skilled supervisors. They reported a yearly liquidity beta execution lay out of 4% in the traverse of mutual funds from 1983–2014. Liquidity risk premium clarify a meager part of this spread; rather, the spread can be ascribed to the differential capacity of high liquidity beta funds to outflank beyond low and high liquidity states, because of a differential pace of either mispricing amendment or power of insider dealing. Dependent tests on mispricing, approximated by a complete arrangement of 68 oddities, and tick-by-tick exchanges, from an enormous restrictive institutional trading dataset certify the commitment of these channels. The outcomes feature the communication between informed financial investors, mispricing, and liquidity beta.
A novel method to analyze risk and performance analysis for mutual funds
Page No. 66
METHODOLOGY
The research methods used include the data used and its collection, the attributes used to analyze mutual fund performance, and the models and techniques used to analyze the data has been discussed below.
Data
The data collected is the daily closing NAVs of the mutual funds [12], as well as their benchmark indexes, fund types, expense ratios, ratings and returns [13]. The selected time period for the study is from 2015-2018. The fund samples selected are few of the highly rated funds as per CRISIL, Value Research and Morningstar India with the highest ranking funds in their respective fund categories. The data was extracted from the data flow and association of mutual funds in India. The time frame of the selected sample data is a direct plan to study mutual funds. Direct plans can bypass the distributers and help investors invest directly in the Mutual Funds. Since the distributor's commission is not included in the direct plan, its net asset value is higher.
Attributes for Performance Evaluation
An impressive track record gives no assurance of the future performance. Financial investors ought to likewise take a gander at some quantitative measures to assess which fund is beneficial for them. The attributes for picking Mutual Fund for investment are as follows:
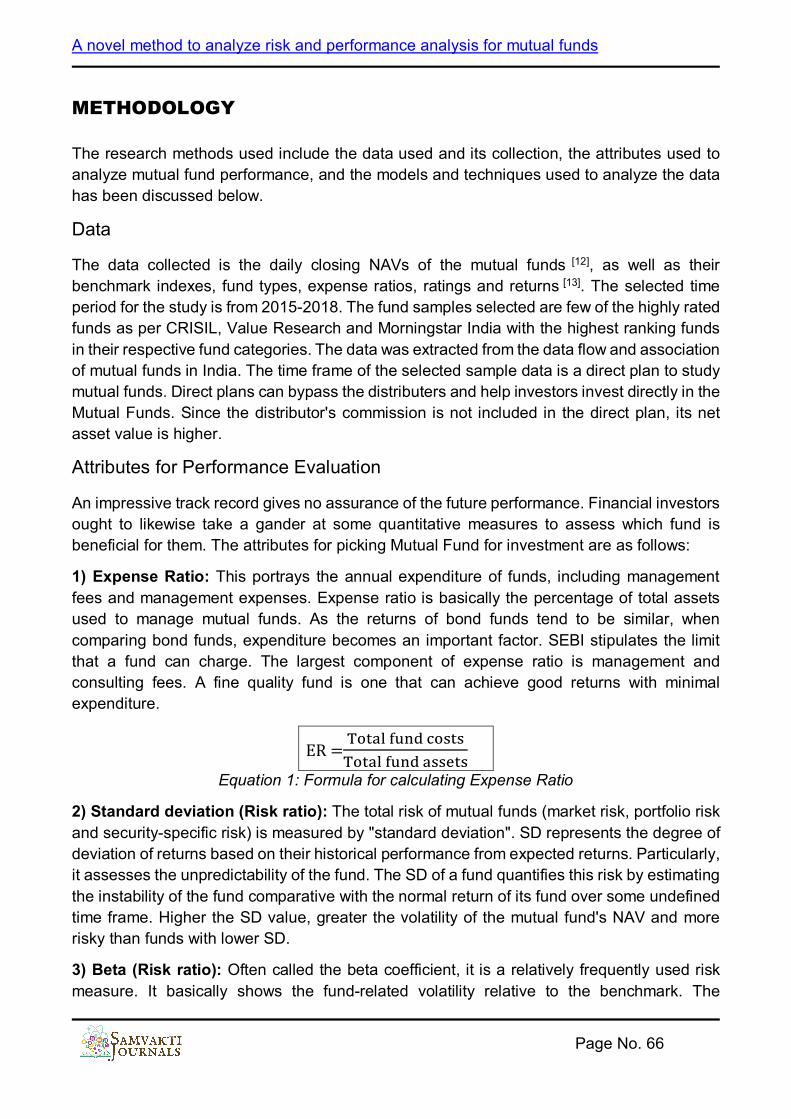
1) Expense Ratio: This portrays the annual expenditure of funds, including management fees and management expenses. Expense ratio is basically the percentage of total assets used to manage mutual funds. As the returns of bond funds tend to be similar, when comparing bond funds, expenditure becomes an important factor. SEBI stipulates the limit that a fund can charge. The largest component of expense ratio is management and consulting fees. A fine quality fund is one that can achieve good returns with minimal expenditure.
ER =Total fund costsTotal fund assets
Equation 1: Formula for calculating Expense Ratio
2) Standard deviation (Risk ratio): The total risk of mutual funds (market risk, portfolio risk and security-specific risk) is measured by "standard deviation". SD represents the degree of deviation of returns based on their historical performance from expected returns. Particularly, it assesses the unpredictability of the fund. The SD of a fund quantifies this risk by estimating the instability of the fund comparative with the normal return of its fund over some undefined time frame. Higher the SD value, greater the volatility of the mutual fund's NAV and more risky than funds with lower SD.
3) Beta (Risk ratio): Often called the beta coefficient, it is a relatively frequently used risk measure. It basically shows the fund-related volatility relative to the benchmark. The

Payal Das, Siddharth Nanda
Page No. 67
performance of Beta depends largely on the relevance of the fund to its benchmark. If there is no suitable benchmark index in the fund's portfolio, the beta coefficient will be insufficient. A beta value more prominent than 1 show that the fund is more volatile than the benchmark and a beta under 1 demonstrates that the fund is less volatile than the list. A fund with beta near 1 implies that the fund's output intently coordinates the benchmark.
Beta =CovarianceVariance
Equation 2: Formula for calculating Beta
Where: Covariance = Measure of stock's return relative the market. Variance = Measure of how the market moves relative to its mean.
4) Sharpe Ratio (Risk Adjusted Return Ratio): Indicates whether the return on investment is the result of good investment decisions or excessive risk. The SR is one more salient indicator for evaluating the return of funds relative to the risks they take. This ratio helps in understanding whether it is safe to invest or not by taking a specific quantity of risk. The greater the ratio, the better the fund's return relative to the risk it takes. This is because it means that it produces a higher return for each risk unit it undertakes. Conversely, a negative ratio means that risk-free assets gives better performance than the fund under consideration.
Sharpe ratio =Return of portfolio − Risk free rate
Standard deviation of portfolio′s access return
Equation 3: Formula for calculating Sharpe Ratio
5) R-squared: R-squared is used to compute the relationship between the investment portfolio and benchmark. It is showed as a ratio somewhere in the range of 1 and 100. R-squared isn't a proportion of portfolio performance. Instead, it measures the relationship between portfolio return and benchmark return. An R square of 100 means that all changes in the portfolio can be described by benchmark changes.
R² = 1 –Unexplained variation
Total variation
Equation 4: Formula for calculating R-Squared
6) Alpha: Alpha can measure the risk-adjusted performance of the investment. In short, it gives an impression of the excess returns that an invested fund may produce contrasted with its benchmark. For example, if the alpha of a mutual fund program is 4.0, it usually means that the fund's performance is better than its Benchmark Index by 4%. You can think of it as the extra value that ordinary fund managers add or deduct from portfolio income. Alpha can be negative as well as positive.

A novel method to analyze risk and performance analysis for mutual funds
Page No. 68
Alpha =End price+DPS−Start price
Start price
Equation 5: Formula for calculating Alpha
Where: DPS = Distribution per share
Models and Techniques
To analyze the performance of the mutual fund plans when compared with market, the following statistical methods and techniques have been used:
In statistics, gradual regression is a technique of fitting a regression model, in which the selection of predictor variables is performed through an automated process. The effect of various fund characteristics on performance of mutual funds is studied with regression model. In each step, variables are either subtracted or added from the arrangement of logical factors according to a predetermined standard. The Akaike Information Standard (AIC) is a measure of the relative quality of a statistical model for a given data set. Given the set of models used for the dataset, the AIC evaluates the quality of each model compared to every other model. Therefore, we have used the AIC estimator which provides a method for model selection.
The tool which we have used to perform analysis and draw corresponding results is R Studio. Also, the dataset has been visualized with the help of different plots such as Tables, Scatter plots and Correlation plots for showing relations and correlations respectively.
RESULTS AND DISCUSSION
With the help of the collected historical returns dataset which included categories like Investment Style, Market Cap, Turnover, Net Assets and parameters like Expense Ratio, Risk Ratios, Risk Adjusted Return Ratios etc., we have visualized the following tables and plots and came up with the following findings:
The tables below show the evaluated performance of selected funds along with the benchmark performance of CNX Nifty using Average Return, Total Risk, Beta and Sharpe Ratio.
Sr. No
Schemes Average return
Total Risk Beta
1 Axis 160.6% 8.5% 0.63 2 SBI 263.2% 9.9% 0.71 3 Franklin 171.1% 1% 0.66 4 ICICI 81.1% 1% 0.56 5 Nifty (Benchmark) 102.3% 1.2% 1
Table 1: Performance of Mutual Fund Schemes in terms of Risk and Return

Payal Das, Siddharth Nanda
Page No. 69
From Table 1 we interpreted that in case of all equity option schemes of diversified funds; three out of four funds have earned higher returns in comparison to their benchmark portfolio returns. It also revealed that higher the fluctuations in the returns of a fund during a given period, higher will be the risk associated [7].
Sr. No
Schemes Sharpe Ratio
1 Axis 1.12 2 SBI 2.22 3 Franklin 1.23 4 ICICI 0.31 5 Nifty (Benchmark) 0.68
Table 2: Performance of Mutual Fund Schemes in terms of Sharpe Ratio
Table 2 presents the result of the Sharpe Ratio of the selected mutual fund schemes with the benchmark portfolios. Three selected fund has greater value than the Sharpe ratio benchmark which shows their superior performance.
Scatter plots showing relation between Return and other independent variables: -
Graph 1: Relationship between Risk and Return

A novel method to analyze risk and performance analysis for mutual funds
Page No. 70
Graph 2: Relationship between Sharpe Ratio and Return
Graph 3: Relationship between Alpha and Return
The solid red line in the above graphs shows the average relationship between Return and other performance indicators along with the dotted red lines being the average range of it.
Payal Das, Siddharth Nanda
Page No. 71
The regression slopes are positive which means that they tend to share a positive relationship.
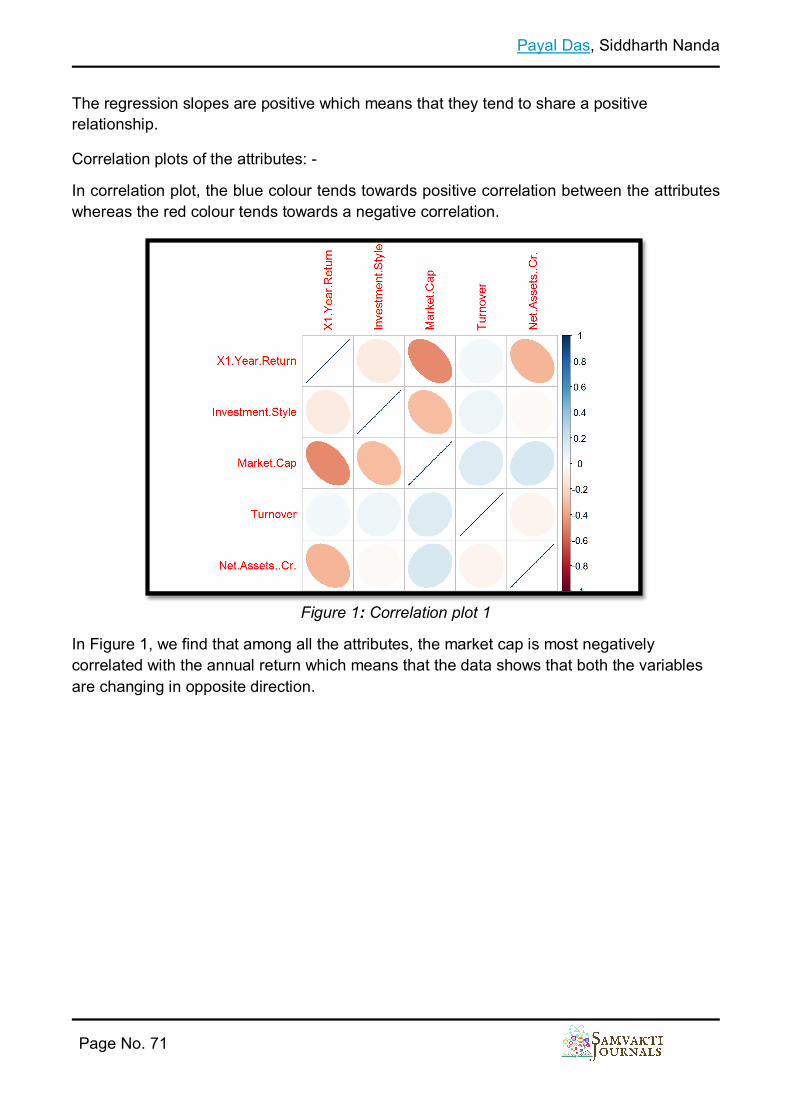
Correlation plots of the attributes: -
In correlation plot, the blue colour tends towards positive correlation between the attributes whereas the red colour tends towards a negative correlation.
Figure 1: Correlation plot 1
In Figure 1, we find that among all the attributes, the market cap is most negatively correlated with the annual return which means that the data shows that both the variables are changing in opposite direction.

A novel method to analyze risk and performance analysis for mutual funds
Page No. 72
Figure 2: Correlation plot 2
In Figure 2, we can clearly see that almost all the attributes show a positive correlation with one another which implies that they have changed in the same direction.
Figure 3: Correlation plot 3
Overall, we can see few variables are having very good correlation with Annual Return on different schemes. Also, Standard Deviation, Sharpe Ratio & Alpha is highly correlated with Annual Return.
Payal Das, Siddharth Nanda
Page No. 73
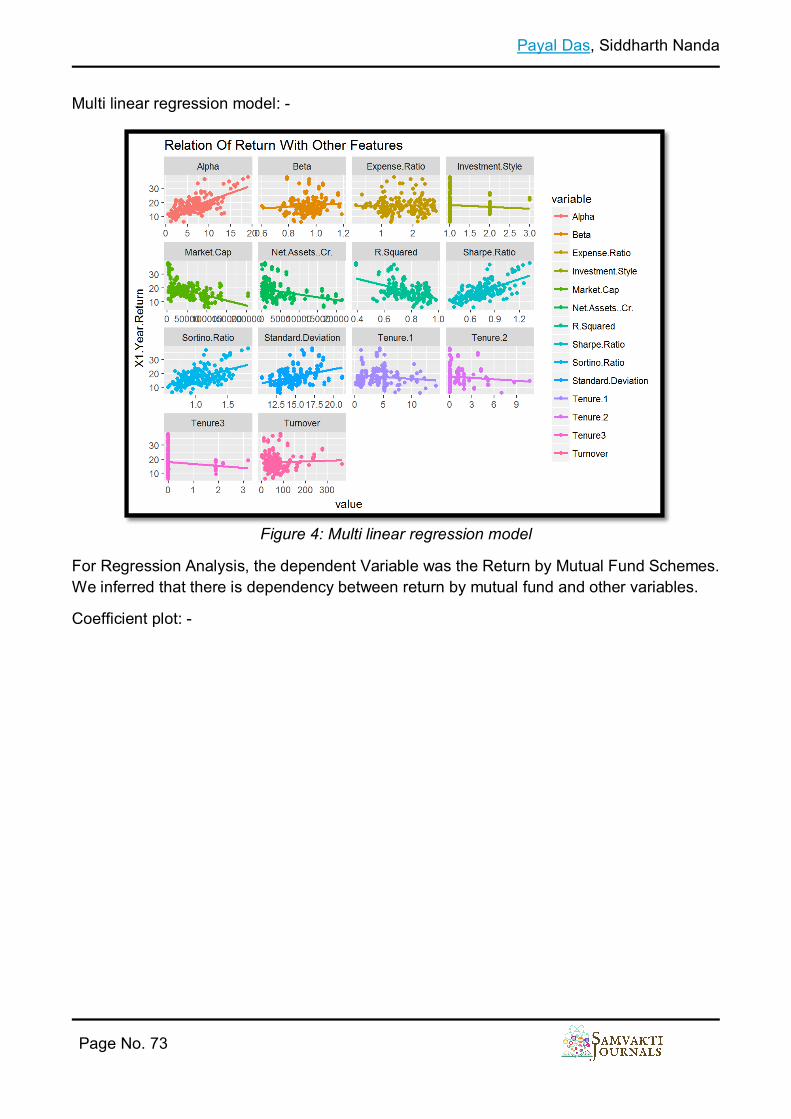
Multi linear regression model: -
Figure 4: Multi linear regression model
For Regression Analysis, the dependent Variable was the Return by Mutual Fund Schemes. We inferred that there is dependency between return by mutual fund and other variables.
Coefficient plot: -
A novel method to analyze risk and performance analysis for mutual funds
Page No. 74
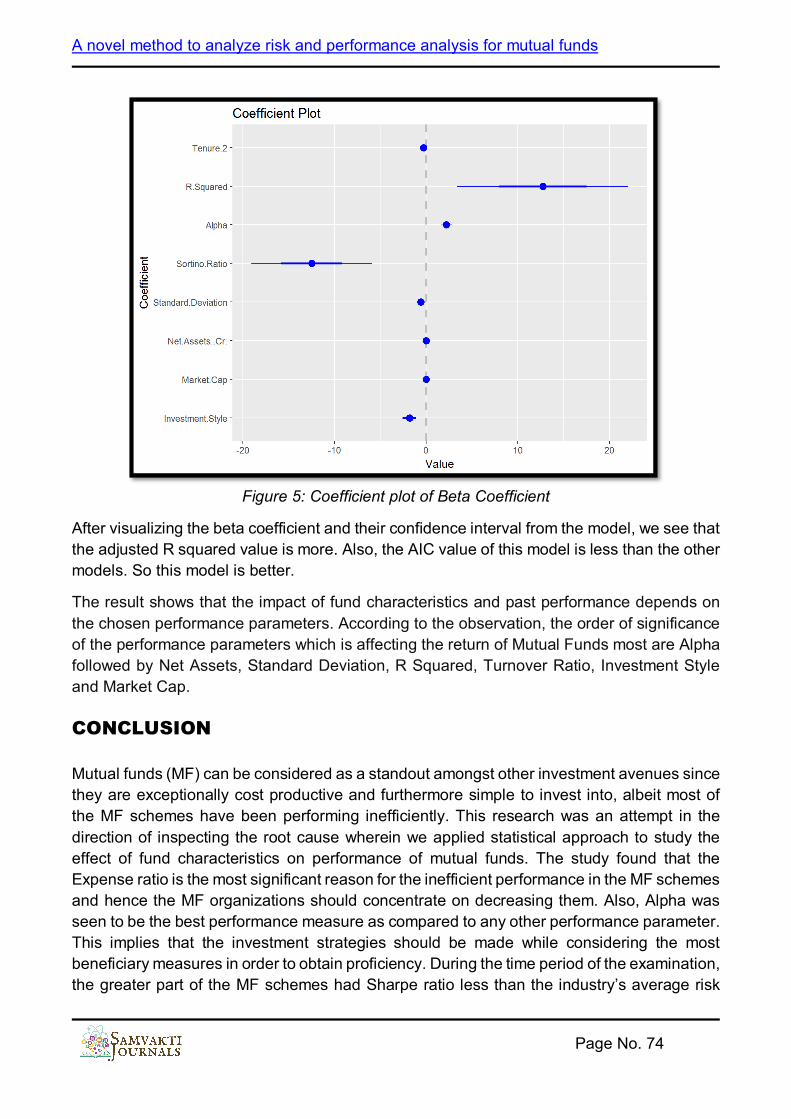
Figure 5: Coefficient plot of Beta Coefficient
After visualizing the beta coefficient and their confidence interval from the model, we see that the adjusted R squared value is more. Also, the AIC value of this model is less than the other models. So this model is better.
The result shows that the impact of fund characteristics and past performance depends on the chosen performance parameters. According to the observation, the order of significance of the performance parameters which is affecting the return of Mutual Funds most are Alpha followed by Net Assets, Standard Deviation, R Squared, Turnover Ratio, Investment Style and Market Cap.
CONCLUSION
Mutual funds (MF) can be considered as a standout amongst other investment avenues since they are exceptionally cost productive and furthermore simple to invest into, albeit most of the MF schemes have been performing inefficiently. This research was an attempt in the direction of inspecting the root cause wherein we applied statistical approach to study the effect of fund characteristics on performance of mutual funds. The study found that the Expense ratio is the most significant reason for the inefficient performance in the MF schemes and hence the MF organizations should concentrate on decreasing them. Also, Alpha was seen to be the best performance measure as compared to any other performance parameter. This implies that the investment strategies should be made while considering the most beneficiary measures in order to obtain proficiency. During the time period of the examination, the greater part of the MF schemes had Sharpe ratio less than the industry’s average risk

Payal Das, Siddharth Nanda
Page No. 75
adjusted return. Consequently, organizations should take restorative measures to improve their performance. In conclusion, the investors judge the Mutual Fund schemes based on their structure, performance, size, status and professional expertise ergo mutual fund organizations should manifest solid points of their plans with respect to these attributes.
A novel method to analyze risk and performance analysis for mutual funds
Page No. 76
REFERENCES
[1]Panwar, S. and Madhumathi, R., 2006. Characteristics and performance evaluation of selected mutual funds in India. In Indian Institute of Capital Markets 9th Capital Markets Conference Paper.
[2] Jain, S. and Gangopadhyay, A., 2012. Analysis of equity based mutual funds in India. IOSR Journal of Business and Management, 2(1), pp.1-4.
[3] Goel, S., 2013. Performance Of Mutual Funds And Investors’ Behavior. Jaypee Institute Of Information Technology, Noida.
[4]Bhavsar, A.C. and Damani, A., 2014. A Comparative Study of the Performance of Selected Mutual Fund Growth Schemes from the Private Sector and Public Sector Schemes in India. Anvesha, 7(1), p.1.
[5] Kumar, R., 2016. Conditional models in performance evaluation of mutual funds in India. International Journal of Technical Research and Applications, 4(1), pp.94-101.
[6] Tripathy, N., 2017. Efficiency of mutual funds and performance measurement in India: an empirical investigation. International Journal of Business Excellence, 13(2), pp.217-237.
[7] Ojha, S.C., 2017. Performance Evaluation of Mutual Funds: A Study of Selected Equity Diversified Mutual Funds in India.
[8] Vidal-García, J., Vidal, M., Boubaker, S. and Hassan, M., 2018. The efficiency of mutual funds. Annals of Operations Research, 267(1-2), pp.555-584.
[9] Dong, X., Feng, S. and Sadka, R., 2019. Liquidity risk and mutual fund performance. Management Science, 65(3), pp.1020-1041.
[10] http://www.iepf.gov.in/IEPF/Mutual_Fund_Investing.html. Accessed on 01-07-2020
[11] https://www.sebi.gov.in/legal/regulations/dec-1996/sebi-mutual-funds-regulations-1996_19376.html. Accessed on 01-07-2020 [12] https://www.amfiindia.com/net-asset-value. Accessed on 02-7-2020
[13] https://www.amfiindia.com/research-information/other-data/mf-scheme-performance-details. Accessed on 03-7-2020
END