a pam50-based chemoendocrine score for hormonereceptor...
TRANSCRIPT

Personalized Medicine and Imaging
A PAM50-Based Chemoendocrine Score forHormoneReceptor–PositiveBreastCancerwithanIntermediate Risk of RelapseAleix Prat1,2,3, Ana Lluch4, Arran K. Turnbull5, Anita K. Dunbier6, Lourdes Calvo7,Joan Albanell8, Juan de la Haba-Rodríguez9, Angels Arcusa10, Jos�e Ignacio Chac�on11,Pedro S�anchez-Rovira12, Arrate Plazaola13, Montserrat Mu~noz1,2, Laia Par�e3,Joel S. Parker14, Nuria Ribelles15, Bego~na Jimenez15, Abdul Aziz Bin Aiderus5,Rosalía Caballero16, Barbara Adamo1,2, Mitch Dowsett17, Eva Carrasco16, Miguel Martín18,J. Michael Dixon5, Charles M. Perou14,19,20, and Emilio Alba15
Abstract
Purpose: Hormone receptor–positive (HRþ) breast cancer isclinically and biologically heterogeneous, and subgroups withdifferent prognostic and treatment sensitivities need to beidentified.
Experimental Design: Research-based PAM50 subtyping andexpression of additional genes was performed on 63 patients withHRþ/HER2� disease randomly assigned to neoadjuvant multia-gent chemotherapy versus endocrine therapy in a phase II trial.The biology associatedwith treatment responsewas used to derivea PAM50-based chemoendocrine score (CES). CES's predictiveability was evaluated in 4 independent neoadjuvant data sets(n¼ 675) and 4 adjuvant data sets (n¼ 1,505). The association ofCES, intrinsic biology, and PAM50 risk of relapse (ROR) wasexplored across 6,007 tumors.
Results: Most genes associated with endocrine sensitivity werealso found associated with chemotherapy resistance. In the che-motherapy test/validation data sets, CES was independently asso-
ciatedwithpathologic complete response (pCR), evenafter adjust-ing for intrinsic subtype. pCR rates of the CES endocrine–sensitive(CES-E), uncertain (CES-U), and chemotherapy-sensitive (CES-C)groups in both data sets combined were 25%, 11%, and 2%,respectively. In the endocrine test/validation data sets, CES wasindependently associated with response. Compared with ROR,>90%of ROR-low and ROR-high tumors were identified as CES-Eand CES-C, respectively; however, each CES group represented>25%of ROR-intermediate disease. In terms of survival outcome,CES-C was associated with poor relapse-free survival in patientswith ROR-intermediate disease treatedwith either adjuvant endo-crine therapy only or no adjuvant systemic therapy, but not inpatients treated with (neo)adjuvant chemotherapy.
Conclusions:CES is a genomic signature capable of estimatingchemoendocrine sensitivity inHRþ breast cancer beyond intrinsicsubtype and risk of relapse. Clin Cancer Res; 23(12); 3035–44. �2016AACR.
IntroductionApproximately 70% of invasive breast cancers at diagnosis
are hormone receptor–positive and HER2-negative (HRþ/HER2�; ref. 1, 2). However, HRþ/HER2� disease is clinicallyand biologically heterogeneous and further subclassifica-
tions are needed to better tailor current and future treat-ments (3–5).
Over the last decade, molecular characterization studies haveidentified and extensively investigated the two main molecularsubtypes within HRþ/HER2� disease (i.e., Luminal A and B;
1Department of Medical Oncology, Hospital Clínic i Provincial, Barcelona,Spain. 2Translational Genomics and Targeted Therapeutics in Solid Tumors,August Pi i Sunyer Biomedical Research Institute (IDIBAPS), Barcelona,Spain. 3Translational Genomics Group, Vall d'Hebron Institute of Oncology(VHIO), Barcelona, Spain. 4Department of Medical Oncology, Valencia Uni-versity Hospital, Valencia, Spain. 5University of Edinburgh Cancer, ResearchUK Centre, Edinburgh. 6Department of Biochemistry, University of Otago,Dunedin, New Zealand. 7Department of Medical Oncology, A Coru~na Uni-versity Hospital Complex, A Coru~na, Spain. 8Department of Medical Oncol-ogy, Hospital del Mar Medical Research Institute-IMIM and Pompeu FabraUniversity, Barcelona, Spain. 9Department of Medical Oncology, BiomedicalResearch Institute-IMIBIC, Reina Sofía Hospital Complex, C�ordoba, Spain.10Department of Medical Oncology, Consorci Sanitari de Terrassa, Barcelona,Spain. 11Department of Medical Oncology, Virgen de la Salud Hospital,Toledo, Spain. 12Department of Medical Oncology, Ja�en Hospital Complex,Jaen, Spain. 13Department of Medical Oncology, Onkologikoa, Donostia,Spain. 14Lineberger Comprehensive Cancer Center, University of North Car-
olina, Chapel Hill, North Carolina. 15Department of Medical Oncology, Virgende la Victoria University Hospital, M�alaga, Spain. 16GEICAM (Spanish BreastCancer Research Group), Madrid, Spain. 17Academic Department of Biochem-istry, Royal Marsden Foundation Trust, London, United Kingdom. 18Institutode Investigaci�on Sanitaria Gregorio Mara~n�on, Universidad Complutense,Madrid, Spain. 19Department of Genetics, University of North Carolina, ChapelHill, North Carolina. 20Department of Pathology and Laboratory Medicine,University of North Carolina, Chapel Hill, North Carolina.
Note: Supplementary data for this article are available at Clinical CancerResearch Online (http://clincancerres.aacrjournals.org/).
Corresponding Author: Aleix Prat, Department of Medical Oncology, HospitalClínic de Barcelona, Casanova 170, 08036, Barcelona, Spain. Phone: 646847709;Fax: 34932100860; E-mail: [email protected]
doi: 10.1158/1078-0432.CCR-16-2092
�2016 American Association for Cancer Research.
ClinicalCancerResearch
www.aacrjournals.org 3035
on December 25, 2019. © 2017 American Association for Cancer Research.clincancerres.aacrjournals.org Downloaded from
Published OnlineFirst November 30, 2016; DOI: 10.1158/1078-0432.CCR-16-2092

refs. 1, 2, 6). Luminal A tumors have an improved prognosis at5- and 10-year follow-up compared with Luminal B tumorsirrespective of classical clinical–pathologic variables (e.g.,tumor size and nodal status) and (neo)adjuvant treatment(i.e., endocrine and chemotherapy; refs. 1, 2, 7, 8). In termsof treatment sensitivity, Luminal A tumors achieve significantlower rates of pathologic complete response (pCR) than Lumi-nal B tumors following neoadjuvant multiagent chemotherapy(9–12). However, less clear is the difference in endocrinesensitivity between the two luminal subtypes (13, 14).
Today, adjuvant endocrine therapy for 5 to 10 years isrecommended for all patients with HRþ/HER2� early breastcancer, whereas chemotherapy is recommended for patientswith intermediate- and high-risk tumors (15). However, therelationship between therapy and risk warrants furtherstudy considering that risk is associated with both factorsrelated to tumor biology and clinical–pathologic featuressuch as tumor size and nodal status, whereas therapy respon-siveness is generally considered to be independent of clinical–pathologic factors.
Materials and MethodsGEICAM/2006-03 clinical trial
Pretreatment core biopsy samples frompatients recruited in theluminal cohort of the GEICAM/2006-03 phase II neoadjuvantclinical trial were evaluated (16). In this study, 95 patients withestrogen receptor (ER)–positive (Allred 3–8), progesterone recep-tor (PR)–positive (Allred 3–8), HER2� (according to the ASCO/CAP guidelines; ref. 17), and cytokeratin 8/18-positive breastcancer were randomly assigned to receive 24 weeks of neoadju-vant chemotherapy or endocrine therapy. Chemotherapy con-sisted of epirubicin combined with cyclophosphamide for 4cycles followed by docetaxel for 4 cycles. Endocrine therapyconsisted of oral exemestane. Premenopausal patients receivedgoserelin for 6 doses.
GEICAM 2006-03 pathologic response endpointThe 5-point scale Miller and Payne histologic grading system
(18)was used tomeasure tumor response. In this study, theMiller
and Payne scale was reduced to a 3-point scale in order to have afair number of cases in each category and arm:no response (grades1 and 2), intermediate response (grade 3), and high response(grades 4 and 5).
GEICAM 2006-03 gene expression analysisSixty-three of 95pretreatment tumor sampleswere available for
gene expression analyses. Total RNA was purified to measure theexpression of 543 breast cancer–related genes, 5 housekeepinggenes and 14 negative and positive controls using the nCounterplatform (Nanostring Technologies; ref. 19). Raw gene expressioncan be found in Supplementary Material.
Independent/testing data setsGene expression and response data were evaluated from 4
independent neoadjuvant data sets (Supplementary Material;refs. 14, 20–24). Gene expression and survival data were evalu-ated from 4 independent data sets of patients with early breastcancer (Supplementary Material; refs. 2, 20, 25, 26).
Intrinsic subtype assignmentAll tumors were assigned to an intrinsic molecular subtype of
breast cancer (Luminal A, Luminal B, HER2-enriched, Basal-like)and the normal-like group using the research-based PAM50subtype predictor (27, 28), except for the Malaga cohort wherethe PAM50 standardized and commercial nCounter-based assaywas used. Before subtyping, each individual dataset was normal-ized accordingly as previously reported (29), except for theMalaga cohort that was normalized by Nanostring according totheir algorithm. Of note, the Edinburghmicroarray-based datasetis composed of ERþ samples-only and proper centering forintrinsic subtyping calling was not possible (30). In this dataset,CES was evaluated as a continuous variable since it is not affectedby centering.
Combined cohort of primary breast cancerTo evaluate the relationship between PAM50 subtype calls,
prognosis (ROR-P) and CES, we combined PAM50 data from 7independent andpreviously reported cohorts (1, 2, 11, 20, 31–33)representing a total of 6,007 primary tumor samples. CES wasevaluated in each individual cohort, and a combined matrix wascreated (Supplementary Material).
Statistical analysisBiologic analysis of gene lists was performed with DAVID
6.7 annotation tool (34) using the 543-gene list as back-ground. The association between the expression of each geneand Miller–Payne response (3 categories) was assessed by aquantitative Significance Analysis of Microarrays (SAM;ref. 35). In both testing data sets, association between eachvariable and pCR or clinical/radiological response wasassessed by univariate and multivariable logistic regressionanalyses. The predictive performance of CES was evaluatedusing receiver operating characteristic (ROC) curve analysis.Estimates of survival were from the Kaplan–Meier curves andtests of differences by the log-rank test. Univariate and mul-tivariable Cox models were used to test the independentprognostic significance of each variable. Reported P values aretwo sided.
Translational Relevance
Hormone receptor–positive (HRþ) breast cancer is clinicallyand biologically heterogeneous, and subgroups with differentprognostic and treatment sensitivities need to be identified.Here, we present the development and clinical validationacross multiple studies of a gene expression–based predictor,based on the well-known PAM50 assay, which is associatedwith chemotherapy and endocrine therapy response in earlybreast cancer beyond PAM50 risk of relapse (ROR) and intrin-sic subtypes. The potential clinical utility of this PAM50-basedchemoendocrine score (CES) predictormight be in the PAM50ROR intermediate, where the proportion of each CES group(endocrine-sensitive, intermediate, and chemosensitive) ismore than 25%. This is important as we await the results oflarge adjuvant clinical trials, such as TailorX or RxPonder, thathave randomly assigned patients with intermediate risk toadjuvant chemotherapy or not.
Prat et al.
Clin Cancer Res; 23(12) June 15, 2017 Clinical Cancer Research3036
on December 25, 2019. © 2017 American Association for Cancer Research.clincancerres.aacrjournals.org Downloaded from
Published OnlineFirst November 30, 2016; DOI: 10.1158/1078-0432.CCR-16-2092

ResultsGEICAM 2006-03 dataset
Sixty-three pre- and postmenopausal patientswere evaluated inthis study (Table 1). Most patients presented ductal carcinomas(83%), tumor sizes of 2 to 5 cm (76%), histologic grade 3 tumors(59%), clinical node-negative disease (54%), and luminal diseaseby PAM50 (84%).
Following chemotherapy, Luminal B tumors showed higherMiller–Payne response than Luminal A disease (mean 2.0 vs. 1.4,P ¼ 0.048). However, no difference in response between thetwo luminal subtypes was observed following endocrinetherapy (P ¼ 0.407). In addition, no statistical significant inter-action (P¼ 0.429) between subtype and treatment (endocrine vs.chemotherapy) for tumor response was observed. Interestingly,the only patient who achieved a pCR (i.e., Miller–Payne grade 5)had a Basal-like tumor and was contained within the chemother-apy arm.
Gene expression association with treatment sensitivityTo understand the biology associated with either chemother-
apy or endocrine sensitivity within HRþ/HER2� disease, weexplored the association between the expression of 543 breastcancer–related genes and Miller–Payne response in each treat-ment arm. High expression of 70 (12.9%) and 17 (3.1%) geneswas found significantly associated (P < 0.05 uncorrected formultiple comparisons) with response after endocrine therapyand chemotherapy, respectively. The gene list associated withendocrine therapy response was enriched for the following bio-
logical processes (Supplementary Material): vasculature develop-ment (e.g., AKT1 and catenin beta 1), tube development (e.g.,FOXA1 and gremlin 1), and cell growth (e.g., androgen receptorand fibroblast growth factor receptor 1). On the other hand, thegene list associated with chemotherapy response was enriched forcell cycle (e.g., EXO1 and MKI67) and extracellular matrix (e.g.,netrin 4 and thrombospondin 1).
We then evaluated the interaction between the expressions ofeach individual gene with response to therapy (endocrine vs.chemotherapy). Interestingly, 41 of the 70 genes associated withresponse to endocrine therapy, and 8 of 17 genes associated withchemotherapy response, showed a significant interaction withtreatment (P < 0.05 uncorrected formultiple comparisons). Thus,the biological factors associated with endocrine sensitivityseemed to be associated, at the same time, with chemotherapyresistance, and vice versa. Indeed, an overall inverse pattern wasobserved between expression of most genes and response totreatment (Fig. 1A).
To further understand the biological factors associated withtreatment response, we evaluated the mean expression of genesassociated with high endocrine but low chemotherapy sensitivity,or low endocrine but high chemotherapy sensitivity, across 1,034primary tumors representing all intrinsic molecular subtypes ofbreast cancer (Fig. 1B). The results revealed that the biologyassociated with chemoendocrine sensitivity is mostly driven bythe Luminal A (i.e., high endocrine but low chemotherapy sen-sitive) versus Basal-like biology (i.e., low endocrine but highchemotherapy sensitive).
Development of a PAM50-based CESOur previous results suggested that capturing the relative
differences in the Luminal A versus Basal-like biology withinHRþ/HER2� could help better predict endocrine and chemother-apy sensitivity. To capture this biological state in each tumor, weobtained, from the PAM50 classification algorithm, the correla-tion coefficients (CC) of each sample to the PAM50 Luminal Aand Basal-like subtype centroids, and then subtracted the 2 valuesto create the chemoendocrine score (CES¼CC to Luminal A –CCto Basal-like). Thus, samples with a positive score were identifiedas being more endocrine sensitive than chemotherapy sensitive,whereas samples with a negative score were identified as beingmore chemotherapy sensitive (CES-C) than endocrine sensitive(CES-E; Fig. 1C). From GEICAM 2006-03 samples, cutoffs basedon tertile groups were determined [CES-E vs. CES uncertain(CES-U) group, cutoff ¼ 0.70; CES-U vs. CES-C group, cutoff ¼0.30]. The interaction of the CES score (as a continuous variable)with treatment in the GEICAM 2006-03 trial provides someevidence of association (P ¼ 0.059).
MDACC-based datasetWe evaluated a combined dataset of 272 patients with
HRþ/HER2� disease treated with anthracycline/taxane-basedneoadjuvant chemotherapy across several neoadjuvant trials(Fig. 1D and Table 2). In this dataset, 51.5%, 25.8%, and 22.7%of the sampleswere identifiedasCES-E, -U, and -C, respectively. Therates of pCR across the CES-E, -U, and -C groups were 2.4%, 9.0%,and 23.7%, respectively (P < 0.0001), andwere found to be similareven if non-luminal tumors were removed (2.2%, 8.8%, and25.0%). The neoadjuvant chemotherapy predictive ability of CESwas independent of clinical–pathologic variables and intrinsicsubtype (Table 3; Supplementary Table S1). Similar results were
Table 1. Clinical–pathologic characteristics and subtype distribution in theGEICAM 2006-03 study
CT (%) ET (%) P
Number 32 (—) 31 (—) —
Age (mean) 53.7 (—) 52.3 (—) 0.596Menopausal statusPremenopausal 14 (44%) 14 (45%) 1.000Postmenopausal 18 (56%) 17 (55%)
Tumor stageT1 1 (3%) 2 (6%) 0.420T2 23 (72%) 25 (81%)T3 8 (25%) 4 (13%)
Mean tumor size (cm) 4.2 3.8 0.278NodeN0 15 (47%) 19 (61%) 0.501N1 16 (50%) 11 (35%)N2 1 (3%) 1 (3%)
GradeG1 0 (0%) 0 (0%)G2 8 (25%) 6 (19%) 0.862G3 18 (56%) 19 (61%)G4 6 (19%) 6 (19%)
Histologic typeDuctal 26 (81%) 26 (84%) 1.000Lobular 2 (6%) 2 (6%)Others 4 (13%) 3 (10%)
Ki-67 IHC (mean) 31.1 33.5 0.720Miller–Payne response (mean) 2.6 2.2 0.124PAM50Luminal A 16 (50%) 13 (42%) 0.564Luminal B 11 (34%) 13 (42%)HER2-E 0 (0%) 1 (3%)Basal-like 2 (6%) 0 (0%)Normal-like 3 (9%) 4 (13%)
Abbreviations: CT, chemotherapy arm; ET, endocrine therapy arm.
PAM50-Based Chemoendocrine Score
www.aacrjournals.org Clin Cancer Res; 23(12) June 15, 2017 3037
on December 25, 2019. © 2017 American Association for Cancer Research.clincancerres.aacrjournals.org Downloaded from
Published OnlineFirst November 30, 2016; DOI: 10.1158/1078-0432.CCR-16-2092

obtained when residual cancer burden (RCB) was used as theendpoint (Supplementary Tables S2 and S3).
Six gene expression-based signatures (i.e., PAM50 proliferationscore, ROR-P, genomic grade index, SET index, chemopredictor,DLDA30, and RCB predictor) have been previously reported inthis dataset (20). In addition, we applied a microarray-basedversion of OncotypeDX Recurrence Score (36, 37). Here, weevaluated the performance of CES to predict pCR withinHRþ/HER2� disease compared with these 7 gene signatures.Interestingly, CES provided the highest aROC (SupplementaryTables S4–S12) either as a continuous variable (aROC¼ 0.770)or as group categories (aROC ¼ 0.765). The second mostpredictive signature was the RCB predictor (aROC ¼ 0.740).Of note, the RCB predictor was trained using 165 of 272(60.7%) HRþ/HER2� samples from this dataset (i.e., the train-ing dataset). When these training samples were removed, CESshowed a higher performance either as a continuous variable(aROC ¼ 0.805) or as group categories (aROC ¼ 0.786) thanthe RCB predictor (aROC ¼ 0.640).
Malaga-based datasetWe evaluated a dataset of 180 patients with HRþ/HER2�
disease treatedwith anthracycline/taxane-based neoadjuvant che-motherapy (Table 2). In this dataset, 46.1%, 16.1%, and 37.8%ofthe samples were identified as CES-E, -U, and -C, respectively. ThepCR and RCB 0/1 rates across the CES-E, -U, and -C groups were2.4%/9.6%, 3.4%/17.2%, and 13.2%/30.9%, respectively (P ¼0.022 and 0.004).
To test the ability of CES to predict chemotherapy responseindependently of known clinical–pathologic variables andintrinsic subtype, we performed a multivariable logistic regres-sion analysis using RCB (0/1 vs. 2/3) as the endpoint since only12 samples achieved a RCB 0 (i.e., pCR) in this dataset. Theresults revealed that CES provided independent predictive infor-mation beyond intrinsic subtype (Table 4), Ki-67 by IHC (Sup-plementary Table S13) and PAM50 ROR score (SupplementaryTable S14). The aROC of CES for predicting RCB 0/1 was 0.746.Finally, we observed a significant association between CES andMiller–Payne response data (Supplementary Fig. S1).
Marsden-based dataset: CES and endocrine sensitivityWe evaluated a dataset of 103 postmenopausal patients with
HRþ disease treated with anastrozole for 16 weeks in the neoadju-vant setting (Table 2). In this dataset, 23.5%, 34.3%, and 42.2% ofsamples were identified as CES-E, -U, and -C, respectively. Clinicaltumor response (complete and partial response versus stable andprogressive disease) was used as the endpoint. No pCR wasobserved in this dataset. The rates of clinical tumor response acrossthe CES-E, -U, and -C groups were 75.0%, 48.6%, and 44.2%,respectively (P ¼ 0.043). CES was found to be the only variablesignificantly associated with response (Supplementary Table S15),independently of HER2 status (Supplementary Tables S15–S16).
Edinburgh-based dataset: CES and endocrine sensitivityWe evaluated a dataset of 120 postmenopausal patients with
HRþ disease treated with letrozole for at least 12 weeks in the
CES (low to high) Associationwith Response (OR)
0.10 0.32 1.00 3.16 10.00
MDACC
Malaga
Marsden
Edinburgh
Endocrine Chemotherapy
Higher Miller–Payne response
Lower Miller–Payne Response
Interm. Miller–Payne Response
Gene Expression Association
Treatment arm
TOP Genes
54
2 g
en
es
8
9
10
11
7
8
9
10
Me
an
exp
ress
ion
To
p 5
0 g
en
es
TCGA (n = 1,034)
Basal-likeHER2E
LumALumB
A
ZEB1ARNOTCH3FOXA1DEGS2GANG11AREGMYBL2BIRC5
B
Me
an
exp
ress
ion
To
p 5
0 g
en
es
DCC
hem
o
Chemotherapysensitivity
Endo
crin
e
Endocrinesensitivity
Figure 1.
Gene expression association with eitherchemotherapy or endocrine therapysensitivity. A, Association between theexpression of each individual gene(n ¼ 542) and Miller–Payne response ineach arm of the GEICAM 2006-03 trial.Selected top genes whose expression isfound significantly associated withresponse are shown on the right. B, Meanexpression of the top 50genes associatedwith endocrine sensitivity (top) andchemotherapy sensitivity (bottom) in theGEICAM 2006-03 trial across theintrinsic subtypes of breast cancer. TheRNAseq-based gene expression datahave been obtained from The CancerGenome Atlas breast cancer project dataportal (https://gdc.cancer.gov/). C,Significance and scoringof the CES. D, Association of CES (as acontinuous variable) with chemotherapyor endocrine therapy response in the 4validation data sets.
Prat et al.
Clin Cancer Res; 23(12) June 15, 2017 Clinical Cancer Research3038
on December 25, 2019. © 2017 American Association for Cancer Research.clincancerres.aacrjournals.org Downloaded from
Published OnlineFirst November 30, 2016; DOI: 10.1158/1078-0432.CCR-16-2092

neoadjuvant setting (Supplementary Fig. S2A). Two patients of120 achieved a complete response. Similar to previous results,CES as a continuous variable was found to be the only variable
significantly associated with a �70% reduction in tumor volumeby 90 days (Supplementary Fig. S2B), even within HER2-negativedisease (Supplementary Fig. S2C).
Table 2. Clinical–pathologic characteristics and subtype distribution of the 4 testing sets
MDACC Malaga Marsden EdinburghN (%) N (%) N (%) N (%)
Treatment CT CT ET ETN 272 180 103 120HER2 statusa
HER2-negative 272 (100%) 180 (100%) 89 (86%) 31 (69%)HER2-positive 0 (0%) 0 (0%) 14 (14%) 14 (31%)
Age (mean) 50.1 50.0 53.7 76.1Menopausal statusPremenopausal NA 108 (60%) 0 (0%) 0 (0%)Postmenopausal NA 72 (40%) 103 (100%) 120 (100%)
Tumor stageT0–T1 19 (7%) 18 (10%) 60 (58%) 10 (9%)T2 142 (52%) 115 (67%) 42 (36%)T3–T4 111 (41%) 39 (23%) 43 (42%) 63 (55%)
NodeN0 96 (35%) 67 (37%) 61 (59%) 86 (72%)N1 133 (49%) 61 (34%) 39 (38%) 34 (28%)N2–N3 43 (16%) 52 (29%) 3 (3%)
GradeG1 28 (11%) 27 (16%) 15 (15%) 13 (11%)G2 136 (53%) 96 (57%) 63 (62%) 82 (68%)G3 91 (36%) 46 (27%) 24 (23%) 25 (21%)
ET response rateb NA NA 53% 72%CT response ratepCR breast/axilla 8.8% 6.7% NA NA
PAM50Luminal A 141 (52%) 54 (30%) 37 (36%) —
Luminal B 102 (38%) 105 (58%) 20 (19%) —
HER2-E 6 (2%) 7 (4%) 12 (12%) —
Basal-like 7 (2%) 14 (8%) 4 (4%) —
Normal-like 16 (6%) — 30 (29%) —
Abbreviations: CT, chemotherapy, ET, endocrine therapy.aEdinburgh dataset has 75 patients without clinical HER2 status.bThe definition of ET response is different in theMarsden and Edinburgh data sets. Clinical tumor response (complete and partial response vs. stable and progressivedisease) was used as the endpoint in the Marsden dataset. Response was evaluated by imaging ultrasound in the Edinburgh dataset. Clinical tumor response wasdefined as tumor volume shrinkage of at least 70% by 90 days of treatment.
Table 3. CES association with chemotherapy sensitivity in the MDACC-based dataset
Univariate analysis Multivariable analysisSignatures N pCR rate OR Lower 95% Upper 95% P OR Lower 95% Upper 95% P
Age (cont. variable) — — 1.0 0.93 1.02 0.251 1.0 0.92 1.02 0.205Tumor sizeT0–T2 153 8% 1.0 — — — 1.0 — — —
T3–T4 107 9% 1.1 0.47 2.63 0.813 0.6 0.22 1.70 0.341Nodal statusN0 96 7% 1.0 — — — 1.0 — — —
N1 125 9% 1.2 0.46 3.29 0.685 0.9 0.30 2.78 0.882N2–3 39 13% 1.9 0.56 6.29 0.312 1.0 0.24 4.51 0.965
Grade1 26 4% 1.0 — — — 1.0 — — —
2 130 4% 1.0 0.11 8.93 1.000 0.7 0.07 6.88 0.7533 89 17% 5.1 0.64 40.34 0.125 1.8 0.18 18.42 0.608
PAM50Luminal A 134 3% 1.0 — — — 1.0 — — —
Luminal B 99 15% 5.8 1.86 18.08 0.002 1.2 0.25 6.28 0.792HER2-E 6 0% 0.0 — — 0.989 0.0 — — 0.991Basal-like 7 29% 13.0 1.91 88.50 0.009 0.4 0.02 9.97 0.586Normal-like 14 14% 5.4 0.90 32.69 0.065 1.7 0.23 12.75 0.602
CESCES-E 134 2% 1.0 — — — — — — —
CES-U 67 9% 4.3 1.04 17.75 0.044 — — — —
CES-C 59 24% 13.6 3.73 49.46 <0.001 — — — —
CES (cont. variable) — — 0.2 0.08 0.40 <0.001 0.2 0.03 0.77 0.022
PAM50-Based Chemoendocrine Score
www.aacrjournals.org Clin Cancer Res; 23(12) June 15, 2017 3039
on December 25, 2019. © 2017 American Association for Cancer Research.clincancerres.aacrjournals.org Downloaded from
Published OnlineFirst November 30, 2016; DOI: 10.1158/1078-0432.CCR-16-2092

Prognosis, intrinsic subtype, and chemoendocrine sensitivityTo better understand the relationship between prognosis,
intrinsic biology, and chemoendocrine sensitivity, we pulledtogether PAM50 data from many different data sets for a totalof 6,007 primary breast cancers representing all subtypes (Fig. 2).The results revealed that in the ROR-low group, 94.9% of caseswere identified asCES-E and100%were of the Luminal A subtype.In the ROR-high, 92.1% of the samples were identified as CES-C;non-luminal and Luminal B subtypes represented 64.3% and35.7% of the ROR-high/CES-C cases, respectively.
In the ROR-intermediate group, high heterogeneity wasobserved. In terms of intrinsic biology, Luminal A, LuminalB, and non-Luminal subtypes represented 44.4%, 31.5%, and24.1%, respectively. In terms of chemo/endocrine-sensitivity,CES-E, CES-U, and CES-C represented 40.6%, 30.3%, and29.1%, respectively. As expected, the vast majority of ROR-
intermediate/CES-E samples (77.3%) were of the Luminal Asubtype.
Survival outcome of CES within HRþ/ROR-intermediatedisease
To continue exploring the value of CES within HRþ/ROR-intermediate disease, we evaluated the association of CES withsurvival outcome in HRþ/ROR-intermediate early breast cancerin 4 independent data sets of patients treated with no adjuvantsystemic therapy (n¼ 189), adjuvant tamoxifen-only (n ¼ 846)or adjuvant chemotherapy and endocrine therapy (n ¼ 322 andn ¼ 148).
In patientswith node-negative disease treatedwithout adjuvantsystemic therapy, CES (as a continuous variable or as groupcategories) was found significantly associated with distantrelapse-free survival (Fig. 3A). The hazard ratio between the
Table 4. CES association with chemotherapy sensitivity in the Malaga dataset
Univariate analysis Multivariable analysisSignatures N RCB0/1 rate OR Lower 95% Upper 95% P OR Lower 95% Upper 95% P
Age (cont. variable) — — 1.0 0.95 1.02 0.331 1.0 0.96 1.07 0.599Tumor sizeT0–T2 133 22% 1.0 — — — 1.0 — — —
T3–T4 39 10% 0.4 0.13 1.25 0.116 0.4 0.09 1.90 0.260Grade1 27 7% 1.0 — — — 1.0 — — —
2 96 16% 2.3 0.50 10.82 0.286 1.6 0.26 9.31 0.6253 46 35% 6.7 1.40 31.82 0.017 3.0 0.40 23.34 0.283
PAM50Luminal A 54 9% 1.0 — — — 1.0 — — —
Luminal B 105 20% 2.4 0.87 6.91 0.090 0.9 0.19 4.34 0.905HER2-E 7 14% 1.6 0.16 16.43 0.677 0.1 0.00 3.19 0.188Basal-like 14 50% 9.8 2.43 39.51 0.001 0.1 0.00 3.40 0.214
CESCES-E 83 10% 1.0 — — — — — — —
CES-U 29 17% 2.0 0.58 6.54 0.277 — — — —
CES-C 68 31% 4.2 1.72 10.22 0.002 — — — —
CES (cont. variable) — — 0.2 0.09 0.44 <0.001 0.2 0.07 0.76 0.016
100806040200
2.0
1.0
0
–1.0
–2.0
Luminal BLuminal AHER2-EBasal-like
Subtypes
CES
SC
OR
E
PAM50 ROR
ROR-LOW ROR-INTERM ROR-HIGH
CES
-CC
ES-E
Patie
nts,
n
BA
0
400
800
1,200
1,600
2,000
CES
-C
CES
-U
CES
-E
CES
-C
CES
-U
CES
-E
CES
-C
CES
-U
CES
-E
ROR-LOW ROR-INTERM ROR-HIGH
Figure 2.
Prognosis (PAM50 ROR), intrinsic subtype, and CES in 6,007 primary breast cancers. A, A scatter plot of CES score and ROR score, colored by subtype, isshown. The two horizontal lines indicate the cutoffs of each CES group. The two vertical lines indicate the cutoffs of each PAM50 ROR group. B, Number ofpatients in each CES group based on ROR. Each bar is colored by subtype.
Prat et al.
Clin Cancer Res; 23(12) June 15, 2017 Clinical Cancer Research3040
on December 25, 2019. © 2017 American Association for Cancer Research.clincancerres.aacrjournals.org Downloaded from
Published OnlineFirst November 30, 2016; DOI: 10.1158/1078-0432.CCR-16-2092
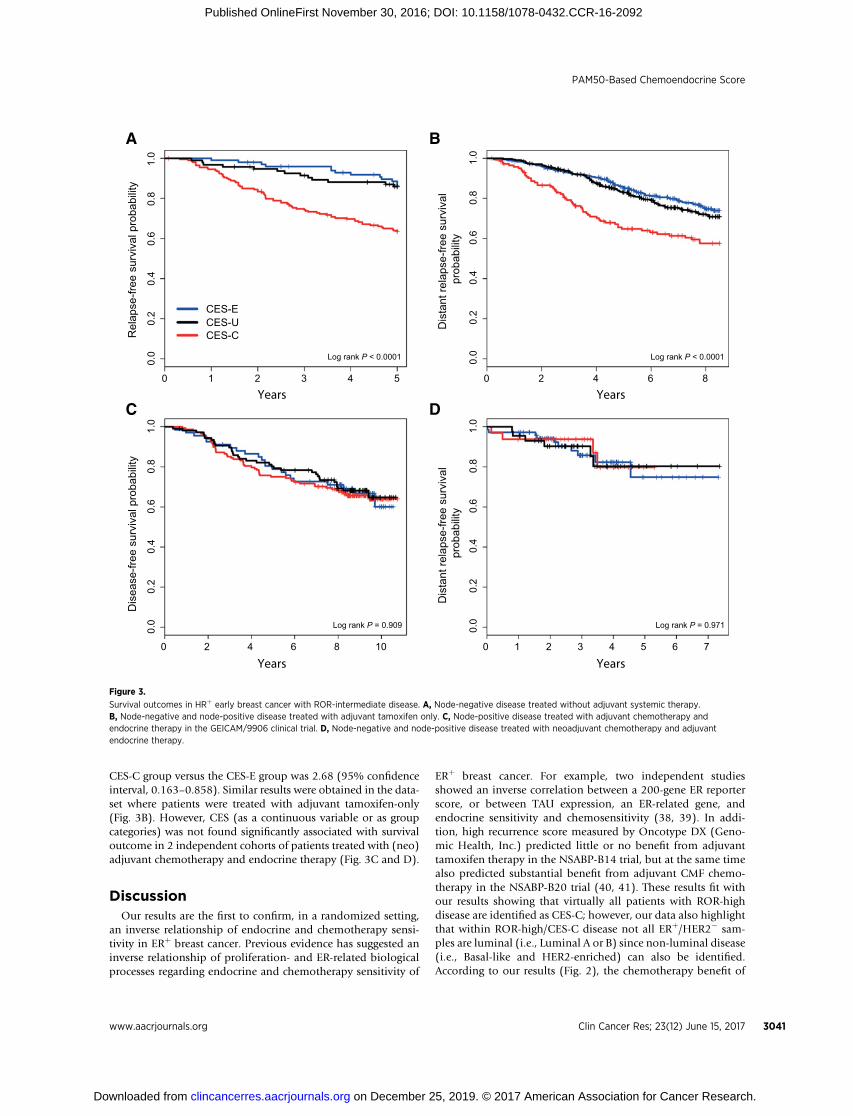
CES-C group versus the CES-E group was 2.68 (95% confidenceinterval, 0.163–0.858). Similar results were obtained in the data-set where patients were treated with adjuvant tamoxifen-only(Fig. 3B). However, CES (as a continuous variable or as groupcategories) was not found significantly associated with survivaloutcome in 2 independent cohorts of patients treated with (neo)adjuvant chemotherapy and endocrine therapy (Fig. 3C and D).
DiscussionOur results are the first to confirm, in a randomized setting,
an inverse relationship of endocrine and chemotherapy sensi-tivity in ERþ breast cancer. Previous evidence has suggested aninverse relationship of proliferation- and ER-related biologicalprocesses regarding endocrine and chemotherapy sensitivity of
ERþ breast cancer. For example, two independent studiesshowed an inverse correlation between a 200-gene ER reporterscore, or between TAU expression, an ER-related gene, andendocrine sensitivity and chemosensitivity (38, 39). In addi-tion, high recurrence score measured by Oncotype DX (Geno-mic Health, Inc.) predicted little or no benefit from adjuvanttamoxifen therapy in the NSABP-B14 trial, but at the same timealso predicted substantial benefit from adjuvant CMF chemo-therapy in the NSABP-B20 trial (40, 41). These results fit withour results showing that virtually all patients with ROR-highdisease are identified as CES-C; however, our data also highlightthat within ROR-high/CES-C disease not all ERþ/HER2� sam-ples are luminal (i.e., Luminal A or B) since non-luminal disease(i.e., Basal-like and HER2-enriched) can also be identified.According to our results (Fig. 2), the chemotherapy benefit of
543210
0.0
0.2
0.4
0.6
0.8
1.0
Rel
apse
-free
sur
viva
l pro
babi
lity
Log rank P < 0.0001
6420 8
0.0
0.2
0.4
0.6
0.8
1.0
6543210 7
0.0
0.2
0.4
0.6
0.8
1.0
Log rank P = 0.971
86420 10
0.0
0.2
0.4
0.6
0.8
1.0
Log rank P = 0.909
CES-E
CES-CCES-U
Dis
ease
-free
sur
viva
l pro
babi
lity
Dis
tant
rela
pse-
free
surv
ival
prob
abili
ty
Years Years
Years Years
BA
DC
Dis
tant
rela
pse-
free
surv
ival
prob
abili
ty
Log rank P < 0.0001
Figure 3.
Survival outcomes in HRþ early breast cancer with ROR-intermediate disease. A, Node-negative disease treated without adjuvant systemic therapy.B, Node-negative and node-positive disease treated with adjuvant tamoxifen only. C, Node-positive disease treated with adjuvant chemotherapy andendocrine therapy in the GEICAM/9906 clinical trial. D, Node-negative and node-positive disease treated with neoadjuvant chemotherapy and adjuvantendocrine therapy.
PAM50-Based Chemoendocrine Score
www.aacrjournals.org Clin Cancer Res; 23(12) June 15, 2017 3041
on December 25, 2019. © 2017 American Association for Cancer Research.clincancerres.aacrjournals.org Downloaded from
Published OnlineFirst November 30, 2016; DOI: 10.1158/1078-0432.CCR-16-2092
ROR-high/non-luminal tumors within HRþ/HER2� disease islikely even greater than ROR-high/Luminal B tumors.
Our results also suggest that amain driver of endocrine therapysensitivity and chemotherapy sensitivity within ERþ/HER2� dis-ease is the Basal-like versus Luminal A intrinsic biology. Tocapture both biological states in each individual sample, wecalculated the correlation coefficients of each sample to bothPAM50 centroids (i.e., Luminal A and Basal-like) and then sub-tracted both coefficients. Thus, instead of choosing a gene signa-ture (e.g., a proliferation-based signature) of the many signaturesthat can discriminate between both subtypes in one way oranother, we decided to incorporate into a score the Basal-likeversus Luminal A intrinsic state of each tumor as identified by thePAM50 subtype predictor. Of note, the PAM50 genes were orig-inally selected for their ability to capture the intrinsic biologydisplayed by 1,900 genes (i.e., the so-called intrinsic gene list). Infact, in the TCGA, intrinsic subtype defined by PAM50 capturedthe vast majority of the biological diversity displayed by mostmolecular data types analyzed (1).
From a clinical perspective, our results support current breastcancer guidelines for the systemic treatment of early HRþ/HER2�
breast cancer. On the one hand, patients with a low-ROR scoreand a low tumor burden (i.e., <10% risk of distant relapse at 10years) are recommended to be treated with endocrine therapy-only (42). Indeed, our results suggest that these patients havetumors that are highly endocrine sensitive and have low chemo-therapy sensitivity. On the other hand, patients with high-riskHRþ/HER2� disease are recommended to be treated withendocrine therapy and chemotherapy. According to our anal-ysis, this group is the one with high chemotherapy benefit andlow endocrine benefit. Regarding endocrine therapy in thisgroup, the main issue is that we do not have survival datasuggesting that CES-C tumors do not benefit at all from endo-crine therapy. Therefore, withdrawal of a potentially efficacioustreatment strategy such as endocrine therapy in a patient withan ERþ tumor (as defined by the ASCO/CAP guidelines) that isidentified as CES-C or ROR-high should not be recommendedtoday, although in patients whose tumors contain low levels ofER (1% to 10%), ASCO/CAP recommend to discuss the prosand cons of endocrine therapy. A large randomized adjuvanttrial involving thousands of patients to answer this particularquestion is unlikely to happen.
Although the clinical implications of CES in low- and high-riskHRþ/HER2� disease are minimal, the observation that interme-diate-risk HRþ/HER2� disease, which represents �30% of newlydiagnosed breast cancer, is biologically heterogeneous with arange of chemotherapy sensitivities might have implications forthe interpretation of two ongoing prospective clinical trials. In theTailorX phase III trial, 4,500 patients with HRþ/HER2� node-negative early breast cancer with intermediate RS have beenrandomly assigned to adjuvant chemotherapy or no chemother-apy. According to our analysis, this intermediate group might becomposed of at least 3 groups with different chemotherapysensitivities. Of note, the CES-U group seems to be a genuinegray area where decisions regarding the need of chemotherapymight be difficult. A similar situation might occur in the RxPON-DER phase III clinical trial where patients with HRþ/HER2� earlybreast cancer, and 1-3-positive lymph nodes, with low/interme-diate risk are being randomly assigned to adjuvant chemotherapyor not. A potential explanation is that OncotypeDX RS, as well asother prognostic gene expression-based tests, such as PAM50ROR
or MammaPrint (43), have been specifically designed or trainedto predict outcome and not intrinsic tumor biology or treatmentsensitivity. Although a strong negative correlation is observedbetween ROR (risk) and CES (drug sensitivity), there are sub-stantial differences between them at the individual level (�40%discordance).
There are several caveats to our study. First, this is a retrospectivestudy involving heterogeneous patient populations and theresults need to be confirmed in a prospective clinical trial(s).Second, although the data presented here validate CES from aclinical perspective, further analytical validation will be needed,since in most data sets, except the Malaga set, the research-basedversion of PAM50 was used. However, the fact that CES (as acontinuous variable and the 2 cutoff points) predicted pCR in theMalaga set suggests that analytical validation of this biomarker isfeasible. Third, we did not evaluate the association of CES withsurvival data from a randomized clinical trial of adjuvant che-motherapy versus no adjuvant chemotherapy, or adjuvant endo-crine therapy versus no adjuvant endocrine therapy. Thus, thepredictive value of these signatures was evaluated only in theneoadjuvant setting where different tumor response endpointswere evaluated, most of which have been associated with patientsurvival (18, 44). Fourth, some of the signatures evaluated in theMDACC-based dataset, such as OncotypeDX recurrence score orgenomic grade index, were derived from microarray-based dataand thus are not the commercially available versions. Fifth, wewere not able to demonstrate a consistent association of CES withendocrine response in HRþ disease after excluding the HER2-positive cases. In the Edinburgh dataset, HER2 status was notavailable for all patients. Although we derived an ERBB2 expres-sion-based surrogate definition of HER2 status and showed thatCES is independently associated with response, this was notprespecified and does not meet REMARK guidelines. In addition,the association of CES with endocrine response did not reachstatistical significance (P ¼ 0.09) in patients with HRþ/HER2�
disease in the Marsden dataset. Finally, patients from each of thedata sets received different anthracycline/taxane-based chemo-therapy regimens, schedules, and doses, and thus the ability of thesignatures to predict response to particular chemotherapeutics ortreatment regimens could not be tested.
Another important consideration of our study is thatwedid notattempt to identify anoptimal cutoff(s) forCES but rather focusedon the association of the continuous expression of CES with eachendpoint. Themain reason is that different gene expression-basedplatforms and protocols were used in each cohort and, thus,standardization of a biomarker cutoff point would have beendifficult to achieve andmost likely unreliable. In any case, the factthat all four testing sets gave very similar associations, and werefound independently of the platform/protocol used, argues infavor of a robust finding.
To conclude, CES is a single genomic signature capable ofmeasuring chemoendocrine sensitivity in HRþ/HER2� breastcancer beyond intrinsic subtype, other genomic signatures, andthe standard pathology variables. CES could be of particularclinical value in patients with HRþ/HER2� intermediate-riskdisease where the benefit of adjuvant multiagent chemotherapyis unclear.
Disclosure of Potential Conflicts of InterestA. Prat reports receiving commercial research grants from and is a consultant/
advisory board member for Nanostring Technologies. A. Lluch is a consultant/
Prat et al.
Clin Cancer Res; 23(12) June 15, 2017 Clinical Cancer Research3042
on December 25, 2019. © 2017 American Association for Cancer Research.clincancerres.aacrjournals.org Downloaded from
Published OnlineFirst November 30, 2016; DOI: 10.1158/1078-0432.CCR-16-2092

advisory board member for Novartis, Pfizer, and Roche. J.S. Parker is listed as aco-inventor on a pending patent on the PAM50, which is owned by UniversityGenomics, LLC and licensed to Nanostring. M. Dowsett reports receivingspeakers bureau honoraria from Myriad, and is a consultant/advisory boardmember for Genoptix and Nanostring. C.M. Perou is an employee of, holdsownership interest (including patents) in, and is a consultant/advisory boardmember for Bioclassifier LLC.Nopotential conflicts of interest were disclosed bythe other authors.
DisclaimerThe funders did not have any role in the study design, conduct, or decision to
submit the manuscript for publication.
Authors' ContributionsConception and design: A. Prat, J. Albanell, P. S�anchez-Rovira, B. Adamo,C.M. Perou, E. AlbaDevelopment of methodology: A. Prat, P. S�anchez-Rovira, B. Jimenez,M. Martín, C.M. PerouAcquisition of data (provided animals, acquired and managed patients,provided facilities, etc.): A. Plazaola, N. Ribelles, B. Jimenez, M. Dowsett,M. Martín, J.M. Dixon, C.M. Perou, E. AlbaAnalysis and interpretation of data (e.g., statistical analysis, biostatistics,computational analysis): A. Prat, L. Calvo, J.I. Chac�on, P. S�anchez-Rovira,M. Mu~noz, L. Par�e, J.S. Parker, A.A. Bin Aiderus, B. Adamo, E. Carrasco,M. Martín, C.M. Perou, E. Alba
Writing, review, and/or revision of the manuscript: A. Prat, A. Lluch,A.K. Dunbier, L. Calvo, J. Albanell, J. de la Haba-Rodríguez, A. Arcusa,J.I. Chac�on, P. S�anchez-Rovira, M. Mu~noz, J.S. Parker, B. Jimenez, R. Caballero,B. Adamo, M. Dowsett, E. Carrasco, M. Martín, J.M. Dixon, C.M. Perou, E. AlbaAdministrative, technical, or material support (i.e., reporting or organizingdata, constructing databases): A.K. Turnbull, P. S�anchez-Rovira, B. Jimenez,R. CaballeroStudy supervision: P. S�anchez-Rovira, E. Alba
AcknowledgmentsThis work was supported by funds from the NCI Breast SPORE program
(P50-CA58223-09A1), by RO1- CA148761 (C.M. Perou), by Instituto de SaludCarlos III - PI13/01718 (A. Prat), by a Career Catalyst Grant from the SusanKomen Foundation (A. Prat), by Breast Cancer Now (formerly BreakthroughBreast Cancer), by the Royal Marsden NIHR Biomedical Research Centre, byBanco BilbaoVizcaya Argentaria (BBVA) Foundation (A. Prat), and by the BreastCancer Research Foundation. This work was also supported by funds fromFEDER (RETICC): RD12/0036/0076 (J. Albanell), RD12/0036/0051 (J. Alba-nell), RD12/0036/0070 (A. Lluch), and RD12/0036/0076 (M. Mu~noz).
The costs of publication of this articlewere defrayed inpart by the payment ofpage charges. This article must therefore be hereby marked advertisement inaccordance with 18 U.S.C. Section 1734 solely to indicate this fact.
Received August 20, 2016; revised October 22, 2016; accepted November 7,2016; published OnlineFirst November 30, 2016.
References1. TCGA. Comprehensive molecular portraits of human breast tumours.
Nature 2012;490:61–70.2. Prat A, Cheang MCU, Martín M, Parker JS, Carrasco E, Caballero R, et al.
Prognostic significance of progesterone receptor–positive tumor cells with-in immunohistochemically defined luminal A breast cancer. J Clin Oncol2013;31:203–9.
3. Ades F, Zardavas D, Bozovic-Spasojevic I, Pugliano L, Fumagalli D, deAzambuja E, et al. Luminal B breast cancer: molecular characterization,clinical management, and future perspectives. J Clin Oncol 2014;32:2794–803.
4. Prat A, Perou CM. Deconstructing the molecular portraits of breast cancer.Mol Oncol 2011;5:5–23.
5. Prat A, Ellis MJ, Perou CM. Practical implications of gene-expression-basedassays for breast oncologists. Nat Rev Clin Oncol 2012;9:48–57.
6. Perou CM, Sorlie T, Eisen MB, van de Rijn M, Jeffrey SS, Rees CA, et al.Molecular portraits of human breast tumours. Nature 2000;406:747–52.
7. Martín M, Prat A, Rodríguez-Lescure �A, Caballero R, Ebbert MW, Mun�arrizB, et al. PAM50proliferation score as a predictor ofweekly paclitaxel benefitin breast cancer. Breast Cancer Res Treat 2013;138:457–66.
8. Prat A, Carey LA, Adamo B, Vidal M, Tabernero J, Cort�es J, et al. Molecularfeatures and survival outcomes of the intrinsic subtypes within HER2-positive breast cancer. J Natl Cancer Inst 2014;106;pii:dju152. doi:10.1093/jnci/dju152.
9. Usary J, ZhaoW, Darr D, Roberts PJ, Liu M, Balletta L, et al. Predicting drugresponsiveness in human cancers using genetically engineered mice. ClinCancer Res 2013;19:4889–99.
10. vonMinckwitz G, UntchM, Blohmer J-U, Costa SD, EidtmannH, FaschingPA, et al. Definition and impact of pathologic complete response onprognosis after neoadjuvant chemotherapy in various intrinsic breastcancer subtypes. J Clin Oncol 2012;30:1796–804.
11. Prat A, Parker JS, Fan C, Perou CM. PAM50 assay and the three-genemodelfor identifying the major and clinically relevant molecular subtypes ofbreast cancer. Breast Cancer Res Treat 2012;135:301–306.
12. Prat A, Fan C, Fern�andez A, Hoadley KA, Martinello R, Vidal M, et al.Response and survival of breast cancer intrinsic subtypes following multi-agent neoadjuvant chemotherapy. BMC Med 2015;13:1–11.
13. EllisMJ, SumanVJ,Hoog J, Lin L, Snider J, Prat A, et al. Randomized phase iineoadjuvant comparison between letrozole, anastrozole, and exemestanefor postmenopausal womenwith estrogen receptor–rich stage 2 to 3 breastcancer: clinical and biomarker outcomes and predictive value of the
baseline PAM50-based intrinsic subtype—ACOSOG Z1031. J Clin Oncol2011;29:2342–9.
14. Dunbier AK, Anderson H, Ghazoui Z, Salter J, Parker JS, Perou CM, et al.Association between breast cancer subtypes and response to neoadjuvantanastrozole. Steroids 2011;76:736–40.
15. Goldhirsch A, Winer EP, Coates AS, Gelber RD, Piccart-Gebhart M, Th€urli-mann B, et al. Personalizing the treatment of women with early breastcancer: highlights of the St Gallen international expert consensus on theprimary therapy of early breast cancer 2013. Ann Oncol 2013.
16. Alba E, Calvo L, Albanell J, De la Haba JR, Arcusa Lanza A, Chacon JI,et al. Chemotherapy (CT) and hormonotherapy (HT) as neoadjuvanttreatment in luminal breast cancer patients: results from the GEICAM/2006-03, a multicenter, randomized, phase-II study. Ann Oncol2012;23:3069–74.
17. Wolff AC, Hammond MEH, Schwartz JN, Hagerty KL, Allred DC, Cote RJ,et al. American Society of Clinical Oncology/College of American pathol-ogists guideline recommendations for human epidermal growth factorreceptor 2 testing in breast cancer. J Clin Oncol 2006;25:118–45.
18. Ogston KN, Miller ID, Payne S, Hutcheon AW, Sarkar TK, Smith I, et al. Anew histological grading system to assess response of breast cancers toprimary chemotherapy: prognostic significance and survival. Breast 2003;12:320–7.
19. Geiss GK, Bumgarner RE, Birditt B, Dahl T, Dowidar N, Dunaway DL, et al.Direct multiplexed measurement of gene expression with color-codedprobe pairs. Nat Biotech 2008;26:317–25.
20. Hatzis C, Pusztai L, Valero V, Booser DJ, Esserman L, Lluch A, et al. Agenomic predictor of response and survival following taxane-anthracyclinechemotherapy for invasive breast cancer. JAMA 2011;305:1873–81.
21. Prat A, Galv�an P, Jimenez B, BuckinghamW, Jeiranian HA, Schaper C, et al.Prediction of response to neoadjuvant chemotherapy using core needlebiopsy samples with the Prosigna assay. Clin Cancer Res 2016;22:560–6.
22. Dunbier AK, Anderson H, Ghazoui Z, Folkerd EJ, A'Hern R, Crowder RJ,et al. Relationship betweenplasma estradiol levels and estrogen-responsivegene expression in estrogen receptor–positive breast cancer in postmen-opausal women. J Clin Oncol 2010;28:1161–7.
23. Smith IE, Walsh G, Skene A, Llombart A, Mayordomo JI, Detre S, et al. APhase II placebo-controlled trial of neoadjuvant anastrozole alone or withgefitinib in early breast cancer. J Clin Oncol 2007;25:3816–22.
24. Turnbull AK, Arthur LM, Renshaw L, Larionov AA, Kay C, Dunbier AK, et al.Accurate prediction and validation of response to endocrine therapy inbreast cancer. J Clin Oncol 2015;33:2270–8.
PAM50-Based Chemoendocrine Score
www.aacrjournals.org Clin Cancer Res; 23(12) June 15, 2017 3043
on December 25, 2019. © 2017 American Association for Cancer Research.clincancerres.aacrjournals.org Downloaded from
Published OnlineFirst November 30, 2016; DOI: 10.1158/1078-0432.CCR-16-2092

25. Fan C, Prat A, Parker JS, Liu Y, Carey LA, Troester MA, et al. Buildingprognostic models for breast cancer patients using clinical variables andhundreds of gene expression signatures. BMC Med Genomics 2011;4:1–15.
26. Prat A, Parker JS, Fan C, Cheang MCU, Miller LD, Bergh J, et al.Concordance among gene expression-based predictors for ER-positivebreast cancer treated with adjuvant tamoxifen. Ann Oncol 2012;23:2866–73.
27. Parker JS, Mullins M, Cheang MCU, Leung S, Voduc D, Vickery T, et al.Supervised risk predictor of breast cancer based on intrinsic subtypes. J ClinOncol 2009;27:1160–7.
28. Nielsen TO, Parker JS, Leung S, Voduc D, Ebbert M, Vickery T, et al. Acomparison of PAM50 intrinsic subtyping with immunohistochemistryand clinical prognostic factors in tamoxifen-treated estrogen receptor-positive breast cancer. Clin Cancer Res 2010;16:5222–32.
29. Prat A, Lluch A, Albanell J, Barry WT, Fan C, Chacon JI, et al. Predictingresponse and survival in chemotherapy-treated triple-negative breast can-cer. Br J Cancer 2014;111:1532–41.
30. Prat A, Ellis MJ, Perou CM. Practical implications of gene-expression-basedassays for breast oncologists. Nat Rev Clin Oncol 2011;9:48–57.
31. Curtis C, Shah SP, Chin S-F, Turashvili G, Rueda OM, Dunning MJ, et al.The genomic and transcriptomic architecture of 2,000 breast tumoursreveals novel subgroups. Nature 2012;486:346–52.
32. HorakCE, Pusztai L, XingG, TrifanOC, SauraC, TsengL-M, et al. Biomarkeranalysis of neoadjuvant doxorubicin/cyclophosphamide followed by ixa-bepilone or paclitaxel in early-stage breast cancer. Clin Cancer Res 2013;19:1587–95.
33. Fan C, Prat A, Parker J, Liu Y, Carey L, Troester M, et al. Building prognosticmodels for breast cancer patients using clinical variables and hundreds ofgene expression signatures. BMC Med Genomics 2011;4:3.
34. Dennis G, Sherman BT, Hosack DA, Yang J, GaoW, Lane HC, et al. DAVID:database for annotation, visualization, and Integrated discovery. GenomeBiol 2003;4:R60.
35. Tusher VG, Tibshirani R, Chu G. Significance analysis of microarraysapplied to the ionizing radiation response. Proc Natl Acad Sci U S A2001;98:5116–21.
36. Fan C, Oh DS, Wessels L, Weigelt B, Nuyten DSA, Nobel AB, et al.Concordance among gene-expression–based predictors for breast cancer.N Engl J Med 2006;355:560–9.
37. Paik S, Shak S, Tang G, KimC, Baker J, CroninM, et al. Amultigene assay topredict recurrence of tamoxifen-treated, node-negative breast cancer.N Engl J Med 2004;351:2817–26.
38. Symmans WF, Hatzis C, Sotiriou C, Andre F, Peintinger F, Regitnig P, et al.Genomic index of sensitivity to endocrine therapy for breast cancer. J ClinOncol 2010;28:4111–9.
39. Andre F, Hatzis C, Anderson K, Sotiriou C, Mazouni C, Mejia J, et al.Microtubule-associated protein-tau is a bifunctional predictor of endo-crine sensitivity and chemotherapy resistance in estrogen receptor–positivebreast cancer. Clin Cancer Res 2007;13:2061–7.
40. Paik S, Shak S, Tang G, KimC, Baker J, CroninM, et al. Amultigene assay topredict recurrence of tamoxifen-treated, node-negative breast cancer.N Engl J Med 2004;351:2817–26.
41. Paik S, Tang G, Shak S, Kim C, Baker J, Kim W, et al. Gene expression andbenefit of chemotherapy inwomenwith node-negative, estrogen receptor–positive breast cancer. J Clin Oncol 2006;24:3726–34.
42. Harris LN, Ismaila N,McShane LM, Andre F, Collyar DE, Gonzalez-AnguloAM, et al. Use of biomarkers to guide decisions on adjuvant systemictherapy for women with early-stage invasive breast cancer: AmericanSociety of Clinical Oncology Clinical Practice Guideline. J Clin Oncol2016;34:1134–50.
43. van 't Veer LJ, DaiH, van de VijverMJ,He YD,Hart AAM,MaoM, et al. Geneexpression profiling predicts clinical outcome of breast cancer. Nature2002;415:530–6.
44. Cortazar P, Zhang L, Untch M, Mehta K, Costantino JP, Wolmark N, et al.Pathological complete response and long-term clinical benefit in breastcancer: the CTNeoBC pooled analysis. Lancet 2014;384:164–72.
Clin Cancer Res; 23(12) June 15, 2017 Clinical Cancer Research3044
Prat et al.
on December 25, 2019. © 2017 American Association for Cancer Research.clincancerres.aacrjournals.org Downloaded from
Published OnlineFirst November 30, 2016; DOI: 10.1158/1078-0432.CCR-16-2092
2017;23:3035-3044. Published OnlineFirst November 30, 2016.Clin Cancer Res Aleix Prat, Ana Lluch, Arran K. Turnbull, et al. Positive Breast Cancer with an Intermediate Risk of Relapse
−A PAM50-Based Chemoendocrine Score for Hormone Receptor
Updated version
10.1158/1078-0432.CCR-16-2092doi:
Access the most recent version of this article at:
Material
Supplementary
http://clincancerres.aacrjournals.org/content/suppl/2017/06/21/1078-0432.CCR-16-2092.DC1
Access the most recent supplemental material at:
Cited articles
http://clincancerres.aacrjournals.org/content/23/12/3035.full#ref-list-1
This article cites 43 articles, 17 of which you can access for free at:
Citing articles
http://clincancerres.aacrjournals.org/content/23/12/3035.full#related-urls
This article has been cited by 2 HighWire-hosted articles. Access the articles at:
E-mail alerts related to this article or journal.Sign up to receive free email-alerts
Subscriptions
Reprints and
To order reprints of this article or to subscribe to the journal, contact the AACR Publications Department at
Permissions
Rightslink site. Click on "Request Permissions" which will take you to the Copyright Clearance Center's (CCC)
.http://clincancerres.aacrjournals.org/content/23/12/3035To request permission to re-use all or part of this article, use this link
on December 25, 2019. © 2017 American Association for Cancer Research.clincancerres.aacrjournals.org Downloaded from
Published OnlineFirst November 30, 2016; DOI: 10.1158/1078-0432.CCR-16-2092