a possibility of producing porous asphalt in palestine ... · a possibility of producing porous...
TRANSCRIPT
A Possibility of Producing Porous Asphalt in
Palestine According to ASTM D7064
فلسطين طبقاً للمواصفات إمكانية إنتاج األسفلت المسامي في
ASTM D7064األمريكية
Mousa Maree Mousa Krezem
Supervised by
Prof. Dr. Shafik Jendia
Proffesor of Civil Engineering
A thesis submitted in partial fulfillment of the requirements for the degree of
Master of Science in Infrastructure Management – Civil Engineering
Oct. 2018
زةــغ – ةــالميــــــة اإلســـــــــامعـالج
شئون البحث العلمي والدراسات العليا
الهندســـــــــــــــــةة ــــــــــــــــــــليـك
الهندســــة المدنيـــــــةر ـــــــماجستي
إدارة البنيــــــــــــــــة التحتيــــــــــــة
The Islamic University–Gaza
Research and Postgraduate Affairs
Faculty of Engineering
Master of Civil Engineering
Infrastructure Management


II
اإلهداء
نبينا محمد ) صلى هللا عليه وسلم( ....البشرية ومنبع العلم إلى معلم
بتلع الحياة ....إلى ذلك العظيم الذي علمني ما لم تعلمني إياه الجامعات بي العزيزا .... علمني كيف ا
بقى من ميراث المال الماجدة إلى تلك ن ميراث العلم خير وا مي ال.... التي علمتني ا رؤوما
بي مي وا مد إلى ا نا(( .... هللا في عمرهماا نا ب ))ا مدين لهما ا
زوجتي الغالية .... إلى زهرة النرجس التي تفيض حباً ونقاًء وعطراً
ولى إلى من تسعد عيني برؤياه ويطرب قلبي بنجواه .... إلى دراج العمر ال ....من لم يزل يحبو على ا
(خالد) ثمرة فؤادي
زهار إلى ....إلى من يسعد قلبي بلقياهم زكى ال خواتي ....روضة الحب التي تنبت ا إخوتي وا
هدي هذأ ألجهد ألمتوأضع أ

III
Acknowledgements
Firstly, I thank great Allah for giving me intention and patience to complete this work.
Secondly, I wish to express my sincere gratitude particularly to my supervisor,
Prof. Dr. Shafik Jendia for his patience and kind guidance throughout the period of
laboratory work and report writing. Without his attention and dedicated guidance, this
report would not be successfully completed.
I would like to express my deep thanks and gratitude to my father, mother and wife for
their unlimited support and encouragement.
In additional, I wish to extend my sincere gratitude to my friend Eng. Shaher Matar for
his assistance in laboratory work.
Moreover, I am also very thankful to the team of laboratory of Consulting Center for
Quality and Calibration (Soil and Materials Testing Laboratory) for their assistance in
lending helping hand in the time of needs.

IV
Abstract
Modern highway transportation faces many challenges like high traffic density, heavy
load and high speed thus the asphalt pavements are founded to be subjected to various
types of distress such as fatigue cracking, rutting and raveling. On the other hand, another
type of challenges should be taken into consideration especially those which are related
to storm water and its harmful effects on the roads and drivers, hence the need to research
in porous asphalt has been raised.
Porous asphalt pavements offer an alternative technology for storm water management
because it differs from traditional asphalt pavement designs in its high void ratio which
can reach more than 25 %. Study aims include study the different characteristics and
properties of porous asphalt, and improve the quantity of groundwater storage in Palestine
by reducing the water losses and runoff through using porous asphalt.
The practical program of this study starts with studying the different properties of the
used aggregates in preparing porous asphalt samples (Specific Gravity and Adsorption)
then studying the different characteristics of used bitumen (density, ductility .. etc.). 12
porous asphalt samples from 3 aggregate gradations were produced (4 samples for each
gradation) with a trail bitumen content 6% in order to determine the aggregate gradation
that gives the highest air voids (Va%) ratio. After that, 30 porous asphalt samples were
produced using 6 different bitumen contents starting from 3.5% to 6 % with 0.5% as an
increment in order to determine the three most suitable bitumen contents that should be
used in porous asphalt through subjecting them to Draindown and Cantabro Abrasion
Tests. Marshal mix design procedure was then used on new produced 9 samples to
determine the Optimum Bitumen Content (OBC) from the three most suitable bitumen
contents (3.5%, 4% and 4.5%) where it was found that 3.5 % is the Optimum Bitumen
Content. Finally, 2 samples of porous asphalt were tested against permeability to find
permeability coefficient which was found to be approximately 55 m/day.
The study recommendations include increase research in porous asphalt topics, start
preparing unique Palestinian specifications related to porous asphalt and its properties,
and finally to start using porous asphalt in Palestine in order to gain its useful properties
especially those which are related to decreasing runoff water amounts due to its higher
permeability.

V
ملخص الدراسة
تواجه شبببببببكاق الطري الحديثة العديد من التحدياق المتمثلة مي ااحماي الثقيلة الناتاة عن الكثامة المرورية العالية
ر على هذه الطري وبالتالي تتعرض الرصببب اق االسببب لتية انواف مختل ة وكذلك السبببرعاق العالية للمركباق التي تم
من الضببببوول والتتببببوهاق ولكن يوجد نوف لخر من التحدياق التي تتعرض لها شبببببكاق الطري وهي تلك التحدياق
ق المتعلقة بمواجهة كمياق مياه اامطار الموجودة على الطريق وما تحمله من مخالر على السبببانقين ومن هنا هر
الحاجة إلى البحث مي موضوف اإلس لت المسامي. تعتبر الخلطاق اإلس لتية المسامية من أهم الحلوي المستخدمة مي
إدارة نظم مياه اامطار وذلك انها تختلف عن الخلطاق اإلسبببب لتية التقليدية مي نسبببببة ال راااق الهوانية العالية التي
52 ر منإلى أكثتصل نسبة ال راااق الهوانية مي ااس لت المسامي قدتتمتع بها مقارنة مع الخلطاق ااخرى حيث
. أهداف الدراسببة تتببمل دراسببة الخصببانف المختل ة لمسبب لت المسببامي وكذلك محاولة إيااد حلوي بديلة لمتببكلة %
من خالي التحقق من مدى إمكانية استخدام هذا النوف من الخلطاق اإلس لتية. ملسطينالمياه مي
مي تصببببنيع عيناق اإلسبببب لت اسببببتخدمتامج العملي لهذه الدراسببببة على دراسببببة خواص الحصببببوياق التي بدأ البرن
المسامي مثل الكثامة وامتصاص الماء وايرها, ثم دراسة خواص البيتومين المستخدم )الكثامة, الممطولية, االختراي
درجاق حصوية مختل ة وذلك من أجل عينة من ااس لت المسامي باستخدام ثالث ت 25وايرها( بعد ذلك تم تصنيع
حديد بعد ت حسببببباة نسببببببة ال راااق الهوانية مي كل خليل الختيار التدرج الذي يعطي أعلى نسببببببة مراااق هوانية.
نسبببب مختل ة من 6عينة من ااسببب لت المسبببامي باسبببتخدام 03التدرج اامثل للخليل ااسببب لتي المسبببامي تم تصبببنيع
Draindown ناق لكل نسببببببة بيتومين( حيث تم تعري هذه العيناق الختباراقعي 2( )% 6 – 3.5البيتومين )
and Cantabro Abrasion Tests من البيتومين التي من الممكن أن تعطي نسببب 3وذلك من أجل تحديد أمضببل
ارشاي استخدمت لريقة م عيناق أس لتية جديدة حيث 9تم تصنيع بعد ذلك .الخلطة ااس لتيةمي أمضل نتانج ممكنة
و %4 و %3.5من الخطوة السبببببببابقببة ) نسبببببببب 0 من بين أمضبببببببل (OBC) لتحببديببد محتوى البيتومين اامثببل
أخيرا وزن الخليل ااس لتي. من %3.5نتانج محف عيناق مارشاي بينت أن محتوى البيتومين اامثل هو .(4.5%
أمضببل معامل ن اذية يمكن الحصببوي عليه تم اجراء اختبار الن اذية على عينتين من ااسبب لت المسببامي حيث وجد أن
.تقريبا m/day 22 هو
باسببتخدام تدرجاق حصببوية مختل ة على ااسبب لت المسببامي مزيد من الدراسبباق بضببرورة إجراءأوصببت الدراسببة
ونسب مختل ة من البيتومين وأوصت كذلك بالعمل على نتر مواص ة ملسطينية خاصة بالخلطاق االس لتية المسامية
العالية. واصه المتعلقة بالن اذيةلالست ادة من خ ملسطينرورة البدء باستخدام هذا النوف من ااس لت مي وأخيرا بض

VI
Table of Contents
Declaration ......................................................................................................................... I
هداءاإل …………………………………………………………………………………….II
Acknowledgements ......................................................................................................... III
Abstract ........................................................................................................................... IV
V ...................................................................................................................... ملخف الدراسة
Table of Contents ............................................................................................................ VI
List of Tables ............................................................................................................... VIII
List of Figures ................................................................................................................. IX
List of Appendices ........................................................................................................... X
Abbreviations .................................................................................................................. XI
Chapter One Introduction ............................................................................................. 1
1.1 Background: ............................................................................................................. 2
1.2 Statement of the Problem: ........................................................................................ 3
1.3 Objectives: ............................................................................................................... 4
1.4 Methodology: ........................................................................................................... 4
1.5 Thesis Structure ....................................................................................................... 5
Chapter Two Literature Review ................................................................................... 6
2.1 Introduction .............................................................................................................. 7
2.1.1 Asphalt Layers .......................................................................................................... 7
2.1.2 Asphalt Course ......................................................................................................... 7
2.2 Description: .............................................................................................................. 8
2.2.1 Cross-Section of Porous Asphalt Pavement System ................................................ 8
2.3 Concept of Porous Asphalt Pavement Technology ................................................. 9
2.4 Previous Studies of Porous Asphalt in Palestine ................................................... 10
2.5 Historical Review for Previous Studies in Porous Asphalt Systems ..................... 11
2.6 Porous Asphalt Materials ....................................................................................... 12
2.6.1 Aggregates .............................................................................................................. 12
2.6.2 Asphalt Binder (Bitumen) ...................................................................................... 13
2.7 Desirable Properties of Asphalt Mix ..................................................................... 13
2.8 Applications of Porous Asphalt ............................................................................. 14
2.8.1 First Application: ....................................................................................................... 14
2.8.2 Second Application: ................................................................................................... 15
2.9 Benefits of Porous Asphalt .................................................................................... 15
2.9.1 Reduction in Splash and Spray, Reduced Aquaplaning ......................................... 15
2.9.2 Reduction in Light Reflection and Headlight Glare ............................................... 16
2.9.3 Noise Reduction ..................................................................................................... 16
2.9.4 Improvement in Skid Resistance ............................................................................ 16
5.9.2 Rut-Resistance ........................................................................................................ 16
2.10 Disadvantages of Porous Asphalt .......................................................................... 17
2.10.1 Aging ...................................................................................................................... 17
2.10.2 Stripping ................................................................................................................. 17
2.10.3 Raveling .................................................................................................................. 18
2.10.4 Reduction in Porosity ............................................................................................. 18
2.10.5 Winter Maintenance ............................................................................................... 19
2.10.6 Draindown .............................................................................................................. 19
2.10.7 Shorter Service Life ................................................................................................ 19
2.11 Porous Asphalt Construction Process .................................................................... 20
2.12 Maintenance of Porous Asphalt Pavements ........................................................... 21

VII
Chapter Three Materials and Testing Program ........................................................ 22
3.1 Introduction ............................................................................................................ 23
3.2 Laboratory Test Procedure ..................................................................................... 23
3.3 Materials Collection ............................................................................................... 23
3.4 Experimental Study Stages .................................................................................... 25
3.4.1 Stage One: Determination of Aggregate Properties ............................................... 25
3.4.2 Bitumen Properties ................................................................................................. 31
3.5 Distribution of Porous Asphalt Samples over Practical Program Activites .......... 34
3.6 Testing Program ..................................................................................................... 35
3.6.1 Blending of Aggregates .......................................................................................... 35
3.6.2 Selection of Trial Gradations .................................................................................. 35
3.6.3 Determination of the Most Suitable and Desired Gradation .................................. 35
3.6.4 Determination of Optimum Asphalt Binder Content .............................................. 36
3.6.5 Determination of Stability and Flow of Porous Asphalt Samples .......................... 36
3.6.6 Evaluation of Porous Asphalt Permeability ............................................................ 37
Chapter Four Results and Data Analysis ................................................................... 39
4.1 Introduction ............................................................................................................ 40
4.2 Blending of Aggregates ......................................................................................... 40
4.3 Determination of Air Voids Content to Choose the Most Suitable Gradation ...... 41
4.4 Determination of Optimum Asphalt Binder Content ............................................. 44
4.4.1 Determination of Air Voids .................................................................................... 44
4.4.2 Draindown Test ...................................................................................................... 45
4.4.3 The Cantabro Abrasion Test ................................................................................... 46
4.5 Marshall Test (stability and flow) .......................................................................... 49
4.5.1 Stability – Bitumen Content Relationship .............................................................. 50
4.5.2 Flow – Bitumen Content Relationship ................................................................... 50
4.6 Determination of Permeability of Porous Asphalt Mix ......................................... 51
4.7 Differences between Porous Asphalt Results According to ASTM and German
Specfications ....................................................................................................... 52
Chapter Five Conclusion and Recommendations ...................................................... 53
5.1 Conclusion ............................................................................................................. 54
5.2 Recommendations .................................................................................................. 54
References ...................................................................................................................... 56
Appendices ..................................................................................................................... 60

VIII
List of Tables
Table (2.1): Aggregate gradations in porous asphalt ..................................................... 10
Table (2.2): Previous studies in porous asphalt systems ................................................ 22
Table (2.3): Different recommended design gradations for porous asphalt surface ...... 25
Table (2.4): Summary of properties asphalt- aggregates mixes ................................... 20
Table (3.1): Main sources of used materials .................................................................. 25
Table (3.2): Different sizes of aggregates ...................................................................... 25
Table (3.3): Aggregates sieve analysis results ............................................................... 56
Table (3.4): Specific gravity test of aggregates ............................................................. 30
Table (3.5): Specific gravity test of fine aggregate and filler ........................................ 03
Table (3.6): Water absorption test of aggregates ........................................................... 03
Table (3.7): Abrasion loss test of aggregates ................................................................. 31
Table (3.8): Bitumen density test results ....................................................................... 02
Table (3.9): Bitumen penetration test results ................................................................. 02
Table (3.10): Bitumen flash point test results ................................................................ 05
Table (3.11): Bitumen ductility test results .................................................................... 50
Table (3.12): Bitumen solubility test results .................................................................. 05
Table (3.13): Bitumen softening point test results ......................................................... 00
Table (3.14): Summary of bitumen properties ............................................................... 03
Table (3.15): Distribution of PA samples over practical program activites …………34
Table (4.1): Three options for proportion of each aggregate material ........................... 40
Table (4.2): Sieve analysis for three options of mix gradations of aggregates .............. 40
Table (4.3): Total air voids calculations for option 1 of porous asphalt ........................ 42
Table (4.4): Total air voids calculations for option 2 of porous asphalt ........................ 42
Table (4.5): Total air voids calculations for option 3 of porous asphalt ........................ 43
Table (4.6): Most suitable and desired gradation for porous asphalt ............................. 43
Table (4.7): Total air voids values (Va%) for 6 different bitumen contents in PA ....... 44
Table (4.8): Draindown values for 6 different bitumen contents in PA ........................ 45
Table (4.9): Cantabro abrasion loss values for 6 different bitumen contents in PA ...... 46
Table (4.10): Summary of air voids (Va%), Draindown (%) and Cantabro abrasion loss
(%) results for 6 different bitumen contents in PA ...................................... 47
Table (4.11): Most suitable bitumen contents in PA in terms of (Va%) and Draindown
values ........................................................................................................... 49
Table (4.12): Infiltrated water quantities from the asphalt samples during 60 seconds 51
Table (4.13): Permeability Coefficient (K) for Porous Asphalt with 2 different bitumen
contents ........................................................................................................ 52
Table (4.14): Aggregate gradations for porous asphalt according to ASTM and German
Specifications ………………………………………………………………………….52
Table (4.15): Properties of porous asphalt according to ASTM and German
Specifications………………………………………………………………………….52

IX
List of Figures
Figure (1.1): Rain on porous asphalt (left) and traditional asphalt (right) ....................... 2
Figure (2.1): Typical cross-section of porous asphalt pavement system ......................... 8
Figure (2.2): Water drainage through (a) porous asphalt pavement; (b) asphalt
pavement with an OGFC overlay; (c) conventional asphalt pavement ....... 9
Figure (2.3): Reduction in splash, spray and aquaplaning of PA compared with
conventional asphalts ................................................................................. 22
Figure (2.4): Porous asphalt construction stages ........................................................... 23
Figure (3.1): Flow chart of laboratory testing procedure .............................................. 24
Figure (3.2): Used aggregates types .............................................................................. 25
Figure (3.3): Gradation curve (Folia 0/ 19) ................................................................... 27
Figure (3.4): Gradation curve (Adasia 0/ 12.5) ............................................................. 52
Figure (3.5): Gradation curve (Simsimia 0/9.50) .......................................................... 28
Figure (3.6): Gradation curve (Trabia 0/4.75) ............................................................... 28
Figure (3.7): Gradation curve (Filler) ............................................................................ 29
Figure (3.8): Gradation curve for all aggregate types .................................................... 29
Figure (3.9): Ductility device for a bitumen sample ..................................................... 05
Figure (3.10): Softening point test for bitumen samples ............................................... 00
Figure (3.11): Some of porous asphalt samples are prepared for Marshal Test ............ 37
Figure (3.12): Permeabilty device for porous asphalt samples ...................................... 38
Figure (4.1): Gradation of final aggregates mix for 3 options of aggregate gradations
with ASTM specification range ................................................................. 41
Figure (4.2): Total air voids (va%) vs. bitumen content relationship ............................ 47
Figure (4.3): Draindown (%) vs. bitumen content relationship ..................................... 48
Figure (4.4): Cantabro abrasion loss (%) vs. bitumen content relationship .................. 48
Figure (4.5): Stability vs. bitumen content relationship ............................................... 50
Figure (4.6): Flow vs. bitumen content relationship ...................................................... 51

X
List of Appendices
Appendix A .................................................................................................................... 61
Appendix B .................................................................................................................... 66
Appendix C .................................................................................................................... 69
Appendix D .................................................................................................................. 722
Appendix E .................................................................................................................... 75

XI
Abbreviations
AASHTO American Association of State Highway and Transportation Officials
ASTM American Society of Testing and Materials
COD Chemical Oxygen Demand
Gmb Bulk Dry Specific Gravity
Gmm Maximum Theoretical Specific Gravity
IUG Islamic University of Gaza
NAPA National Asphalt Pavement Association
OBC Optimum Bitumen Content
OD Oven Dry condition
OGFC Open-Graded Friction Courses
PA Porous Asphalt
PFC Porous Friction Courses
SSD Saturated Surface Dry condition
Va% Total Air Voids

1
1 Chapter One
Introduction

2
1.1 Background:
Population growth and urban expansion have persistently raised the demand for water
supplies, thereby greatly increased the exploitation of groundwater which is the main
water resource in the Palestine. As Palestine lacks effective procedures that help in
recharging the groundwater storage where there are high amounts of runoff due to the
impervious surfaces of asphalts which can have negative impacts including sediment
transport, erosion, and pollutant transport, this encourages to search for reliable solutions
that can overcome the previous harmful effects.
This research tries to help in solving this problem by studying the possibility of using
Porous Asphalt in Palestine. Porous Asphalt (PA) also namely open-graded asphalt has
been used as a wearing surface since the 1950s. Its first major use in Australia was about
1973 and in Japan was about 1987. Porous asphalt is a developing in road surfacing
technology where it is designed so that after laying and compacting, they form a surface
with a void’s more than 20 percent. They are used in wearing courses and always laid on
impervious base course which could be effective in enhancing traffic safety. Porous
asphalt can be also used to reduce noise and glare (Sasana and Ismanto, 2003).
The technique of this type of asphalt is designed to allow water passing through the
surface into an underlying layers and eventually into the underlying soil so the quantity
of storm water runoff is significantly reduced, and the infiltrate is also filtered by the
porous pavement structure in the process. These permeable pavements are appropriate for
low intensity use, such as overflow parking areas, parking lots, residential roads, and
pedestrian walkways, so they have gained high popularity over the last two decades as
alternatives to conventional road construction materials due to their ability to reduce
urban runoff (McNally et al., 2005).
Figure (1.1): Rain on porous asphalt (left) and traditional asphalt (right) (Palatová, M.,
2012)

3
Porous asphalt roadways show high levels of performance especially in areas where the
level of precipitation is high due to its high voids ratio so they can improve the ride quality
for drivers during wet weather by improving night visibility through eliminating the light
reflecting from water on the surface and reducing skidding, hydroplaning, and spraying.
Open-graded structures of Porous asphalt mixtures also have good sound absorption and
thus can reduce tire noise on the roadway surface (Hsu et al., 2010).
1.2 Statement of the Problem:
Palestine is suffering from a large water problem where the groundwater from the coastal
aquifer represents the main water resource where in Gaza Strip a safe yield was only 98
Mm3 per year while the overall water demand was estimated at 160 Mm3 per year in
2010 (Hamdan et al., 2007), (CMWU, 2010).
Groundwater recharge is one of the effective solutions to face the increased demand of
water in Palestine, but this requires a suitable infrastucure system that can overcome all
current and any other potential obstacles which may negatively affect the effective
drainage of runoff quantities on the road ways.
The previous mentioned situation causes many problems such as:
1. The stop of transportation movement in the streets because of the exceeded
runoff quantities.
2. Loss of high water quantities due to the exceeded runoff amounts without
recharging it in the groundwater.
3. The harmful economic effects in all life sectors where the resulted financial
losses during ALEXA Trough in 2013 in the livestock sector only reached about
1.735 million USD (P.M.A, December 2013).
Form here, the need of an urgent and alternative solution was raised to reduce the runoff
quantities and support the bad storm water system with another one that could infiltrate
water through the soil to the ground water.
Another important and attractive thing to choose this topic is that there are too little
previous studies and researches that was done in Palestine and concern in the applicability
of porous asphalt. In March, 2018 five researchers from the Islamic University of Gaza
(IUG) have been published a scientific paper in this topic titled as: “Porous Asphalt: A
New Pavement Technology in Palestine”. This study tried to discuss the porous asphalt

4
topic from a different view than what was performed through the previous study at IUG
in March, 2018
1.3 Objectives:
The main aim of this research is to study the purpose, properties, advantages,
disadvantages, of the porous asphalt and finally evaluate the possibility of using it in Gaza
strip to avoid disadvantages and problems in the existed asphalt mixes due to some special
cases like runoff, skidding, hydroplaning and spraying.
To be more specific, this research represents a trial to:
1. Study the different characteristics and properties of porous asphalt.
2. Improve the quantity of groundwater recharge in Gaza strip by reducing runoff
especially during winter seasons through using porous asphalt.
3. Obtain the optimum design of Porous Asphalt in Palestine.
1.4 Methodology:
To achieve the objectives of this research, the following tasks were executed:
1. Conducting a literature review about porous asphalt;
2. Preparing raw materials for laboratory testing and executing the testing
program;
3. Preparing mix design using different aggregate gradation and different bitumen
percentages by the total weight of asphalt mix;
4. Testing of the samples against air voids ratio, stability, flow, stiffness,
draindown value and Cantabro abrasion loss;
5. Preparing the optimum mix design using recommended aggregate gradation and
optimum percentage of bitumen;
6. Analysis of results, and recommendations.

5
1.5 Thesis Structure
The thesis includes five chapters and six appendices. A brief description of the chapters’
contents is presented below,
Chapter 1: Introduction
This chapter is a brief introduction, which highlights the concept of research. In addition,
statement of problem, aim, objectives and methodology of research are described.
Chapter 2: Literature review
Brief introduction related to history of porous asphalt, properties and its advantages and
disadvantages is included in this chapter. Moreover, previous researches relevant to
porous asphalt mixes are reviewed.
Chapter (3) Materials and study program
This chapter handles two areas:
1. The preliminary evaluation of used materials properties such as aggregates and
bitumen.
2. The description of experimental work which has been done to achieve the study
objectives.
Chapter (4) Results and data analysis
The achieved results of laboratory work are illustrated in this chapter through three stages.
First stage handles the results of blending aggregates to obtain asphalt wearing course
gradation curve and total air voids ratio. In the second stage, Marshal Test results are
analyzed in order to obtain the optimum bitumen content (OBC). The final stage discusses
the permeability of porous asphalt mix.
Chapter (5) Conclusion and recommendations
Conclusion derived from experimental results are presented. Moreover, the
recommendations for the present study are also provided in this chapter.

6
2 Chapter Two
Literature Review

7
2.1 Introduction
Nowadays the world faces high decrease in the natural pervious surfaces as a normal
result of the increase in development and urbanization where these surfaces are replaced
by roofs, pavements and others. These new impervious surfaces are highly increasing the
amounts of storm water runoff, which can have many negative effects including pollutant
transport, sediment transport and erosion (Putman et al., 2012).
Accordingly, this leads to the high necessity of finding new creative solutions to face this
problem, and one of these solutions was to use porous asphalt.
In 1970s Federal Highway Administration was the first party that created the first official
procedure to produce open-graded friction courses (OGFC) mixtures although these
porous mixtures have been used for more than 60 years. Since 1900s, porous asphalt
started to gain high popularity as an alternative to conventional asphalts and as a storm
water best management practice because of their high ability to reduce runoff on the
highways. However, some concerns are still remaining in dealing with porous asphalt
mixtures, especially their potential harmful impacts on the groundwater, so that they must
be designed and constructed properly (McNally et al., 2005).
2.1.1 Asphalt Layers
Three types of asphalt layers are usually used in road construction projects, these layers
are generally known as:
a) Asphalt wearing course.
b) Asphalt binder course.
c) Asphalt road base.
The first two layers are considered to be very essential layers to be constructed because
they are creating a self-resistance mechanism towards the horizontal and vertical forces
and the resultant shear forces especially in the high temperature during the summer season
(Jendia, 2000).
2.1.2 Asphalt Course
Asphalt course is the surface course of asphalt pavement structure consists of a mixture
of mineral aggregates and bituminous materials placed as the upper course and usually
constructed on a base course. The binder course lies between the wearing course and the
road base. So, it reduces the stresses which affect the road base and the soil base. The
selection of the aggregate mixture depends on the thickness of the layer (Jendia, 2000).

8
2.2 Description:
Porous asphalt materials are an open-graded mixes that are composed of relatively
uniform graded aggregate and bitumen or modified binders, and are mainly used as
drainage layers, either at the pavement surface or within the pavement structure (FAA
2001). When these Open-graded mixes used as surface drainage layers, they called Porous
Friction Courses (PFC).
A layer of porous asphalt with thickness varies in the range of 20-100 mm and an air
voids content that is generally between 18 – 22 % is normally placed as an overlay on top
of an existing conventional concrete or asphalt surface. This overlay typically is referred
to as Porous Asphalt (PA), Permeable Friction Courses (PFC), or Open Graded Friction
Courses (OGFC) (Barrett et al., 2006).
2.2.1 Cross-Section of Porous Asphalt Pavement System
Figure (2.1) represents typical cross-section of porous asphalt pavement system.
Figure (2.1): Typical cross-section of porous asphalt pavement system
(P. Kandhal, et al., 2014)

9
Any cross section in porous asphalt pavement is generally consists of (from top to
bottom):
Open-graded, porous asphalt course 25-50 mm thick;
12.5 mm nominal size aggregate choking layer 25-50 mm thick (this is placed
over the stone bed so as to stabilize it and facilitate asphalt paving over it);
Clean, uniformly graded 40-75 mm size crushed aggregate compacted layer to act
as a water reservoir (typically it is 225 mm thick and contains more than 40%
voids to accommodate rainwater);
Non-woven geotextile to separate the soil subgrade and water reservoir course so
that soil particles do not migrate from the subgrade into the stone water reservoir
course thus choking it. Alternately, a 75 mm thick stone filter course consisting
of 10-25 mm size aggregate can be provided if good aggregate gradation control
can be maintained;
Un-compacted natural soil subgrade (bed).
2.3 Concept of Porous Asphalt Pavement Technology
One of the main properties of porous asphalt is represented in its high air voids content
which should be minimum 18 %. This high air voids ratio with relative to the others
conventional asphalts makes it as a storm water best management practice where the
water goes through it rapidly without any ponding at the surface much faster than
traditional dense-graded pavement.
Figure (2.2) represents comparison between 3 different types of asphalts in terms of water
drainage (Putman et al., 2012).
Figure (2.2): Water drainage through (a) porous asphalt pavement; (b) asphalt
pavement with an OGFC overlay; (c) conventional asphalt pavement
(Putman et al., 2012)

01
a) Porous asphalt: is designed to allow water to infiltrate the surface without any
ponding and then stored in an underlying open-graded stone bed also. From there,
water percolates slowly into the underlying natural soil (subgrade).
b) Asphalt pavement with an OGFC overlay: the water infiltrate the voids in the
overlay layer and then move laterally to the edge of the pavement.
c) Conventional asphalt pavement: the pavement’s surface here is impervious so
that the water will not infiltrate through the overlay layer and its only way is to
move through the small cross slope of the road to the edges.
2.4 Previous Studies of Porous Asphalt in Palestine
Porous asphalt research was studied before in Palestine through a published scientific
paper in this topic titled as: “Porous Asphalt: A New Pavement Technology in Palestine”.
In this paper, the researchers stated the following conclusion (Jendia et al., 2018):
1. The gradation of the selected aggregate that will be used in porous asphalt production
should lie within the limits suggested in Table (2.1):
Table (2.1): Aggregate gradations in porous asphalt (Jendia et al., 2018)
Sieve Size (mm) Percent Passing (%)
Min Max
22.4 100 100
16 93 100
12.5 85 100
11.2 70 100
9.5 5 100
4.75 5 35
2 5 15
0.075 2 5
2. The effective bitumen content obtained using Marshall method should be
approximately 4%. Bitumen content much less than 4% increases the possibility of
causing surface raveling.
3. The maximum air void ratio can be reached using local material approximately 21%.
4. Marshall Stability and bulk density of porous asphalt specimens are lower than those
for the dense asphalt concrete.

00
2.5 Historical Review for Previous Studies in Porous Asphalt Systems
Table (2.2) presents a skim review for some previous studies that was concerned in Porous
Asphalt Systems.
Table (2.2): Previous studies in porous asphalt systems (McNally et al., 2005)
Authors Year The Investigation Results and Recommendations
Legret et al. 1996
Compare the quality of
runoff water collected at the
outfall of a porous asphalt
street built in 1988 versus a
catchment drained by a
separate sewer system (Rezé,
France)
The runoff water was filtered by
the pavement and reservoir
structure and some of the
pollutants were retained in the
porous materials.
The porous pavement had
significantly lower pollutants in
the infiltrated runoff water that
compared with the catchment
drained by the sewer system.
Legret and
Colandini 1999
A continuation of the Legret
et al. 1996 study in Rezé,
France.
Metallic pollutants accumulated
on the porous asphalt surfacing,
but did not migrate within the
reservoir structure.
Hogland and
Niemczynowicz 1986
Porous pavement’s ability to
retain heavy metals,
suspended solids, and lower
chemical oxygen demand
(COD)
The porous pavement system
achieved the following pollutants
reductions:
95% load reduction of
suspended solids,
71% reduction of total
phosphorus,
62% reduction of zinc,
42% reduction of copper,
50% reduction of lead and
33% reduction of cadmium
Ranchet et al. 1993
Compared pollution
concentrations in a 16-cm
(~6.3 in) thick porous
concrete pavement to
conventional pavement
Porous concrete pavement had
achieved load reductions of
suspended solids, lead, and COD
by 70%, 78%, and 54%,
respectively.
Stotz et al. 1994 Porous asphalt
Porous asphalt was able to retain
approximately 50% of the
suspended solids delivered
through runoff.

02
2.6 Porous Asphalt Materials
2.6.1 Aggregates
Aggregates (or mineral aggregates) are hard, inert materials such as sand, gravel, crushed
rock, slag, or rock dust. Properly selected and graded aggregates are mixed with the
asphalt binder to form PA pavements. Aggregates are the principal load supporting
components of PA pavement (Matar, 2017).
In PA mixes, aggregates can be divided into three types according to their size as stated
below (Transportation research board committee, 2011):
a) Fine aggregates are those that pass through the 2.36-mm sieve and are retained on
the 0.075-mm sieve.
b) Coarse aggregates are generally defined as those retained on the 2.36-mm sieve.
c) Mineral filler is defined as that portion of the aggregate passing the 0.075mm
sieve. Mineral filler is a very fine material with the consistency of flour and is also
referred to as mineral dust or rock dust.
In general, a high percentage of coarse aggregate and few fine aggregates should be used
in the porous asphalt mix in order to provide a high air void percentage (Schaus L., 2007).
Table (2.3) below provides examples of design gradations for porous asphalt surface
courses.
Table (2.3): Different recommended design gradations for porous asphalt surface
(Schaus L., 2007)
Sieve Size
(mm) Sieve #
Percent Passing (%)
The Franklin
Institute
(Thelen, 1978)
National Asphalt
Pavement
Association
(NAPA, 2003)
Cahill Associates
(Cahill 2003)
37.5 3/2" 100 - -
19 3/4" - 100 -
12.5 1/2" - 85-100 100
9.5 3/8" 95 55-75 95
4.75 #4 35 10-25 35
2.36 #8 15 5-10 15
1.18 #16 10 - 10
0.6 #30 - - 2
0.075 #200 2 2-4 -

03
2.6.2 Asphalt Binder (Bitumen)
Asphalt binders have been used in road construction for centuries since it is thick, heavy
residue remaining after refining crude oil which holds aggregates together in asphalt
mixes. Although there are natural deposits of asphalt, most asphalts used today is
produced through refining crude oil. Asphalt is a strong cement that is very adhesive and
highly waterproof. It is also highly resistant to most acids, alkalis, and salts (Ashour,
2015).
The physical properties of asphalt binder vary significantly with temperature. At freezing
temperatures, asphalt binder can become very brittle, but it will be fluid with low
consistency similar to that of oil at high temperatures. At room temperature, most asphalt
binders will have the consistency of soft rubber. Many asphalt binders contain small
percentages of polymer to improve their physical properties; these materials are called
polymer modified binders. Most of asphalt binder specification was designed to control
changes in consistency with temperature (A manual for design of hot mix asphalt with
commentary, 2011).
2.7 Desirable Properties of Asphalt Mix
All mix design procedures tends always to achieve a set of properties in the final asphalt
product. These properties depend on a set of variables which include aggregate
characteristics such as gradation, texture, shape and chemical composition, asphalt binder
content, asphalt binder characteristics and degree of compaction (Lee et al., 2006). Some
of the desirable properties are presented in Table (2.4).
Table (2.4): Summary of properties asphalt- aggregates mixes (Lee et al., 2006)
Property Definition Examples of mix variables which
have influence
Permeability
Ability of air, water, and
water vapor to move into and
through mix
- Aggregate gradation
- Asphalt content
- Degree of compaction
Workability
Ability of mix to be placed
and compacted to specified
density
- Asphalt content
- Asphalt stiffness at placement
- Aggregate surface texture
- Aggregate gradation

04
Property Definition Examples of mix variables which
have influence
Stiffness
Relationship between stress
and strain at a specific
temperature and time of
loading
- Aggregate gradation
- Asphalt stiffness
- Degree of compaction
- Water sensitivity
- Asphalt content
Stability
Resistance to permanent
deformation (usually at high
temperature and long times of
loading- conditions of low
S(mix).
- Aggregate surface texture
- Asphalt gradation
- Asphalt stiffness
- Asphalt content
- Degree of compaction
- Water sensitivity
Durability
Resistance to weathering
effects (both air and water) and
to the abrasive action of traffic.
- Asphalt content
- Aggregate gradation
- Degree of compaction
- Water sensitivity
Fracture
Characteristics
Strength of mix under single
tensile stress application.
- Aggregate gradation
- Aggregate type
- Asphalt Content
- Degree of compaction
- Water sensitivity
- Asphalt stiffness
Skid Resistance
(surface friction
characteristics)
Ability of mix to provide
adequate coefficient of
friction between tire and
pavement under "wet"
conditions
- Aggregate texture and
resistance to polishing
- Aggregate gradation
- Asphalt content
Fatigue
Resistance
Ability of mix to bend
repeatedly without fracture
- Aggregate gradation
- Asphalt Content
- Degree of compaction
- Asphalt stiffness
2.8 Applications of Porous Asphalt
Porous asphalt is used all over the world mainly for two pavement applications:
2.8.1 First Application: Porous asphalt is used as wearing courses on high-speed
roadways where a thin layer of porous asphalt ranging from 19 to 50 mm thick is placed
over a conventional impermeable pavement surface. This overlay allows water to drain
into the porous layer and then moves laterally within it which highly helps in improving
roadway safety. This porous overlay, referred to as an open graded friction course
(OGFC) or porous friction course (PFC) (Lyons et al., 2013).
Table (2.4): Summary of properties asphalt- aggregates mixes (Lee et al., 2006) … Continue

05
2.8.2 Second Application: Porous asphalt is also used for storm water management
purposes where in these applications, the quantity of storm water runoff is significantly
reduced due to infiltration through the porous asphalt layer. In this type of applications, a
thicker porous asphalt layer (50–100 mm thick) is placed over an open graded aggregate
base course that acts as a reservoir for storm water before it infiltrates into the underlying
soil (Lyons et al., 2013).
2.9 Benefits of Porous Asphalt
Most of the advantages of porous asphalt can be referred to its high air voids content
which increases the permeability and thus decreases the water on the roadway. These high
drainage rates of water from the pavement surface can lead to the following benefits:
2.9.1 Reduction in Splash and Spray, Reduced Aquaplaning
This can be realized as a result of the infiltrated water through the porous asphalt structure
due to its high voids ratio compared with conventional asphalt mixes. Also, it helps in
preventing the reduction in traffic flow volumes in the rainy weather by enhancing the
visibility on the streets surfaces.
Porous asphalt can also be a safer alternative than the conventional asphalts especially in
the rainy days where it contributes in decreasing the number of accidents by the
absorption of surface water which cause the aquaplaning that occurs when vehicles move
at high speeds on a thin water layer (Palatová, 2012)
Figure (2.3): Reduction in splash, spray and aquaplaning of PA compared with
conventional asphalts (Palatová, 2012)

06
2.9.2 Reduction in Light Reflection and Headlight Glare
When water infiltrates through the porous asphalt mix, light reflection and headlight glare
will be decreased and thus lane markings are enhanced clearly on wet surfaces.
This will result in more safety on the streets and thus protecting drivers from the danger
behind light reflection and headlight glare especially in night time (Palatová, 2012)
2.9.3 Noise Reduction
Road surfaces are laid with coarse macro-texture, which are in contact with the tire tread.
This structure can contribute to the noise absorption between the surface and the tire
where this phenomenon can lead to many advantages based on some researchers’
experiments. For example, Tesoriere and others had obtained that noise levels on porous
asphalt may be 6 dB(A) lower than concrete layers. Furthermore, according to the Swiss
standards, under dry conditions in a 70 dB(A) area a noise reduction of 5 dB(A) can be
achieved by using porous asphalt. (Ali et al., 2012)
2.9.4 Improvement in Skid Resistance
It is well known that there is a proportional relationship between the material’s roughness
and its frictional properties. Accordingly, using porous asphalt is highly help in increasing
the skid resistance under wet conditions due to its high ratio of coarse aggregate compared
with others conventional mixes.
However, it should be well noted that the fresh porous asphalt layers may have a reduced
skid resistance due to the bitumen film on the aggregates exposed to the surface. Where,
in Japan for example, it is reported that the initial skid resistance of porous asphalt is
increased gradually during the service life, whereas the dense mixes did not show any
significant change. (Palatová, 2012)
2.9.5 Rut-Resistance
Practical experiments shows that porous asphalt can withstand high rates of load under
traffic where on the 1987 Burton trial in the UK, the deformation rate of a porous asphalt
section in the near side lanes was less than 2 mm/year and 0.5 mm/year on average after
8 years trafficking which is as an accepTable rate in Britain. (Palatová, 2012)

07
Benefits of porous asphalt are not limited in the previous mentioned points but only
extends to include (Putman et al., 2012):
1. Recharging groundwater supply.
2. Filtering contaminants from runoff prior to its discharge to the storm sewer system
3. Reducing splashing and spraying in wet weather.
4. Can decrease flooding downstream harmful impacts
5. Applicable to all types of sites (residential/ commercial/industrial)
6. Reduces total amount of impervious cover
7. Requires less need for curbing and storm sewers
8. Provides better traction in icy conditions than traditional asphalt
2.10 Disadvantages of Porous Asphalt
With all of the advantages and positive properties of porous asphalt mixtures,
unfortunately, there are also some disadvantages which need high care in dealing with.
These are some of the problems in dealing with porous asphalt:
2.10.1 Aging
One of the main properties in porous asphalt mixes is its high porosity which creates a
suitable environment to the binder film in the mix to be exposed to oxygen, sunlight,
water etc. This continuously exposure results in bitumen hardening and thus aggregated
can be stripped easily from the asphalt mixes which leads finally to shorter service life of
porous asphalt than conventional dense mixes. (Hoban et al., 1985)
2.10.2 Stripping
Big amounts of water that penetrate porous asphalt due to its high permeability can make
the asphalt in wet condition for long periods where some of these water amounts are not
properly drained and remains in the asphalt’s structure. This continuous wet condition of
asphalt increases the rate of bitumen’s stripping from the aggregate surfaces (Ali et al.,
2012).

08
2.10.3 Raveling
Raveling is defined as a pavement distress resulting from the loss of individual aggregate
particles at the surface of the pavement due to a loss of adhesion between the binder and
the aggregate. In porous asphalt, and due to the high air voids content, oxygen, sunlight
and water have access to a higher surface area of mixture which increasing the possibility
of bitumen exposure to air compared to impervious asphalt mixes. This exposure to the
air can lead to premature oxidation of the binder, thus making it brittle and leading to
raveling (Lyons et al., 2013).
Factors that cause raveling in porous asphalt can be summarized by the following:
Aging
Stripping
Low binder content
Dust coated aggregates
Aggregate gradation
Compaction temperature and effort
Traffic frequency
Studded tires
2.10.4 Reduction in Porosity
One of the main problems in porous asphalt is the clogging of the pores because of the
automobiles’ pollutants, dust and dirt. This problem can be faced on minor roads and low
speed lanes more than high speed ones where the tires on speedy main roads can produce
a self-cleaning effect. (Heystraeten et al., 1990)
By time this clogging of pores can lead to loss of most of the porous asphalt advantages
such that high drainage rates with relative to the conventional asphalt mixes, reducing
splashing and spraying in wet weather, tires’ noise reduction and others.
This real threat to the porous asphalt advantages needs special care and proper
maintenance activities to be done periodically such as cleaning methods using vacuum
vehicles with hydraulic jet water.

09
2.10.5 Winter Maintenance
Lower thermal conductivity of the porous asphalt leads to make it colder than the dense
asphalt mixes and thus this can facilitate the early settlement of snow and remains longer
on the asphalt surface. These big amounts of snow and ice require at least twice the
quantity of de-icing (Palatová, 2012).
2.10.6 Draindown
Draindown occurs in porous asphalt as a result of lack of fine aggregate which is done to
reach higher permeability rates than dense asphalt mixes. Also the excess asphalt binder
(bitumen) which is used to increase durability can cause draindown. This draindown
appears as an excess asphalt binder that drains out of a porous asphalt mixture.
Moreover, the high temperatures in summer can be a main reason for draindown which
soften the binder and by gravity it gradually downwards in the asphalt layers until
reaching stability in a cooler portion of the pavement (approximately 12.5 mm below the
surface).
This draindown causes big problems in porous asphalt where the excess bitumen which
downwards in the asphalt structure can clog these layers and thus decreases the
permeability rates of the porous asphalt (Lyons et al., 2013).
To prevent the draindown porous asphalt, then stabilizing additives should be used such
as polymers which stiffen the asphalt binder and fibers which absorb the additional binder
content to reduce draindown (Shankar et. Al, 2014)
2.10.7 Shorter Service Life
Many factors are gathered to affect the service life of porous asphalt such as binder
content and type, aggregate gradation, traffic volume and climate, but generally the
service life of porous asphalt surfaces is shorter than the conventional mix layers due to
the aging and stripping problems. Previous experiences of the asphalt porous
implementation showed life expectancy of around 15 years. Accordingly, some
maintenance should be necessary within about 5 to 8 years where such maintenance costs
for porous asphalt are considered higher than those for the conventional asphalt.
However, the significant contribution of the porous asphalt for social benefits, such as
traffic safety and environmental issues, could not be ignored (Ali et al., 2012).

21
2.11 Porous Asphalt Construction Process
The construction process of porous asphalt pavements goes through the following stages
(Cahill et. al, 2003) and Figure (2.4) illustrates these stages:
1. The subsurface infiltration bed which is beneath the porous pavement must be
excavated without heavy equipment compacting the bed bottom. Fine grading is
done by hand;
2. Earthen berms (if used) between infiltration beds should be left in place during
excavation. These berms do not require compaction if they are stable during
construction;
3. Non-woven geotextile is laid immediately after fine grading is completed;
4. Clean (washed) uniform graded aggregate is placed in the bed as the storage
medium;
5. The asphalt is laid down just like conventional asphalt;
6. The finished surface looks like conventional asphalt until it rains. Infiltration beds
are completely under the parking lots, minimizing the disturbance envelope.
Figure (2.4): Porous asphalt construction stages (Palatová, 2012)

20
2.12 Maintenance of Porous Asphalt Pavements
Porous asphalt pavements require high level of care after construction where a periodical
maintenance procedures should be done to avoid problems and failure in the asphalt
epically clogging and winter maintenance problems. The following techniques can be
used in porous asphalt maintenance’s process (Palatová, 2012):
1. Vacuum twice per year;
2. Clean inlets twice per year;
3. Maintain adjacent planted areas;
4. No construction staging on unprotected pavement surface pavement surface;
5. Use salt, not sand in roads;
Another procedures can also be made (Kandhal, et al., 2014):
6. If the permeability of porous asphalt is reduced drastically for some unforeseen
reason, it can be reclaimed, recycled and re-laid;
7. When using porous asphalt in the parking lot, it should be reasonably protected;
from excessive wind-blown soil or sand; and construction remains to maintain its
permeability;
8. Placing a sign board at the porous asphalt parking lot so that its surface is not
sealed by any means in future.

22
3 Chapter Three
Materials and Testing
Program

23
3.1 Introduction
This thesis aims mainly to study the characteristics of Porous Asphalt and the availability
of producing it in Gaza Strip. To achieve this goal, a scientific, organized and
comprehensive experimental study was carried out and will be explained in details
through this chapter.
This chapter deals with two topics. First, is to evaluate the used materials properties such
as aggregates and bitumen. Second, is to describe how experimental work has been done
to achieve study objectives.
3.2 Laboratory Test Procedure
This study is based on laboratory testing as the main procedure to achieve study goals.
All tested materials (Aggregate and Bitumen) in addition to all produced Porous Asphalt
samples and performed tests were executed in Consulting Center for Quality and
Calibration (Soil and Materials Testing Laboratory) – Gaza.
Laboratory tests are divided into several stages, which begin with the properties
evaluation of the used materials: aggregates and bitumen. Sieve analysis was carried out
for each aggregate type to obtain the grading of aggregate sizes followed by aggregates
blending to obtain wearing course gradation curve used to prepare asphalt mix. After that,
Asphalt mixes with different bitumen contents were prepared and the total air voids ratio
was calculated to determine the most suitable and desired gradation of aggregate. After
that, the marshal test was conducted to obtain optimum bitumen content. The value of the
optimum bitumen is used to prepare new porous asphalt mixes to evaluate the
permeability of the mix. Finally, laboratory test results were obtained and analyzed.
Figure (3.1) shows the flow chart of laboratory testing procedure.
3.3 Materials Collection
The used materials in this study was collected mainly from two companies in Gaza strip.
Table (3.1) illustrates materials collection locations.

24
Data Collection
Determination of optimum
asphalt binder content
Selection of the most suitable
and desired gradation
Determination of total air
voids (Va %)
Aggregate
Blending
Materials Evaluation
Materials Selection
Determination of stability and
flow of porous asphalt samples
Determination of porous
asphalt permeability
Aggregate
Bitumen
Analysis and Results
Figure (3.1): Flow chart of laboratory testing procedure

25
Table (3.1): Main sources of used materials
Material Company Name Location
Aggregate Al-Qaoud Factory for Asphalt Gaza city (Eastern Line)
Bitumen Moqat Company Gaza city (Al-Nafaq Street)
3.4 Experimental Study Stages
3.4.1 Stage One: Determination of Aggregate Properties
3.4.1.1 Aggregate Types
Two main types of aggregates were used in this experimental study which are coarse and
fine aggregates. Table (3.2) and Figure (3.2) highlight the five different sizes of
aggregates that were tested.
Table (3.2): Different sizes of aggregates
Aggregate Categories Aggregate Type Particle size
(mm)
Coarse Aggregate
Folia 0/19.0
Adasia 0/12.5
Simsimia 0/9.50
Fine Aggregate Trabiya 0/4.75
Filler -
Figure (3.2): Used aggregates types
26
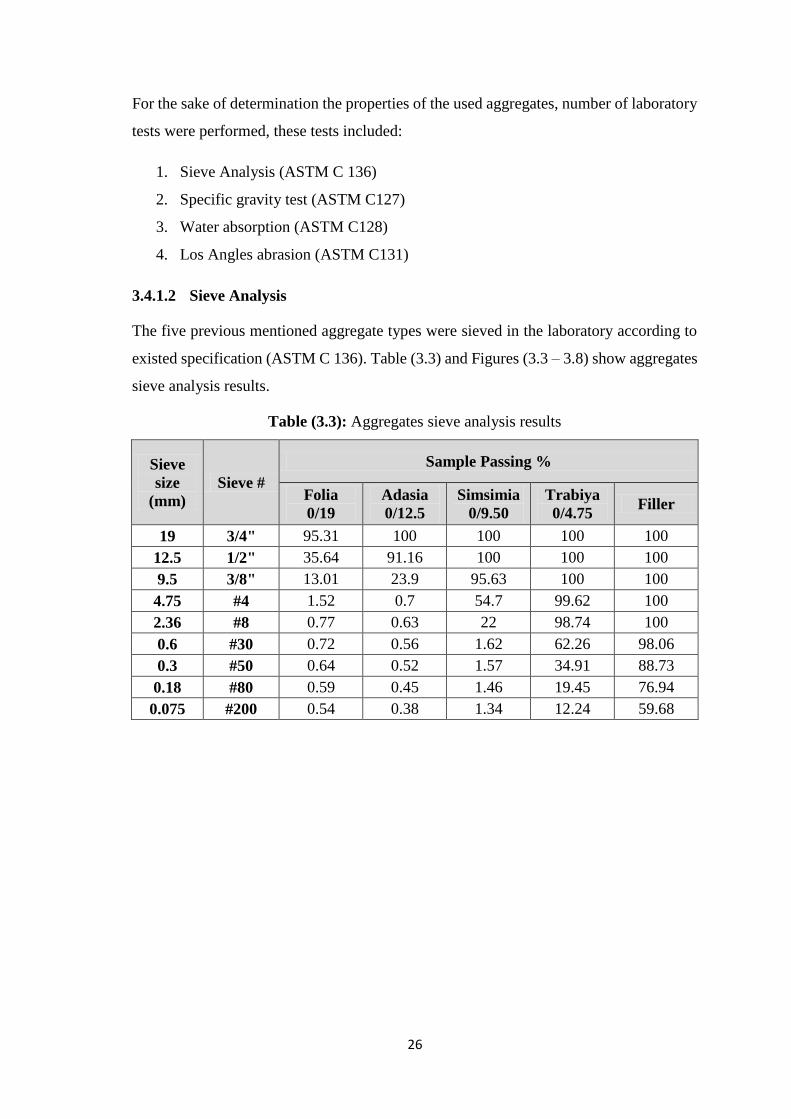
For the sake of determination the properties of the used aggregates, number of laboratory
tests were performed, these tests included:
1. Sieve Analysis (ASTM C 136)
2. Specific gravity test (ASTM C127)
3. Water absorption (ASTM C128)
4. Los Angles abrasion (ASTM C131)
3.4.1.2 Sieve Analysis
The five previous mentioned aggregate types were sieved in the laboratory according to
existed specification (ASTM C 136). Table (3.3) and Figures (3.3 – 3.8) show aggregates
sieve analysis results.
Table (3.3): Aggregates sieve analysis results
Sieve
size
(mm)
Sieve #
Sample Passing %
Folia
0/19
Adasia
0/12.5
Simsimia
0/9.50
Trabiya
0/4.75 Filler
19 3/4" 95.31 100 100 100 100
12.5 1/2" 35.64 91.16 100 100 100
9.5 3/8" 13.01 23.9 95.63 100 100
4.75 #4 1.52 0.7 54.7 99.62 100
2.36 #8 0.77 0.63 22 98.74 100
0.6 #30 0.72 0.56 1.62 62.26 98.06
0.3 #50 0.64 0.52 1.57 34.91 88.73
0.18 #80 0.59 0.45 1.46 19.45 76.94
0.075 #200 0.54 0.38 1.34 12.24 59.68

27
Figure (3.3): Gradation curve (Folia 0/ 19)
Figure (3.4): Gradation curve (Adasia 0/ 12.5)
0
10
20
30
40
50
60
70
80
90
100
0.01 0.1 1 10 100
% p
assi
ng
Sieve Size (mm) in Log scale
Gradation of Aggregates I (Folia 0/19)
0
10
20
30
40
50
60
70
80
90
100
0.01 0.1 1 10 100
% p
assi
ng
Sieve Size (mm) in Log scale
Gradation of Aggregates II (Adasia0/12.5)

28
Figure (3.5): Gradation curve (Simsimia 0/9.50)
Figure (3.6): Gradation curve (Trabia 0/4.75)
0
10
20
30
40
50
60
70
80
90
100
0.01 0.1 1 10 100
% p
assi
ng
Sieve Size (mm) in Log scale
Gradation of Aggregates III (Simsimia 0/9.50)
0
10
20
30
40
50
60
70
80
90
100
110
0.01 0.1 1 10 100
% p
assi
ng
Sieve Size (mm) in Log scale
Gradation of Aggregates IV (Trabia 0/4.75)

29
Figure (3.7): Gradation curve (Filler)
Figure (3.8): Gradation curve for all aggregate types
0
10
20
30
40
50
60
70
80
90
100
0.01 0.1 1 10 100
% p
assi
ng
Sieve Size (mm) in Log scale
Gradation of Aggregates V (Filler)
0
10
20
30
40
50
60
70
80
90
100
0.01 0.1 1 10 100
% p
assi
ng
Sieve Size (mm) in Log scale
Gradation of Aggregates
Folia0/19
Adasia0/12.5
Simsimia0/9.50
Trabia0/4.75
Filler
31
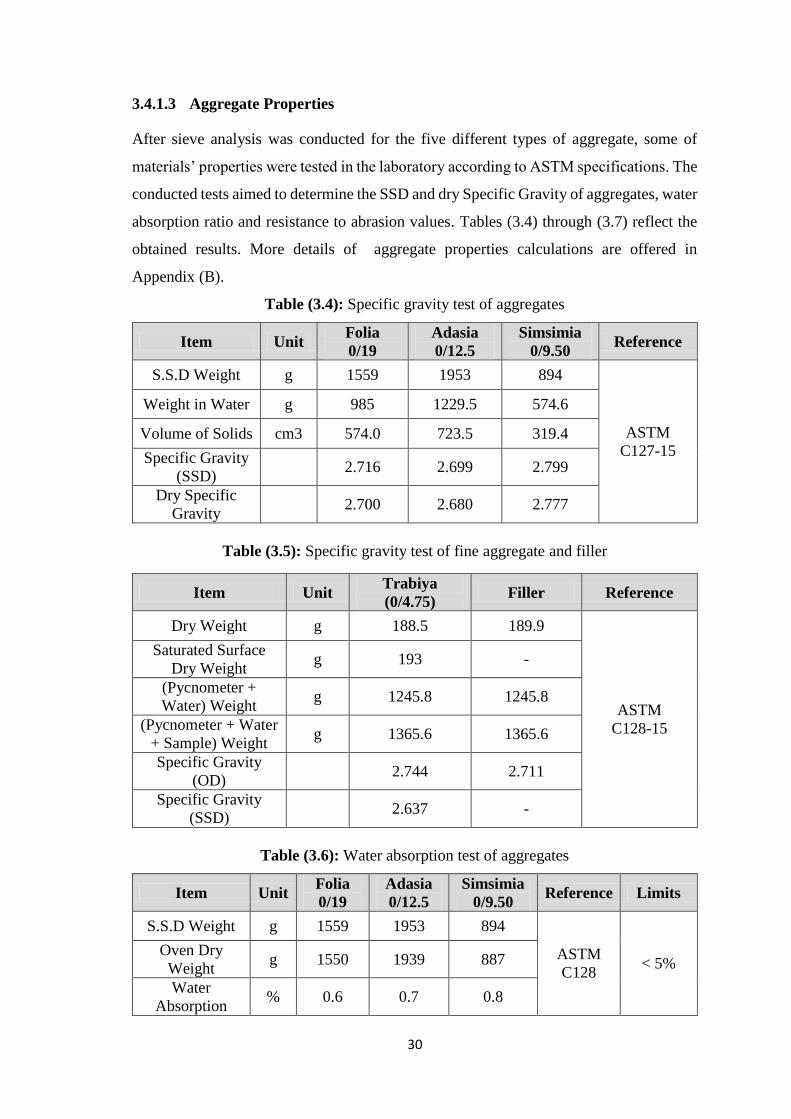
3.4.1.3 Aggregate Properties
After sieve analysis was conducted for the five different types of aggregate, some of
materials’ properties were tested in the laboratory according to ASTM specifications. The
conducted tests aimed to determine the SSD and dry Specific Gravity of aggregates, water
absorption ratio and resistance to abrasion values. Tables (3.4) through (3.7) reflect the
obtained results. More details of aggregate properties calculations are offered in
Appendix (B).
Table (3.4): Specific gravity test of aggregates
Item Unit Folia
0/19
Adasia
0/12.5
Simsimia
0/9.50 Reference
S.S.D Weight g 1559 1953 894
ASTM
C127-15
Weight in Water g 985 1229.5 574.6
Volume of Solids cm3 574.0 723.5 319.4
Specific Gravity
(SSD) 2.716 2.699 2.799
Dry Specific
Gravity 2.700 2.680 2.777
Table (3.5): Specific gravity test of fine aggregate and filler
Item Unit Trabiya
(0/4.75) Filler Reference
Dry Weight g 188.5 189.9
ASTM
C128-15
Saturated Surface
Dry Weight g 193 -
(Pycnometer +
Water) Weight g 1245.8 1245.8
(Pycnometer + Water
+ Sample) Weight g 1365.6 1365.6
Specific Gravity
(OD) 2.744 2.711
Specific Gravity
(SSD) 2.637 -
Table (3.6): Water absorption test of aggregates
Item Unit Folia
0/19
Adasia
0/12.5
Simsimia
0/9.50 Reference Limits
S.S.D Weight g 1559 1953 894
ASTM
C128 < 5%
Oven Dry
Weight g 1550 1939 887
Water
Absorption % 0.6 0.7 0.8
30
Table (3.7): Abrasion loss test of aggregates
Item Unit Folia
0/19
Adasia
0/12.5
Simsimia
0/9.50 Reference Limits
Abrasion Loss
Value % 16.2 13.8 13.1
ASTM
C128 < 40 %
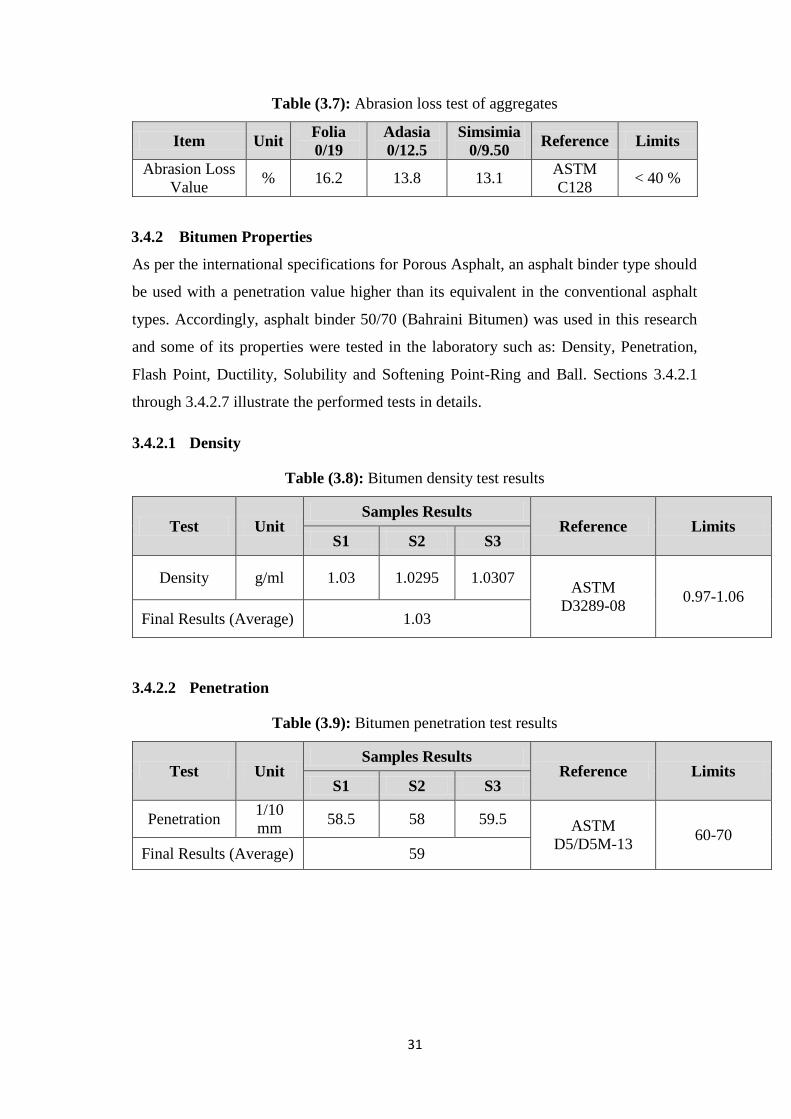
3.4.2 Bitumen Properties
As per the international specifications for Porous Asphalt, an asphalt binder type should
be used with a penetration value higher than its equivalent in the conventional asphalt
types. Accordingly, asphalt binder 50/70 (Bahraini Bitumen) was used in this research
and some of its properties were tested in the laboratory such as: Density, Penetration,
Flash Point, Ductility, Solubility and Softening Point-Ring and Ball. Sections 3.4.2.1
through 3.4.2.7 illustrate the performed tests in details.
3.4.2.1 Density
Table (3.8): Bitumen density test results
Test Unit Samples Results
Reference Limits S1 S2 S3
Density g/ml 1.03 1.0295 1.0307 ASTM
D3289-08 0.97-1.06
Final Results (Average) 1.03
3.4.2.2 Penetration
Table (3.9): Bitumen penetration test results
Test Unit Samples Results
Reference Limits S1 S2 S3
Penetration 1/10
mm 58.5 58 59.5 ASTM
D5/D5M-13 60-70
Final Results (Average) 59

32
3.4.2.3 Flash Point
Table (3.10): Bitumen flash point test results
Test Unit Samples Results
Reference Limits S1 S2 S3
Flash Point º C 287 293 290 ASTM
D92 – 12b
Minimum 230
ºC Final Results (Average) 290
3.4.2.4 Ductility
Figure (3.9) shows ductility device for a bitumen sample.
Table (3.11): Bitumen ductility test results
Test Unit Samples Results
Reference Limits S1 S2 S3
Ductility cm > 150 > 150 > 150 ASTM
D113-07 Minimum 100
Final Results (Average) > 150
Figure (3.9): Ductility device for a bitumen sample
3.4.2.5 Solubility
Table (3.12): Bitumen solubility test results
Test Unit Samples Results
Reference Limits S1 S2 S3
Solubility % 99.53 99.42 99.54 ASTM
D2042-09
Minimum
99.0% Final Results (Average) 99.5

33
3.4.2.6 Softening Point-Ring and Ball
Softening Point: Used to determine the temperature at which a phase change occurs in
asphalt cement. The ring and ball method is used for this test. Figure (3.10) shows
softening point test for bitumen samples.
Table (3.13): Bitumen softening point test results
Test Unit Samples Results
Reference Limits S1 S2 S3
Softening
Point-Ring
and Ball
º C 48.8 49.1 49.2
ASTM D 36 48-56
Final Results (Average) 49
Figure (3.10): Softening point test for bitumen samples
3.4.2.7 Summary of Bitumen Properties
Table (3.14) summarizes various bitumen properties and their results compared with
ASTM specifications limits
Table (3.14): Summary of bitumen properties
No. Test Unit Results Reference Limits
1 Density g/ml 1.03 ASTM D 3289-08 0.97-1.06
2 Penetration 1/10 mm 59 ASTM D5/D5M-13 60-70
3 Flash Point º C 289 ASTM D92 – 12b Minimum 230 ºC
4 Ductility cm > 150 ASTM D113-07 Minimum 100
5 Solubility % 99.5 ASTM D2042-09 Minimum 99.0%
6
Softening
Point-Ring
and Ball
º C 49 ASTM D 36 48-56

34
3.5 Distribution of Porous Asphalt Samples over Practical Program Activites
Table (3.15) presents the number of produced PA samples in each activity of practical
program in addition to the purpose and expected results of this activity.
Table (3.15): Distribution of PA samples over practical program activities
Activity
No. of
Produced
Samples
Purpose Targeted Results
A 12
Determination of the most suitable and
desired gradation from 3 different
gradations.
(4 Porous Asphalt samples were produced
from each gradation)
Determine the most
suitable gradation
which gives the
highest air voids ratio
(Va %) out of 3
different gradations.
B 30
Conducting Draindown and Cantabro
Abrasion Tests in addition to finding the
air voids ratio in the produced asphalt
samples for each bitumen content from 6
different contents.
(5 Porous Asphalt samples were produced
from each bitumen content)
Determine the most
three bitumen contents
that meet ASTM
D7064 specifications
in terms of draindown,
Cantabro Abrasion
and air void values.
C 9
Conducting Marshall Test (stability and
flow) on 9 Asphalt samples produced
using the most three bitumen contents
from activity B
Determine the
Optimum Bitumen
Content (OBC)
D 2
Determination of Permeability of Porous
Asphalt Mix
Determine the
maximum
permeability
coefficient (K) for
Porous Asphalt
Total produced Asphalt samples in practical program 53

35
3.6 Testing Program
3.6.1 Blending of Aggregates
Mixing more than one type of aggregates with different gradations is considered to be the
first essential step in producing any asphalt mix. For this purpose, five different sizes of
aggregates were blended with different proportions until reaching the acceptable limits of
aggregates gradations used for porous asphalt according to ASTM specifications. The
blinding process is based on a trail mathematical approach through propose trial
percentages for each aggregate type from the whole gradation mix such that the total
summations of all aggregate sizes percentages should be 100%, and then these
percentages are converted to its equivalents from the aggregate masses and finally
compared with specification limits. If the resulted gradation is within the acceptable
limits, then the process is finalized with no further adjustments need to be made and this
gradation is considered to be the chosen one; if not, an adjustment in aggregate sizes
proportions should be made and the calculations repeated until reaching a gradation I
which all aggregate sizes are within the acceptable limits (Jendia, 2000). Aggregates
blending results are offered in chapter (4) and in additional details in Appendix (A).
3.6.2 Selection of Trial Gradations
After determination of the acceptable ranges of aggregate gradations using the trail
mathematical approach, three gradations were selected from these ranges which are
combatable with international ASTM specifications in order to determine the most
suitable and desired gradation. Chapter (4) highlights the three selected gradations in
details.
3.6.3 Determination of the Most Suitable and Desired Gradation
According to ASTM D7064/D7064M – 08, twelve porous asphalt samples (4 samples for
each gradation) were produced at this stage with a trail asphalt content 6%. The purpose
of producing four samples from each gradation was to compact three of them using 50
blows at three layers and then calculate the Bulk Dry Specific Gravity for each one (Gmb)
and the fourth sample was not compacted and was used to find the Maximum Theoretical
Specific Gravity (Gmm). After that, the percent air voids (Va) for each asphalt mix was
calculated using equation (3.1).
Va = 100 ( 1 − Gmb
Gmm ) ……………. Equation (3.1)

36
After finding three values for percent air voids (Va), the asphalt mix with the highest Va
was chosen as the most suitable and desired gradation. The above mentioned calculations
are listed in details in chapter 4 of this research.
3.6.4 Determination of Optimum Asphalt Binder Content
After determining the desired aggregate gradations, this gradation was selected to produce
a new thirty (30) porous asphalt samples in order determine the optimum asphalt binder
content (bitumen) that should be used in porous asphalt. A trail bitumen contents were
selected to produce these samples starting from 3.5% to 6 % with 0.5% bitumen content
as an increment. 5 asphalt samples were produced for each asphalt content and then some
tests were performed in the laboratory on these samples in order to determine the optimum
asphalt binder content such that: Draindown Test, Cantabro Abrasion Test in addition to
calculating the percent air voids (Va) for each asphalt mix from Eq. (1) after finding Gmb
and Gmm of the produced samples. The results of this stage are illustrated minutely in
chapter 4 of this research.
3.6.5 Determination of Stability and Flow of Porous Asphalt Samples
Marshall Method for designing hot asphalt mixtures were used to determine the optimum
bitumen content that should be added to specific aggregate blend resulting a mix where
the desired properties of strength and durability are met. According to standard 75-blow
Marshal design method designated as (AASHTO T 245-13) a number of 9 samples each
of 1200 gm in weight were prepared using five different bitumen contents (from 3.5 -
4.5% with 0.5 % incremental). Three samples were used to prepare asphalt mixture with
one-bitumen content to have an average value of Marshal Stability, bulk density and flow.
Figure (3.11) show Marshal Specimens for different bitumen percentages. Marshall
Properties of the asphalt mix such as stability, flow are obtained for various bitumen
contents, then the following graphs are plotted:
a. Stability vs. Bitumen Content;
b. Flow vs. Bitumen Content;

37
Figure (3.11): Some of porous asphalt samples are prepared for Marshal Test
3.6.6 Evaluation of Porous Asphalt Permeability
To evaluate the permeability of porous asphalt and the relationship between air void and
permeability coefficient (K), the falling head test was used. After determining the
optimum bitumen content (OBC), one sample of porous asphalt was prepared using the
OBC (3.5 %) and another one was prepared using a another bitumen content (4 %). These
two samples were placed in the permeability test machine (shown in Figure (3.12)) and
exposed to a falling water column with a height of 50 cm, and once water is permitted to
infiltrate through the samples a stop watch was turned on to count 60 seconds. After 60
seconds was counted the falling of water was stopped and the collected water volume
which infiltrated from the porous asphalt samples was determined. The previous steps
were repeated three times for both of porous asphalt samples and each time the collected
water volume in 60 seconds was determined. After that the average of 3 readings of the
collected water volume was calculated and the permeability coefficient was determined
using the below equation:
𝐾 = 𝑄∗𝐿
𝐴∗𝐻∗𝑇 ……………. Equation (2) where,
K: permeability coefficient (cm/second)
Q: Collected Water Volume (cm3)
L: Sample Height (cm)
A: Cross Sectional Area of Asphalt Sample (cm2)
H: Water Column Height (cm)
T: Time (second)
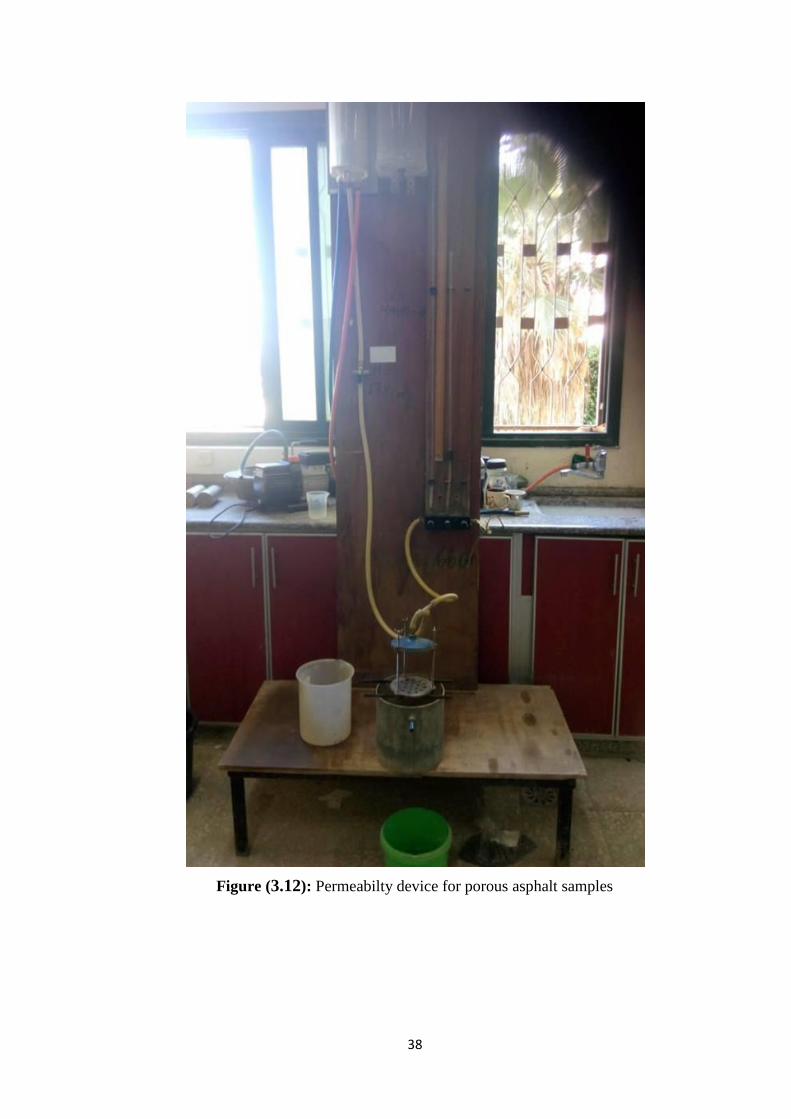
38
Figure (3.12): Permeabilty device for porous asphalt samples

39
4 Chapter Four
Results and Data Analysis

41
4.1 Introduction
Results of laboratory work had been obtained and analyzed in order to achieve study
objectives which include purpose, properties, advantages, disadvantages, of the porous
asphalt and finally evaluate the possibility of using it in Gaza strip.
Laboratory work results are presented in this chapter in three stages. First stage handles
the results of blending aggregates to obtain asphalt wearing course gradation curve and
total air voids ratio. In the second stage, Marshal Test results are analyzed in order to
obtain the optimum bitumen content (OBC). The final stage discusses the Permeability
of Porous Asphalt Mix.
4.2 Blending of Aggregates
Three different options of aggregate gradations had been mixed by blending different
proportions of five various aggregates sizes (Folia, Adasia, Simsimia, Trabiya and filler)
until reaching the acceptable limits of aggregates gradations used for porous asphalt
according to ASTM specifications. The three selected options in addition to the gradation
curves are presented in Tables (4.1), (4.2) and Figure (4.1).
Table (4.1): Three options for proportion of each aggregate material
Aggregate Type Option I Option II Option III
Filler 2% 3% 3%
Trabia 4% 0% 0%
Folia 0% 10% 5%
Simsimia 14% 20% 17%
Adasia 80% 67% 75%
Total 100% 100% 100%
Table (4.2): Sieve analysis for three options of mix gradations of aggregates
Sieve Size
(mm)
% Passing ASTM D7064
Specification limits (%)
Option I Option II Option III Min. Max.
0.075 2.17 2.37 2.33 2 4
2.36 9.53 7.90 7.25 5 10
4.75 14.20 14.56 12.90 10 25
9.5 38.51 39.44 37.83 35 60
12.5 92.93 87.64 90.15 85 100
19 100.00 99.53 99.77 100 100

40
Figure (4.1): Gradation of final aggregates mix for 3 options of aggregate gradations
with ASTM specification range
4.3 Determination of Air Voids Content to Choose the Most Suitable Gradation
To find the total air voids (Va %) in porous asphalt, 12 samples (4 samples for each
option) were produced with a trail asphalt content 6%. These samples were used to
calculate the Bulk Dry Specific Gravity (Gmb) (for the three compacted samples) and to
find the Maximum Theoretical Specific Gravity (Gmm) (for the un-compacted sample).
Gmb and Gmm are then used to find the total air voids (Va %) as stated in the equation
(3.1) where the option that gives the higher value of Va % is considered to be as the most
suiTable and desired gradation. Tables (4.3) through (4.5) show in details the results of
this step
Va = 𝟏𝟎𝟎 ( 𝟏 − 𝐆𝐦𝐛
𝐆𝐦𝐦 ) % ……………. Equation (3.1)
0
20
40
60
80
100
120
0.01 0.1 1 10 100
% p
assi
ng
Sieve size (mm)
Min.
Max.
Option 1
Option 2
Option 3

42
Table (4.3): Total air voids calculations for option I of porous asphalt
Description
Gradation I (Option I)
Compacted Samples Un Compacted
Sample
Sample 1 Sample 2 Sample 3 Sample 4
Weight in air (g) 1128.0 1162.7 1082.2 1147.2
Weight in water (g) 634.5 662.3 612.0 647.6
Weight in air(S.S.D) (g) 1150.0 1191.8 1107.2 1173.1
Sample Diameter (D) (cm) 10.02 10.09 10.18 10.10
Sample Height (H) (cm) 7.05 7.27 7.35 7.22
Sample Volume (cm3) = π/4*D2*H 555.9 581.3 598.2 578.3
Bulk dry specific gravity (Gmb) 2.029 2.000 1.809 -
Max specific gravity (Gmm) - - - 2.427
Percent of Air Voids (Va %) 16.4 17.6 25.5 -
Final (Va %) for Gradation I (Average) 19.8 %
Table (4.4): Total air voids calculations for option II of porous asphalt
Description
Gradation II (Option II)
Compacted Samples Un Compacted
Sample
Sample 1 Sample 2 Sample 3 Sample 4
Weight in air (g) 1169.4 1146.5 1155.9 1160.3
Weight in water (g) 658.9 650.4 651.8 655.6
Weight in air (S.S.D) (g) 1197.5 1178.2 1183.1 1188.7
Sample Diameter (D) (cm) 9.940 10.140 10.040 10.090
Sample Height (H) (cm) 7.738 7.938 7.838 7.888
Sample Volume (cm3) = π/4*D2*H 600.5 641.0 620.5 630.7
Bulk dry specific gravity (Gmb) 1.947 1.789 1.863 -
Max specific gravity (Gmm) - - - 2.428
Percent of Air Voids (Va %) 19.8 26.3 23.3 -
Final (Va %) for Gradation II (Average) 23.1 %

43
Table (4.5): Total air voids calculations for option III of porous asphalt
Description
Gradation III (Option III)
Compacted Samples Un Compacted
Sample
Sample 1 Sample 2 Sample 3 Sample 4
Weight in air (g) 1155.4 1152.9 1168.0 1139.8
Weight in water (g) 655.7 653.1 660.5 645.2
Weight in air(S.S.D) (g) 1183.7 1182.5 1195.3 1166.5
Sample Diameter (D) (cm) 10.143 10.110 10.090 10.230
Sample Height (H) (cm) 7.769 7.845 7.680 7.783
Sample Volume (cm3) = π/4*D2*H 627.8 629.8 614.1 639.7
Bulk dry specific gravity (Gmb) 1.840 1.831 1.902 -
Max specific gravity (Gmm) - - - 2.424
Percent of Air Voids (Va %) 24.1 24.5 21.5 -
Final (Va %) for Gradation III(Average) 23.4%
Based on the results above, it is clearly shown that Gradation III is the option which gives
the highest voids ratio (23.4 %). Accordingly, this Gradation shown in Table (4.6)
(Gradation III) is considered as the most suitable and desired gradation
Table (4.6): Most suitable and desired gradation for porous asphalt
Aggregate Type Gradation III
Filler 3%
Trabia 0%
Folia 5%
Simsimia 17%
Adasia 75%
Total 100%

44
4.4 Determination of Optimum Asphalt Binder Content
In order to determine the optimum asphalt binder content in porous asphalt, 30 samples
were made with 6 different bitumen contents starting from 3.5 % to 6 % with 0.5 % as an
increment. These asphalt samples were tested against its resistance to abrasion loss and
draindown in addition to determination the percentage of air voids in each bitumen
content. The 30 samples were distributed as 5 samples in each bitumen percentage (3 for
Cantabro abrasion loss test, 1 for draindown test and last sample was used to calculate the
maximum theoretical specific gravity (Gmm)).
4.4.1 Determination of Air Voids
After preparing 30 samples of porous asphalt with 6 different bitumen contents, the total
air voids for each bitumen content was determined using the same procedure which was
used in section 4.2.2 of this chapter. The results of this step is shown in Table (4.7):
Table (4.7): Total air void ratios (Va%) for 6 different bitumen contents in PA
Description Va (%)
(Average of 3 Samples)
Bitumen
Content
Total Percent of Air Voids (Va %)
28.9 3.5%
24.95 4%
21.6 4.5%
27.3 5%
28 5.5%
24.4 6%

45
4.4.2 Draindown Test
This test was performed based on ASTM D6390 specifications to determine the portion
of material which separates itself from the sample as a whole and is placed outside the
wire basket during the test. The drained material could be either asphalt binder or a
combination of asphalt binder, additives, or fine aggregate. The test was performed on
one un compacted sample out of 5 samples in each bitumen content at 175 º C. Table (4.8)
illustrates the results of this test:
Table (4.8): Draindown values for 6 different bitumen contents in PA
Draindown
Value %
=[(D-C)/(B-A)]
*100
Description
Bitumen
content
%
D = mass of
the catch
plate or
container plus
drained
material
(g)
C = mass of
the empty
catch plate or
container
(g)
B = mass of
the wire
basket and
sample
(g)
A = mass of
the empty
wire basket
(g)
0.04 3.4 3.0 1364.5 299 3.5%
0.065 3.7 3.0 1370.0 299 4%
0.09 3.95 3.0 1372.9 299 4.5%
0.12 4.3 3.0 1362.4 299 5%
0.16 4.7 3.0 1358.4 299 5.5%
0.21 5.2 3.0 1352.8 299 6%

46
4.4.3 The Cantabro Abrasion Test
This test was performed based on ASTM C131 specifications to determine the abrasion
loss of porous asphalt samples where the test was performed on 3 un aged compacted
samples out of 5 samples in each bitumen content. Table (4.9) summarizes the results of
this test:
Table (4.9): Cantabro abrasion loss values for 6 different bitumen contents in PA
Bitumen
content Description
Sample
1
Sample
2
Sample
3
3.5%
P1= Mass of sample before entering the
abrasion machine (g) 1176.8 1180 1197.5
P2= Mass of sample after entering the
abrasion machine (g) 460.8 453 470.5
Abrasion Loss (P%) = [(P1-P2)/P1]*100 60.8 61.6 60.7
Abrasion Loss (P%) (Average) 61.0
4%
P1 (g) 1152 1168 1160
P2 (g) 461.7 486.1 457
Abrasion Loss (P%) 59.9 58.4 60.6
Abrasion Loss (P%) (Average) 59.6
4.5%
P1 (g) 1128.1 1125.9 1188.7
P2 (g) 492 475.1 510
Abrasion Loss (P%) 56.4 57.8 57.1
Abrasion Loss (P%) (Average) 57.1
5%
P1 (g) 1129.8 1095.3 1166.5
P2 (g) 494.6 496.7 520
Abrasion Loss (P%) 56.2 54.7 55.4
Abrasion Loss (P%) (Average) 55.4
5.5%
P1 (g) 1148.9 1125.7 918
P2 (g) 568.7 542.1 445
Abrasion Loss (P%) 50.5 51.8 51.5
Abrasion Loss (P%) (Average) 51.3
6%
P1 (g) 1143.1 1163 1199.5
P2 (g) 600.9 602.4 626.5
Abrasion Loss (P%) 47.4 48.2 47.8
Abrasion Loss (P%) (Average) 47.8

47
The previous results can be summarized in Table (4.10) and Figures (4.2) through (4.4):
Table (4.10): Summary of Air Voids (Va%), Draindown (%) and Cantabro abrasion
loss (%) results for 6 different bitumen contents in PA
Bitumen Value
(%)
Total Air Voids
(Va%) Draindown (%) Abrasion Loss (%)
3.5 28.9 0.04 61
4 25 0.07 59.6
4.5 21.6 0.09 57.1
5 27.3 0.12 55.4
5.5 28 0.16 51.3
6 24.4 0.21 47.8
Figure (4.2): Total air voids (va%) vs. bitumen content relationship
Fom figure (4.2), it appears that in the first part of the figure the air voids ratio decreases
when bitumen content increases due to the increase of voids percentage filled with
bitumen in the asphalt mix. After that the air voids starts to increase while bitumen content
increases before returing to the first situation again where this might occur beacuase the
compaction degree at the second part of the figure was less than the first one.
20
21
22
23
24
25
26
27
28
29
30
3 3.5 4 4.5 5 5.5 6 6.5
Air
Vo
ids
%
Bitumen Value %
Bitumen - Air Voids Relationship

48
Figure (4.3): Draindown (%) vs. bitumen content relationship
From figure (4.3), it is clearly shown that draindown value is directly proportional with
bitumen value where when bitumen value increased the draindown also increased until
reaching the maximum value 0.21 % at 6% bitumen content. This can be referred to that
when bitumen value increased at high tempretures then the asphalt mix will find an excess
portion of bitumen to be separated from the sample and thus increasing the draindown
value.
Figure (4.4): Cantabro abrasion loss (%) vs. bitumen content relationship
0
0.05
0.1
0.15
0.2
0.25
3 3.5 4 4.5 5 5.5 6 6.5
Dra
ind
ow
n
Bitumen Value %
Bitumen - Draindown Relationship
40
43
46
49
52
55
58
61
64
3 3.5 4 4.5 5 5.5 6 6.5
Ab
rasi
on
%
Bitumen Value %
Bitumen - Abrasion Relationship

49
From figure (4.4), it is clearly shown that Cantabro abrasion loss value is inversly
proportional with bitumen value where when bitumen value increased the abrasion loss
decreased until reaching the minimum value 47.8% at 6% bitumen content. This occurred
because when bitumen content increased the duarabilty of the asphalt mix will increase
and thus is resistance against abrasion will normally be improved.
As stated in ASTM D7064, the selected Open Graded Frication Course (OGFC) should
be the one which meets the below specifications:
Total Air Voids ratio should be minimum 18%
Draindown value should not exceed 0.3%
Abrasion Loss on un-aged Specimens from the Cantabro test should not exceed
20% where the Cantabro abrasion criteria are optional to be used in judgment as
per ASTM D7064 recommendations.
From the previous results it is clearly appeared that 3.5%, 4% and 4.5% bitumen contents
are the most three contents that meet ASTM D7064 specifications in terms of air voids
and draindown values. Table (4.11) illustrates the previous conclusion:
Table (4.11): Most suitable bitumen contents in PA in terms of (Va%) and Draindown
values
Bitumen Value Total Air Voids
(%) Draindown (%)
3.5 28.9 0.04
4 25 0.07
4.5 21.6 0.09
Accordingly, the porous asphalt samples were tested against its stability and flow
(Marshall Test) using 3.5 %, 4 % and 4.5 % bitumen contents to choose the optimum
binder content between them. The next step 4.2.3.4 clarifies the results of Marshall Test:
4.5 Marshall Test (stability and flow)
New 9 asphalt samples were prepared using the most suitable bitumen contents (3.5 %,
4 % and 4.5 %) in terms of total air void ratios and draindown values (3 samples for each
bitumen content). These 9 asphalt samples were tested against their stability and flow
using Marshall test.

51
4.5.1 Stability – Bitumen Content Relationship
Stability is the maximum load required to produce failure of the specimen when load is
applied at constant rate 50 mm / min (Jendia, 2000). Figure (4.5) display the stability
results for different bitumen contents are represented. Stability of asphalt mix decreases
as the bitumen content increase till it reaches the bottom at bitumen content 4.0 % then it
started to rise gradually at a higher bitumen content.
Figure (4.5): stability vs. bitumen content relationship
After studying stability – bitumen content relationship from Figure (4.5), it is clearly
appeared that bitumen content 3.5 % is the content which gives the highest stability of the
asphalt mix (504.55 Kg ≈ 4.95 KN), accordingly 3.5 % is taken as the optimum bitumen
content.
4.5.2 Flow – Bitumen Content Relationship
Flow is the total amount of deformation which occurs at maximum load (Jendia, 2000).
Figure (4.6) display the Flow results for different bitumen contents. Flow of asphalt mix
increases as the bitumen content increases till it reaches the maximum value at the
maximum bitumen content 4.5 %.
300
350
400
450
500
550
3.3 3.5 3.7 3.9 4.1 4.3 4.5 4.7
Stab
ility
(kg
)
Bitumen Content %

50
Figure (4.6): Flow vs. bitumen content relationship
4.6 Determination of Permeability of Porous Asphalt Mix
To evaluate the permeability of porous asphalt and the relationship between air void and
permeability coefficient, the falling head test was used. The testing process includes
preparing 2 porous asphalt samples from 2 different bitumen contents; 3.5 % and 4 %.
Table 4.12 presents the results of the infiltrated water quantities from the asphalt samples
during 60 seconds:
Table (4.12): Infiltrated water quantities from the asphalt samples during 60 seconds
Trial Volume (cm3)
3.5% Bitumen 4% Bitumen
1 1893 1877
2 1946 1861
3 1930 1850
Average 1,923 1,862.67
Using the geometric dimensions of the produced samples and the stated mathematical
formula in equation (4.1), the permeability coefficient is determined as shown in Table
4.13. More details of calculating the permeability coefficient are presented in Appendix
D.
𝐾 = 𝑄∗𝐿
𝐴∗𝐻∗𝑇 ……………. Equation (4.1)
3.4
3.6
3.8
4.0
4.2
3.3 3.5 3.7 3.9 4.1 4.3 4.5 4.7
Flo
w (
mm
)
Bitumen Content %

52
Table (4.13): Permeability coefficient (k) for porous asphalt using 2 different bitumen
contents
Bitumen Content Permeability Coefficient (K (m/day))
3.5% 55.002
4% 52.56
4.7 Differences between Porous Asphalt Results According to ASTM and
German Specifications
Tables (4.14) and (4.15) present the milestones differences between the results of the
current study which is based on ASTM specfications and another previous study that was
performed recently in Palestine based on German specifications titled as: “Porous
Asphalt: A New Pavement Technology in Palestine”.
Table (4.14): Aggregate gradations for porous asphalt according to ASTM and German
specifications
Sieve Size
(mm)
Aggregate gradations for porous asphalt
ASTM Specfications German Specfications
Min. Max. Min. Max.
0.075 2 4 2 5
2 - - 5 15
4.75 10 25 5 35
9.5 35 60 5 100
11.2 - - 70 100
12.5 85 100 85 100
16 - - 93 100
19 100 100 - -
22.4 - - 100 100
Table (4.15): Properties of porous asphalt according to ASTM and German
specifications
Descreption ASTM Specfications German Specfications
Air Voids Ratio (Va) % 28.9 % 21 %
Bitumen Content % 3.5 % 3.83 %
Stability (KN) 4.95 6.75
Flow (mm) 2 - 4 2 - 4
Permeability coefficient
(k) (m/day) 55 -

53
5 Chapter Five
Conclusion and
Recommendations
54
5.1 Conclusion
Based on experimental work results for porous asphalt mixtures, the following
conclusions can be drawn:
a. Porous asphalt can be easily produced in Palestine using the local available
materials according to ASTM specifications (ASTM D7064).
b. Porous asphalt has a high ratio of air voids that can be (18-25)% compared with
air voids ratio in dense asphalt concrete which lies between (3-7)%.
c. Using different bitumen contents is leading to different air voids percentages
where the air voids values were in the range (21–29)% when using bitumen
contents between (3.5-6)%.
d. The optimum bitumen content of porous asphalt is 3.5 % where it is lower than
the bitumen content in dense asphalt concrete which can reach more than 5% due
to its higher durabitlity compared with porous asphalt types.
e. The optimum bitumen content is 3.5 % where it gives the highest ratio of air voids
and lowest percentages of draindown in addition to normal value of asphalt
stability.
f. The bitumen content in porous asphalt is inversely proportional with abrasion loss
values where using higher bitumen contents leads to lower abrasion loss values.
g. Due to higher air voids of porous asphalt compared to dense asphalt concrete, its
stability values are lower than other conventional asphalts.
h. The values of porous asphalt's flow were suitable and within accepted ranges (2-
4) mm
5.2 Recommendations
a. It is recommended to start using porous asphalt in Palestine in order to gain its
useful properties especially those which are related to decreasing runoff water
amounts due to its higher permeability.
b. It is recommended to use high permeable base coarse and sub-base layers in
porous asphalt to increase the efficiency in water infiltration especially with the
high permeability of porous asphalt layer that reaches 55 m/day.
c. It is recommended to increase research in porous asphalt topics to improve its
durability and water infiltration characteristics especially in terms of the internal
road layers (base coarse and sub-base).

55
d. It is recommended to start preparing unique Palestinian Specifications related to
porous asphalt and its properties.
e. It is required to use some modifiers in porous asphalt mixtures to enhance its
abrasion loss values more than those that were obtained in this study.

56
6 References

57
References
A manual for design of hot mix asphalt with commentary. (2011). Washington, D.C.:
Transportation Research Board.
Ali, N., Ramli, M. I., and Hustim, M. (2012). “Porous Asphalt ‘S Contribution on
Road Safety and Environment”, 8th International Symposium on Lowland
Technology September 11-13, 2012 in Bali, Indonesia.
American Society of Testing and Materials (ASTM). ASTM D7064/D7064M – 08
“Standard Practice for Open-Graded Friction Course (OGFC) Mix Design”.
Ashour, B., (2017), “The Relationship between Mechanical Properties and Initial
Temperature of Compacted Asphalt Mixture of Binder Course”, M.Sc Thesis:
Islamic University of Gaza, Palestine.
Barrett, M. E., and Shaw, C. B. (2006). “Stormwater Quality Benefits of a Porous
Asphalt Overlay (No. FHWA/TX-07/0-4605-2)”. Center for Transportation
Research, University of Texas at Austin.
CMWU 2010. Coastal Municipal Water Utility in the Gaza Strip databases, December
2010
Hamdan, S. M., Troeger, U., and Nassar, A. (2007). “Storm Water Availability in the
Gaza Strip, Palestine”. International Journal of Environment and Health,1(4),
580-594.
Hoban T W S, Liversedge F and Searby R. (1985). “Recent Developments in Pervious
Macadam Surfaces”, Proc. 3rd Eurobitumen Symp., The Hague, pp 635-640.
Hsu, T. W., Chen, S. C., and Hung, K. N. (2010). “Performance Evaluation of Asphalt
Rubber in Porous Asphalt-Concrete Mixtures”. Journal of Materials in Civil
Engineering, 23(3), 342-349.
Jendia, S., AlDahdooh, Z., AbuRahma, M., et al. (2018). “Porous Asphalt: A New
Pavement Technology in Palestine”. Journal of Engineering Research and
Technology, 5(1).
Jendia, Sh. (2000). “Highway Engineering-Structural Design”. Gaza: Dar El-Manara
Library.
Kandhal, P. S., and Mishra, S. (2014). “Design, Construction and Performance of
Porous Asphalt Pavement for Rainwater Harvesting”. Indian
Highways, 42(3).

58
Lee, K. W., and Mahboub, K. (2006). “Asphalt Mix Design and Construction: Past,
Present, and Future”. Reston, VA: American Society of Civil Engineers.
Lyons, K. R., and Putman, B. J. (2013). “Laboratory Evaluation of Stabilizing
Methods for Porous Asphalt Mixtures”. Construction and Building
Materials, 49, 772-780.
Matar, S., (2017), "Studying the Effect of Adding Glass Fiber on the Mechanical
Properties of Asphalt Mixtures (Wearing Course Layer)", M.Sc Thesis:
Islamic University of Gaza, Palestine.
McNally, C., DeProspo Philo, L., and Boving, T. B. (2005). “Porous Pavement and
Groundwater Quality Technical Bulletin”. University of Rhode Island
cooperative extension, Nonpoint Education for Municipal Officials, 9.
National Asphalt Pavement Association, (2003) “Porous Asphalt Pavement”,
National Asphalt Pavement Association, Lanham Maryland.
PMA (2013). Palestinian Ministry of Agriculture Databases (December, 2013), Gaza,
Palestine.
Palatová, M., (2012), "New Trends in the Construction of Flexible Pavements", M.Sc
Thesis: BRNO University of Technology.
Putman, B. J., and Kline, L. C. (2012). “Comparison of Mix Design Methods for
Porous Asphalt Mixtures”. Journal of Materials in Civil Engineering, 24(11),
PP 1359-1367.
Sasana P., Ismanto B.S. (2003). “The Influence of Using Local Materials on Quality
of Porous Asphalt in Indonesia”. Proceedings of the Eastern Asia Society for
Transportation Studies, Vol.4, October, 2003.
Schaus L., (2007), "Porous Asphalt Pavement Designs: Proactive Design for Cold
Climate Use", M.Sc Thesis: University of Waterloo.
Shankar, A. U., Suresha, S. N., and Saikumar, G. M. V. S. (2014). “Properties of
Porous Friction Course Mixes For Flexible Pavements”. Indian
Highways, 42(3).
Thelen, E., Howe, L.F., (1978). “Porous Pavement”, The Franklin Institute Press,
Philadelphia Pennsylvania.
Thomas H. Cahill, P.E., Michele Adams, P.E., and Courtney Marm. (2003). “Porous
Asphalt: The Right Choice for Porous Pavements. Hot Mix Asphalt
Technology” – September/October 2003. PP 26-40.

59
Transportation research board committee. (2011). “Manual for Design of Hot Mix
Asphalt with Commentary”. NCHRP report 673, Transportation research
board, Washington, D.C., USA.
Van Heystraeten, G., and Moraux, C. (1990). “Ten Years' Experience of Porous
Asphalt in Belgium”. Transportation Research Record, (1265).

61
7 Appendices

60
Appendix A

62
Appendix A
Aggregates Blending
Table A.1: Suggested Percentages for Porous Asphalt Aggregate Mix (Option 1)
Aggregate mix
Grain size (mm) Suggested percents
for final agg. Mix 0.075 0.18 0.3 0.6 2.36 4.75 9.5 12.5 19 25
Filler 59.68 76.94 88.73 98.06 100.00 100.00 100.00 100.00 100.00 100.00
2.0% 1.19 1.54 1.77 1.96 2.00 2.00 2.00 2.00 2.00 2.00
Trabia (0/4.75) 12.24 19.45 34.91 62.26 98.74 99.62 100.00 100.00 100.00 100.00
4.0% 0.49 0.78 1.40 2.49 3.95 3.98 4.00 4.00 4.00 4.00
Folia () 0.54 0.59 0.64 0.72 0.77 1.52 13.01 35.64 95.31 100.00
0.0% 0.00 0.00 0.00 0.00 0.00 0.00 0.00 0.00 0.00 0.00
Simsimia (0/9.5) 1.34 1.46 1.57 1.62 22.00 54.70 95.63 100.00 100.00 100.00
14.0% 0.19 0.20 0.22 0.23 3.08 7.66 13.39 14.00 14.00 14.00
Adasia (0/12.5) 0.38 0.45 0.52 0.56 0.63 0.70 23.90 91.16 100.00 100.00
80.0% 0.30 0.36 0.42 0.45 0.50 0.56 19.12 72.93 80.00 80.00
∑% passing 2.17 2.88 3.81 5.13 9.53 14.20 38.51 92.93 100.00 100.00 100.0%
Sieve size (mm) 0.08 0.15 0.30 0.85 2.36 4.75 9.50 12.50 19.00 25.00
Wearing 0/ 12.5
(Min) 2 5 10 35 85 100
ASTM Specifications
D7064/D7064M − 08 Wearing 0/ 12.5
(Max) 4 10 25 60 100 100

63
Appendix A
Aggregates Blending
Table A.2: Suggested Percentages for Porous Asphalt Aggregate Mix (Option 2)
Aggregate mix
Grain size (mm) Suggested percents
for final agg. Mix 0.075 0.18 0.3 0.6 2.36 4.75 9.5 12.5 19 25
Filler 59.68 76.94 88.73 98.06 100.00 100.00 100.00 100.00 100.00 100.00
3.00% 1.79 2.31 2.66 2.94 3.00 3.00 3.00 3.00 3.00 3.00
Trabia (0/4.75) 12.24 19.45 34.91 62.26 98.74 99.62 100.00 100.00 100.00 100.00
0.00% 0.00 0.00 0.00 0.00 0.00 0.00 0.00 0.00 0.00 0.00
Folia () 0.54 0.59 0.64 0.72 0.77 1.52 13.01 35.64 95.31 100.00
10.00% 0.05 0.06 0.06 0.07 0.08 0.15 1.30 3.56 9.53 10.00
Simsimia (0/9.5) 1.34 1.46 1.57 1.62 22.00 54.70 95.63 100.00 100.00 100.00
20.00% 0.27 0.29 0.31 0.32 4.40 10.94 19.13 20.00 20.00 20.00
Adasia (0/12.5) 0.38 0.45 0.52 0.56 0.63 0.70 23.90 91.16 100.00 100.00
67.00% 0.25 0.30 0.35 0.38 0.42 0.47 16.01 61.08 67.00 67.00
∑% passing 2.37 2.96 3.39 3.71 7.90 14.56 39.44 87.64 99.53 100.00 100.0%
Sieve size (mm) 0.08 0.15 0.30 0.85 2.36 4.75 9.50 12.50 19.00 25.00
Wearing 0/ 12.5
(Min) 2 5 10 35 85 100
ASTM Specifications
D7064/D7064M − 08 Wearing 0/ 12.5
(Max) 4 10 25 60 100 100

64
Appendix A
Aggregates Blending
Table A.3: Suggested Percentages for Porous Asphalt Aggregate Mix (Option 3)
Aggregate mix
Grain size (mm) Suggested percents
for final agg. Mix 0.075 0.18 0.3 0.6 2.36 4.75 9.5 12.5 19 25
Filler 59.68 76.94 88.73 98.06 100.00 100.00 100.00 100.00 100.00 100.00
3.00% 1.79 2.31 2.66 2.94 3.00 3.00 3.00 3.00 3.00 3.00
Trabia (0/4.75) 12.24 19.45 34.91 62.26 98.74 99.62 100.00 100.00 100.00 100.00
0.00% 0.00 0.00 0.00 0.00 0.00 0.00 0.00 0.00 0.00 0.00
Folia () 0.54 0.59 0.64 0.72 0.77 1.52 13.01 35.64 95.31 100.00
5.00% 0.03 0.03 0.03 0.04 0.04 0.08 0.65 1.78 4.77 5.00
Simsimia (0/9.5) 1.34 1.46 1.57 1.62 22.00 54.70 95.63 100.00 100.00 100.00
17.00% 0.23 0.25 0.27 0.28 3.74 9.30 16.26 17.00 17.00 17.00
Adasia (0/12.5) 0.38 0.45 0.52 0.56 0.63 0.70 23.90 91.16 100.00 100.00
75.00% 0.29 0.34 0.39 0.42 0.47 0.53 17.93 68.37 75.00 75.00
∑% passing 2.33 2.92 3.35 3.67 7.25 12.90 37.83 90.15 99.77 100.00 100.0%
Sieve size (mm) 0.08 0.15 0.30 0.85 2.36 4.75 9.50 12.50 19.00 25.00
Wearing 0/ 12.5
(Min) 2 5 10 35 85 100
ASTM Specifications
D7064/D7064M − 08 Wearing 0/ 12.5
(Max) 4 10 25 60 100 100

65
Table A.4: Proportion of each aggregate material from proposed mix (3 options)
Aggregate Type Option 1 Option 2 Option 3
Filler 2% 3% 3%
Trabia 4% 0% 0%
Folia 0% 10% 5%
Simsimia 14% 20% 17%
Adasia 80% 67% 75%
Total 100% 100% 100%
Table A.5: Sieve analysis for three options of mix gradations of aggregates
Sieve Size
(mm)
% Passing
ASTM
D7064/D7064M − 08
Specification limits (%)
Option 1 Option 2 Option 3 Min. Max.
0.075 2.17 2.37 2.33 2 4
2.36 9.53 7.90 7.25 5 10
4.75 14.20 14.56 12.90 10 25
9.5 38.51 39.44 37.83 35 60
12.5 92.93 87.64 90.15 85 100
19 100.00 99.53 99.77 100 100
Figure A.1: Job Mix Gradations (3 Options)
0
20
40
60
80
100
120
0.01 0.1 1 10 100
% p
assi
ng
Sieve size (mm)
Min.
Max.
Option 1
Option 2
Option 3

66
Appendix B
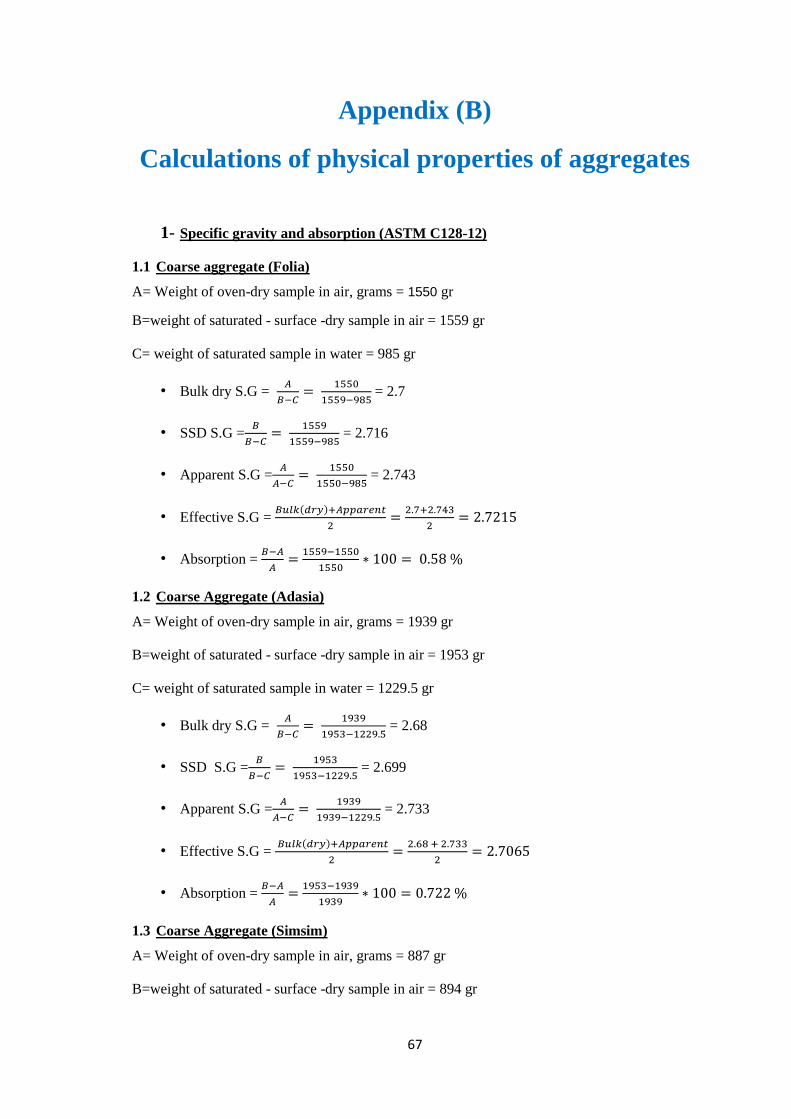
67
Appendix (B)
Calculations of physical properties of aggregates
1- Specific gravity and absorption (ASTM C128-12)
1.1 Coarse aggregate (Folia)
A= Weight of oven-dry sample in air, grams = 1550 gr
B=weight of saturated - surface -dry sample in air = 1559 gr
C= weight of saturated sample in water = 985 gr
• Bulk dry S.G = 𝐴
𝐵−𝐶=
1550
1559−985 = 2.7
• SSD S.G =𝐵
𝐵−𝐶=
1559
1559−985 = 2.716
• Apparent S.G =𝐴
𝐴−𝐶=
1550
1550−985 = 2.743
• Effective S.G = 𝐵𝑢𝑙𝑘(𝑑𝑟𝑦)+𝐴𝑝𝑝𝑎𝑟𝑒𝑛𝑡
2=
2.7+2.743
2= 2.7215
• Absorption = 𝐵−𝐴
𝐴=
1559−1550
1550∗ 100 = 0.58 %
1.2 Coarse Aggregate (Adasia)
A= Weight of oven-dry sample in air, grams = 1939 gr
B=weight of saturated - surface -dry sample in air = 1953 gr
C= weight of saturated sample in water = 1229.5 gr
• Bulk dry S.G = 𝐴
𝐵−𝐶=
1939
1953−1229.5 = 2.68
• SSD S.G =𝐵
𝐵−𝐶=
1953
1953−1229.5 = 2.699
• Apparent S.G =𝐴
𝐴−𝐶=
1939
1939−1229.5 = 2.733
• Effective S.G = 𝐵𝑢𝑙𝑘(𝑑𝑟𝑦)+𝐴𝑝𝑝𝑎𝑟𝑒𝑛𝑡
2=
2.68 + 2.733
2= 2.7065
• Absorption = 𝐵−𝐴
𝐴=
1953−1939
1939∗ 100 = 0.722 %
1.3 Coarse Aggregate (Simsim)
A= Weight of oven-dry sample in air, grams = 887 gr
B=weight of saturated - surface -dry sample in air = 894 gr
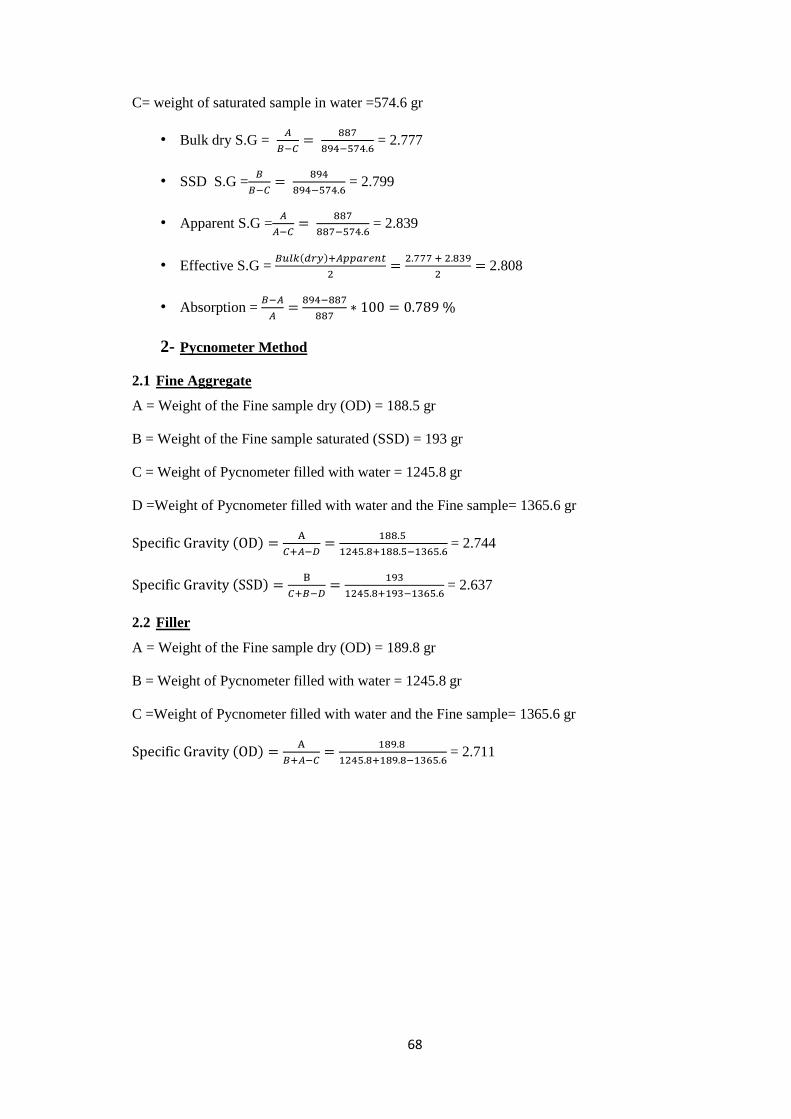
68
C= weight of saturated sample in water =574.6 gr
• Bulk dry S.G = 𝐴
𝐵−𝐶=
887
894−574.6 = 2.777
• SSD S.G =𝐵
𝐵−𝐶=
894
894−574.6 = 2.799
• Apparent S.G =𝐴
𝐴−𝐶=
887
887−574.6 = 2.839
• Effective S.G = 𝐵𝑢𝑙𝑘(𝑑𝑟𝑦)+𝐴𝑝𝑝𝑎𝑟𝑒𝑛𝑡
2=
2.777 + 2.839
2= 2.808
• Absorption = 𝐵−𝐴
𝐴=
894−887
887∗ 100 = 0.789 %
2- Pycnometer Method
2.1 Fine Aggregate
A = Weight of the Fine sample dry (OD) = 188.5 gr
B = Weight of the Fine sample saturated (SSD) = 193 gr
C = Weight of Pycnometer filled with water = 1245.8 gr
D =Weight of Pycnometer filled with water and the Fine sample= 1365.6 gr
Specific Gravity (OD) =A
𝐶+𝐴−𝐷=
188.5
1245.8+188.5−1365.6 = 2.744
Specific Gravity (SSD) =B
𝐶+𝐵−𝐷=
193
1245.8+193−1365.6 = 2.637
2.2 Filler
A = Weight of the Fine sample dry (OD) = 189.8 gr
B = Weight of Pycnometer filled with water = 1245.8 gr
C =Weight of Pycnometer filled with water and the Fine sample= 1365.6 gr
Specific Gravity (OD) =A
𝐵+𝐴−𝐶=
189.8
1245.8+189.8−1365.6 = 2.711

69
Appendix C

71
Appendix (C)
Calculations of Gmb, Gmm and Total Air Voids (Va %)
Bulk Dry Specific Gravity (Gmb) is calculated for the three options of aggregate gradations using the following procedure
Gmb =Dry Weight of Sample in Air
𝑉𝑜𝑙𝑢𝑚𝑒 𝑜𝑓 𝑠𝑎𝑚𝑝𝑙𝑒 =
Dry Weight of Sample in Air
(π
4)∗ 𝐷2 ∗ 𝐻
Tables C.1 below illustrates the calculations of Gmb
Table C.1: Calculations of Bulk Dry Specific Gravity (Gmb) for compacted Porous Asphalt Samples
Description
Gradation I (Option 1) Gradation II (Option 2) Gradation III (Option 3)
Sample 1 Sample 2 Sample 3 Sample 1 Sample 2 Sample 3 Sample 1 Sample 2 Sample 3
Weight in air (g) 1128.0 1162.7 1082.2 1169.4 1146.5 1155.9 1155.4 1152.9 1168.0
Sample Diameter (D) (cm) 10.02 10.09 10.18 9.940 10.140 10.040 10.143 10.110 10.090
Sample Height (H) (cm) 7.05 7.27 7.35 7.738 7.938 7.838 7.769 7.845 7.680
Sample Volume (cm3) = (π
4) ∗ 𝐷2 ∗ 𝐻 555.9 581.3 598.2 600.5 641.0 620.5 627.8 629.8 614.1
Gmb = Dry Weight of Sample in Air
𝑉𝑜𝑙𝑢𝑚𝑒 𝑜𝑓 𝑠𝑎𝑚𝑝𝑙𝑒 2.029 2.000 1.809 1.947 1.789 1.863 1.840 1.831 1.902

70
A fourth porous asphalt sample (Un-Compacted) was prepared to calculate the maximum specific gravity Gmm using ASTM specifications
(ASTM D2041). Table C.2 below shows the needed calculations
Table C.2: Calculations of Maximum Specific Gravity (Gmm) for Un-compacted Porous Asphalt Samples
Description Gradation I (Option 1) Gradation II (Option 2) Gradation III (Option 3)
A Dry mass of sample (g) 221.8 201.5 185.9
B Mass (Pycnometer) under water (g) 1454.1 1454.1 1454.1
C Mass (Pycnometer + Sample) under water (g) 1584.5 1572.6 1563.3
Gmm = 𝑨
𝑨−(𝑪−𝑩) 2.427 2.428 2.424
After determining the values of Gmb and Gmm, the total air voids value can be calculated using equation C.1 below (Calculations are presented in
Table C.3):
Va = 𝟏𝟎𝟎 ( 𝟏 − 𝐆𝐦𝐛
𝐆𝐦𝐦 ) ……………………. Equation C.1
Table C.3: Calculations of Total Air Voids (Va%) for Porous Asphalt Samples
Description Gradation I (Option 1) Gradation II (Option 2) Gradation III (Option 3)
S1 S2 S3 S4 S1 S2 S3 S4 S1 S2 S3 S4
Bulk Dry Specific Gravity (Gmb) 2.029 2.000 1.809 - 1.947 1.789 1.863 - 1.840 1.831 1.902 -
Maximum Specific Gravity (Gmm) - - - 2.427 - - - 2.428 - - - 2.424
Total air voids (Va%) = 𝟏𝟎𝟎 ( 𝟏 − 𝐆𝐦𝐛
𝐆𝐦𝐦 ) 16.2 17.3 25.2 - 19.6 26.1 23.1 - 23.9 24.3 21.3 -

72
Appendix D

73
Appendix (D)
Determination of Permeability of Porous Asphalt
Mix
Permeability coefficient (K) of porous asphalt samples was calculated using the falling
head test method in which k can be found using equation D.1 below:
𝐾 = 𝑄∗𝐿
𝐴∗𝐻∗𝑇 ……………. Equation (D.1) where,
Q: volume of water infiltrated through porous asphalt sample (cm3)
L: Sample height (cm)
A: Cross Sectional Area of asphalt sample (cm2)
H: height of water column (Pressure Head) (cm)
T: Elapsed time to infiltrate water through the asphalt sample (sec.)
During the laboratory program execution, 2 porous asphalt samples with 2 different
bitumen content (3.5% and 4% ) were prepared for permeability test purposes. Table
(D.1) below presents the results of the test.
Item Sample 1 (3.5%
Bitumen) Sample 2 (4% Bitumen)
Q (cm3)
Trail 1 1,893 1,877
Trail 2 1,946 1,861
Trail 3 1,930 1,850
Q (cm3) (average) 1,923 1,862.67
L (cm) 7.8 7.85
D (cm) 10 10.1
A (cm2) = (π
4) ∗ 𝐷2 78.54 80.12
H (cm) 50 50
T (sec.) 60 60

74
From the previous data in Table (D.1), equation (D.1) can be used to find K as follows:
For Sample 1 (3.5% Bitumen)
𝐾 = 𝑄∗𝐿
𝐴∗𝐻∗𝑇 =
1,923∗7.8
78.54∗50∗60= 0.063659282 cm/sec.
𝐾 = 0.063659282∗3600∗24
100 = 55.002 m/day
For Sample 2 (4% Bitumen)
𝐾 = 𝑄∗𝐿
𝐴∗𝐻∗𝑇 =
1,862.67∗7.85
80.12∗50∗60= 0.060833581 cm/sec.
𝐾 = 0.060833581 ∗3600∗24
100 = 52.56 m/day

75
Appendix E

76
Appendix (E)
Photos
Figure E.1: Aggregate types
Figure E.2: Seive analysis of aggregates

77
Figure 7E.3: Asphalt mix during compaction
Figure E.4: Asphalt mixture samples in oven

78
Figure E.5: Asphalt samples subjected to Draindown test in oven
Figure E.6: preparing of marshal samples
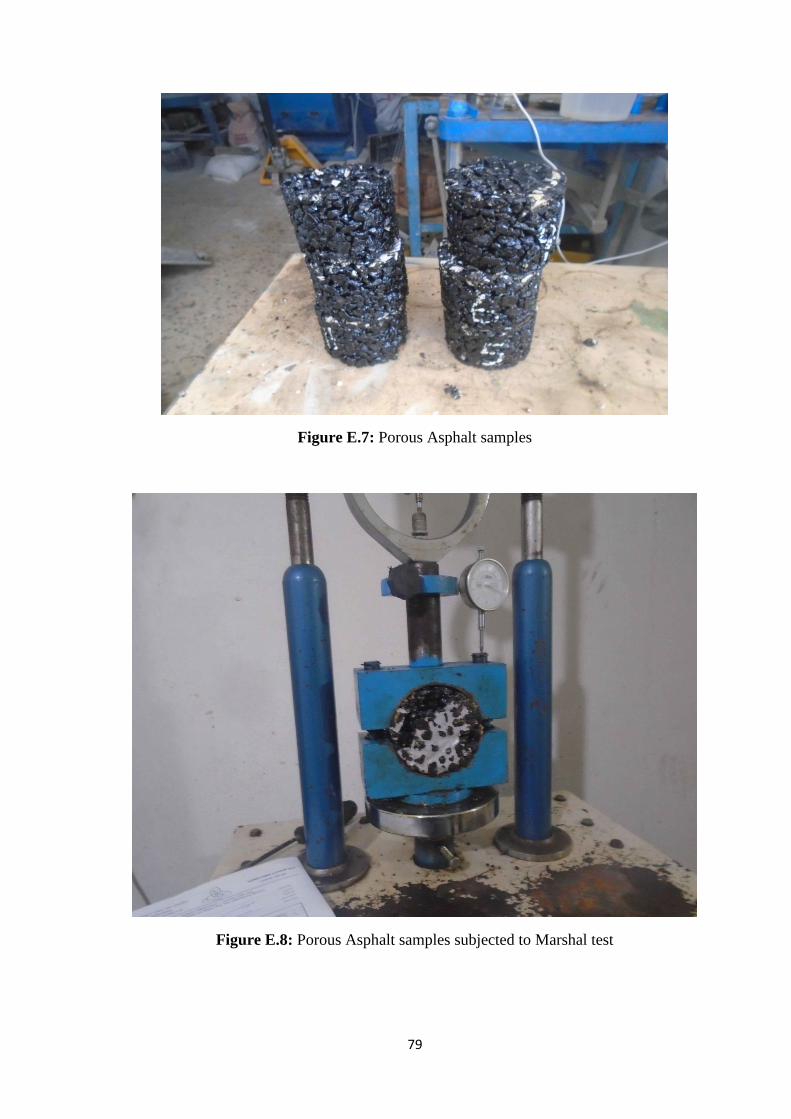
79
Figure E.7: Porous Asphalt samples
Figure E.8: Porous Asphalt samples subjected to Marshal test

81
Figure E.9: Used permeabilty device for porous asphalt samples