a proposed city of stonecrest, georgia a fiscal feasibility analysis december, 2013
DESCRIPTION
A feasibility study for the proposed City of Stonecrest, in Dekalb County, Georgia. Prepared by the Carl Vinson Institute of Government Studies, University of Georgia.TRANSCRIPT

Assessing Budget Reduction Alternatives for the Georgia Veterinary Diagnostic Laboratory System

TableofContents
ExecutiveSummary...................................................................................................................................................1
Introduction..................................................................................................................................................................2
Revenues.........................................................................................................................................................................4
Expenditures...............................................................................................................................................................16
AppendixA...................................................................................................................................................................33
AppendixB...................................................................................................................................................................34
AppendixC...................................................................................................................................................................37
AppendixD..................................................................................................................................................................39
AppendixE...................................................................................................................................................................40
AppendixF...................................................................................................................................................................42
AppendixG...................................................................................................................................................................49
AppendixH..................................................................................................................................................................52
AppendixI....................................................................................................................................................................53
Tables
Table1:SummaryofEstimatedRevenuesandEstimatedExpenditures..........................................2
Table2:StudyAreaRevenueEstimates...........................................................................................................4
Table3:PropertyValuesinStudyAreaandUnincorporatedDeKalb.................................................7
Table4:2010PopulationfiguresforStudyAreaandUnincorporatedDeKalb..............................9
Table5:2010DemographicProfileofStudyAreaandPrimaryComparisonCities...................17
Table6:SummaryofExpenditureEstimates...............................................................................................18
Table7:StudyAreaParkAmenities.................................................................................................................24

1
ExecutiveSummary
Over the last several years, theCarl Vinson Institute ofGovernment has conducted a
numberoffeasibilitystudiesforproposedincorporations.Thosestudies,likethisone,have
been designed to provide the groups and legislators that have commissioned them an
opportunity to investigate the potential fiscal feasibility of an area being considered for
municipal incorporation. Essentially what the study seeks to determine is whether the
services sought to be provided by a hypothetical city along with the necessary
administrative apparatus can be adequately funded by the revenues that would be
available. The House of Representatives Governmental Affairs Committee of the Georgia
General Assembly has required by committee rule that bills proposing incorporation be
introducedinthefirstyearofabiennialsession,andthatafeasibilitystudybeconducted
before they can be considered in the second year and has named the Institute of
Governmentasoneofthetwouniversityinstitutionsqualifiedtoconductthestudy.
Todetermineavailablerevenues,wehavelookedattheamountsofrevenuebeingpaid
to the county government currently providing services to the area under study and any
revenue streams uniquely available tomunicipalities such as franchise fees orHOST tax
distributions. To determine the likely operational expenses associated with providing
parks, police, public works, planning and zoning, basic administrative costs, as well as
capital costs associated with those services and administration, we looked at two
comparisongovernmentsinthemetropolitanAtlantaarea,DunwoodyandSmyrna.
It is important to note the limitations of these types of studies. They cannot predict
everypossiblevariablethatmayoccurinthefuturewithapotentialimpactonthecostsof
government.Additionally,thestudyisnotintendedtobeamodelbudgetforanewcity.A
newlyelectedcitycouncilwillendeavortorepresenttheirconstituenciesandwillhavea
setofprioritiesthatmayimpactbothtaxingandspendingpatterns.
Weareconfidenthowever, that lookingatcurrentlyavailablerevenuesandanalyzing
comparablemunicipalgovernmentspendingthatourstudyreflectsarealisticassessment
of likely fiscal feasibility. Based on our analysis, we find that likely currently available

2
revenues fall short of likely expenditures for the services identified to be provided, and
thereforehaveconcludedthatacitycomprisedoftheStonecreststudyareaisnotfiscally
feasiblewithoutsignificantrevenueenhancement.
Table1:SummaryofEstimatedRevenuesandEstimatedExpenditures
StudyArea PerCapita
AnnualOperatingExpenses $35,667,177.57 $433.88
AnnualCapitalExpenses $9,476,847.55 $115.28
TotalAnnualExpenses $45,144,025.11 $549.16
TotalAnnualRevenues $31,081,838.00 $378.10
TotalAnnualRevenueslessMotorVehicleTax
$29,885,668.00 $363.55
AmountofRevenuelessMotorVehicleTaxexceedingExpenses
($15,258,357.11) ($185.61)
Introduction
TheStonecrestCityAlliance(hereinafter“SCA”)andStateSenatorRonaldRamsey,
Sr. engaged the Carl Vinson Institute of Government to study an area within
unincorporated DeKalb County in order to aid their consideration of the area’s possible
incorporation.Stonecrest,orthe“studyarea,”asitisreferredtointhisreport,iscomprised
of 37.94 square miles1 and is situated in southeast DeKalb County. The study area is
borderedtothenorthbyGwinnettCounty,totheeastbyRockdaleCounty,andtothesouth
by both Rockdale andHenry Counties. The study area’swestern boundary runs roughly
alongalinestretchingfromCountyLineRoadalongtheHenryCountyborderinthesouth
to Rockbridge Road along the Gwinnett County border in the north. The study area is
separatedfromexistingcitiesinDeKalbCountybyunincorporatedportionsofthecounty
1AsdeterminedthroughGISmapping.

3
andcompletelysurroundstheexistingcityofLithonia.SeeAppendixAforamapofthestudy
area.
This report provides estimates of revenues and expenditures a potential City of
Stonecrest, if incorporated, could anticipate inproviding certainmunicipal services for a
single fiscal year. The revenue estimates are primarily based upon actual revenues
collectedfortheunincorporatedareabyDeKalbCountyinfiscalyear(FY)2012aswellas
projections for franchise fees, the Homestead Option Sales Tax, and the Community
DevelopmentBlockGrant.Expenditureestimatesareprimarilybasedoncostsforservices
in the cities of Smyrna and Dunwoody. For each city that was used to establish costs
estimates, CVIOG faculty examined its budget documents and conducted interviewswith
citystafftoinquireastotheproperallocationofcertaincostsandtoclarifyfiguresandline
itemsreportedintheirbudgets.
ThecitiesofSmyrnaandDunwoodywereselectedattheoutsetofthestudytobe
usedastheprimarycomparisonsforexpenditurepurposes.Thesecitiesaresimilarinsize
tothestudyareaandarelocatedinmetropolitanAtlanta.Oneofthecitiesisfairlynewin
thatDunwoodywasincorporatedonDecember1,2008.Thefiscalyearsof2011and2012
wereusedfromeachcitytoestimatecosts,becausetheyconstitutedthebestavailabledata
duringthetimethestudywasconducted.Formostofthattime,Dunwoodycontractedwith
threedifferentprivate sector serviceproviders inorder toprovide city services. Smyrna
provides municipal services through its own directly employed city staff. Both cities
directlyemploytheirownpolicepersonnel.
Estimatesgiveninthisreportarebasedontaxleviesandservicelevelsforacitynot
yetcreated;and, thus, theyshouldnotbeviewedascertainties.While it isourhopethat
thisreportassistswiththepublicconsiderationofapotentialmunicipal incorporation, it
shouldnotbeconstruedtoconstituteapositioneitherfororagainsttheestablishmentofa
CityofStonecrestbytheCarlVinsonInstituteofGovernment(CVIOG).

4
I. Revenues
The revenue estimates outlined below include all major revenue sources a city
representingthestudyareawouldhavecollectedhaditexistedin2012andassessedtaxes
andfeesatratessimilartoDeKalbCountyinthatsameyear.Incalculatingtheseestimates,
weappliedmetricsusedinpriorresearchthatwereacceptedbystakeholdersinsomeof
themost recent incorporation studies. Thus, this report uses similar revenue estimation
methodologiesasthoseprovidedinbothGeorgiaStateUniversity’s2007report,“TheFiscal
ImpactonDeKalbCountywithPossible IncorporationofDunwoody,Georgia” and theCarl
Vinson Institute’s 2008 report, “Revenue and Expenditure Analysis of a Proposed City of
Dunwoody” to the extent possible. Themethod for determininghowmuch revenuewas
assignedascomingfromthestudyareaisdescribedinTable2.
Table2:StudyAreaRevenueEstimates
RevenueSource DataSource Amount
OccupationTaxesActualsfrom2012Calendaryearfor
Businesslicenses $1,781,792
AlcoholicBeverageExciseTaxes
RatioofassessedvalueofcommercialpropertyinstudyareatoDeKalb
unincorporatedarea $624,491
PersonalPropertyTaxes
RatioofassessedvalueofcommercialpropertyinstudyareatoDeKalb
unincorporatedarea $606,126
Hotel/MotelTaxes
RatioofassessedvalueofcommercialpropertyinstudyareatoDeKalb
unincorporatedarea $430,293
Hotel/MotelTaxes(restrictedtotourism)
RatioofassessedvalueofcommercialpropertyinstudyareatoDeKalb
unincorporatedarea $286,862
BusinessLicense–Police
RatioofassessedvalueofcommercialpropertyinstudyareatoDeKalb
unincorporatedarea $161,857
BusinessLicense–AlcoholicBeverages
RatioofassessedvalueofcommercialpropertyinstudyareatoDeKalb
unincorporatedarea $1,351,124

5
Table2:StudyAreaRevenueEstimates(continued)
RevenueSource DataSource Amount
BankSharesTaxes
RatioofassessedvalueofcommercialpropertyinstudyareatoDeKalb
unincorporatedarea $126,658
Intangible
RatioofassessedvalueofallpropertyinstudyareatoDeKalbunincorporated
area $99,688
DevelopmentFund
Ratioofassessedvalueofresidential&commercialpropertyinstudyareato
unincorporatedarea $567,178
ZoningandVarianceFeesandPermits
Ratioofassessedvalueofresidential&commercialpropertyinstudyareato
unincorporatedarea $12,355
InsurancePremiumsRatioofpopulationinstudyareato
DeKalbunincorporatedarea $4,026,408
Fines&ForfeituresRatioofpopulationinstudyareato
DeKalbunincorporatedarea $3,626,090
StormWaterFund 2013ActualsfromTaxCommissioner $2,543,990
MotorVehiclesTaxes*Ratioofpopulationinstudyareato
DeKalbunincorporatedarea $1,196,170
LawEnforcement‐ConfiscatedMoniesFund
RatioofpopulationinstudyareatoDeKalbunincorporatedarea $281,037
SaleofPrintedMaterial‐Police
RatioofpopulationinstudyareatoDeKalbunincorporatedarea $43,935
HomesteadOptionSalesTaxes(restrictedtocapital)
CalculationpursuanttoO.C.G.A.§48‐8‐104 $2,095,151
StateGrant‐CommunityDevelopmentBlockGrant
Averagerevenuefrom19Georgiacitiespopulationrangebetween30,000‐
94,000from2008‐2011 $628,868
MiscellaneousThisrepresentsanumberofsmallrevenuesources.SeeAppendixB. $36,877
FranchiseFees Regressionwithdatasetof32cities $5,749,374
RealPropertyTaxes 2013ActualsfromTaxCommissioner $3,893,045

6
Table2:StudyAreaRevenueEstimates(continued)
RevenueSource DataSource Amount
RealPropertyTaxes‐Penalties
RatioofPenaltiestoPropertyTaxesinUnincorporatedDeKalb $62,289
StreetLights 2013ActualsfromTaxCommissioner $831,505
SpeedBumps 2013ActualsfromTaxCommissioner $18,675
TotalRevenueEstimate $31,081,838
TotalRevenuelessMotorVehicleTaxes
$29,885,668
ReliesonFY2012dataunlessotherwiseindicated.SeeAppendixCforcountyrevenuedatadetail.
*UnderO.C.G.A.§48‐5C‐1(c)(3)citiesformedonorafterJanuary1,2013willnotreceiveafirststepdistributionoftheLocalTitleAdValoremTaxFeeand,consequently,thissourceofrevenuewilldisappearforthestudyareaoverashortperiodoftimeasresidentsoftheareapurchasenewvehicles.
A. MethodologiesUtilizingRatiosofAssessedRealPropertyValue
AnumberoftaxescurrentlycollectedintheunincorporatedareaofDeKalbCountyare
generatedsolelybycommercialactivity.Inordertoobtainestimatesofhowmuchrevenue
wouldbegeneratedbythesetaxes,acomparisonwasmadebetweentheassessedvalueof
commercial property in the study area and the unincorporated area of the county.
Assuming that the ratio of commercial real property value is a proxy for commercial
activity,thisratiowasappliedagainstactual2012collectionsforseveralrevenuesources
whicharedescribedbelow.Actualcountyrevenuesusedtotabulatethedifferentrevenue
estimationswereprovidedbyDeKalbCounty.Appraisedvaluesfortherealpropertyinthe
studyareawereprovidedbytheDeKalbTaxCommissioner,aswerethetaxdigestvalues
forthecounty’sunincorporatedarea.Todeterminerevenuefromheavyequipmenttaxes,
the same approachwas taken utilizing the ratio for industrial property. SeeAppendixB.
Table3illustratestheratiosofresidential,commercial,industrial,utilityandtotalassessed
propertyvalueofthestudyareatotheunincorporatedareainDeKalbCounty.

7
Table3:2013PropertyValuesinStudyAreaandUnincorporatedDeKalb
StudyArea UnincorporatedDeKalbCounty
PercentStudyAreato
Unincorporated
AVResidentialProp $677,541,552 $6,326,833,769 10.71%
AVCommercialProp $425,189,227 $2,755,000,357 15.43%
AVCom&Res $1,102,730,779 $9,081,834,126 12.14%
AVIndustrialProp $123,611,342 $610,887,609 20.23%
AVUtilityProp $0 $286,113,789 0%
TotalAssessedValue $1,226,342,121 $9,978,835,524 12.29%
OccupationTaxes
Occupationtaxesare leviedonpersonsandentitiesengaged inoccupationsor trades for
profit‐making purposes. DeKalb County levies an occupation tax in the unincorporated
area.
AlcoholicBeverageExciseTaxes
Alcoholic beverage excise taxes are collected on individual retail sales of alcoholic
beverages.
PersonalPropertyTaxes
Personalpropertytaxesareleviedonpersonalpropertyownedbycommercialbusinesses.
Hotel/MotelTaxes
Hotel/moteltaxesarecollectedbasedonapercentageofthenightlyroomratechargedby
hotelswithinthejurisdictionofacityorcountythatleviesthetax.DeKalbCountyleviesa
tax of 5% of the nightly room rate. Pursuant to state law, however, only the revenue
generated by a 3% taxmay be spent for general fund purposes; the remaining revenue
must be spent on activities promoting tourism, generally by contract with a non‐profit.

8
Thus,someofthefundsidentifiedinthetablearerestrictedtothispurpose.SCAverified
thepresenceofatleast9hotelsinthestudyarea.ThesearelistedinAppendixD.
BusinessLicenses‐Police
Thislineitemrepresentsfeesgeneratedbybackgroundchecksthatarerequiredtoobtain
licenses for various locally‐regulated activities (e.g. alcoholic beverage pouring permits,
taxicablicenses,etc.).
AlcoholicBeverageLicenses
InordertosellalcoholicbeveragesinGeorgia,aproprietormusthavebothalocalandstate
licensetoselleitherinpackagesorbythedrink.Locallicensesarerenewedannuallyand
eachyear’srenewalisaccompaniedbypaymentofafee.
BankSharesTaxes
Citiesandcountiesarepermittedto levya taxondepository financial institutionshaving
officeslocatedintheirrespectivejurisdictions.
IntangibleTaxes
Intangibletaxes(recordingtaxes)arecollectedonpropertythatissoldatthetimeitsdeed
is recorded. This number was obtained by applying the ratio of the assessed value of
commercial and residential property in the study area to the assessed value of the
commercialandresidentialpropertyintheunincorporatedspecialtaxdistrictagainstthe
amountofrevenuecollectedbythecountyintheunincorporatedarea.
DevelopmentFund
Thisamount represents fees charged forpermits related todevelopment (e.g., plumbing,
electrical,HVAC,andbuildinginspections).
ZoningandVarianceFeesandPermits
This figure represents fees charged of applicants for zoning changes and variances. This
figurewasobtainedbyapplyingtheratioofassessedvalueofcommercialandresidential

9
property in the study area to the unincorporated area against the revenue generatedby
theseactivitiesintheunincorporatedarea.
B. MethodologiesUtilizingRatiosofPopulationoftheStudyAreatotheUnincorporatedArea
Anumberofrevenuesourcesdependmoredirectlyuponthenumberofindividuals
engagingincertainbehaviorssuchasthepurchaseofinsurance,watchingcabletelevision,
owning a car, and committing traffic offenses. For these revenue sources, assumptions
weremadethatthesebehaviorsarefairlyconstantacrosstheunincorporatedpopulation
of DeKalb County, and thus the ratio of the population of the study area to the entire
unincorporated area was applied to the actual revenues. Table 4 gives the population
figuresforthestudyareaandunincorporatedDeKalbCounty.
Table4:2010PopulationfiguresforStudyAreaandUnincorporatedDeKalb
StudyArea UnincorporatedDeKalbCounty
PercentStudyAreato
Unincorporated
Population 82,205 511,619 16.07%
MedianHouseholdIncome
$44,715 $36,000
PovertyRate 15.5% 17.59%
PopulationfiguresforthestudyareaweresuppliedbytheGeorgiaGeneralAssemblyOfficeofCongressionalandLegislativeReapportionment;otherfiguresforpopulations,medianhouseholdincome,andpovertyratecamefromthe2010CensusandtheAmericanCommunitySurvey,2007‐2011estimatesutilizing2010BlocksandBlockgroupsthatapproximatedthestudyarea.
InsurancePremiumsTax
Insurancepremiumstaxesarecollectedonpolicieswrittenforbothpropertyandcasualty
and life insurancepoliciespurchasedby those insuredwithin the jurisdictionofacityor
unincorporated areas of a county. The figure given above is based on the ratio of the
populationofthestudyareatothepopulationoftheunincorporatedarea.

10
FinesandForfeitures
Traffic offenses and certain misdemeanor offenses may be adjudicated in county level
(recorders) and city level (municipal) courts, and fine revenue from these offenses is
retainedbythelocalgovernmentwithjurisdiction.Anassumptionwasmadethatratesof
pettyoffensesof thisnature takeplaceona fairlyconsistent levelacrossunincorporated
DeKalb,andthepopulationratiowasappliedto2012actualrevenue.
MotorVehicles
Motorvehiclesaresubjecttoanadvaloremtaxleviedontheirassessedvalue.Thefigure
aboveisderivedbyapplyingthepopulationratioandassumescarownershipisconsistent
acrosstheunincorporatedarea.Onagoing‐forwardbasis,thestudyareashouldexpectits
revenuefromthissourcetodecreasesignificantly.O.C.G.A.§48‐5C‐1(c)(3)providesfora
two‐stepdistributionofLocalTitleAdValoremTaxFee(“TAVT”)proceedsonamonthly
basis. Over time, as annual ad valorem taxes phase out, the first step distribution will
gradually increase, eventually comprising the majority of motor vehicle property taxes.
Underthestatutorystructure,citiesformedonorafterJanuary1,2013willnotreceivea
first‐stepdistribution.2
MotorvehiclespurchasedandtitledinGeorgiapriortoMarch1,2013aregenerallysubject
to annual ad valorem taxes pursuant to Chapter 5 of Title 48. Vehicles purchased on or
afterMarch1,2013aresubjecttoTAVTandareexemptfromannualadvaloremtax.Thus,
as Georgia taxpayers purchase newmotor vehicles, the annual ad valorem tax revenue
collectedwilldecreasegraduallyeachyear.3
ThefirststepdistributionofTAVTproceedsiscalculatedbycomparingthe2012annualad
valoremtaxescollectedinagivenmonthtotheamountcollectedinthesamemonthofthe
currentyear.Fora“newcity”whichcollectednoannualadvaloremtaxinagivenmonth
during2012,thereisnofigureorrecordavailableuponwhichtocomparesubsequentyear
annualadvaloremtaxrevenue.Thus,thereductionoffsetamountwillalwaysbezero,and
2GeorgiaDepartmentofRevenueTitleAdValoremTaxFeeLocalDistributionGuidance,October30,2013.3Id.

11
thefirststepdistributiontosuch“new”citywillalsobezero.4TheGeorgiaDepartmentof
RevenueTitleAdValoremTaxFeeLocalDistributionGuidanceletterisincludedinAppendix
E.
LawEnforcement‐ConfiscatedMoniesFund
This fund represents revenues received from money confiscated in drug cases. An
assumptionwasmadethatpoliceseizureofmoneyfromillegaldrugtraffickingwouldbe
proportionatetopopulation.
SaleofPrintedMaterial‐Police
Police departments are able to charge fees for copies of police reports, incident reports,
motorvehicleaccidentreportsandothermiscellaneousmaterials.Itisassumedthatthere
wouldbesomedemandforthesametypesofdocumentsfromamunicipality.
C. HomesteadOptionSalesTax(restrictedtocapital)
The Homestead Option Sales tax is a one cent countywide sales tax originally
enacted to provide for county property tax rollback that is levied on the sales of most
goods. The HOST tax has been amended over time to allow up to twenty percent of its
proceedstobespentoncapitalneedsandtoprovidethatnewlyincorporatedcitiesreceive
aportionof theproceeds fromthecountywide levy touse for theircapitalneeds.Avery
specificformulafoundinO.C.G.A.§48‐8‐104providesforthecalculationoftheamountto
bedistributedtoanewmunicipalitybasedonboththeleveloffundstobespentinagiven
year on capital as determined by the county and the relative size of the residential
homesteadrealpropertytaxdigestsoftheapplicablelocalgovernments.Theintentbehind
thestatutorychangesthatallowcitiesinDeKalbCountytoreceivedistributionsseemsto
reflectadesiretoequalizethebenefitof thetaxrollbacktomunicipaltaxpayersthatpay
property taxes tocities insteadof thecounty forcertainservices.Thus, the “equalization
payments” made to cities under the statute are proportional to the size of the city’s
residentialhomesteaddigest.
4Id.
12
Another variant in the HOST proceeds calculation is the capital factor set by the
county, which determines the amount of the overall proceeds that can be spent by the
county on capital needs. Using themost recent HOST certification from the DeKalb Tax
Commissioner to establish the total homestead digest for the county and each qualified
municipality,acalculationofthe2013HOSTproceedsamountwasappliedagainstacapital
factor of 20%. The homestead tax digest for the study areawas calculated based on tax
informationprovidedbytheDeKalbTaxCommissioner’sOffice.CVIOGcalculatedthetotal
amount of distributions likely due to all qualified municipalities to determine the total
amount of equalization payments. Appendix F contains these calculations using the
spreadsheetutilizedbytheGeorgiaDepartmentofRevenueaswellasthemostrecentcounty
certificationletter.
It should be noted that distributions are made from the previous year’s tax
collections,soanewcitywouldhavetowaittobegincollectingthisdistribution.
Itshouldfurtherbenotedthattheincorporationofanyothercitieswilldecreasethe
amountofHOSTproceedsreceivedbythestudyareacitybyvirtueoftheHOSTcalculation.
The HOST calculation distributes the capital outlay proceeds based on the equalization
calculations. In the event the amount of the capital outlay proceeds exceeds the
equalizationpaymentsduetoeachqualifiedmunicipality,theexcessisamountisdivided
upamongallthequalifiedmunicipalitiesbasedontheirshareofthehomesteaddigestto
the total digest. Thus, additional cities will decrease the amount each existing city is
receivingfromthisexcesscapitaloutlayamount.
Finally,thereisa“tipping”pointafterenoughnewterritoryisincorporatedwhere
the amount due to themunicipalities under the equalization calculationwill exceed the
amountofcapitaloutlayproceedsavailablefordistribution.Atthispoint,HOSTproceeds
willbeallocatedbasedsimplyontheratioofthenethomesteadofeachmunicipalitytothe
totalhomesteaddigest.

13
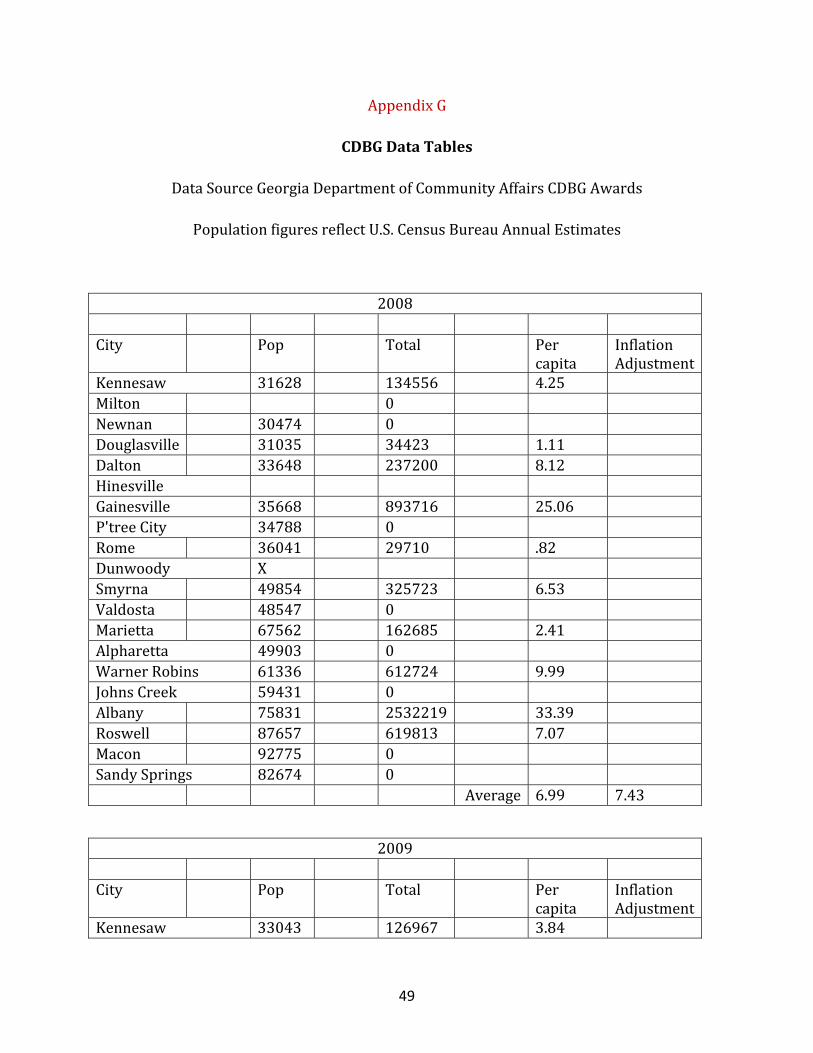
D. CommunityDevelopmentBlockGrant
CommunityDevelopmentBlockGrants(CDBG)areawardedbythefederalandstate
governmentstolocalgovernmentsmeetingcertaincriteria.Toobtainanestimateforwhat
acitycomprisedofthestudyareamightexpecttoreceivefromsuchgrants,fouryearsof
awardsfor19differentGeorgiacitiesranginginpopulationfromapproximately30,000to
96,000wereaveragedintoapercapitaamount,adjustedforinflationandappliedagainst
thepopulationofthestudyarea.ItisalsoworthyofnotethatDunwoodyhasnotreceived
any CDBG funds since their incorporation. The fact that Dunwoody is a new city likely
contributes to this fact. Smyrna,however,has receivedCDBG funds in recentyears.5The
datausedforthesecalculationsisshowninAppendixG.
E. FranchiseFees
Somerevenuesourcesareunique tomunicipal corporations inGeorgia.Franchise
fees are essentially rental compensation by a private utility company for use of a city’s
publicrights‐of‐way.Forestimatingtheelectric,naturalgas,cableandtelephonefranchise
fees,theauthorsutilizedaregressionmodelwithfranchisefeespaidto30citiesinGeorgia
in 2011 and 2 cities in 2010, which was the latest data available. The data was only
available as a total number for franchise fees, and not broken down by type.6 The
regressionoutputisshowninAppendixH.
FranchiseFees‐Cable
Federal and state lawallows cities and counties to enter into franchise agreementswith
cablecompaniestocompensatethelocalgovernmentfortheiruseofthepublicrights‐of‐
way.Thesefeesareusually5%oftherevenuederivedfromcabletelevisionservices.
5http://portal.hud.gov/hudportal/HUD?src=/program_offices/comm_planning/communitydevelopment/programs6GAPowerprovidedanestimatedfranchisefeeamountfromelectriconlyforthestudyareaof$3.30million.

14
FranchiseFees‐Electric
Franchise fees for electric utilities are the result of contracts between municipal
corporations and electric utility providers that occupy a city’s right‐of‐way. These
agreements typically provide that 4%of the gross sales of electric powerwithin a city’s
limitslesssalestaxesandfuelcostsbepaidannuallytothecitytocompensatethecityfor
useandoccupancyofpublicproperty.Thesoleelectricutilityproviderinthestudyareais
GeorgiaPower.PursuanttorecentrulingsbytheGeorgiaPublicServiceCommission,half
of the annual franchise feepaidbyGeorgiaPower tomunicipal corporations is collected
fromtheratebaseofallGeorgiaPowercustomersstatewide(asacostofdoingbusiness)
andtheotherhalf iscollectedasa feesolelyon theelectricbillsofcustomerswithin the
municipalitycollectingthefee.Thus,collectionoftheelectricfranchisefeewouldresultin
anincreaseoflessthan2%intheelectricbillsofcitycustomers.
FranchiseFee‐NaturalGas
AtlantaGasLightistheonlynaturalgasdistributionutilityoccupyingpublicrights‐of‐way
in the study area. Franchise fees paid tomunicipal corporations are paid out of the rate
baseofallAGLcustomersasacostofdoingbusiness.
FranchiseFees‐Phone
Since only landline telephone service requires occupancy of themunicipal right‐of‐way,
movement away from landline service to internet‐based and cell telephony services is
makingthisadiminishingrevenuesourceformunicipalcorporations.
F. RealPropertyTaxes
The figures givenhere represent the amountof realproperty taxesbeingpaidby
studyarearesidentstothecountyfortheservicesbeingprovidedthroughcountyspecial
service tax districts. The actual amount paid in Fiscal Year 2013 by the residents who
would actually live in the study areawasprovidedby theTaxCommissioner’s office. It
shouldbenotedthatbecausestatutorycountyhomesteadexemptionsandtheHomestead
Option Sales Tax credit must be applied to the taxable value of residential homestead

15
property to determine the amount of revenue generated by application of a particular
millagerateincountyspecialdistricts,thisspecificmillageratedoesnotdirectlyequateto
a municipal millage rate. In other words, the method utilized here demonstrates the
amount of property tax revenue being generated in the study area for the county that
wouldbecomeavailabletoamunicipalitythattookovertheprovisionofthosemunicipal
servicescurrentlybeingprovidedbythecounty if theamountofpropertytaxcollections
remainedconstantbutwasinsteadcollectedbyacity.
Recentstatutorychangeshaverequiredthatpoliceservicesbebrokenapartfromtheother
specialservices taxdistrictservicesandbilledasaseparate line item.7The2013millage
rateforthepoliceservicesthatwerepreviouslyincludedinthespecialservicestaxdistrict
is4.25millsandthemillageratefortheremainingunincorporatedspecialservicesis .71
mills. Together, these two millage rates equal 4.96 mills and represent services funded
fromthepreviousunincorporatedspecialtaxdistrict.
Penalties
Theratioofpenaltiestorealpropertytaxes intheunincorporatedareaforcalendaryear
2012wasappliedtothestudyareapropertytaxesprovidedbytheTaxCommissioner.
G. OtherActualsfromTaxCommissioner
StormWaterFee
DeKalbCountycollectsastormwaterutilityfeeinordertodefraythecostsassociatedwith
infrastructure to handle storm water runoff. The fees imposed are designed to be
proportionate to the amount of runoff created by impervious surfaces. The 2012 rates
charged by DeKalb County were $48 per single family residential dwelling annually.
Multipledwellingunitsareeachchargedhalfofthatrateannually,andallotherimproved
propertiesarechargedatarateof$48per3,000squarefeetofimpervioussurface.Asthe
amount of impervious surface in the study area is unknown at this time as well as the
actual collections from the study area, the population ratio was used here as a rough
7 SeeHB607,effectiveMay11,2011.

16
approximationofdevelopmentand,consequently, reflectiveof theamountof impervious
surface.Becausestormwaterutilitiesoperateasanenterprisefundandbecausethefees
collected must be used for storm water utility purposes, this figure was also used to
calculateexpenditures.
StreetLightsandSpeedBumps
StreetlightsandSpeedBumpprogramsalsooperateasenterprisefunds.Theactualsfor
thestudyareawereprovidedbytheTaxCommissionerandthesesamenumberswerealso
usedintheexpenditureanalysis.
II. Expenditures
Theexpenditureestimatesbelowarebasedprimarilyonexpendituresincurredby
comparablegovernmentstoprovideservicessimilartothosecontemplatedtobeprovided
byacitycomprisedofthestudyarea.Incalculatingtheseestimates,CVIOGfirstestablished
twoprimary comparable governments, the cities ofDunwoody and Smyrna. These cities
were selected based on several factors. Dunwoody is new, officially incorporated in
Decemberof2008,whileSmyrnaisanestablishedcity.Bothcitiesarelocatedinthemetro
Atlantaareaandarecloseinpopulationtothestudyarea.Dunwoody,likethestudyarea,is
whollycontainedinsidethelimitsofDeKalbCounty.Smyrna’spopulation,povertyrateand
medianhouseholdincomeareverysimilartothestudyarea,anditslocationinthemetro
Atlanta area makes it a good comparison city. Profile data for the study area and the
comparisoncitiesisgivenbelowinTable5.

17
Table5:2010DemographicProfileofStudyAreaandPrimaryComparisonCities
StudyArea Smyrna Dunwoody
Population 82,205 51,265 46,267
Race‐White 4.26% 46.6% 64.1%
Race‐Black 94.8% 31.6% 12.6%
Race‐Asian .56% 4.9% 11.1%
Race‐Other .38% 16.9% 12.2%
Hispanicethnicity* 2.65% 14.9% 10.3%
MedianIncome $43,715 $55,989 $74,411
Poverty% 15.5% 12.8% 10.4%
*Hispanic is recognized as an ethnicity rather than a race in Census Data. Persons indicating HispanicethnicityarealsocountedasbelongingtoaracialgroupbytheCensus.
PopulationfiguresforthestudyareaweresuppliedbytheGeorgiaGeneralAssemblyOfficeofCongressionalandLegislativeReapportionment;other figures forpopulationsandmedian incomeandpovertyratecamefromthe2010CensusandtheAmericanCommunitySurvey,2007‐2011estimatesutilizing2010BlocksandBlockgroupsthatapproximatedthestudyarea.
Formostofthecostestimatesgiven,thefigureswerederivedbyaveragingtheper
capitacostsofexpendituresmadebythetwocomparisoncitiesforboththefiscalyearsof
2011 and 2012. In some instances, it was not possible to allocate costs to one ormore
departmentsbecauseofthewayacityhadaggregateditscosts.Todeterminehowbestto
interpret the budget and other financial documents of each city, faculty from CVIOG
interviewedtheFinanceDirectorsofbothDunwoodyandSmyrna.Theexplanationforhow
eachestimatewasderivedisincludedbelow.Thesummaryoftheexpendituresisgivenin
Table6below.
Todetermineservicesonwhichtoestimateexpenditures,itwasassumedthatacity
comprised of the study area would provide the services currently provided to the
unincorporated area via the unincorporated special tax districts. This includes police,
parks,roadmaintenance,andstormwater. Itwasalsoassumedthatanewcitywouldbe
responsibleforplanningandzoning;butthatfireandrescue,E‐9‐1‐1,sanitation,andother
18
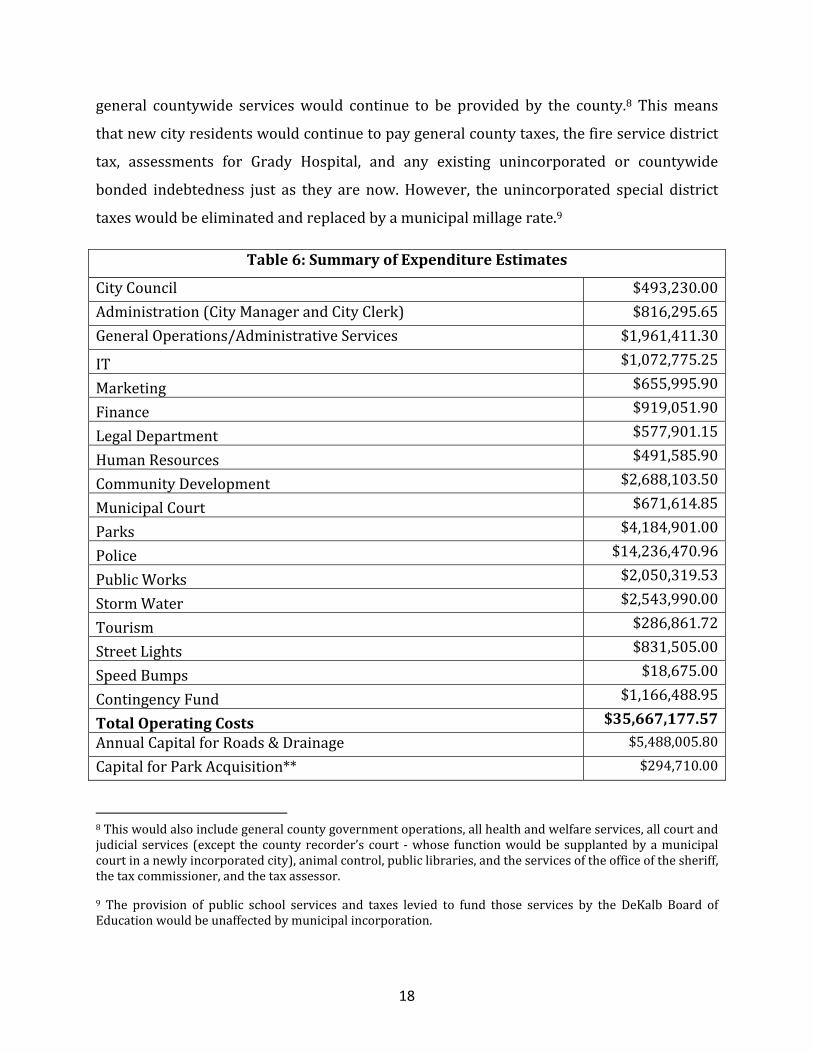
general countywide serviceswould continue to be provided by the county.8 Thismeans
thatnewcityresidentswouldcontinuetopaygeneralcountytaxes,thefireservicedistrict
tax, assessments for Grady Hospital, and any existing unincorporated or countywide
bonded indebtedness just as they are now.However, the unincorporated special district
taxeswouldbeeliminatedandreplacedbyamunicipalmillagerate.9
Table6:SummaryofExpenditureEstimates
CityCouncil $493,230.00
Administration(CityManagerandCityClerk) $816,295.65
GeneralOperations/AdministrativeServices $1,961,411.30
IT $1,072,775.25
Marketing $655,995.90
Finance $919,051.90
LegalDepartment $577,901.15
HumanResources $491,585.90
CommunityDevelopment $2,688,103.50
MunicipalCourt $671,614.85
Parks $4,184,901.00
Police $14,236,470.96
PublicWorks $2,050,319.53
StormWater $2,543,990.00
Tourism $286,861.72
StreetLights $831,505.00
SpeedBumps $18,675.00
ContingencyFund $1,166,488.95
TotalOperatingCosts $35,667,177.57
AnnualCapitalforRoads&Drainage $5,488,005.80
CapitalforParkAcquisition** $294,710.00
8Thiswouldalsoincludegeneralcountygovernmentoperations,allhealthandwelfareservices,allcourtandjudicial services (except thecounty recorder’s court ‐whose functionwouldbe supplantedbyamunicipalcourtinanewlyincorporatedcity),animalcontrol,publiclibraries,andtheservicesoftheofficeofthesheriff,thetaxcommissioner,andthetaxassessor.
9 The provision of public school services and taxes levied to fund those services by the DeKalb Board ofEducationwouldbeunaffectedbymunicipalincorporation.
19
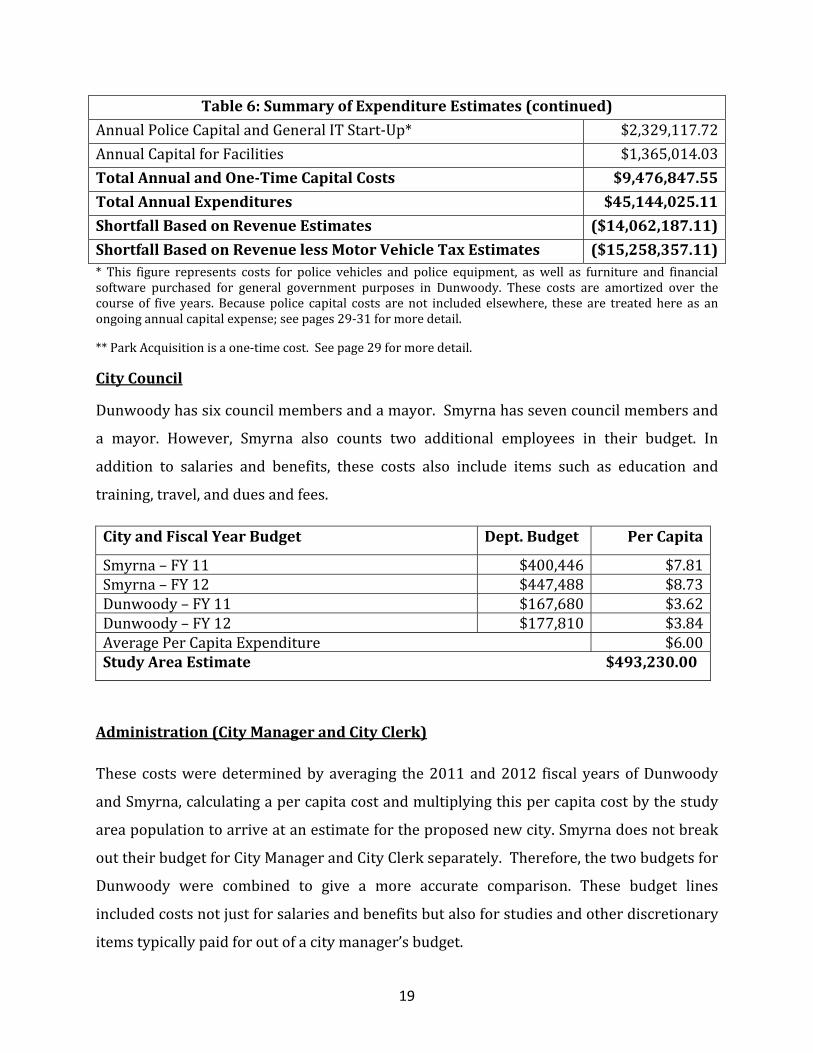
Table6:SummaryofExpenditureEstimates(continued)
AnnualPoliceCapitalandGeneralITStart‐Up* $2,329,117.72
AnnualCapitalforFacilities $1,365,014.03
TotalAnnualandOne‐TimeCapitalCosts $9,476,847.55
TotalAnnualExpenditures $45,144,025.11
ShortfallBasedonRevenueEstimates ($14,062,187.11)
ShortfallBasedonRevenuelessMotorVehicleTaxEstimates ($15,258,357.11)* This figure represents costs for police vehicles and police equipment, aswell as furniture and financialsoftware purchased for general government purposes in Dunwoody. These costs are amortized over thecourse of five years. Because police capital costs arenot included elsewhere, these are treated here as anongoingannualcapitalexpense;seepages29‐31formoredetail.
**ParkAcquisitionisaone‐timecost.Seepage29formoredetail.
CityCouncil
Dunwoodyhassixcouncilmembersandamayor.Smyrnahassevencouncilmembersand
a mayor. However, Smyrna also counts two additional employees in their budget. In
addition to salaries and benefits, these costs also include items such as education and
training,travel,andduesandfees.
CityandFiscalYearBudget Dept.Budget PerCapita
Smyrna–FY11 $400,446 $7.81Smyrna–FY12 $447,488 $8.73Dunwoody–FY11 $167,680 $3.62Dunwoody–FY12 $177,810 $3.84AveragePerCapitaExpenditure $6.00StudyAreaEstimate$493,230.00
Administration(CityManagerandCityClerk)
These costsweredeterminedbyaveraging the2011and2012 fiscal yearsofDunwoody
andSmyrna,calculatingapercapitacostandmultiplyingthispercapitacostbythestudy
areapopulationtoarriveatanestimatefortheproposednewcity.Smyrnadoesnotbreak
outtheirbudgetforCityManagerandCityClerkseparately.Therefore,thetwobudgetsfor
Dunwoody were combined to give a more accurate comparison. These budget lines
includedcostsnotjustforsalariesandbenefitsbutalsoforstudiesandotherdiscretionary
itemstypicallypaidforoutofacitymanager’sbudget.

20
CityandFiscalYearBudget Dept.Budget PerCapitaSmyrna–FY11 $550,967 $10.75Smyrna–FY12 $576,560 $11.25Dunwoody–FY11 $378,187 $8.17Dunwoody–FY12 $442,055 $9.55AveragePerCapitaExpenditure $9.93StudyAreaExpenditureEstimate$816,295.65
InformationTechnology
These costsweredeterminedbyaveraging the2011and2012 fiscal yearsofDunwoody
and Smyrna. First year expenses for IT can be expected to be higher than subsequent
years, thusadditionalcapital for ITstartup is included in theGeneralStart‐upportionof
capitalexpenditures,laterinthereport.
CityandFiscalYearBudget Dept.Budget PerCapitaSmyrna–FY11 $642,654 $12.54Smyrna–FY12 $586,151 $11.43Dunwoody–FY11 $743,696 $16.07Dunwoody–FY12 $561,731 $12.14AveragePerCapitaExpenditure $13.05StudyAreaExpenditureEstimate$1,072,775.25
Marketing
These costsweredeterminedbyaveraging the2011and2012 fiscal yearsofDunwoody
andSmyrna,calculatingapercapitacostandmultiplyingthispercapitacostbythestudy
areapopulationtoarriveatanestimatefortheproposednewcity.
CityandFiscalYearBudget Dept.Budget PerCapitaSmyrna–FY11 $531,266 $10.36Smyrna–FY12 $549,121 $10.71Dunwoody–FY11 $203,171 $4.39Dunwoody–FY12 $298,907 $6.46AveragePerCapitaExpenditure $7.98StudyAreaExpenditureEstimate$655,995.90

21
GeneralOperations/AdministrativeServices
This figure representsongoingoperational costs.Only the costs fromSmyrnawereused
duetothefactthatDunwoodydoesnotbreakoutthesecostsandtheyaresubsumedinthe
FinancebudgetforDunwoody.
CityandFiscalYearBudget Dept.Budget PerCapitaSmyrna–FY11 $1,062,156 $20.72Smyrna–FY12 $1,384,332 $27.00AveragePerCapitaExpenditure $23.86StudyAreaExpenditureEstimate$1,961,411.30
Finance
This figure represents all traditional finance functions: accounting, purchasing, contractadministration, risk management, accounting and payroll. Dunwoody was excludedbecausecostscouldnotbeclearlyallocatedtothedepartment.
LegalServices
This figure reflects the per capita average of two fiscal years from both Smyrna and
Dunwoody.Significantlitigationcouldcausethesecoststobehigher,howeverbothcities
experiencedsomelitigationcostsduringthetimeperiodusedtoestimatecosts.
CityandFiscalYearBudget Dept.Budget PerCapitaSmyrna–FY11 $212,510 $4.15Smyrna–FY12 $200,633 $3.91Dunwoody–FY11 $383,775 $8.29Dunwoody–FY12 $544,098 $11.76AveragePerCapitaExpenditure $7.03StudyAreaExpenditureEstimate$577,901.15
CityandFiscalYearBudget Dept.Budget PerCapitaSmyrna–FY11 $640,173 $12.49Smyrna–FY12 $506,611 $9.88AveragePerCapitaExpenditure $11.18StudyAreaExpenditureEstimate$919,051.90

22
HumanResources
This figure reflects the per capita average of two fiscal years from both Smyrna and
Dunwoody.WhiletheHumanResourcesexpensesareassignedtothefinancedepartment
inDunwoody’sbudget,thesecostswereabletobeidentified.
CityandFiscalYearBudget Dept.Budget PerCapitaSmyrna–FY11 $381,445 $7.44Smyrna–FY12 $358,549 $6.99Dunwoody–FY11 $219,306 $4.74Dunwoody‐FY12 $219,306 $4.74AveragePerCapitaExpenditure $5.98StudyAreaExpenditureEstimate$491,585.90
CommunityDevelopment
This figure includes costs for planning and zoning, building inspections, and code
enforcement.Itrepresentsanaverageoftwofiscalyearsforbothcitiesaveragedpercapita
andappliedtothestudyareapopulation.Dunwoodycontracts fortheseservicesoutand
theDunwoody figures include approximately $1.5million in labor costswhich is higher
thanthecostsacitywouldspendiftheykeptthesefunctionsin‐house,butgivesthemthe
flexibilityofbeingabletobringonpeopleandletthemgo,asneeded.
CityandFiscalYearBudget Dept.Budget PerCapitaSmyrna–FY11 $866,261 $16.90Smyrna–FY12 $970,429 $18.93Dunwoody–FY11 $2,099,419 $45.38Dunwoody–FY12 $2,295,250 $49.61AveragePerCapitaExpenditure $32.70StudyAreaExpenditureEstimate$2,688,103.50
MunicipalCourt
This figure represents costs for two fiscal years for each city averaged per capita and
applied to thestudyareapopulation.DunwoodyusesvolunteerBailiffs,generally retired
LawEnforcementOfficers,tohelpkeeptheircostslow.

23
CityandFiscalYearBudget Dept.Budget PerCapitaSmyrna–FY11 $513,566 $10.02Smyrna–FY12 $507,318 $9.90Dunwoody–FY11 $258,518 $5.59Dunwoody–FY12 $332,862 $7.19AveragePerCapitaExpenditure $8.17StudyAreaExpenditureEstimate$671,614.85
SubtotalofOverallAdministrativeCosts
Togiveanideaofthebudgetforoveralladministrativecostsforalltheabove‐mentioned
categories,asubtotalisprovided.ThesecostsincludethecostsinDunwoodywhichwere
notabletobeallocatedtoFinanceandGeneralOperations.
CityandFiscalYearBudget Dept.BudgetSmyrna–FY11 $7,030,319Smyrna–FY12 $7,313,997Dunwoody–FY11 $6,074,648Dunwoody–FY12 $7,550,795StudyAreaExpenditureEstimate$10,347,965.40
Parks
Inordertocalculateanexpenditureestimateforparkmaintenance,CVIOGcalculatedthe
peracreexpendituremadebythecomparisoncitiesandappliedthisamountto thepark
acreage in thestudyarea.Neitherof thecomparisoncitiesmaintainsa robust recreation
program, relying instead on non‐profits to serve this function, it was assumed a city
comprisedofthestudyareawouldoperatesimilarly.
The study area contains 19 parks that are currently located in unincorporated DeKalb
County. These parks, alongwith amenities, are listed in Table 7. Ten of these parks are
areas which consist primarily of unimproved land or whose only amenities are nature
trails.Thisincludesthe2,000+acreArabiaMountainParkinthesouthernpartofthestudy
area. It was assumed thatmaintenance and operating costs associatedwith passive use
parksarenegligible.Atotalof367acreswereassociatedwithimproved(i.e.non‐passive
use)parksandwereusedasabasisforcalculatingparkmaintenanceexpenses.
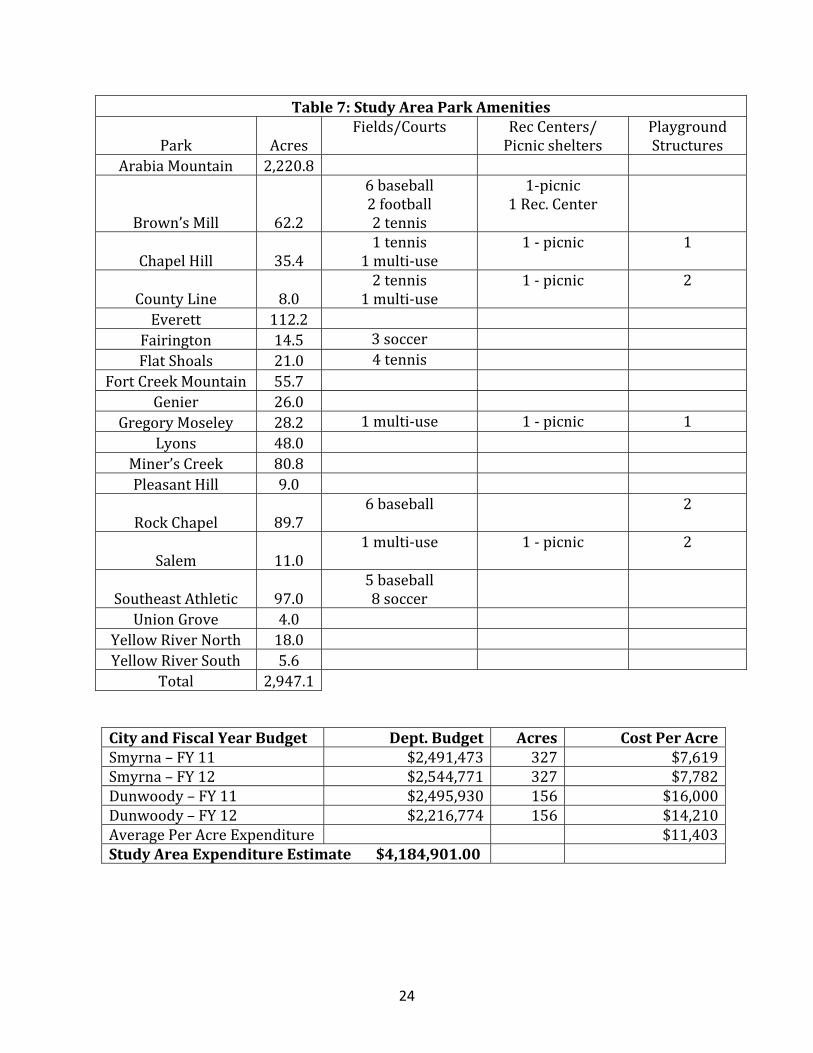
24
Table7:StudyAreaParkAmenities
Park AcresFields/Courts RecCenters/
PicnicsheltersPlaygroundStructures
ArabiaMountain 2,220.8
Brown’sMill 62.2
6baseball2football2tennis
1‐picnic1Rec.Center
ChapelHill 35.41tennis
1multi‐use1‐picnic 1
CountyLine 8.02tennis
1multi‐use1‐picnic 2
Everett 112.2 Fairington 14.5 3soccer FlatShoals 21.0 4tennis
FortCreekMountain 55.7 Genier 26.0
GregoryMoseley 28.2 1multi‐use 1‐picnic 1Lyons 48.0
Miner’sCreek 80.8 PleasantHill 9.0
RockChapel 89.76baseball
2
Salem 11.01multi‐use
1‐picnic 2
SoutheastAthletic 97.05baseball8soccer
UnionGrove 4.0 YellowRiverNorth 18.0 YellowRiverSouth 5.6
Total 2,947.1
CityandFiscalYearBudget Dept.Budget Acres CostPerAcreSmyrna–FY11 $2,491,473 327 $7,619Smyrna–FY12 $2,544,771 327 $7,782Dunwoody–FY11 $2,495,930 156 $16,000Dunwoody–FY12 $2,216,774 156 $14,210AveragePerAcreExpenditure $11,403StudyAreaExpenditureEstimate$4,184,901.00

25
Police
Given that police expenditures are such an important part of a city’s budget, the
expenditureswereanalyzedintwodifferentwaystogivethebestestimatepossible.
Inthefirstanalysis,policeoperationalexpendituresforthetwomostrecentfiscalyearsof
SmyrnaandDunwoodywereutilized. To calculate thenumberof officersneeded in the
studyarea,thenumberofofficerspercapitawascalculated.
City PopulationOfficers Personsper
OfficerSmyrna 51,265 91 563Dunwoody 46,267 46 1005
AveragePersonsperOfficer 785StudyArea 82,205 StudyAreaOfficers105
Then the average expense per officer was calculated for Smyrna and Dunwoody. This
averageexpenditurewasappliedtothecalculatednumberofofficersforthestudyareato
arriveatthetotaloperationalexpensesforPoliceinthestudyarea.
CityandFiscalYearBudget Dept.Budget Officers PerOfficerSmyrna–FY11 $8,146,213 91 $80,655.57Smyrna–FY12 $8,084,720 91 $80,046.73Dunwoody–FY11 $5,450,444 46 $118,487.91Dunwoody–FY12 $4,900,735 46 $106,537.72AveragePerOfficerExpenditure $96,431.98 StudyAreaExpenditureEstimate$10,125,357.90
No jail costs are included in this figure, as it was assumed that a new city would not
maintainitsownjailandthatitwouldenjoyasimilararrangementwiththeDeKalbCounty
SheriffasdoesDunwoody.InDunwoody,a10%fineadd‐oniscollectedoncasesthatgoto
municipal court and sent to the county to pay for housing needs for any municipal
prisoners. Municipal prisoners would only be those awaiting adjudication or serving a
sentenceimposedbythecity’smunicipalcourt.Itisworthyofnotethatwithinthesecosts,

26
Dunwoody contributes one person to a cooperative intergovernmental SWAT team, and
employsonefull‐timenarcoticsperson.10
As an alternative to this methodology, the Institute of Government faculty acquired a
datasetofE‐9‐1‐1callsforlawenforcementservicesincalendaryear2012fromtheE‐9‐1‐
1unit of theDeKalbCountyPoliceDepartment.Therewere573,457 calls for service. A
randomnumber generatorwas used to create a random sample of 2,418 addresses. Of
these,2,037weremappedandthenumberofthesewithinthestudyareaidentified.
TotalAnnualServiceCalls 573,547RandomSample 2037CallswithintheStudyArea 269PercentofsampleinStudyArea 13.21%EstimatedAnnualCallsinStudyArea 75,729
The InternationalAssociation of Chiefs of Police (IACP) estimates that, in the absenceof
actualcomplaintcounts,550complaintsorincidentswilloccurforevery1,000residents,
or.55perresident.Usingthisassumption,thestudyareawouldexperience45,213calls.
TotalPopulation 82,205CallsperResident 0.55EstimatedAnnualCallsinStudyArea 45,213
Based on information from the IACP, the national average of time per incident is
approximately45minutes.Further,theIACPindicatesthereisaPoliceActivityWeighting
Scalethatshouldbeappliedtothetimeestimatetoaccountforthetimeneededtohandle
callsinvolvingmoreseriouscrimes.Thus,thecallswereincreasedby25%toaccountfor
thisweighting.
Also,accordingtostudiesconductedbytheIACP,onethirdofanofficer’s timeshouldbe
spenthandlingcalls forservice,onethirdonpreventativepatrol,andtheotheronethird
usedasabuffertimeforaneffectiveandefficientpatrolforce.Inadditiontorespondingto
10 DeKalb Countymaintains use of a police helicopter and other specialized resources thatmight only beavailabletothecityonacostorintergovernmentalagreementbasisuponincorporation.

27
callsforservice,themethodologyalsoaccountsforthetimedemandplacedonofficersas
theyarrestandbookallegedsuspectswithgreaterweightgiventoarrestsformoreserious
crime.11
The number of hours necessary to staff one basic one‐officer patrol unit for one year is
2,920.Thisequatesto8hoursadayfor365days.Sincenooneworkseverysingleday,a
relieffactorwasusedaccountfordaysanofficerwouldbeunavailableduetothingssuch
asdaysoff,sickdays,vacationday,trainingdaysandcourtdays.Thisrelieffactoris1.84.
ItisbasedonareviewofpolicedepartmentpersonnelbenefitsconductedbytheIACP.
Finally, thenumberwas adjusted to account for lawenforcementofficers in supervisory
roles.Thisnumberofofficerswasmultipliedtheperofficerexpenditurescalculatedfrom
theactualsinSmyrnaandDunwoody.
TheWorkloadAnalysisyieldsanumberofofficersconsistentwiththenumberanticipated
usingtheratioofofficerstopopulationmethodologyabove.
WorkloadAnalysis
Analysisassuming.55
callsperResidentAnalysisbasedon
E‐9‐1‐1dataAnnualCalls 75,729 75,729Weightedformoretimeconsumingcalls 94,661 94,661Multipliedby.75ofanhour 47,331 70,996Multipliedby3toaccountfor1/3oftimespentoncalls 141,991.5 212,987.3Dividedby2920toconverttoOfficers 48.6 72.9Multipliedby1.84toaccountfordaysoff 89.5 134.2Inflatedby10%forsupervisors 98.4 147.6Multipliedby$96,431.98/officerStudyAreaExpenditureEstimate
$9,490,980.65 $14,236,470.96
*This figurewasderived froma series of intermediate calculationswhose inputswerenot roundedaftereachindividualstepandwillthereforedifferslightlyfromaresultbasedontheroundedfiguresshowninthetable.
To ensure that police expenditures were not underestimated, the amount of
$14,236,470.97wasusedintheanalysis.Thisisthelargestestimatedpoliceexpense,and
thereforethemostconservativeestimateofpoliceexpenditures.
11http://www.theiacp.org/LinkClick.aspx?fileticket=AKL78d4MBw8%3d&tabid=252

28
PublicWorks
Toestimatecostsforpublicworks,whichwouldprimarilyberoadandbridgerepairand
maintenance,weobtainedthenumberof localroad lanemileswithin thestudyareaand
forthecitiesofDunwoodyandSmyrnathroughuseofGISmappingtechnology.Fiscalyear
expenditures for2011and2012 forbothcitieswerecalculatedper lanemile12and then
averaged.Thatamountwasmultipliedagainstthenumberoflanemilesinthestudyarea.
Dunwoody
CityandFiscalYearBudget Dept.Budget LaneMiles CostperLaneMileSmyrna–FY11 $2,959,416 450 $6,576.48Smyrna–FY12 $2,902,315 450 $6,449.59Dunwoody–FY11 $2,055,155 272.80 $7,533.56Dunwoody–FY12 $1,048,009 272.80 $3,841.68AverageCostPerLaneMile $6,100.33NumberofLaneMilesinstudyarea 336.1StudyAreaExpenditureEstimate$2,050,319.53 StormWater,StreetLightsandSpeedBumps
Stormwaterutilities, street lights, andspeedbumpsareenterprise fundsdesigned tobe
fundedbyafeestructurethatapproximatestheircost.Thus,theestimatedrevenuefigure
for Storm Water, Street Lights, and Speed Bumps has been used as the estimated
expenditureamount.
Tourism
Becauseaportionofthehotel/moteltaxisdedicatedtobespentontourismbystatelaw,
manyjurisdictionstendtousethatportionofthetaxfortheirtourismbudget. Similarly,
theestimatedrevenuefigureforhotel/moteltaxesrestrictedtotourismhasbeenusedas
theestimatedexpenditureamount.
ContingencyFund
These are funds used by cities to cover unforeseen expenditures. Dunwoody has never
useditsContingencyFund.
12GDOTtotallanemileage,2009form499.(Thisassumesthatacitywouldmaintainall“county”roads.)

29
CityandFiscalYearBudget Dept.Budget PerCapitaSmyrna–FY11 $885,598 $17.27Smyrna–FY12 $750,000 $14.63Dunwoody–FY11 $575,000 $12.43Dunwoody–FY12 $575,000 $12.43AveragePerCapitaExpenditure $14.19StudyAreaExpenditureEstimate$1,166,488.95
AnnualCapitalforRoadsandDrainage
These costs represent the on‐going capital costs associated withmaintaining roads and
accompanying drainage; i.e., land, equipment, as well as repairs and alterations to fixed
works.Todetermine this figure, capitalexpenditures for roadsanddrainage reported to
the Georgia Department of Community Affairs by 19 cities ranging in population from
31,000 to 92,000 for 2007 ‐2011were averaged per capita. These numberswere then
adjusted for inflation to2013dollarvalues,andthepercapitaaverageof thosenumbers
wasthenappliedagainstthestudyarea’spopulation.SeeAppendixH.Thisfigureexcludes
costs for capital associatedwith services thatwill continue to bemaintained by DeKalb
Countygovernmentlikelibrariesandfirestations,aswellascapitalcostsassociatedwith
city functions assumed to be covered through operational costs. Capital needs for police
services were also excluded from this number as they are accounted for separately as
policecapital.
AnnualCapitalforParkAcquisition
Tothefigureforannualcapitalwasaddedthecostforanewlyincorporatedcitytoacquire
the parks fromDeKalb County as determined by the number of acres and the statutory
formula set forth inO.C.G.A. §36‐31‐11.1,which is$294,710.This statutewaspassed to
resolve an impasse between Dunwoody and DeKalb County, over the costs of park
acquisition,andbyvirtueofitswordingwouldapplyifthestudyareawereincorporated.13
13DCAdatadoesnotsegregatelandacquisitioncostsfromotherparks‐relatedcapitalcosts,consequentlyonlythestatutorily‐derivedparksacquisitioncostfigurewasused.

30
PoliceCapitalandGeneralStart‐Up
Thesecostsrepresentthoseassociatedwithequippingacitypolicedepartmentaswellas
some general non‐police specific city‐wide start‐up costs. Most of these represent costs
associatedwithbeginningtheoperationofapolicedepartmentduetothelargeamountof
equipmentandvehiclesneededtoprovidepoliceservices.Forpurposesofcalculatingthis
figure,itwasassumed,basedontherecentexperiencesofDunwoody,thatlease‐purchase
agreementswould be used to acquire the needed vehicles and equipment pursuant to a
five‐yearleaseataninterestrateof2.25%.14Toarriveatthesecosts,itwasassumedthat
therewouldbe148policeofficersinastudyareacitydepartment,basedontheworkload
analysismethodology.
ComparisonofResidentPopulationtoNumberofPoliceOfficers
Dunwoody Smyrna StudyArea
2010Population 46,267 51,265 82,205
No.ofPoliceOfficers 46 91 148
ResidentsperOfficer 1006 563 555
The total costs of equipping each Dunwoody officerwith a vehicle, computer, furniture,
radio, firearmandotherbasicequipmentwasdeterminedpercapitaandappliedagainst
thenumberofofficersassumedforthestudyareabasedontheWorkloadAnalysistoarrive
atatotalofficerpolicecapitalcostestimate.
14Theuseof2.25%interestratewasbasedondiscussionwiththeGeorgiaMunicipalAssociation.
Averagenumberofresidentsperofficer 784.5
No.ofofficersonapercapitabasis 105
No.ofofficersbasedonWorkloadAnalysis 98(lowest.)–148(highest.)
CityandFiscalYearBudget Budget CostPerOfficerDunwoody‐FY09PoliceStart‐up $2,674,000 $58,130
InflationAdjustedCostperOfficer $63,444NumberofOfficersAssumedforstudyarea=148x$63,444perofficerStudyAreaExpenditureEstimate $9,389,712.00

31
Inadditiontocapitalexpenditures forpolice,anewcitywould likely incursomegeneral
start‐up costs. Dunwoody’s start‐up costs included expenditures for furniture and
software.
CityandFiscalYearBudget Budget PerCapitaDunwoody‐FY09Non‐policeStart‐up $778,000 $16.82InflationAdjustedPerCapitaExpense $18.36StudyAreaExpenditureEstimate $1,502,283.80
Police capital costs andgeneral start‐up costs figuredper capita for the studyareawere
addedtogetherandassumedtobefinancedoverafiveyeartermonsimilartermstothose
usedbyDunwoodytofinancethesesameexpenses.
FacilityLeases
Itisassumedthatthestudyareawillleaseitsfacilities.Toestimatetheexpensethestudy
areawouldincurtoleasefacilityspace,theissuewasanalyzedacoupleofdifferentways.
Dunwoodyleasesthespacethathousestheircityhallandpolicedepartments.Theamount
ofleasedspacepercapitainDunwoodywasusedtocalculatethesquarefootageofleased
spacethatthestudyareacouldexpecttoneedtolease.
CityandFiscalYearBudget LeasedSpaceSq.Ft. PerCapitaSq.Ft.Dunwoody‐FY12 24,785 .54PopulationofStudyAreaStudyAreaEstimateofSquareFootageNeeded 44,391
PoliceCapitalStart‐UpEstimate $9,389,712.00
GeneralStart‐UpCostEstimate $1,509,283.80
TotalStart‐upCostEstimate $10,898,995.80
Amortizedover5yearsat2.25%interest $2,329,117.72

32
Information fromthe2012calendaryearactuals spenton leaseexpensesdividedby the
total leased space in Dunwoody yielded an expense per square foot. This was applied
againsttheestimatedamountofsquarefootageforthestudyarea.
CityandFiscalYearBudget Dept.Budget PerSq.Ft.Dunwoody‐CY12 $422,004 $17.03StudyAreaExpenditureEstimate $755,973.62
Alternatively,thenumberofemployeesinSmyrnawhowereemployedinsimilarfunctions
asthosethestudyareawouldrequire,wascalculatedonapercapitabasis.Thiswasthen
appliedtothepopulationofthestudyareatodeterminethenumberofemployeesneeded
inacitythesizeofthestudyarea.Theamountofsquarefootageperemployeewasthen
calculated.Thiswasdoneforboth125squarefeetperemployeeand225squarefeetper
employee. A surveyof theasking rent for lease space in the studyarea showeda range
withmanyoftheavailableofficebuildingsrunningbetween$14and$18persquarefoot
peryear.
FacilityLeasesNo.ofemployeespercapita .0041Studyareapopulation 82,205Employeesneeded [email protected]./employee 42,[email protected]./employee 75,834
Squarefootage Pricepersq.ft. TotalLeaseExpenseLowend: 42,130 $14.00/sq.ft. $589,821Highend: 75,834 $18.00/sq.ft. $1,365,014.03
Thesummaryanalysisusesthemostexpensiveleaseestimateinordertobeconservative.
Thisnumberwouldincludeallmaintenancecosts,giventhatitisveryconservative.

Appendix A
33

34
AppendixB
MiscellaneousRevenues
The following table provides greater detail for the revenue sources which
individuallyarefairlysmall.
RevenueSource
Methodology StudyAreaEstimate
DataSource
UtilityTaxes
Ratioofassessedvalueofutilitypropertyinstudyareatounincorporatedarea
$0.00
DeKalbRevenueReportbyFundyearthrough
December2012(Unincorporated)
HeavyEquipmentTaxes
Ratioofassessedvalueofindustrialpropertyinstudy
areatoDeKalbunincorporatedarea $43.13
DeKalbRevenueReportbyFundyearthrough
December2012(Unincorporated)
FingerprintingFees
RatioofpopulationinstudyareatoDeKalbunincorporated
area$2,656.87
DeKalbRevenueReportbyFundyearthrough
December2012(Unincorporated)
CopyingFees
RatioofpopulationinstudyareatoentireCounty
$240.91
DeKalbRevenueReportbyFundyearthrough
December2012(Unincorporated)
MotorVehicles–Penalties
Ratioofpenaltiespaidforpropertytaxestoproperty
taxespaidinstudyareatimestotalmotorvehiclestaxes $19,138.72
DeKalbTaxCommissioner
QualifyingFees
3%ofgrossannualsalary/electedofficial
$14,796.90
PursuanttoO.C.G.A.§21‐2‐131
InvestmentIncome
RatioofPopulationinstudyareatounincorporatedarea
$0.00
DeKalbRevenueReportbyFundyearthrough
December2012(Unincorporated)
TotalMiscellaneous $36,876.52

35
UtilityTaxes
Propertyownedbypublicutilitiesisassessedbythestateandalocalmillagerateisapplied
tothatassessment.
HeavyEquipmentTaxes
Taxesareassessedoncertainheavyequipmenttypicallyusedinindustrialenvironments.
Anassumptionwasmadethattheassessedvalueofindustrialpropertyservesasaproxy
for thepresenceof suchequipment.Theratioofassessedvalueof industrialproperty to
the assessed value of industrial property in the unincorporated areawas applied to the
revenuegeneratedfromheavyequipmenttaxesintheunincorporatedarea.
FingerprintingFees
This figurerepresentsrevenuederived fromfeescharged formaking fingerprint sets for
licenseapplicants to those requesting themforprofessional licenseapplicationsorother
reasons.Theratioofpopulationofthestudyareatotheunincorporatedareawasusedto
determinethisamount.
CopyingFees
Governments are allowed to charge small fees per page for copies of documents. Itwas
assumedthataproportionateamountofrequestswouldbemadeofacitycomprisedofthe
studyarea.Here,theavailabledataforcopyingfeesrepresentedfeescollectedonacounty‐
widebasis,sotheratioofpopulationofthestudyareatotheentirecountypopulationwas
used.
MotorVehicles–Penalties
Thisfigurewasobtainedbyapplyingtheratioofpenaltiespaidforrealpropertytaxesto
realproperty taxespaid in thestudyarea times theanticipatedamountofmotorvehicle
taxes. An assumption was made that the ratio of taxpayers that incurred penalties for
failuretotimelypayrealpropertytaxeswouldbethesameformotorvehicletaxes.

36
QualifyingFees
Statelaw,O.C.G.A.§21‐2‐131providesthatmunicipalitiescollectqualifyingfeesforthose
seeking elected office at a rate of 3% of gross annual salary for the elected office being
sought. C4ND asked for an assumption to bemade that this figure be calculated for one
mayorandsixcouncilmembers.Thus,thisfigurewasobtainedbyaveragingthesalariesof
theelectedofficialsinDunwoodyandSmyrna(eachofwhichhavesixcouncilmembersand
onemayor)andthenmultiplyingthataveragedamountbythreepercent.
InvestmentIncome
Normally local governments are able to derive some revenue from interest obtained on
investmentsof fundstypicallymadefor limitedperiodsoftime.Astherewasnorevenue
fromsuch investments in the2012actual revenuedata fromDeKalbCounty,wedidnot
estimateafigure.

37
AppendixC
2012UnincorporatedCountyRevenueFiguresandDataSources
RevenueSource UnincorporatedCounty
RevenueFigure
DataSource
OccupationTaxes 15,207,787 ActualsforCY2012
BeverageExciseTaxes
4,046,370 DeKalbRevenueReportbyFundyearthroughDecember2012
PersonalPropertyTaxes
3,927,373 DeKalbRevenueReportbyFundyearthroughDecember2012
Hotel/MotelTax/
2,788,067 DeKalb2012BudgetBook
Hotel/MotelTax(restricted)
1,858,712 DeKalb2012BudgetBook
BusinessLicense‐Police
1,048,746 DeKalbRevenueReportbyFundyearthroughDecember2012
BusinessLicense‐Beverages
1,266,125 DeKalbRevenueReportbyFundyearthroughDecember2012
BankSharesTax
820,676 DeKalbRevenueReportbyFundyearthroughDecember2012
Intangible
787,909 DeKalbRevenueReportbyFundyearthroughDecember2012
DevelopmentFund4,671,149 DeKalb2012BudgetBook
RevenuefromPermitFees
ZoningandVarianceFeesandPermits
101,751 DeKalbRevenueReportbyFundyearthroughDecember2012
InsurancePremiums
25,059,141 DeKalbRevenueReportbyFundyearthroughDecember2012
Fines&Forfeitures
22,567,688 DeKalbRevenueReportbyFundyearthroughDecember2012
MotorVehicles
7,444,602 DeKalbRevenueReportbyFundyearthroughDecember2012

38
RevenueSource UnincorporatedCounty
RevenueFigure
DataSource
LawEnforcement‐ConfiscatedMoniesFund
1,749,092 DeKalb2012BudgetBook
SaleofPrintedMaterial‐Police
273,440 DeKalbRevenueReportbyFundyearthroughDecember2012

39
AppendixD
HotelsintheStudyArea
1. Microtel Inn and Suites by Wyndham
2980 Evans Mill Rd. Lithonia, GA 30058
2. Fairfield Inns and Suites – Atlanta East
7850 Stonecrest Square Lithonia, GA 30038
3. Hyatt Place – Atlanta East
7900 Mall Ring Road Lithonia, GA 30038
4. Hilton Garden Inn
7890 Mall Ring Road Lithonia, Georgia 30038
5. Economy Lodge
6707 Milwood Lane Lithonia Georgia, 30038
6. Red Roof Inn – Lithonia
5400 Fairington Road Lithonia, GA 30038
7. Super 8 Motel – Decatur
5354 Snapfinger Park Drive Decatur, Georgia 30035
8. Quality Inn and Suites – Decatur
5300 Snapfinger Park Drive Decatur, Georgia 30035
9. Holiday Inn Express and Suites
7846 Stonecrest Square Lithonia, Georgia 3038

Georgia Department of Revenue
Title Ad Valorem Tax Fee
Local Distribution Guidance
October 30, 2013
Summary
Georgia code section 48-5C-1(c)(3) provides for a two-step distribution of Local Title Ad Valorem
Tax Fee (“TAVT”) proceeds on a monthly basis. Over time, as annual ad valorem taxes phase out,
the first step distribution will gradually increase, eventually comprising the majority of motor vehicle
property taxes.
Under the statutory structure, cities formed on or after January 1, 2013 will not receive a first step
distribution. Further, cities formed during 2012 will not receive first step distributions for months
during which no annual ad valorem tax was collected by such cities in 2012.
Shift from Annual Ad Valorem Tax to TAVT
Motor vehicles purchased and titled in Georgia prior to March 1, 2013 are generally subject to annual
ad valorem taxes pursuant to Chapter 5 of Title 48.1 Vehicles purchased on or after March 1, 2013 are
subject to TAVT and are exempt from annual ad valorem tax. Thus, as Georgia taxpayers purchase
new motor vehicles, the annual ad valorem tax revenue collected will decrease gradually each year.
Collection of Annual Ad Valorem Tax and Distribution of TAVT
In the initial years of TAVT, a significant percentage of motor vehicle tax revenue will still derive
from annual ad valorem taxes. Accordingly, it is important to note that both taxes are in effect and
funding local governments at this time. But, because people trade-in or otherwise dispose of their
“annual ad valorem tax vehicles” in exchange for a “TAVT vehicle,” the total amount of annual ad
valorem tax collected by counties and cities will steadily decrease each year.
The first step distribution of TAVT proceeds, distributed on a monthly basis, is designed to offset the
reduction in annual ad valorem taxes collected in subsequent years. This reduction offset amount is
calculated by comparing the 2012 annual ad valorem taxes collected in a given month to the amount
collected in the same month of the current year.2 In other words, the first step distribution is designed
to ensure that a city (or county) is made whole as to the annual ad valorem tax it collected in 2012.
The first step distribution, referred to above as the “reduction offset amount,” is made to four
subcategories within a jurisdiction: (1) the county governing authority, (2) the cities, (3) the county
1 Vehicles purchased between January 1, 2012 and February 28, 2013 are eligible to “opt-in,” in which case those
vehicles are exempt from annual ad valorem tax. O.C.G.A. § 48-5C-1(b)(1)(A). 2 O.C.G.A. § 48-5C-1(c)(3)(A)
Appendix E
40

Page 2 of 2
board of education, and (4) the independent school districts (“Distributees”).3 The second and fourth
distributee categories could have multiple distribution sources because more than one city or
independent school district may exist within a particular county.
The Issue
For a “new” city which collected no annual ad valorem tax in a given month during 2012, there is no
figure or record available upon which to compare subsequent year annual ad valorem tax revenue.
Thus, the reduction offset amount will always be zero, and the first step distribution to such “new” city
will also be zero.
This issue could also affect a city formed during 2012. For example, a city formed in July of 2012
would not have a record of annual ad valorem taxes collected in January through June of 2012. Thus,
no reduction offset amount could be determined for January through June of subsequent years, and
such city would not receive a first step distribution of local TAVT proceeds in those months of future
years.
First Step Distribution Shortfall4
Compounding this issue is the circumstance where the TAVT proceeds available in a current month
are insufficient to fully offset the reduction in annual ad valorem tax proceeds made to the eligible
distributees during the first step distribution.
In this case, a pro rata allocation is made to the eligible distributees. The remaining deficit from the
first step distribution is carried over to the next month. In that next month, the TAVT proceeds are
first used to satisfy the prior month deficit. Only after satisfying the prior month deficit is the next
month’s first step distribution made. Accordingly, in the case of a first step distribution shortfall,
cities formed after January 1, 2013 will not receive any TAVT revenue for that month.
The Second Step Distribution5
The second step distribution is made only if local TAVT proceeds remain after making the first step
distribution. All distributees would be eligible to receive funds, if any remain, in the second step
distribution. The distribution methodology for the second step distribution is set by statute.6
Conclusion
Under the statutory structure of O.C.G.A. § 48-5C-1(c)(3)(A), cities formed on or after January 1,
2013 will not receive a first step distribution. Further, cities formed during 2012 will not receive first
step distributions for months during which no annual ad valorem tax was collected by such cities in
2012.
3 O.C.G.A. § 48-5C-1(c)(3)(A)
4 Id.
5 O.C.G.A. § 48-5C-1(c)(3)(B)
6 See Id.
41

Appendix F HOST Calculations and County Certification Letter
42

43
44

45

46

47

Example from 48-8-104(2) For illustration purposes, a hypothetical example of the (3) In the event the total amount payable in a calendar year to all existing municipalitiescalculation of the equalization amount is provided below. Calculated using Dekalb/Dunwoody as certified by the county pursuant to subparagraph (d)(2)(B) of this Code section plus
Example Example data Actual Calculation the total equalization amount payable to all qualified municipalities in the special district First, calculate the exceeds the capital outlay proceeds calculated based on a maximum capital factor of 0.200, homestead factor in the commissioner shall pay to the governing authority of each qualified municipality a shareaccordance with division of such proceeds calculated as follows:(c)(2)(B)(i) of this Code Amount from county certification letter (A) above plus Equalization amount (J) from left 11,791,776.99$ section as follows: Does this amount exceed Capital outlay proceeds (A) below? NO(A) Capital factor 0.150 0.150 0.200 If yes, continue calculation below. If no, go to (5) belowcertified by county asrequired by subsection (d) (A) Determine the capital outlay proceeds based on a maximum capital factor of 0.200;of this Code section Capital outlay proceeds = Capital factor (A) times Net Sales & Use tax (B) from left 21,661,937.98$ (B) Net amount of sales and $50 million 50,000,000.00$ 108,309,689.91$ (B) Subtract the amount certified by the county as payable to existing municipalities pursuantuse tax collected in the to subparagraph (d)(2)(B) of this Code section;special district pursuant Amount from county certification letter: $0.00to this article for the (C) The remaining amount equals the portion of the capital outlay proceeds that may be usedprevious calendar year (2009) by the commissioner to pay equalization amounts to qualified municipalities. (C) Taxes levied for county $100 million 100,000,000.00$ 140,597,734.89$ Total: 21,661,937.98$ purposes on only that The commissioner shall calculate each qualified municipality's share of such remaining amountportion of the county tax by dividing the net homestead digest for each qualified municipality by the total homesteaddigest that represents net digest for all municipalities.assessments on qualified Net Homestead Digest for municipality from Certification letter: 482,567,151.00$ homestead property after Total Homestead Digest for all municipalities: 7,681,520,997.00$ all other homestead Divide Net Homestead Digest by Total Homestead Digest: 6%exemptions have been applied(D) Calculation of 0.425 0.425 0.616 Total (C) above times calculated percentage above 1,360,842.43$ homestead factor usingfigures above = [(1-0.150)($50 (4) In the event the incorporated county millage rate for a qualified municipality is greater than million/$100 million)] the unincorporated county millage rate, no payment shall be due from the governing authorityNext, calculate the 15.0 mills of the qualified municipality to the governing authority of the county.equalization amount inaccordance with paragraph (1) of this subsection as follows: (5) In the event the amount of capital outlay proceeds exceeds the sum of the equalization (E) Unincorporated county 15.0 mills 15.00 19.29 mills amounts due all qualified municipalities plus the total amount certified under subparagraph (d)(2)(B)millage rate of this Code section as due all existing municipalities, the commissioner shall distribute to each (F)Minus the incorporated Difference: (10.0 mills) (10.00) (14.33) mills qualified municipality a portion of such excess equal to the net homestead digest for such county millage rate for municipality divided by the total homestead digest.qualified municipality "Y" Capital outlay proceeds = Capital factor (A) times Net Sales & Use tax (B) from left 21,661,937.98$ Difference: = 5.0 mills 5.00 4.96 mills Amount from county certification letter (A) above plus Equalization amount (J) from left 11,791,776.99$ (G) Times homestead factor x .425 0.425 x 0.616 Does amount of Capital outlay proceeds exceed amount from (3) above? YES(calculated above) If yes, continue calculation below. If no, go back to (3) above(H) Equals the equalization = 2.125 2.125 3.057 millsmillage: Amount of excess = Capital outlay proceeds minus amount from (3) above 9,870,160.99$ (I) Times net homestead $200 million 200,000,000.00$ 482,567,151.00$ digest for qualified Net Homestead Digest for municipality from Certification letter: 482,567,151.00$ municipality "Y" Total Homestead Digest for county: 7,681,520,997.00$ (J) Equals the equalization $425,000 $425,000.00 1,475,089.62$ Divide Net Homestead Digest by Total Homestead Digest: 6%amount payable to municipality "Y" Total (C) above times calculated percentage above 620,061.50$
6 equal payments of (J) above: 245,848.27$
48
49
AppendixG
CDBGDataTables
DataSourceGeorgiaDepartmentofCommunityAffairsCDBGAwards
PopulationfiguresreflectU.S.CensusBureauAnnualEstimates
2008 City Pop Total Per
capitaInflationAdjustment
Kennesaw 31628 134556 4.25 Milton 0 Newnan 30474 0 Douglasville 31035 34423 1.11 Dalton 33648 237200 8.12 Hinesville Gainesville 35668 893716 25.06 P'treeCity 34788 0 Rome 36041 29710 .82 Dunwoody X Smyrna 49854 325723 6.53 Valdosta 48547 0 Marietta 67562 162685 2.41 Alpharetta 49903 0 WarnerRobins 61336 612724 9.99 JohnsCreek 59431 0 Albany 75831 2532219 33.39 Roswell 87657 619813 7.07 Macon 92775 0 SandySprings 82674 0 Average 6.99 7.43
2009 City Pop Total Per
capitaInflationAdjustment
Kennesaw 33043 126967 3.84

50
Milton Newnan 31587 0 Douglasville 31534 2125 0.07 Dalton 33604 560721 16.69 Hinesville 30705 552306 17.99 Gainesville 35750 207692 5.81 P'treeCity 34784 0 Rome 36031 3900 0.11 Dunwoody 40746 0 Smyrna 50712 670401 13.22 Valdosta 52087 0 Marietta 66953 172303 2.57 Alpharetta 51569 0 WarnerRobins 62500 532237 8.52 JohnsCreek 61794 0 Albany 75616 1013228 13.40 Roswell 87719 1312718 14.97 Macon 92582 0 SandySprings 85625 0 Average 5.18 5.53
2010 City Pop Total Per
capitaInflationAdjustment
Kennesaw 29783 163254 5.48 Milton Newnan 33039 1827754 55.32 Douglasville 30961 0 Dalton Hinesville 33437 976607 29.21 Gainesville P'treeCity 34364 0 Rome 36303 90682 2.50 Dunwoody Smyrna 51271 41242 0.80 Valdosta 54518 0 Marietta 56579 166584 2.94 Alpharetta 57551 0 WarnerRobins 66588 545839 8.20 JohnsCreek 76728 0

51
Albany Roswell 88346 418326 4.74 Macon 91351 4496117 49.22 SandySprings 93853 516114 5.50 Average 11.07 11.63
2011 City Pop Total Per
capitaInflationAdjustment
Kennesaw 30196 139289 4.61 Milton 33711 0 Newnan 33725 176453 5.23 Douglasville 31173 0 Dalton 33313 172275 5.17 Hinesville 34519 406749 11.78 Gainesville P'treeCity 34757 0 Rome 36181 171452 4.74 Dunwoody 46809 0 Smyrna 51982 162197 3.12 Valdosta 56019 0 Marietta Alpharetta 59397 0 WarnerRobins 68500 444389 6.49 JohnsCreek 79192 0 Albany 77683 1617404 20.82 Roswell 91168 1354932 14.86 Macon SandySprings 96856 601319 6.21 Average 5.86 5.98
7.64 4yearinflationadjustedpercapitaaverage
82,205 Studyareapop
$628,868
Total

52
AppendixH
Theregressionmodelwiththehighestexplanatorypowerexpressedfranchisefees
as a function of population, assessed value of commercial property, and had dummy
variables forAugusta, Savannah,Athens‐ClarkeCountyand citieswith apopulationover
100,000.TheadjustedR2forthismodelwas.9979.
RegressionOutput
IndependentVariable
Coefficient Std.Error
t P>t 95%Conf.Interval
Population 56.18269 5.464327 10.28 0.000 44.9287 67.43668
AssessedValueofCommercialProperty
.0026597 .000738 3.60 0.001 .0011397 .0041796
Populationover100,000
3.27e+07 2573598 12.72 0.000 2.74e+07 3.80e+07
Augustadummy
‐2.43e+07 2728944 ‐8.89 0.000 ‐2.99e+07 ‐1.87e+07
Savannahdummy
‐2.99e+07 2356641 ‐12.69 0.000 ‐3.48e+07 ‐2.51e+07
Athens‐ClarkeCountydummy
‐3.24e+07 2628345 ‐12.35 0.000 ‐3.79e+07 ‐2.70e+07

53
AppendixI
CapitalDataTables
DataSourceGeorgiaDepartmentofCommunityAffairsCapitalExpendituresforRoadsandDrainage
PopulationfiguresreflectU.S.CensusBureauAnnualEstimates
2007
CityPopulation TotalCapital
ExpenditureRoadsandDrainage
PerCapita InflationAdjustment
Albany 75,335 2723749 $36.16
Alpharetta 43,424 4410245 $101.56
Dalton 33,045 2029728 $61.42
EastPoint 42,204 ‐
Gainesville 33,340 3046066 $91.36
Hinesville 29,554 925428 $31.31
Kennesaw 30,936 253717 $8.20
Macon 93,665 15834 $0.17
Marietta 63,152 2539413 $40.21
Newnan 27,097 2021645 $74.61
PeachtreeCity 34,947 2088139 $59.75
Rome 36,142 1374409 $38.03
Roswell 87,802 5137685 $58.51
SandySprings n/a
Smyrna 48,632 0 $32.65
Valdosta 45,529 6918913 $151.97
WarnerRobins
58,672 861674 $14.69
Average $54.85 $61.93

54
2008
CityPopulation TotalCapital
ExpenditureRoadsandDrainage
PerCapita InflationAdjustment
Albany 75,831 0 0.00
Alpharetta 49,903 9024719 180.85
Dalton 33,648 2506663 74.50
EastPoint n/a 0
Gainesville 35,668 1448710 40.62
Hinesville 30,152 3140207 104.15
JohnsCreek 59,431 644308 10.84
Kennesaw 31,628 1374613 43.46
Macon 92,775 21789 0.23
Marietta 67,562 9499310 140.60
Newnan 30,474 4173037 136.94
PeachtreeCity 34,788 2804081 80.60
Rome 36,041 1359458 37.72
Roswell 87,657 4576188 52.21
SandySprings 82,674 980605 11.86
Smyrna 49,854 4476810 89.80
Valdosta 48,547 2140753 44.10
WarnerRobins
61,336 698120 11.38
Average 62.34 67.80

55
2009
CityPopulation TotalCapital
ExpenditureRoadsandDrainage
PerCapita InflationAdjustment
Albany 75,616 ‐ ‐
Alpharetta 51,569 5,853,011 113.50
Dalton 33,604 33,094 0.98
Dunwoody 46,267 34,414 0.74
Gainesville 35,750 754,364 21.10
Hinesville 30,704 3,129,069 101.91
JohnsCreek 61,794 1,354,189 21.91
Kennesaw 33,043 1,487,746 45.02
Macon 92,582 11,733 0.13
Marietta 66,953 12,416,732 185.45
Newnan 31,587 2,713,253 85.90
PeachtreeCity 34,784 907,495 26.09
Rome 36,031 1,715,716 47.62
Roswell 87,719 7,679,000 87.54
SandySprings 85,625 6,830,530 79.77
Smyrna 50,712 5,433,151 107.14
Valdosta 52,169 2,846,670 54.57
WarnerRobins 62,026 3,763,862
60.68
Average 57.78 63.06
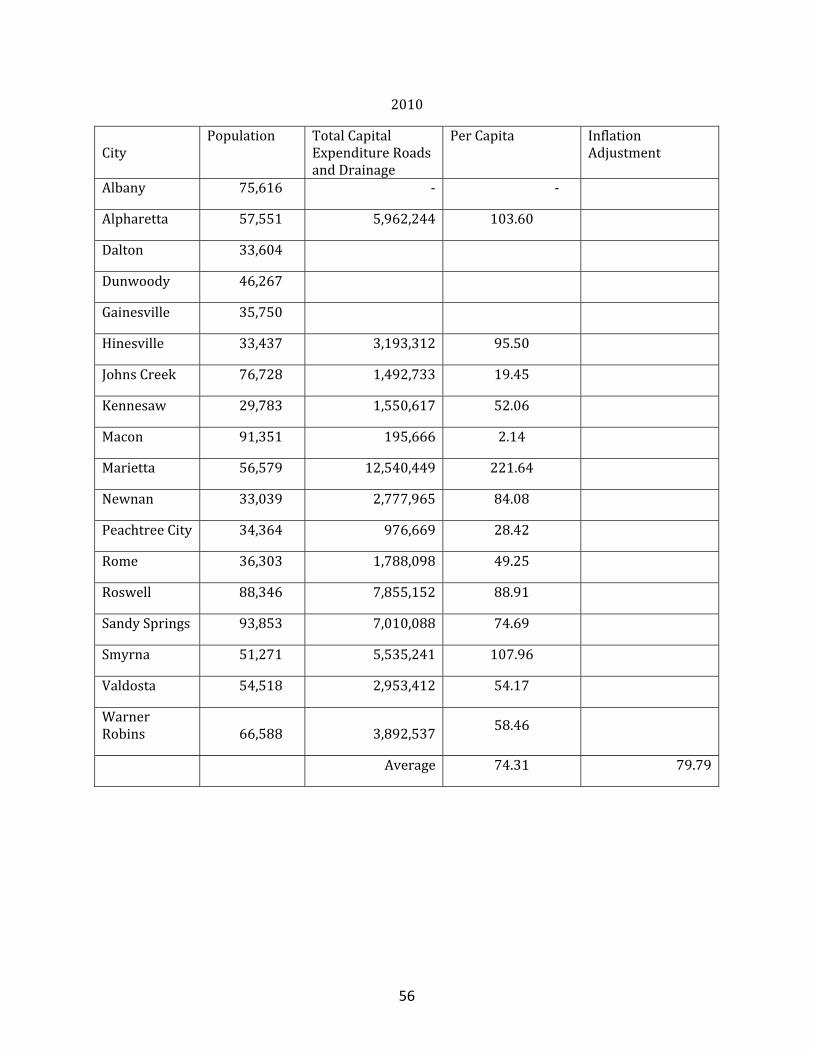
56
2010
CityPopulation TotalCapital
ExpenditureRoadsandDrainage
PerCapita InflationAdjustment
Albany 75,616 ‐ ‐
Alpharetta 57,551 5,962,244 103.60
Dalton 33,604
Dunwoody 46,267
Gainesville 35,750
Hinesville 33,437 3,193,312 95.50
JohnsCreek 76,728 1,492,733 19.45
Kennesaw 29,783 1,550,617 52.06
Macon 91,351 195,666 2.14
Marietta 56,579 12,540,449 221.64
Newnan 33,039 2,777,965 84.08
PeachtreeCity 34,364 976,669 28.42
Rome 36,303 1,788,098 49.25
Roswell 88,346 7,855,152 88.91
SandySprings 93,853 7,010,088 74.69
Smyrna 51,271 5,535,241 107.96
Valdosta 54,518 2,953,412 54.17
WarnerRobins 66,588 3,892,537
58.46
Average 74.31 79.79

57
2011
CityPopulation TotalCapital
ExpenditureRoadsandDrainage
PerCapita InflationAdjustment
Albany 77,683
Alpharetta 59,397 5,585,193 94.03
Dalton 33,313 574,340 17.24
Dunwoody 46,267
Gainesville 35,750
Hinesville 34,519 1,591,422 46.10
JohnsCreek 79,192 2,869,801 36.24
Kennesaw 30,196 1,820,836 60.30
Macon 92,582
Marietta 66,953
Newnan 33,725 1,832,105 54.32
PeachtreeCity 34,757 467,809 13.46
Rome 36,181 3,588,908 99.19
Roswell 91,168 3,943,918 43.26
SandySprings 96,856 14,540,757 150.13
Smyrna 51,982 3,863,429 74.32
Valdosta 56,019 2,064,732 36.86
WarnerRobins 68,500 1,471,776
21.49
Average 53.35 61.22
$66.76 5yearaverage ofinflationadjustedpercapitaexpense
82,205 Studyareapopulation
$5,488,005.80 Total