a recalibrated and tested lintul-cassava simulation model
TRANSCRIPT
European Journal of Agronomy 124 (2021) 126242
Available online 6 February 20211161-0301/© 2021 The Author(s). Published by Elsevier B.V. This is an open access article under the CC BY license (http://creativecommons.org/licenses/by/4.0/).
A recalibrated and tested LINTUL-Cassava simulation model provides insight into the high yield potential of cassava under rainfed conditions
J.G. Adiele a,d, A.G.T. Schut a,*, R.P.M. van den Beuken a, K.S. Ezui b, P. Pypers c, A.O. Ano d, C. N. Egesi d,e,f, K.E. Giller a
a Plant Production Systems, Wageningen University, P.O. Box 430, 6700 AK, Wageningen, the Netherlands b African Plant Nutrition Institute, ICIPE Campus, Duduville – Kasarani, Thika Road, Nairobi, Kenya c International Institute of Tropical Agriculture, ICIPE Campus, P.O. Box 30772-00100, Nairobi, Kenya d National Root Crops Research Institute, Umudike, KM 8 Ikot Ekpene Road, P.M.B 7006, Umuahia, Abia State, Nigeria e International Program, College of Agriculture and Life Sciences, Cornell University, B75 Mann Library, Ithaca, NY, 14853, United States f International Institute of Tropical Agriculture, Oyo Road, Ibadan, 200001, Nigeria
A R T I C L E I N F O
Keywords: Light interception Radiation use efficiency Dry matter partitioning Crop growth models
A B S T R A C T
Accurate assessments of the yield potential of cassava are needed to analyse yield gaps, define yield targets and set benchmarks for actual yields in Nigeria. This study evaluated the crop model LINTUL-Cassava under assumed potential growth and water-limited conditions in Nigeria. On-farm experiments were conducted at six locations across the three major cassava growing agro-ecologies of Western Africa (Tropical Rainforest – Ogoja and Ikom in Cross River state, Rainforest Transition Savanna – Ekpoma in Edo state and Guinea Savanna – Otukpo in Benue state) during two subsequent seasons (2016 – 2018). Treatments included fertilizer rates calculated to support the assumed potential yields of 90 t fresh storage root yield ha− 1 y− 1 (equivalent to 32 t DM ha− 1, produced in a growing season of 12 months). Light interception (LI) and leaf area index (LAI) were measured each month. The weights of leaves, stems and storage roots were measured at 4 and 8 months after planting and at harvest, and radiation use efficiency (RUE) calculated. The Edo experiment from 2016 was without drought stress and was used to parameterise LINTUL-Cassava and calibrate assimilate partitioning as function of temperature sums. The average fraction of light intercepted during the season was 80 %, with a light extinction coefficient of 0.67 and a RUE of 2.8 g DM MJ− 1 intercepted photosynthetically active radiation (IPAR). After calibration, the LINTUL- Cassava model described the crop growth and observed patterns of LAI well in the experiments in Cross River and Edo (2017). Simulated and observed storage root yield at 4 MAP (vegetative period), 8 MAP (mid-season) and at harvest were strongly correlated (R2 of 0.92), with a RMSE of 4.93 t DM ha− 1. We ascertained that RUE of cassava was much higher than previously observed in Africa, with an average storage root yield of 39 ± 7 t DM ha− 1. Consequently, potential yields are greater and yield gaps larger than expected or previously reported. We conclude that the LINTUL-Cassava model can provide an adequate estimate of storage root yield across major cassava growing agroecological zones in Nigeria under rainfed conditions.
1. Introduction
Cassava (Manihot esculenta Crantz) is an important food crop and animal feed in tropical and sub-tropical Africa, Asia, and Latin America. The area cropped with cassava has expanded considerably over the past decades (Howeler et al., 2013), with over 26 million hectares of land cultivated in 2017, of which approximately 78 % was in Africa (FAO-STAT, 2017). Cassava is a warm season crop with unique and useful environmental physiological traits, including the ability to produce in
poor soils and yield even under conditions of extreme drought (Angelov et al., 1993; Alves, 2002; El-Sharkawy, 2009). There is wider recognition of cassava as a crop of choice for climate change adaptation strategies, particularly in sub-Saharan Africa (SSA) (FAO, 2018). Tropical root crops such as cassava or tuber crops like yams may provide new options to feed the growing population with lower nutrient requirements than cereals (Howeler, 2017). Nutrient use efficiency (NUE) of cassava is much higher than that of cereals (Adiele et al., 2020; Howeler, 2017). Further, cassava may make better use of suitable growing days,
* Corresponding author. E-mail address: [email protected] (A.G.T. Schut).
Contents lists available at ScienceDirect
European Journal of Agronomy
journal homepage: www.elsevier.com/locate/eja
https://doi.org/10.1016/j.eja.2021.126242 Received 7 December 2019; Received in revised form 11 December 2020; Accepted 19 December 2020
European Journal of Agronomy 124 (2021) 126242
2
especially under seasonal drought conditions that characterise rain-fed agriculture in SSA (Ezui et al., 2018). Observed storage root yields from experiments in the region ranged between 6 and 35 t dry matter (DM) ha− 1 (Adiele et al., 2020) and were larger than simulated potential yields (Matthews and Hunt, 1994; Gabriel et al., 2014; Ezui et al., 2018). This suggests that some crop parameters used currently in cassava growth simulation models require modification. Good estimates of po-tential yields provide important benchmarks for realistic yield targets and understanding of yield gaps with local relevance (Van Ittersum et al., 2013).
The validity of crop models relies on an accurate estimation of pa-rameters that describe key crop growth processes. The amount of light intercepted (LI) by a crop and radiation use efficiency (RUE) are key parameters for estimating potential yield (Sinclair and Muchow, 1999; Kiniry et al., 2005; De Souza et al., 2017). Therefore, LI and RUE have been used to investigate the interaction between crops and manage-ment, and to explain yield differences in diverse production environ-ments (Shah et al., 2004). Seasonal LI values of cassava from different studies in Colombia ranged from 52.3 to 64.1% (De Souza et al., 2017). Similar values were also observed for cultivars in e.g. Thailand and Indonesia, where the largest increases in farmers’ yield per unit land area (~ 24 t fresh storage root ha− 1, equivalent to 8.4 t DM ha− 1) have been achieved in the recent years, between 2005 and 2017 (De Souza et al., 2017; FAOSTAT, 2019). Previous studies have reported huge variation in RUE with values ranging from 0.55 to 2.3 g DM MJ− 1
intercepted photosynthetically active radiation (IPAR) (Veltkamp, 1985; Pellet and El-Sharkawy, 1997; Ezui et al., 2017). A calibrated value of 2.9 g DM MJ− 1 IPAR was used in the modified GUMCAS model to simulate potential yield (Gabriel et al., 2014). By contrast, the seasonal average RUE recorded in experiments in West Africa was 1.16 g DM MJ− 1 IPAR (Ezui et al., 2017).
RUE is cultivar-specific, and the highest values can only be achieved under optimal agronomic practises. For instance, with good manage-ment, RUE values for potatoes (a C3 species as is cassava) range between 2.6 and 3.1 g DM MJ− 1 IPAR (Sinclair and Muchow, 1999; Rezig et al., 2013; Zhou et al., 2016). Furthermore, reported light extinction coeffi-cient (k) values of cassava from literature are similar to those of other crops (0.50 – 0.88), while maximum leaf area index (LAI) ranges from 3 to 11 m2 m− 2 (Veltkamp, 1985; Pellet and El-Sharkawy, 1997; Ezui et al., 2017). Assessment of these key parameters (RUE and k) under SSA conditions is needed for proper simulation of crop growth and yield gap assessments.
LINTUL-Cassava, a relatively simple and robust model, can simulate biomass growth and yield of cassava for potential and water-limited conditions (Ezui et al., 2018). LINTUL-Cassava uses tabulated values for dry matter partitioning and biomass growth rate as a function of the amount of light intercepted multiplied with the (invariable) RUE parameter value. However, this model has not been tested in Nigeria where cassava is cultivated across a range of environmental and climatic conditions which can be considered typical of the humid tropics. The objectives of our study were to: (1) assess the radiation use efficiency and understand the light interception dynamics in cassava; (2) re-calibrate the LINTUL-Cassava model with data from an experiment where water and nutrients did not limit growth ; (3) test the recalibrated LINTUL-Cassava model on experiments with cassava growing under rainfed conditions in three agro-ecological zones without N, P and K limitations.
2. Materials and methods
2.1. The study area
On-farm experiments were conducted from 2016 to 2018. Six experimental fields were selected in three states in different agro- ecological zones (AEZ): Rainforest, with two fields located at Ogoja and Ikom in Cross River state; Transition Rainforest – two fields at
Ekpoma in Edo state; and Guinea Savanna with two fields at Otukpo in the state of Benue, covering the major cassava producing regions in Nigeria. Each year, three field trials were established, one in each AEZ. The fields in Edo were located at 7.05 ◦N, 6.13 ◦E in 2016 and 6.80 ◦N, 6.13 ◦E in 2017. For Cross River, field locations were at 7.27 ◦N, 8.18 ◦E in 2016 and 5.96 ◦N, 8.77 ◦E in 2017. In Benue, fields were located at 6.76 ◦N, 8.69 ◦E in 2016 and 7.27 ◦N, 8.19 ◦E in 2017. The growing season begins with the onset of rains in the south from April (Cross River), gradually moving north, with first rains in Edo by mid-April and June in Benue. The dry season starts early November in the north (Benue), later the dry season extends southwards through Edo and Cross River with intermittent rainfall and ends late March at Cross River, early to mid-April at Edo and May at Benue. The Harmattan wind (cold, dry, dusty north-easterly trade wind) blows during the dry season across all regions. The experiment locations (Cross River and Edo) fall within the Niger delta, which contains deep deposits of relatively young material, rich in clay, resulting in mostly Nitisols or Ferralsols, while Benue is located within the rift basin, with Acrisols or Lixisols as dominant soil types. Weather data were obtained from nearby weather stations, with mean annual rainfall of about 2300, 2200, and 1400 mm for Cross River, Edo, and Benue respectively (Ukhurebor and Abiodun, 2018).
2.2. Experiment design, crop establishment and management
The selected treatments used in this study were part of a larger experiment, described earlier (Adiele et al., 2020). Each experiment contained three blocks, with fertilizer treatments randomized within these blocks. Only three treatments with abundant NPK supply and comparable yields were included in this study, targeting yields of 90 t fresh storage root yield ha− 1 y− 1 (equivalent to 32 t DM ha− 1, produced in a growing season of 12 months), based on the calibrated QUEFTS model (Ezui et al., 2016). The N, P, K, secondary and micronutrient rates for these selected treatments are provided in Table 1. The plot size was 10 m by 8 m. Planting was done at the onset of rains each year, except at Benue in 2016, where planting was delayed due to search for an adequate location. Dates of planting were May 24, June 16 and August 16 in 2016 and May 12, June 3 and June 15, in 2017 for Edo, Cross River and Benue, respectively. Stem cuttings of 25 cm long from cassava cv. TME 419 were planted by hand at a distance of 1.0 m by 0.8 m, resulting in the recommended planting density of 12,500 plants per hectare. The cuttings were inserted directly at slanting position, on the crest of the ridges, with two-thirds of the stem cutting below the soil and the remaining one-third above the ground. The selected TME 419 cultivar has high storage root dry matter and starch contents, and is charac-terised by erect stems with minimal branching, which facilitates inter-cropping as well as higher planting densities (Eke-Okoro and Njoku, 2012; Ezui, 2017). Phosphorus (P) was applied by placement at planting, while nitrogen (N) and potassium (K) were also placed near the roots in three splits at 1, 2.5, and 3.5 months after planting (MAP). The secondary and micronutrients were applied at 2.5 MAP. The N, P and K fertilizers used were urea, triple super phosphate (TSP) and muriate of potash (MOP). The experimental plots were weeded regularly, especially before each fertilizer application and light interception measurements.
Table 1 Nutrient application rates per treatment, (f) represents full rate of the nutrient (N = 300, P = 100 and K =300 kg ha− 1), K240 the K rate of 240 kg ha− 1. Secondary and micronutrients (MN) S, Ca, Mg, Zn, and B were applied at the rates of 16.6- 10-10-5 and 2.5 kg ha− 1, respectively.
Treatment Nitrogen Phosphorus (kg ha− 1)
Potassium Secondary and Micro nutrients
NfPfK240 300 100 240 None NfPfKf 300 100 300 None NfPfKfMN 300 100 300 Included
J.G. Adiele et al.
European Journal of Agronomy 124 (2021) 126242
3
2.3. Soil sampling, rooting depth and plant available water (PAW)
Composite soil samples were collected before land preparation from five points in a “W” pattern from 0 – 30 cm depth in each plot and bulked together. The samples were air-dried and sieved through a 2 mm mesh sieve. The hydrometer method was used to determine the particle size. In order to measure cassava rooting depth, several soil pits were dug in the middle of the plots where the intermediate harvests were carried out at 4 and 8 MAP in Edo and Benue, without tampering with the net plots for final harvest. Cassava roots were easily identified and differentiated from other roots as they were creamy-yellowish and when cut secrete a cloudy-whitish latex. The depth at which the deepest cassava roots were found was recorded for two locations (Edo and Benue). The soil pits were filled up again immediately after measurement. For PAW, soil samples were taken from different layers using soil core rings and from different locations within the fields, in order to account for spatial heterogeneity and heterogeneity in soil depths. The samples were taken at 0, 20, 40, 80, 120 and 160 cm depth. Actual saturation (SAT), field capacity (FC), wilting point (WP) and air dry (AD) soil moisture content were deter-mined from these samples and measurements averaged to obtain one parameter for the whole profile (van den Beuken, 2018). PAW was determined by subtracting soil water content at wilting point from field capacity (PAW = FC-WP). Pedotransfer functions (PTF’s) were selected to determine WP soil moisture content based on texture, bulk density and/or SAT percentage. Soil classification and climate types were compared to the ones used to derive the PTF to check fitness and the PTF which predicted the observed FC soil moisture content best was chosen as a predictor for WP soil moisture content (van den Beuken, 2018). The AD soil moisture content was assumed to be 1/3 of the WP soil moisture content (Penning de Vries, 1989). The rooting depth and soil moisture content measurements were not done at Cross River due to insecurity in the field location area when this study was done. However, the experi-ment fields in Cross River had similar soil type and properties with experiment fields in Edo. Soil samples were processed and textural analysis done at the IITA laboratory, Ibadan, Nigeria.
2.4. Canopy dimensions, light interception and yield assessment
Plant establishment was counted at 1 MAP and all missing cassava stands were replaced to ensure good plant stands (>90 %). Non- destructive morphological assessments, including canopy dimensions (width, length and depth) were made on plants at 1, 2.5, 4, 6, and 8 MAP at Edo and up till 10 MAP at Benue. Beyond these stages, canopy dimension assessments were impossible due to the height of the plant. In each plot, light interception measurements were recorded at 1, 2.5, 4, 8, 10, 12 and 14 MAP. These measurements were done around solar noon (from about 11:00 to 14:00 h) with an AccuPAR LP-80 Ceptometer (Decagon Devices Inc. Pullman, Washington, USA). This equipment al-lows simultaneous measurement of photosynthetically active radiation (PAR) above and below the canopy. A tripod stand was placed on a level platform and readings below the canopy were taken at six different lo-cations in each plot, at soil level, with the 80 cm probe positioned diagonally between two ridges. Average values of PAR above and below, zenith angle of the sun (θ) and the beam fraction (fb) were measured directly by AccuPAR per plot with a default leaf angle distribution (x) parameter value of 1. Canopy dimension measurements were used to estimate the x parameter and this was used to derive the light extinction coefficient (k) and LAI of cassava (Veltkamp, 1985; Pellet and El-Sharkawy, 1997; Ezui et al., 2017). The general value of k was determined as a slope of simple linear regression of LAI vs log trans-formed fraction of light intercepted, following (Zhou et al., 2016; Ezui et al., 2017; Tripathi et al., 2018). Note that we were unable to conduct morphological assessments in Cross River due to insecurity in the area.
Harvests were done three times at all locations in both growing seasons, except at 4 MAP in Cross River 2017. Eight plants were har-vested from a net area of 6.4 m2 per experimental plot at each harvest.
First and second intermediate harvests were done at approximately 4 and 8 MAP. Final harvest for the first year planting took place on Aug 4, Aug 25 and Oct 6, 2017 in Edo, Cross River and Benue, respectively. Final harvest for the second year was on May 4, May 21 and June 15, 2018, in Cross River, Edo and Benue, respectively. At each harvest, fresh weight of leaves and petioles, lignified stems and storage roots of each plant were recorded separately, sub-samples were oven dried at 60 ◦C and dry matter yield was determined gravimetrically. The dry matter content of the harvested cassava storage roots was about 33 %. Total biomass was calculated by summation of the all plant parts, including the fallen leaves. Cassava fine roots were not measured in this study.
2.5. Parameter calculations for data analysis
The daily fraction of light intercepted (fLI) was calculated using the model in Eq. 1.
fLI = 1 −It
I0(1)
Where It is the measured photosynthetic active radiation (PAR) below the canopy and Io is the incident photosynthetic active radiation (PAR) above the canopy, both in MJ m− 2 d− 1. Daily total radiation (DTR) was calculated from daily hours of sunshine measurements, from nearby weather stations, using the Angstrom-Prescott model (Bamiro, 1983).
DTR = H0
(a + b ∗
(nN
))(2)
Where H0 is the daily mean value of global radiation at the top of the atmosphere (MJ m− 2 d− 1); N, the daily maximum sunshine duration (day length); n, the hours of bright sunshine and the ‘a’ and ‘b’ values are known as Ångstrom constants. The Ångstrom constants were determined using the latitude of each field location. The intercepted PAR by the crop (IPAR) was calculated as the product of the fraction of light intercepted (fLI) and DTR and the fraction of photosynthetically active radiation (fPAR), estimated at 0.5 MJ PAR MJ− 1 DTR.
IPAR = fLI ∗ DTR ∗ fPAR (3)
The light extinction coefficient (kAP) was calculated from each AccuPAR measurement assuming an ellipsoidal leaf angle distribution, following procedures of Campbell (1986) and Ezui et al. (2017).
Canopy dimensions and AccuPAR measurements (light interception) were done concurrently. Derivation of x, kAP and LAI values followed standard procedures (Eq. A.1 - 3). Average leaf weight was determined from the total weight of leaves without petioles and the counted number of leaves at each harvest. These average leaf weights were then multi-plied with the number of leaf scars to determine the weight of fallen leaves. Specific leaf area (SLA) was calculated at each harvest as the ratio of estimated LAI and measured green leaf weight, excluding peti-oles. Leaf petioles of cassava account for 20 – 30 % of total leaf weight (El-Sharkawy, 2003).
SLA =LAI (m2 leaf m− 2soil)
Green leaf dry weight (g m− 2)(4)
Light interception was recorded at approximately 37, 78, 120, 242, 305, 363 and 415 days after planting (DAP) for both years in Benue and 40, 78, 120, 244, 318, 361 and 435 DAP in Edo. Measured values of LI were interpolated and cumulative IPAR (MJ PAR m− 2) was estimated for each harvest, and plotted against the total biomass to determine the RUE of cassava, using only observed data from the Edo experiment in 2016 with assumed potential growth conditions as defined by van Ittersum and Rabbinge (1997). The cassava crop in the fields at Edo experienced no drought stress as there was abundant and well-distributed rainfall during the 2016 growing season (approx. 3000 mm), with measured rooting depth of over 3.2 m, ensuring sufficient soil moisture supply during the short dry season.
J.G. Adiele et al.
European Journal of Agronomy 124 (2021) 126242
4
2.6. New parameters and LINTUL–Cassava model
The LINTUL-Cassava model was calibrated and tested for the cassava cultivar TME 419, which is a widely used variety in the region (Ezui et al., 2018). LINTUL-Cassava simulates cassava growth based on the RUE approach of Monteith (1977), with plant development governed by temperature sums and a descriptive definition of assimilate partitioning. The model uses a simple tipping bucket approach to describe plant-available water, enabling simulation of growth under rainfed conditions. The parameter set, as reported by Ezui et al. (2018) was calibrated with experimental data from the plots from Edo (with fertil-izer addition at full rate) in 2016 where water did not limit growth. The growing conditions in Edo allowed the crop to grow at its potential capacity, without limitations by nutrients or water deficiency. First, measured values of RUE and k were used to set parameters values for potential conditions. Second, the description of assimilate partitioning (Fig. A.) was adjusted to match model calculations of LAI with the observed patterns, using forcing functions of the measured LI. Accurate simulation of LAI dynamics throughout the growing season of a crop determines to a large extent the validity of any crop growth model (Gabriel et al., 2014). To test/evaluate the performance of the model, independent data from the other five experiments; Edo 2017, Benue and Cross River in 2016 and 2017 (Table 2) were used. These experiments received similar crop management, but differed in crop growth and development and experienced different degrees of water limitation.
2.7. Statistical analysis
Daily LAI and fLI were obtained through linear interpolation of measured values. In order to obtain LAI estimates up to the end of the season, measured LI was used to estimate LAI from the known relation between LI and LAI using k of 0.67, after Beer–Lambert law. Simple linear regression was used to estimate RUE (g DM MJ− 1 IPAR) for the whole cropping season (Sinclair and Muchow, 1999). The treatment effects on LAI, leaf angle distribution (x), and light extinction coefficient (kAP) were analysed separately for each location and year, using a linear mixed model with the parameter as response variable and fertilizer treatment as explanatory factor, while blocks were considered random effects. Effects were analysed with a type-III ANOVA using Sat-terthwaite’s approximation method. Differences between treatment means were considered significant when probability ≤ 0.05. For anal-ysis, R version 3.5 with the lme4, lmerTest, and Predictmeans packages was used (R Core Team, 2019).
3. Results
3.1. Observations from field experiments
3.1.1. Soil characteristics, soil water content and plant available water (PAW)
The soil type in Edo was characterised as a Nitisol with clear nitic properties, with a sandy loam topsoil and good drainage. Benue was characterised as an Acrisol, also with a sandy loam topsoil. Observed rooting depths of cassava were more than 3.2 m in Edo and about 1.6 m in Benue, where rooting was restricted by a dense clay layer. The SAT,
FC, WP and AD soil water content in Edo and Benue are as shown in Table 3. PAW was on average 0.162 (m3 water m− 3 soil) in Edo and 0.252 (m3 water m− 3 soil) in Benue. Soil water content for Cross River was assumed to be similar to that of Edo since both states shared similar soil types. Rainfall amounts received from planting to harvest at the experimental sites in 2016 were 3157, 3067 and 1747 mm for Edo, Cross River and Benue. In 2017, Edo, Cross River and Benue received lower amounts of 2357, 2141 and 1359 mm of rainfall. A more detailed experimental site description can be found in Adiele et al. (2020).
3.1.2. Leaf area index (LAI), light extinction coefficient (kAP) and leaf angle distribution (x)
The LAI differed only with time and location, but did not differ among treatments. In 2017, average maximum LAI of 6.3 was attained at 122 DAP from NPK fertilized treatments in Edo. LAI was already 3 at 65 DAP, and was maintained between 3.0 and 6.3 for a duration of 145 days before decreasing to 2.8 and subsequently 1.5 at 243 DAP. A similar trend was observed in 2016 (Table 4). This decrease in LAI occurred during the drier part of the season with the typical Harmattan winds. During the second phase of the growing season, which begins with the onset of rains (between 10 and 11 MAP), there was a strong leaf regrowth reaching almost initial LAI peak values (Table 4). At Benue, in 2017, the highest LAI of 3.6 was measured at 122 DAP at the peak of vegetative period in this location and reduced to 0.9 during the dry season. The LAI increased again when the rains returned from 304 DAP (Table 4). In 2016, the LAI development was very slow due to drought and gradually increased with the return of rainfall (Table 4).
As expected, values of kAP and x at Edo and Benue were similar, kAP values appear to increase with increasing x values. The values of kAP ranged from 0.5 to 0.8 (Table A1) and were similar among the treat-ments. The least values of kAP (0.5) were observed in Edo at 4 MAP, at the peak of vegetative growth. A significant linear relationship (R2 =
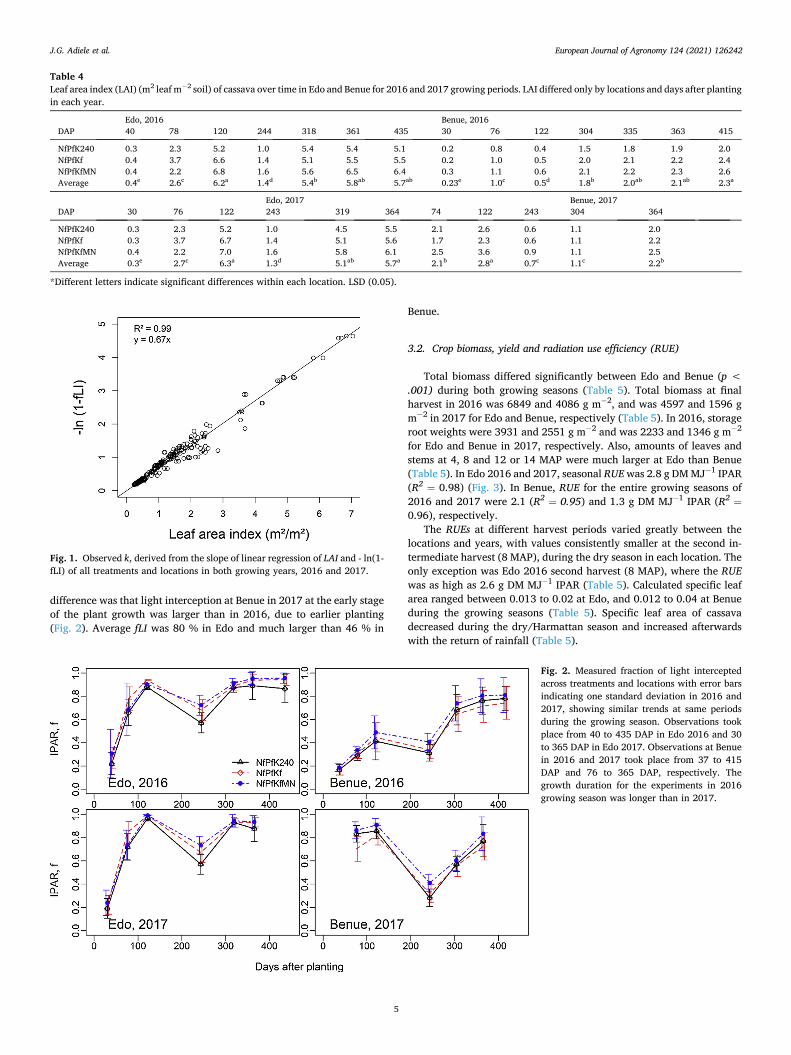
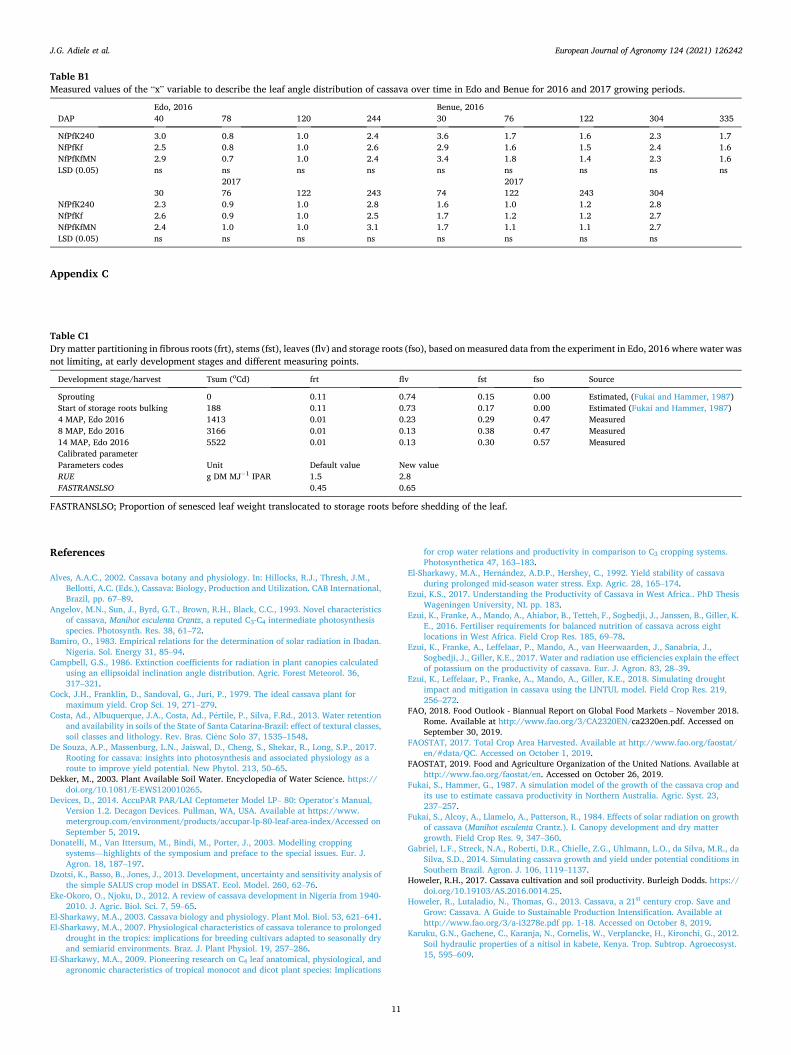
0.99) between LAI and -ln(1-fLI) was found, with overall light extinction coefficient (k) estimated at 0.67 (Fig. 1). The x value of 1.0 obtained at the peak of vegetative growth of cassava in Edo did not differ from Benue at the same stage (Table B1). The higher value 3.6 was obtained at early growth stage and later (after much leaf fall).
3.1.3. Light interception In Edo 2016, cassava in the NfPfKf treatment intercepted approxi-
mately 78 % of the incoming radiation as early as 78 DAP and more than 90 % at 120 DAP. The fraction of light intercepted (fLI) gradually reduced to 70 % during the Harmattan period at 237 DAP and increased again with the return of rains to more than 90 % at 307 DAP (Fig. 2). In Benue 2016, only 50 % of light was intercepted by cassava at 132 DAP in the NfPfKf plot, intercepted light reduced to 26 % during the dry season and increased to 70 % at 365 DAP. In 2017, a similar trend in light interception by treatments and locations was observed. The only
Table 3 Soil characteristics, rooting depth, and typical soil moisture contents when soils are saturated (SAT), at field capacity (FC), wilting point (WP) or air dry (AD).
Location
Benue Cross River Edo
Sand (%) 60.2 65.0 83.0 Silt (%) 25.5 19.0 4.9 Clay (%) 14.3 16.0 12.0 Max. rooting depth (m) 1.6 – 3.2
Water contents (m3 water m− 3 soil) at: Saturation (SAT, pF 0.0) 0.487 0.460* 0.460 Field capacity (FC, pF of 2.0) 0.362 0.310* 0.310 Wilting point (WP, pF of 4.2) 0.110 0.148* 0.148 Air dry (AD, pF of 5.5) 0.037 0.049* 0.049
*Assumed values on the basis of similarity in soil types between Cross River and Edo.
Table 2 Locations used for calibration and evaluation of LINTUL-Cassava model.
Agroecological Zone State/location Year Calibration/evaluation
1 Transition Rainforest Edo/Ekpoma 2016 Calibration 2 Transition Rainforest Edo/Ekpoma 2017 Evaluation 3 Tropical Rainforest Cross River/Ogoja 2016 Evaluation 4 Tropical Rainforest Cross River/Ikom 2017 Evaluation 5 Guinea Savanna Benue/Otukpo 2016 Evaluation 6 Guinea Savanna Benue/Otukpo 2017 Evaluation
J.G. Adiele et al.
European Journal of Agronomy 124 (2021) 126242
5
difference was that light interception at Benue in 2017 at the early stage of the plant growth was larger than in 2016, due to earlier planting (Fig. 2). Average fLI was 80 % in Edo and much larger than 46 % in
Benue.
3.2. Crop biomass, yield and radiation use efficiency (RUE)
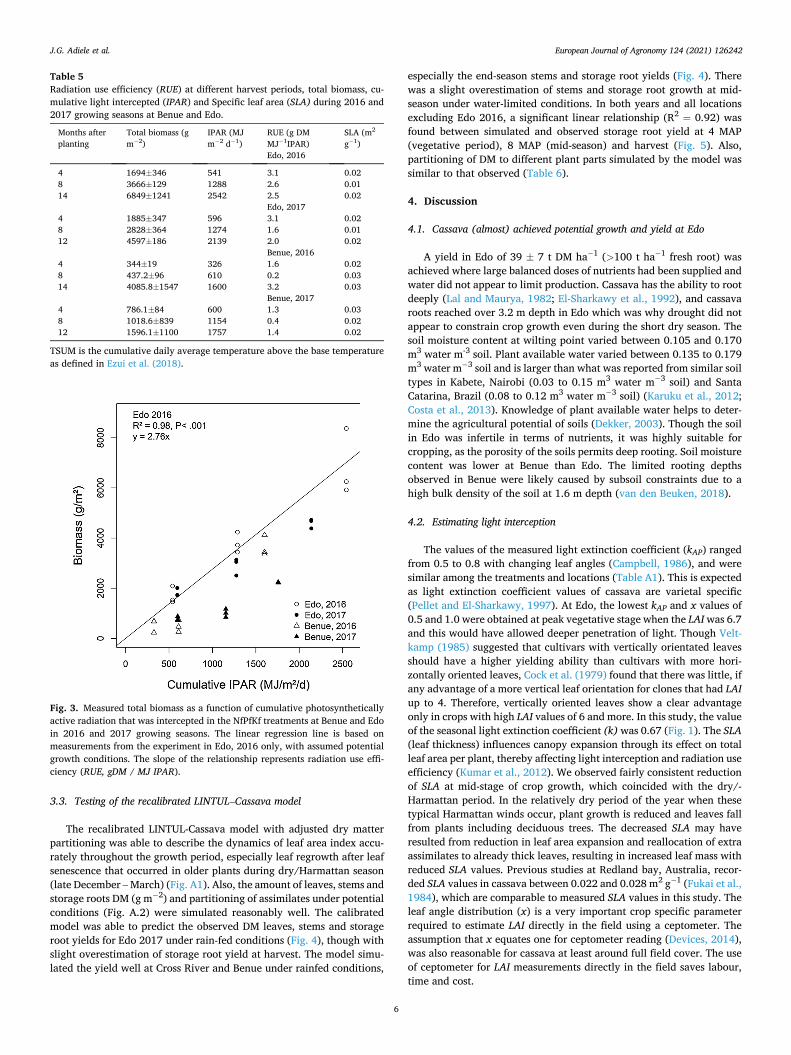
Total biomass differed significantly between Edo and Benue (p < .001) during both growing seasons (Table 5). Total biomass at final harvest in 2016 was 6849 and 4086 g m− 2, and was 4597 and 1596 g m− 2 in 2017 for Edo and Benue, respectively (Table 5). In 2016, storage root weights were 3931 and 2551 g m− 2 and was 2233 and 1346 g m− 2
for Edo and Benue in 2017, respectively. Also, amounts of leaves and stems at 4, 8 and 12 or 14 MAP were much larger at Edo than Benue (Table 5). In Edo 2016 and 2017, seasonal RUE was 2.8 g DM MJ− 1 IPAR (R2 = 0.98) (Fig. 3). In Benue, RUE for the entire growing seasons of 2016 and 2017 were 2.1 (R2 = 0.95) and 1.3 g DM MJ− 1 IPAR (R2 =
0.96), respectively. The RUEs at different harvest periods varied greatly between the
locations and years, with values consistently smaller at the second in-termediate harvest (8 MAP), during the dry season in each location. The only exception was Edo 2016 second harvest (8 MAP), where the RUE was as high as 2.6 g DM MJ− 1 IPAR (Table 5). Calculated specific leaf area ranged between 0.013 to 0.02 at Edo, and 0.012 to 0.04 at Benue during the growing seasons (Table 5). Specific leaf area of cassava decreased during the dry/Harmattan season and increased afterwards with the return of rainfall (Table 5).
Fig. 2. Measured fraction of light intercepted across treatments and locations with error bars indicating one standard deviation in 2016 and 2017, showing similar trends at same periods during the growing season. Observations took place from 40 to 435 DAP in Edo 2016 and 30 to 365 DAP in Edo 2017. Observations at Benue in 2016 and 2017 took place from 37 to 415 DAP and 76 to 365 DAP, respectively. The growth duration for the experiments in 2016 growing season was longer than in 2017.
Table 4 Leaf area index (LAI) (m2 leaf m− 2 soil) of cassava over time in Edo and Benue for 2016 and 2017 growing periods. LAI differed only by locations and days after planting in each year.
Edo, 2016 Benue, 2016 DAP 40 78 120 244 318 361 435 30 76 122 304 335 363 415
NfPfK240 0.3 2.3 5.2 1.0 5.4 5.4 5.1 0.2 0.8 0.4 1.5 1.8 1.9 2.0 NfPfKf 0.4 3.7 6.6 1.4 5.1 5.5 5.5 0.2 1.0 0.5 2.0 2.1 2.2 2.4 NfPfKfMN 0.4 2.2 6.8 1.6 5.6 6.5 6.4 0.3 1.1 0.6 2.1 2.2 2.3 2.6 Average 0.4e 2.6c 6.2a 1.4d 5.4b 5.8ab 5.7ab 0.23e 1.0c 0.5d 1.8b 2.0ab 2.1ab 2.3a
Edo, 2017 Benue, 2017 DAP 30 76 122 243 319 364 74 122 243 304 364
NfPfK240 0.3 2.3 5.2 1.0 4.5 5.5 2.1 2.6 0.6 1.1 2.0 NfPfKf 0.3 3.7 6.7 1.4 5.1 5.6 1.7 2.3 0.6 1.1 2.2 NfPfKfMN 0.4 2.2 7.0 1.6 5.8 6.1 2.5 3.6 0.9 1.1 2.5 Average 0.3e 2.7c 6.3a 1.3d 5.1ab 5.7a 2.1b 2.8a 0.7c 1.1c 2.2b
*Different letters indicate significant differences within each location. LSD (0.05).
Fig. 1. Observed k, derived from the slope of linear regression of LAI and - ln(1- fLI) of all treatments and locations in both growing years, 2016 and 2017.
J.G. Adiele et al.
European Journal of Agronomy 124 (2021) 126242
6
3.3. Testing of the recalibrated LINTUL–Cassava model
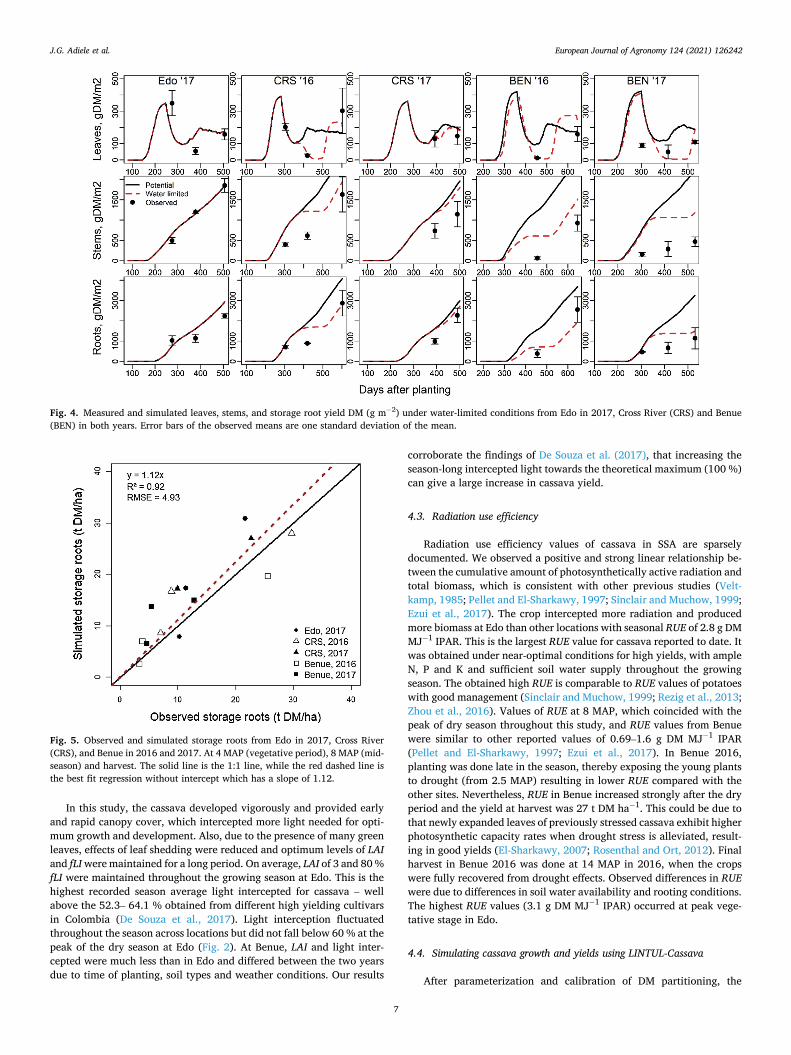
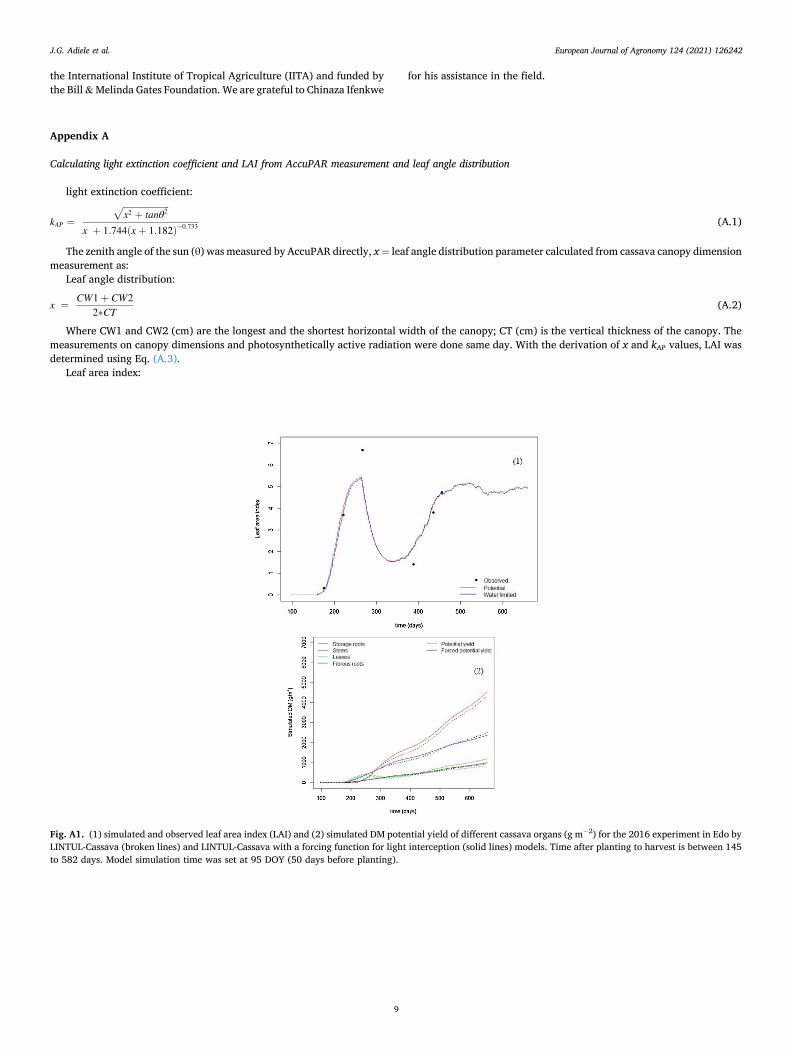
The recalibrated LINTUL-Cassava model with adjusted dry matter partitioning was able to describe the dynamics of leaf area index accu-rately throughout the growth period, especially leaf regrowth after leaf senescence that occurred in older plants during dry/Harmattan season (late December – March) (Fig. A1). Also, the amount of leaves, stems and storage roots DM (g m− 2) and partitioning of assimilates under potential conditions (Fig. A.2) were simulated reasonably well. The calibrated model was able to predict the observed DM leaves, stems and storage root yields for Edo 2017 under rain-fed conditions (Fig. 4), though with slight overestimation of storage root yield at harvest. The model simu-lated the yield well at Cross River and Benue under rainfed conditions,
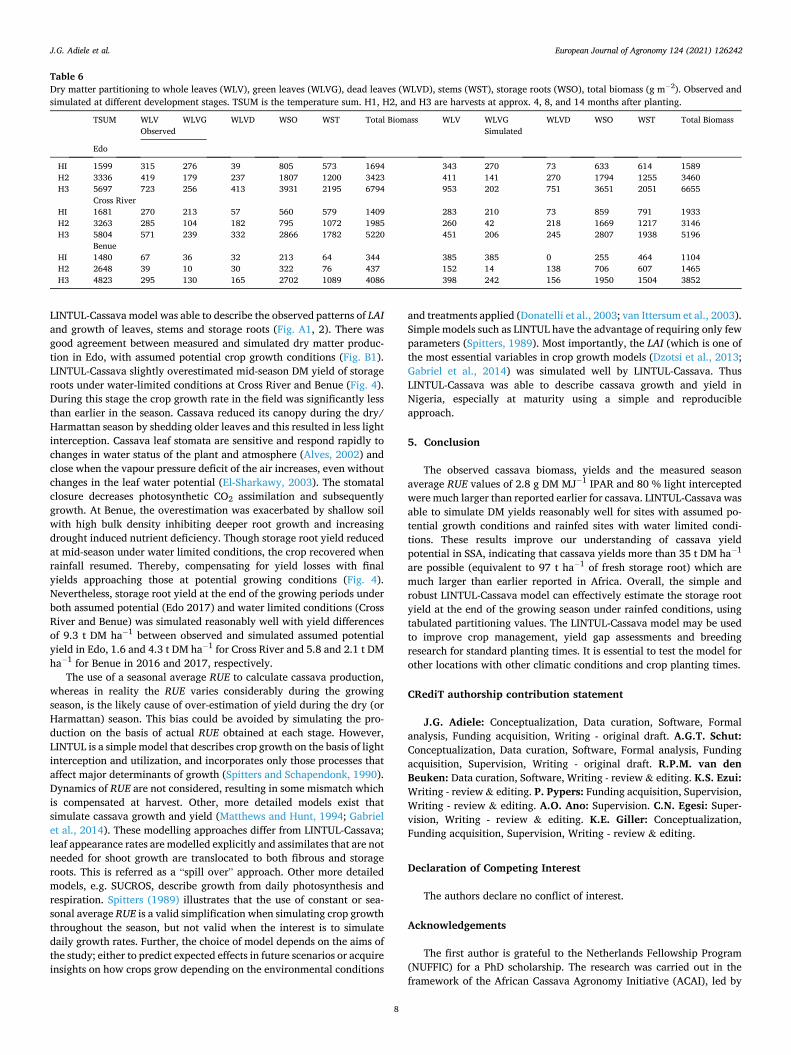
especially the end-season stems and storage root yields (Fig. 4). There was a slight overestimation of stems and storage root growth at mid- season under water-limited conditions. In both years and all locations excluding Edo 2016, a significant linear relationship (R2 = 0.92) was found between simulated and observed storage root yield at 4 MAP (vegetative period), 8 MAP (mid-season) and harvest (Fig. 5). Also, partitioning of DM to different plant parts simulated by the model was similar to that observed (Table 6).
4. Discussion
4.1. Cassava (almost) achieved potential growth and yield at Edo
A yield in Edo of 39 ± 7 t DM ha− 1 (>100 t ha− 1 fresh root) was achieved where large balanced doses of nutrients had been supplied and water did not appear to limit production. Cassava has the ability to root deeply (Lal and Maurya, 1982; El-Sharkawy et al., 1992), and cassava roots reached over 3.2 m depth in Edo which was why drought did not appear to constrain crop growth even during the short dry season. The soil moisture content at wilting point varied between 0.105 and 0.170 m3 water m-3 soil. Plant available water varied between 0.135 to 0.179 m3 water m− 3 soil and is larger than what was reported from similar soil types in Kabete, Nairobi (0.03 to 0.15 m3 water m− 3 soil) and Santa Catarina, Brazil (0.08 to 0.12 m3 water m− 3 soil) (Karuku et al., 2012; Costa et al., 2013). Knowledge of plant available water helps to deter-mine the agricultural potential of soils (Dekker, 2003). Though the soil in Edo was infertile in terms of nutrients, it was highly suitable for cropping, as the porosity of the soils permits deep rooting. Soil moisture content was lower at Benue than Edo. The limited rooting depths observed in Benue were likely caused by subsoil constraints due to a high bulk density of the soil at 1.6 m depth (van den Beuken, 2018).
4.2. Estimating light interception
The values of the measured light extinction coefficient (kAP) ranged from 0.5 to 0.8 with changing leaf angles (Campbell, 1986), and were similar among the treatments and locations (Table A1). This is expected as light extinction coefficient values of cassava are varietal specific (Pellet and El-Sharkawy, 1997). At Edo, the lowest kAP and x values of 0.5 and 1.0 were obtained at peak vegetative stage when the LAI was 6.7 and this would have allowed deeper penetration of light. Though Velt-kamp (1985) suggested that cultivars with vertically orientated leaves should have a higher yielding ability than cultivars with more hori-zontally oriented leaves, Cock et al. (1979) found that there was little, if any advantage of a more vertical leaf orientation for clones that had LAI up to 4. Therefore, vertically oriented leaves show a clear advantage only in crops with high LAI values of 6 and more. In this study, the value of the seasonal light extinction coefficient (k) was 0.67 (Fig. 1). The SLA (leaf thickness) influences canopy expansion through its effect on total leaf area per plant, thereby affecting light interception and radiation use efficiency (Kumar et al., 2012). We observed fairly consistent reduction of SLA at mid-stage of crop growth, which coincided with the dry/-Harmattan period. In the relatively dry period of the year when these typical Harmattan winds occur, plant growth is reduced and leaves fall from plants including deciduous trees. The decreased SLA may have resulted from reduction in leaf area expansion and reallocation of extra assimilates to already thick leaves, resulting in increased leaf mass with reduced SLA values. Previous studies at Redland bay, Australia, recor-ded SLA values in cassava between 0.022 and 0.028 m2 g− 1 (Fukai et al., 1984), which are comparable to measured SLA values in this study. The leaf angle distribution (x) is a very important crop specific parameter required to estimate LAI directly in the field using a ceptometer. The assumption that x equates one for ceptometer reading (Devices, 2014), was also reasonable for cassava at least around full field cover. The use of ceptometer for LAI measurements directly in the field saves labour, time and cost.
Fig. 3. Measured total biomass as a function of cumulative photosynthetically active radiation that was intercepted in the NfPfKf treatments at Benue and Edo in 2016 and 2017 growing seasons. The linear regression line is based on measurements from the experiment in Edo, 2016 only, with assumed potential growth conditions. The slope of the relationship represents radiation use effi-ciency (RUE, gDM / MJ IPAR).
Table 5 Radiation use efficiency (RUE) at different harvest periods, total biomass, cu-mulative light intercepted (IPAR) and Specific leaf area (SLA) during 2016 and 2017 growing seasons at Benue and Edo.
Months after planting
Total biomass (g m− 2)
IPAR (MJ m− 2 d− 1)
RUE (g DM MJ− 1IPAR)
SLA (m2
g− 1) Edo, 2016
4 1694±346 541 3.1 0.02 8 3666±129 1288 2.6 0.01 14 6849±1241 2542 2.5 0.02
Edo, 2017 4 1885±347 596 3.1 0.02 8 2828±364 1274 1.6 0.01 12 4597±186 2139 2.0 0.02
Benue, 2016 4 344±19 326 1.6 0.02 8 437.2±96 610 0.2 0.03 14 4085.8±1547 1600 3.2 0.03
Benue, 2017 4 786.1±84 600 1.3 0.03 8 1018.6±839 1154 0.4 0.02 12 1596.1±1100 1757 1.4 0.02
TSUM is the cumulative daily average temperature above the base temperature as defined in Ezui et al. (2018).
J.G. Adiele et al.
European Journal of Agronomy 124 (2021) 126242
7
In this study, the cassava developed vigorously and provided early and rapid canopy cover, which intercepted more light needed for opti-mum growth and development. Also, due to the presence of many green leaves, effects of leaf shedding were reduced and optimum levels of LAI and fLI were maintained for a long period. On average, LAI of 3 and 80 % fLI were maintained throughout the growing season at Edo. This is the highest recorded season average light intercepted for cassava – well above the 52.3– 64.1 % obtained from different high yielding cultivars in Colombia (De Souza et al., 2017). Light interception fluctuated throughout the season across locations but did not fall below 60 % at the peak of the dry season at Edo (Fig. 2). At Benue, LAI and light inter-cepted were much less than in Edo and differed between the two years due to time of planting, soil types and weather conditions. Our results
corroborate the findings of De Souza et al. (2017), that increasing the season-long intercepted light towards the theoretical maximum (100 %) can give a large increase in cassava yield.
4.3. Radiation use efficiency
Radiation use efficiency values of cassava in SSA are sparsely documented. We observed a positive and strong linear relationship be-tween the cumulative amount of photosynthetically active radiation and total biomass, which is consistent with other previous studies (Velt-kamp, 1985; Pellet and El-Sharkawy, 1997; Sinclair and Muchow, 1999; Ezui et al., 2017). The crop intercepted more radiation and produced more biomass at Edo than other locations with seasonal RUE of 2.8 g DM MJ− 1 IPAR. This is the largest RUE value for cassava reported to date. It was obtained under near-optimal conditions for high yields, with ample N, P and K and sufficient soil water supply throughout the growing season. The obtained high RUE is comparable to RUE values of potatoes with good management (Sinclair and Muchow, 1999; Rezig et al., 2013; Zhou et al., 2016). Values of RUE at 8 MAP, which coincided with the peak of dry season throughout this study, and RUE values from Benue were similar to other reported values of 0.69–1.6 g DM MJ− 1 IPAR (Pellet and El-Sharkawy, 1997; Ezui et al., 2017). In Benue 2016, planting was done late in the season, thereby exposing the young plants to drought (from 2.5 MAP) resulting in lower RUE compared with the other sites. Nevertheless, RUE in Benue increased strongly after the dry period and the yield at harvest was 27 t DM ha− 1. This could be due to that newly expanded leaves of previously stressed cassava exhibit higher photosynthetic capacity rates when drought stress is alleviated, result-ing in good yields (El-Sharkawy, 2007; Rosenthal and Ort, 2012). Final harvest in Benue 2016 was done at 14 MAP in 2016, when the crops were fully recovered from drought effects. Observed differences in RUE were due to differences in soil water availability and rooting conditions. The highest RUE values (3.1 g DM MJ− 1 IPAR) occurred at peak vege-tative stage in Edo.
4.4. Simulating cassava growth and yields using LINTUL-Cassava
After parameterization and calibration of DM partitioning, the
Fig. 4. Measured and simulated leaves, stems, and storage root yield DM (g m− 2) under water-limited conditions from Edo in 2017, Cross River (CRS) and Benue (BEN) in both years. Error bars of the observed means are one standard deviation of the mean.
Fig. 5. Observed and simulated storage roots from Edo in 2017, Cross River (CRS), and Benue in 2016 and 2017. At 4 MAP (vegetative period), 8 MAP (mid- season) and harvest. The solid line is the 1:1 line, while the red dashed line is the best fit regression without intercept which has a slope of 1.12.
J.G. Adiele et al.
European Journal of Agronomy 124 (2021) 126242
8
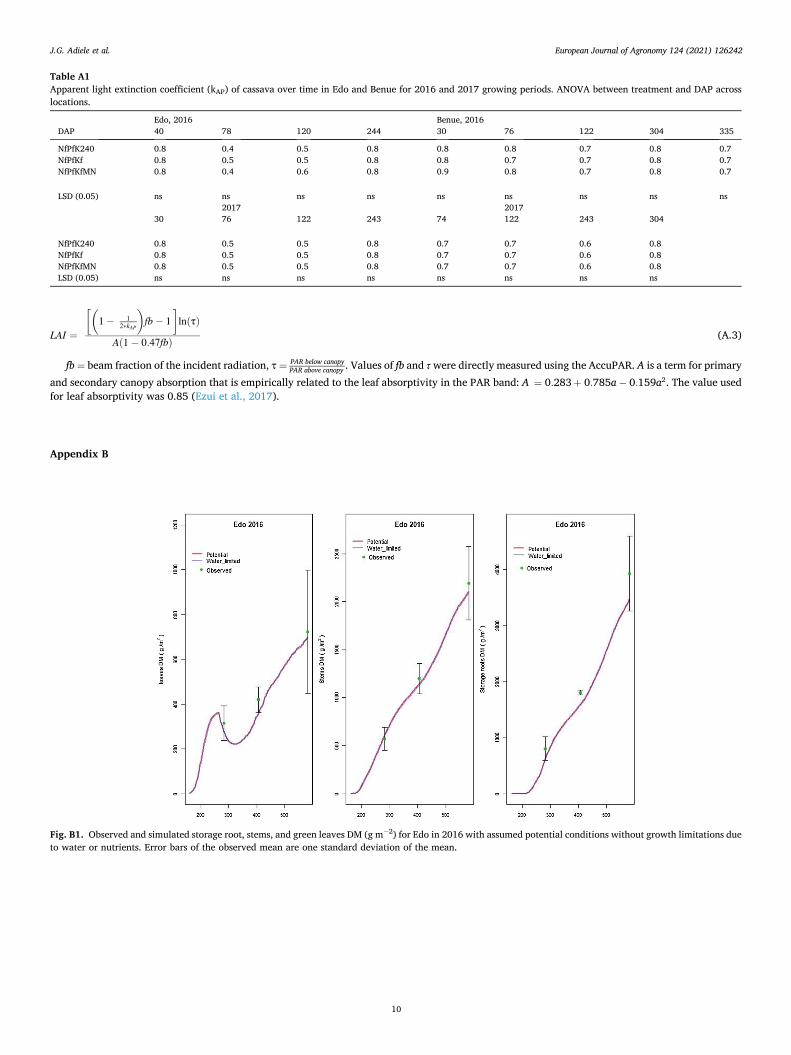
LINTUL-Cassava model was able to describe the observed patterns of LAI and growth of leaves, stems and storage roots (Fig. A1, 2). There was good agreement between measured and simulated dry matter produc-tion in Edo, with assumed potential crop growth conditions (Fig. B1). LINTUL-Cassava slightly overestimated mid-season DM yield of storage roots under water-limited conditions at Cross River and Benue (Fig. 4). During this stage the crop growth rate in the field was significantly less than earlier in the season. Cassava reduced its canopy during the dry/ Harmattan season by shedding older leaves and this resulted in less light interception. Cassava leaf stomata are sensitive and respond rapidly to changes in water status of the plant and atmosphere (Alves, 2002) and close when the vapour pressure deficit of the air increases, even without changes in the leaf water potential (El-Sharkawy, 2003). The stomatal closure decreases photosynthetic CO2 assimilation and subsequently growth. At Benue, the overestimation was exacerbated by shallow soil with high bulk density inhibiting deeper root growth and increasing drought induced nutrient deficiency. Though storage root yield reduced at mid-season under water limited conditions, the crop recovered when rainfall resumed. Thereby, compensating for yield losses with final yields approaching those at potential growing conditions (Fig. 4). Nevertheless, storage root yield at the end of the growing periods under both assumed potential (Edo 2017) and water limited conditions (Cross River and Benue) was simulated reasonably well with yield differences of 9.3 t DM ha− 1 between observed and simulated assumed potential yield in Edo, 1.6 and 4.3 t DM ha− 1 for Cross River and 5.8 and 2.1 t DM ha− 1 for Benue in 2016 and 2017, respectively.
The use of a seasonal average RUE to calculate cassava production, whereas in reality the RUE varies considerably during the growing season, is the likely cause of over-estimation of yield during the dry (or Harmattan) season. This bias could be avoided by simulating the pro-duction on the basis of actual RUE obtained at each stage. However, LINTUL is a simple model that describes crop growth on the basis of light interception and utilization, and incorporates only those processes that affect major determinants of growth (Spitters and Schapendonk, 1990). Dynamics of RUE are not considered, resulting in some mismatch which is compensated at harvest. Other, more detailed models exist that simulate cassava growth and yield (Matthews and Hunt, 1994; Gabriel et al., 2014). These modelling approaches differ from LINTUL-Cassava; leaf appearance rates are modelled explicitly and assimilates that are not needed for shoot growth are translocated to both fibrous and storage roots. This is referred as a “spill over” approach. Other more detailed models, e.g. SUCROS, describe growth from daily photosynthesis and respiration. Spitters (1989) illustrates that the use of constant or sea-sonal average RUE is a valid simplification when simulating crop growth throughout the season, but not valid when the interest is to simulate daily growth rates. Further, the choice of model depends on the aims of the study; either to predict expected effects in future scenarios or acquire insights on how crops grow depending on the environmental conditions
and treatments applied (Donatelli et al., 2003; van Ittersum et al., 2003). Simple models such as LINTUL have the advantage of requiring only few parameters (Spitters, 1989). Most importantly, the LAI (which is one of the most essential variables in crop growth models (Dzotsi et al., 2013; Gabriel et al., 2014) was simulated well by LINTUL-Cassava. Thus LINTUL-Cassava was able to describe cassava growth and yield in Nigeria, especially at maturity using a simple and reproducible approach.
5. Conclusion
The observed cassava biomass, yields and the measured season average RUE values of 2.8 g DM MJ− 1 IPAR and 80 % light intercepted were much larger than reported earlier for cassava. LINTUL-Cassava was able to simulate DM yields reasonably well for sites with assumed po-tential growth conditions and rainfed sites with water limited condi-tions. These results improve our understanding of cassava yield potential in SSA, indicating that cassava yields more than 35 t DM ha− 1
are possible (equivalent to 97 t ha− 1 of fresh storage root) which are much larger than earlier reported in Africa. Overall, the simple and robust LINTUL-Cassava model can effectively estimate the storage root yield at the end of the growing season under rainfed conditions, using tabulated partitioning values. The LINTUL-Cassava model may be used to improve crop management, yield gap assessments and breeding research for standard planting times. It is essential to test the model for other locations with other climatic conditions and crop planting times.
CRediT authorship contribution statement
J.G. Adiele: Conceptualization, Data curation, Software, Formal analysis, Funding acquisition, Writing - original draft. A.G.T. Schut: Conceptualization, Data curation, Software, Formal analysis, Funding acquisition, Supervision, Writing - original draft. R.P.M. van den Beuken: Data curation, Software, Writing - review & editing. K.S. Ezui: Writing - review & editing. P. Pypers: Funding acquisition, Supervision, Writing - review & editing. A.O. Ano: Supervision. C.N. Egesi: Super-vision, Writing - review & editing. K.E. Giller: Conceptualization, Funding acquisition, Supervision, Writing - review & editing.
Declaration of Competing Interest
The authors declare no conflict of interest.
Acknowledgements
The first author is grateful to the Netherlands Fellowship Program (NUFFIC) for a PhD scholarship. The research was carried out in the framework of the African Cassava Agronomy Initiative (ACAI), led by
Table 6 Dry matter partitioning to whole leaves (WLV), green leaves (WLVG), dead leaves (WLVD), stems (WST), storage roots (WSO), total biomass (g m− 2). Observed and simulated at different development stages. TSUM is the temperature sum. H1, H2, and H3 are harvests at approx. 4, 8, and 14 months after planting.
TSUM WLV WLVG WLVD WSO WST Total Biomass WLV WLVG WLVD WSO WST Total Biomass Observed Simulated
Edo
HI 1599 315 276 39 805 573 1694 343 270 73 633 614 1589 H2 3336 419 179 237 1807 1200 3423 411 141 270 1794 1255 3460 H3 5697 723 256 413 3931 2195 6794 953 202 751 3651 2051 6655
Cross River HI 1681 270 213 57 560 579 1409 283 210 73 859 791 1933 H2 3263 285 104 182 795 1072 1985 260 42 218 1669 1217 3146 H3 5804 571 239 332 2866 1782 5220 451 206 245 2807 1938 5196
Benue HI 1480 67 36 32 213 64 344 385 385 0 255 464 1104 H2 2648 39 10 30 322 76 437 152 14 138 706 607 1465 H3 4823 295 130 165 2702 1089 4086 398 242 156 1950 1504 3852
J.G. Adiele et al.
European Journal of Agronomy 124 (2021) 126242
9
the International Institute of Tropical Agriculture (IITA) and funded by the Bill & Melinda Gates Foundation. We are grateful to Chinaza Ifenkwe
for his assistance in the field.
Appendix A
Calculating light extinction coefficient and LAI from AccuPAR measurement and leaf angle distribution
light extinction coefficient:
kAP =
x2 + tanθ2
√
x + 1.744(x + 1.182)− 0.733 (A.1)
The zenith angle of the sun (θ) was measured by AccuPAR directly, x = leaf angle distribution parameter calculated from cassava canopy dimension measurement as:
Leaf angle distribution:
x =CW1 + CW2
2∗CT(A.2)
Where CW1 and CW2 (cm) are the longest and the shortest horizontal width of the canopy; CT (cm) is the vertical thickness of the canopy. The measurements on canopy dimensions and photosynthetically active radiation were done same day. With the derivation of x and kAP values, LAI was determined using Eq. (A.3).
Leaf area index:
Fig. A1. (1) simulated and observed leaf area index (LAI) and (2) simulated DM potential yield of different cassava organs (g m− 2) for the 2016 experiment in Edo by LINTUL-Cassava (broken lines) and LINTUL-Cassava with a forcing function for light interception (solid lines) models. Time after planting to harvest is between 145 to 582 days. Model simulation time was set at 95 DOY (50 days before planting).
J.G. Adiele et al.
European Journal of Agronomy 124 (2021) 126242
10
LAI =
[(
1 − 12∗kAP
)
fb − 1]
ln(τ)
A(1 − 0.47fb)(A.3)
fb = beam fraction of the incident radiation, τ = PAR below canopyPAR above canopy . Values of fb and τ were directly measured using the AccuPAR. A is a term for primary
and secondary canopy absorption that is empirically related to the leaf absorptivity in the PAR band: A = 0.283+ 0.785a − 0.159a2. The value used for leaf absorptivity was 0.85 (Ezui et al., 2017).
Appendix B
Table A1 Apparent light extinction coefficient (kAP) of cassava over time in Edo and Benue for 2016 and 2017 growing periods. ANOVA between treatment and DAP across locations.
Edo, 2016 Benue, 2016 DAP 40 78 120 244 30 76 122 304 335
NfPfK240 0.8 0.4 0.5 0.8 0.8 0.8 0.7 0.8 0.7 NfPfKf 0.8 0.5 0.5 0.8 0.8 0.7 0.7 0.8 0.7 NfPfKfMN 0.8 0.4 0.6 0.8 0.9 0.8 0.7 0.8 0.7
LSD (0.05) ns ns ns ns ns ns ns ns ns 2017 2017
30 76 122 243 74 122 243 304
NfPfK240 0.8 0.5 0.5 0.8 0.7 0.7 0.6 0.8 NfPfKf 0.8 0.5 0.5 0.8 0.7 0.7 0.6 0.8 NfPfKfMN 0.8 0.5 0.5 0.8 0.7 0.7 0.6 0.8 LSD (0.05) ns ns ns ns ns ns ns ns
Fig. B1. Observed and simulated storage root, stems, and green leaves DM (g m− 2) for Edo in 2016 with assumed potential conditions without growth limitations due to water or nutrients. Error bars of the observed mean are one standard deviation of the mean.
J.G. Adiele et al.
European Journal of Agronomy 124 (2021) 126242
11
Appendix C
References
Alves, A.A.C., 2002. Cassava botany and physiology. In: Hillocks, R.J., Thresh, J.M., Bellotti, A.C. (Eds.), Cassava: Biology, Production and Utilization. CAB International, Brazil, pp. 67–89.
Angelov, M.N., Sun, J., Byrd, G.T., Brown, R.H., Black, C.C., 1993. Novel characteristics of cassava, Manihot esculenta Crantz, a reputed C3-C4 intermediate photosynthesis species. Photosynth. Res. 38, 61–72.
Bamiro, O., 1983. Empirical relations for the determination of solar radiation in Ibadan. Nigeria. Sol. Energy 31, 85–94.
Campbell, G.S., 1986. Extinction coefficients for radiation in plant canopies calculated using an ellipsoidal inclination angle distribution. Agric. Forest Meteorol. 36, 317–321.
Cock, J.H., Franklin, D., Sandoval, G., Juri, P., 1979. The ideal cassava plant for maximum yield. Crop Sci. 19, 271–279.
Costa, Ad., Albuquerque, J.A., Costa, Ad., Pertile, P., Silva, F.Rd., 2013. Water retention and availability in soils of the State of Santa Catarina-Brazil: effect of textural classes, soil classes and lithology. Rev. Bras. Cienc Solo 37, 1535–1548.
De Souza, A.P., Massenburg, L.N., Jaiswal, D., Cheng, S., Shekar, R., Long, S.P., 2017. Rooting for cassava: insights into photosynthesis and associated physiology as a route to improve yield potential. New Phytol. 213, 50–65.
Dekker, M., 2003. Plant Available Soil Water. Encyclopedia of Water Science. https:// doi.org/10.1081/E-EWS120010265.
Devices, D., 2014. AccuPAR PAR/LAI Ceptometer Model LP– 80: Operator’s Manual, Version 1.2. Decagon Devices. Pullman, WA, USA. Available at https://www. metergroup.com/environment/products/accupar-lp-80-leaf-area-index/Accessed on September 5, 2019.
Donatelli, M., Van Ittersum, M., Bindi, M., Porter, J., 2003. Modelling cropping systems—highlights of the symposium and preface to the special issues. Eur. J. Agron. 18, 187–197.
Dzotsi, K., Basso, B., Jones, J., 2013. Development, uncertainty and sensitivity analysis of the simple SALUS crop model in DSSAT. Ecol. Model. 260, 62–76.
Eke-Okoro, O., Njoku, D., 2012. A review of cassava development in Nigeria from 1940- 2010. J. Agric. Biol. Sci. 7, 59–65.
El-Sharkawy, M.A., 2003. Cassava biology and physiology. Plant Mol. Biol. 53, 621–641. El-Sharkawy, M.A., 2007. Physiological characteristics of cassava tolerance to prolonged
drought in the tropics: implications for breeding cultivars adapted to seasonally dry and semiarid environments. Braz. J. Plant Physiol. 19, 257–286.
El-Sharkawy, M.A., 2009. Pioneering research on C4 leaf anatomical, physiological, and agronomic characteristics of tropical monocot and dicot plant species: Implications
for crop water relations and productivity in comparison to C3 cropping systems. Photosynthetica 47, 163–183.
El-Sharkawy, M.A., Hernandez, A.D.P., Hershey, C., 1992. Yield stability of cassava during prolonged mid-season water stress. Exp. Agric. 28, 165–174.
Ezui, K.S., 2017. Understanding the Productivity of Cassava in West Africa.. PhD Thesis Wageningen University, NL pp. 183.
Ezui, K., Franke, A., Mando, A., Ahiabor, B., Tetteh, F., Sogbedji, J., Janssen, B., Giller, K. E., 2016. Fertiliser requirements for balanced nutrition of cassava across eight locations in West Africa. Field Crop Res. 185, 69–78.
Ezui, K., Franke, A., Leffelaar, P., Mando, A., van Heerwaarden, J., Sanabria, J., Sogbedji, J., Giller, K.E., 2017. Water and radiation use efficiencies explain the effect of potassium on the productivity of cassava. Eur. J. Agron. 83, 28–39.
Ezui, K., Leffelaar, P., Franke, A., Mando, A., Giller, K.E., 2018. Simulating drought impact and mitigation in cassava using the LINTUL model. Field Crop Res. 219, 256–272.
FAO, 2018. Food Outlook - Biannual Report on Global Food Markets – November 2018. Rome. Available at http://www.fao.org/3/CA2320EN/ca2320en.pdf. Accessed on September 30, 2019.
FAOSTAT, 2017. Total Crop Area Harvested. Available at http://www.fao.org/faostat/ en/#data/QC. Accessed on October 1, 2019.
FAOSTAT, 2019. Food and Agriculture Organization of the United Nations. Available at http://www.fao.org/faostat/en. Accessed on October 26, 2019.
Fukai, S., Hammer, G., 1987. A simulation model of the growth of the cassava crop and its use to estimate cassava productivity in Northern Australia. Agric. Syst. 23, 237–257.
Fukai, S., Alcoy, A., Llamelo, A., Patterson, R., 1984. Effects of solar radiation on growth of cassava (Manihot esculenta Crantz.). I. Canopy development and dry matter growth. Field Crop Res. 9, 347–360.
Gabriel, L.F., Streck, N.A., Roberti, D.R., Chielle, Z.G., Uhlmann, L.O., da Silva, M.R., da Silva, S.D., 2014. Simulating cassava growth and yield under potential conditions in Southern Brazil. Agron. J. 106, 1119–1137.
Howeler, R.H., 2017. Cassava cultivation and soil productivity. Burleigh Dodds. https:// doi.org/10.19103/AS.2016.0014.25.
Howeler, R., Lutaladio, N., Thomas, G., 2013. Cassava, a 21st century crop. Save and Grow: Cassava. A Guide to Sustainable Production Intensification. Available at http://www.fao.org/3/a-i3278e.pdf pp. 1-18. Accessed on October 8, 2019.
Karuku, G.N., Gachene, C., Karanja, N., Cornelis, W., Verplancke, H., Kironchi, G., 2012. Soil hydraulic properties of a nitisol in kabete, Kenya. Trop. Subtrop. Agroecosyst. 15, 595–609.
Table C1 Dry matter partitioning in fibrous roots (frt), stems (fst), leaves (flv) and storage roots (fso), based on measured data from the experiment in Edo, 2016 where water was not limiting, at early development stages and different measuring points.
Development stage/harvest Tsum (oCd) frt flv fst fso Source
Sprouting 0 0.11 0.74 0.15 0.00 Estimated, (Fukai and Hammer, 1987) Start of storage roots bulking 188 0.11 0.73 0.17 0.00 Estimated (Fukai and Hammer, 1987) 4 MAP, Edo 2016 1413 0.01 0.23 0.29 0.47 Measured 8 MAP, Edo 2016 3166 0.01 0.13 0.38 0.47 Measured 14 MAP, Edo 2016 5522 0.01 0.13 0.30 0.57 Measured Calibrated parameter Parameters codes Unit Default value New value RUE g DM MJ− 1 IPAR 1.5 2.8 FASTRANSLSO 0.45 0.65
FASTRANSLSO; Proportion of senesced leaf weight translocated to storage roots before shedding of the leaf.
Table B1 Measured values of the “x” variable to describe the leaf angle distribution of cassava over time in Edo and Benue for 2016 and 2017 growing periods.
Edo, 2016 Benue, 2016 DAP 40 78 120 244 30 76 122 304 335
NfPfK240 3.0 0.8 1.0 2.4 3.6 1.7 1.6 2.3 1.7 NfPfKf 2.5 0.8 1.0 2.6 2.9 1.6 1.5 2.4 1.6 NfPfKfMN 2.9 0.7 1.0 2.4 3.4 1.8 1.4 2.3 1.6 LSD (0.05) ns ns ns ns ns ns ns ns ns
2017 2017 30 76 122 243 74 122 243 304
NfPfK240 2.3 0.9 1.0 2.8 1.6 1.0 1.2 2.8 NfPfKf 2.6 0.9 1.0 2.5 1.7 1.2 1.2 2.7 NfPfKfMN 2.4 1.0 1.0 3.1 1.7 1.1 1.1 2.7 LSD (0.05) ns ns ns ns ns ns ns ns
J.G. Adiele et al.
European Journal of Agronomy 124 (2021) 126242
12
Kiniry, J., Simpson, C., Schubert, A., Reed, J., 2005. Peanut leaf area index, light interception, radiation use efficiency, and harvest index at three sites in Texas. Field Crop Res. 91, 297–306.
Kumar, U., Singh, P., Boote, K., 2012. Effect of climate change factors on processes of crop growth and development and yield of groundnut (Arachis hypogaea L.). Adv. Agron. 116, 41–69.
Lal, R., Maurya, P., 1982. Root growth of some tropical crops in uniform columns. Plant Soil 68, 193–206.
Matthews, R., Hunt, L., 1994. GUMCAS: a model describing the growth of cassava (Manihot esculenta L. Crantz). Field Crop Res. 36, 69–84.
Monteith, J.L., 1977. Climate and the efficiency of crop production in Britain. Phil. Trans. R. Soc. Lond. B 281, 277–294.
Pellet, D., El-Sharkawy, M.A., 1997. Cassava varietal response to fertilization: growth dynamics and implications for cropping sustainability. Exp. Agric. 33, 353–365.
Penning de Vries, F., 1989. Simulation of Ecophysiological Processes of Growth in Several Annual Crops. Simulation Monographs. Pudoc, Den Hague.. Available at https://edepot.wur.nl/108856. Accessed on September 11, 2019.
R Core Team, 2019. R: A Language and Environment for Statistical Computing. R Foundation for Statistical Computing, Vienna. Available at https://www.R-project. org. Accessed on November 4, 2019.
Rezig, M., Sahli, A., Hachicha, M., Jeddi, F.B., Harbaoui, Y., 2013. Light interception and radiation use efficiency from a field of potato (Solanum tuberosum L.) and Sulla (Hedysarum coronarium L.) intercropping in Tunisia. Asian J. Crop Sci. 5, 378–392.
Rosenthal, D.M., Ort, D.R., 2012. Examining cassava’s potential to enhance food security under climate change. Trop. Plant Biol. 5, 30–38.
Shah, S., McKenzie, B., Gaunt, R., Marshall, J.W., Frampton, C., 2004. Effect of production environments on radiation interception and radiation use efficiency of potato (Solanum tuberosum) grown in Canterbury, New Zealand. N. Z. J. Crop Hortic. Sci. 32, 113–119.
Sinclair, T.R., Muchow, R.C., 1999. Radiation use efficiency. Adv. Agron. 65, 215–265. Spitters, C., 1989. Crop growth models: their usefulness and limitations. VI Symposium
on the Timing of Field Production of Vegetables. Acta Hort. 267, 349–368. Spitters, C., Schapendonk, A., 1990. Evaluation of breeding strategies for drought
tolerance in potato by means of crop growth simulation. Plant Soil 123, 193–203. Tripathi, A.M., Pohankova, E., Fischer, M., Orsag, M., Trnka, M., Klem, K., Marek, M.V.,
2018. The evaluation of radiation use efficiency and leaf area index development for the estimation of biomass accumulation in short rotation poplar and annual field crops. Forests 9, 168.
Ukhurebor, K., Abiodun, I., 2018. Variation in annual rainfall data of forty years (1978- 2017) for South-South, Nigeria. J. Appl. Sci. Environ. Manage. 22, 511–518.
van den Beuken, R., 2018. Water Availability and Potassium Uptake of Cassava in Nigeria. MSc Thesis. Wageningen University, NL, pp. 69.
van Ittersum, M.K., Rabbinge, R., 1997. Concepts in production ecology for analysis and quantification of agricultural input-output combinations. Field Crop Res. 52 (3), 197–208.
van Ittersum, M.K., Leffelaar, P.A., Van Keulen, H., Kropff, M.J., Bastiaans, L., Goudriaan, J., 2003. On approaches and applications of the Wageningen crop models. Eur. J. Agron. 18, 201–234.
van Ittersum, M.K., Cassman, K.G., Grassini, P., Wolf, J., Tittonell, P., Hochman, Z., 2013. Yield gap analysis with local to global relevance—a review. Field Crop Res. 143, 4–17.
Veltkamp, H., 1985. Physiological Causes of Yield Variation in Cassava (Manihot Esculenta Crantz). PhD Thesis. Wageningen University, NL, pp. 132.
Zhou, Z., Andersen, M.N., Plauborg, F., 2016. Radiation interception and radiation use efficiency of potato affected by different N fertigation and irrigation regimes. Eur. J. Agron. 81, 129–137.
J.G. Adiele et al.