a report on the economic impact of recovery act capital
TRANSCRIPT

Public Housing Stimulus Funding: A Report on the Economic Impact of Recovery Act Capital Improvements

Stimulus Funding National Summary Impacts Econsult Corporation
1
Index
1.0 Introduction Page 3
1.1 Public Housing Resident and Portfolio Characteristics Page 3
1.2 Public Housing Subsidies Page 3
1.3 Capital Backlog Page 4
1.4 2007 Study on Economic Benefits of Public Housing Page 4
1.5 American Recovery and Reinvestment Act Page 4
1.6 Study Objectives Page 5
2.0 Economic Impacts Defined Page 6
3.0 Economic Impacts of Recovery Act Capital Projects Page 7
3.1 Recovery Act Capital Projects Page 7
3.2 Impact of Recovery Act Funds on Properties and Units Page 9
3.3 Leveraged Funds Page 10
3.3 Economic Impacts Page 12
4.0 Conclusions Page 17
5.0 Cambridge Page 18
6.0 Portland Page 23

Stimulus Funding National Summary Impacts Econsult Corporation
2
Economic Activity> For each $1.00 in direct PHA stimulus spending, there is
an additional $2.12 of indirect & induced economic activity nationwide for a total economic impact of $3.12.
> The twenty sampled PHAs spent more than $1.2 billion on all Recovery Act capital projects, resulting in total economic output stemming from these funds to nearly $3.8 billion – close to the entire amount of Recovery Act funds provided to all public housing
Jobs & Wages> On average, every $1 million spent on Recovery Act capital
projects created 26 jobs nationally, surpassing several other sectors of the economy.
> Every $1 million spent by PHAs on capital improvements resulted in $1 million in salaries nationwide.
Leveraging> The PHAs in the study used their $700 million in Recovery
Act funds to obtain more than $500 million in additional leveraged funds and accelerated capital fund expenditures, for a total investment of $1.2 billion.
Housing> Respondents used funds to complete work on more than
54,000 units at nearly 300 properties, confirming HUD’s report that 245,000 units have been renovated to date.
> More than 1,800 units were brought back online by the survey participants – particularly important when demand for affordable housing is at an all time high.
These findings are additional proof that investing in public housing not only provides safe and decent housing for some of our most vulnerable populations, but is also a smart investment for communities and the nation.
It is worth noting that adequate public housing capital funding simultaneously addresses some of the major domestic problems facing the nation: the severe shortage of affordable housing, the continuing high unemployment rate, and the urgent need to use federal funds more efficiently. This kind of targeted spending is also playing a significant role in helping meet tough new energy efficiency standards increasingly being adopted by cities and states.
With criticism of government at an all-time high, it is essential that we continue to highlight and learn from programs that work. Public housing is a model for smart government investment, and public housing authorities are leading the way in creating and strengthening our communities in replicable ways.
Executive Summary
Summary of Findings
Public housing occupies a unique and essential place on the affordable housing spectrum. It is home to about 2.2 million low-income families, seniors and people with disabilities. A multibillion dollar asset, public housing authorities’ (PHAs) spending on operations and capital improvements also generates significant economic activity.
On February 17, 2009, President Obama signed the Recovery Act, which included $4 billion in public housing capital funds. A significant reason for that provision was the finding from a 2007 Econsult study -- as cited in language accompanying the legislation – that every dollar that public housing agencies spend on capital and maintenance produces $2.12 in local economic activity.
In addition to providing badly needed funding to housing agencies across the country, this investment provided an opportunity to build on the 2007 report by examining the impact of large-scale capital spending on the national economy. While the 2007 study assessed the local and regional economic impact of capital repairs and maintenance spending by PHAs, this study focuses on the national economic impact of Recovery Act capital spending by PHAs. The report also measures the long-term physical and operating impact on the public housing portfolios of 20 agencies. The study accomplishes this by using data provided by these agencies on the types of projects being completed, the number of jobs being created, and the estimated impact on utilities consumption and spending.
PHAs spent the money quickly, ahead of a shorter than normal obligation period, despite additional reporting requirements and regulations regarding the use of the funds. They created thousands of jobs, brought thousands of new or rehabbed units online and leveraged billions more in additional funds.

Stimulus Funding National Summary Impacts Econsult Corporation
3
1.0 Introduction
In 2007, The Econsult Corporation (Econsult) completed the first-ever study1 of the economic impact of public housing expenditures. The study provided assessments of the impacts of PHA spending on operating expenses, and capital and maintenance expenses in 10 metropolitan areas. The study also determined the overall value of the existing public housing stock.
In 2009, approximately 3,100 housing authorities received $4 billion in public housing capital funds from the American Recovery and Reinvestment Act (Recovery Act). This large one-time investment provided an opportunity to build on the earlier study, examining the impact of large-scale capital improvement spending on the local, state and national economies. It was also an opportunity to study the long-term physical and operating impact on the national portfolio.
This study includes data from 20 housing authorities on their ongoing Recovery Act projects, work that reflects the types of projects housing authorities routinely engage in with capital funds.
1.1 Public Housing Resident and Portfolio Characteristics2
Approximately 2.2 million low-income individuals reside in more than 1.15 million public housing units nationwide. More than half of the families that reside in public housing are headed by a senior or person with disabilities, and more than 40 percent of households have at least one child.
The majority of families residing in public housing are extremely or very low-income with family incomes well below the federal poverty threshold. In 2009, the median household income in public housing was approximately $9,700, nearly $5,000 less than the federal poverty threshold for families of two, and only 26.8 percent of the national median income. More than 95 percent of non-elderly, non-disabled households reported income from wages in 2009, however more than half of all households have a fixed income.
Approximately 40 percent of public housing units, and 21 percent of properties are located in large cities or suburbs with populations of more than 250,000 people. About 12 percent of units and 11 percent of properties are located in medium sized cities and suburbs with populations above 100,000 but less than 250,000 people. The remaining 48 percent of units and 68 percent of properties are located in small cities and suburbs or rural areas. About 62 percent of properties are considered family properties, while 38 percent are considered elderly based on the primary unit type in each building.
1.2 Public Housing Subsidies
In general, PHAs receive two grants per year to operate and improve public housing. The operating subsidy covers maintenance, property management, utilities, and some other costs. The amount of operating subsidy that a housing authority is eligible to receive is based on a formula that includes operating and utility costs, and is offset by the amount of rental income received from residents. In calendar year 2009, PHAs were eligible to receive $5.03 billion nationally for these operating costs, but were only funded at 88.6 percent of need, marking the 7th consecutive year with operating funding below need, and the 10th time in the previous 11 years.
The capital subsidy provides funding for capital improvements and redevelopment. It is distributed based on a formula, with each PHA receiving a proportional share of the annually appropriated amount of public housing capital funds. The amount of capital funds that PHAs have received has dwindled over the past decade, from $3 billion in 2001 to about $2.4 billion in 2009.
1 Econsult, Assessing the Economic Benefits of Public Housing: Final Report, 2007. http://www.clpha.org/economic_study_executive_summary2 Resident characteristic data is available using HUD’s Resident Characteristics Report.

Stimulus Funding National Summary Impacts Econsult Corporation
4
1.3 Capital Backlog
In January 2000, Abt Associates, Inc, studied3 the capital needs of the public housing stock and found that the existing modernization needs were about $22 billion. The study also found that new capital needs accrued at about $2 billion per year.
In 2008, the Center on Budget and Policy Priorities (CBPP) released a paper4 that discussed strategies for preserving public housing. CBPP estimated that the $2.4 billion appropriated for the capital fund in 2008 was “…32 percent below the 2001 level in inflation-adjusted terms…” and was below the level needed to fund ongoing capital accrual. The paper also estimated that due to underfunding or ongoing capital needs, and because the 2000 Abt study was limited to a repair and replacement standard of existing building systems and did not consider needs related to aging populations in public housing, that the backlog had likely grown to $32 billion.
1.4 2007 Study on Economic Benefits of Public Housing
In 2007, Econsult, in collaboration with the Council of Large Public Housing Authorities (CLPHA), the Public Housing Authorities Directors Association (PHADA), and the Housing Authority Insurance Group (HAI), conducted a study that assessed the economic benefits of public housing. The study determined these benefits by examining the impact of spending by 10 large PHAs. The study also assessed the replacement value of public housing. Among its more significant findings:
The approximate replacement value of the existing public housing stock is $145 billion, excluding land costs.•
On average, every dollar spent by PHAs on capital and maintenance results in $2.12 of economic activity in the local •
economies of the 10 agencies that participated in the study.
Every $1 million spent by PHAs on capital and maintenance supports about 13 jobs in the local economies of the •
studied agencies.
1.5 American Recovery and Reinvestment Act
On February 17, 2009, President Obama signed the $787 billion Recovery Act to stimulate the economy; it included $4 billion in public housing capital funds. The accompanying report to the House-passed bill and a committee summary of the major provisions in the bill cited the 2007 economic impact report, stating that “every dollar of Capital Fund expenditures produces $2.12 in economic return.” Of the $4 billion, $3 billion was allocated through the capital fund formula, and $1 billion was allocated through a competitive grant process for green retrofits and new green construction; elderly and disabled accessibility; gap financing for stalled projects; and the revitalization of distressed housing.
The $3 billion was dispersed to more than 3,100 housing authorities beginning in March 2009. Housing authorities had one year to obligate and three years to spend the funds – an accelerated schedule that included additional regulations on how the money could be spent.5 The $1 billion in competitive grants was dispersed beginning in September 2009. Of the 1,800 total applications, about 400 competitive grants were awarded.
3 Meryl Finkel et al., eds, Abt Associates Inc., Capital Needs of the Public Housing Stock in 1998: Formula Capital Study, 2000. 4 Barbara Sard and Will Fischer, The Center on Budget and Policy Priorities, Preserving Safe, High Quality Public Housing Should be a Priority
of Federal Housing Policy, 2008. 5 The standard schedule is two years to obligate and four years to spend funds.

Stimulus Funding National Summary Impacts Econsult Corporation
5
1.6 Study Objectives
As public housing authorities spend the total $4 billion on capital improvement projects, there will undoubtedly be a variety of net positive economic impacts in both the regional (local) economies and the nation as a whole. In this study, we address three general questions with respect to the economic benefit provided though the Recovery Act:
What is the economic impact in terms of jobs created and additional spending generated by PHA capital improvements?•
Did the capital improvements generate any operating cost savings?•
Did the improvements make additional housing units available?•
In order to better understand the extent of the overall impacts attributable to this spending, Econsult, CLPHA, PHADA, and the National Association of Housing and Redevelopment Officials (NAHRO) distributed a survey to housing authorities nationwide. The survey was designed to supplement the job creation data already being collected by HUD.
As part of the analysis, Econsult:
Prepared national, state, and regional economic impact estimates, including direct and indirect employment and •
economic activities associated with the stimulus-related capital investments made by approximately 20 public housing authorities
Determined the long-term benefit of the capital improvements by collecting information on utility usage, maintenance •
costs, and the number of units brought online.
The 20 markets were selected based on geographic and market diversity, as well as the willingness of each PHA to complete the survey and share it with the survey team. While this sample of markets is not statistically representative of all public housing markets, and the types of projects that are being completed may not be statistically representative of the types of projects being completed by each PHA, the results do provide insight about the economic impact and the long-term property benefits of capital expenditures by PHAs.
Stimulus Funding National Summary Impacts Econsult Corporation
6
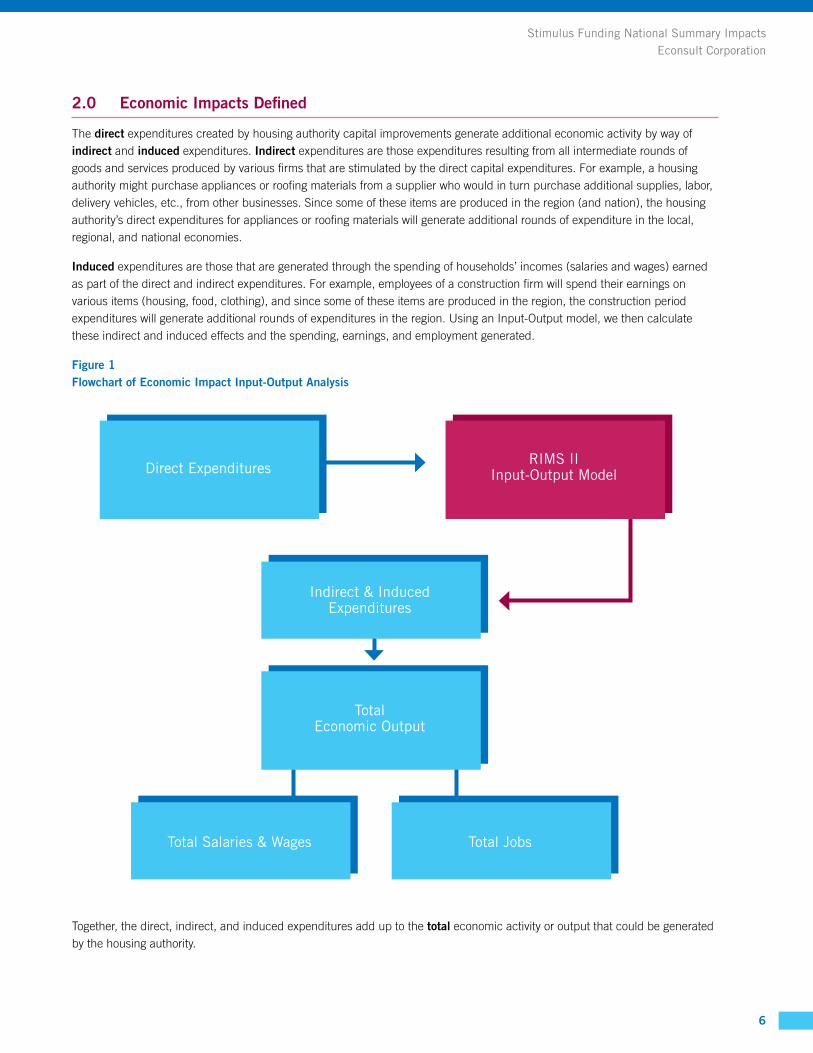
2.0 Economic Impacts Defined
The direct expenditures created by housing authority capital improvements generate additional economic activity by way of indirect and induced expenditures. Indirect expenditures are those expenditures resulting from all intermediate rounds of goods and services produced by various firms that are stimulated by the direct capital expenditures. For example, a housing authority might purchase appliances or roofing materials from a supplier who would in turn purchase additional supplies, labor, delivery vehicles, etc., from other businesses. Since some of these items are produced in the region (and nation), the housing authority’s direct expenditures for appliances or roofing materials will generate additional rounds of expenditure in the local, regional, and national economies.
Induced expenditures are those that are generated through the spending of households’ incomes (salaries and wages) earned as part of the direct and indirect expenditures. For example, employees of a construction firm will spend their earnings on various items (housing, food, clothing), and since some of these items are produced in the region, the construction period expenditures will generate additional rounds of expenditures in the region. Using an Input-Output model, we then calculate these indirect and induced effects and the spending, earnings, and employment generated.
Figure 1 Flowchart of Economic Impact Input-Output Analysis
Together, the direct, indirect, and induced expenditures add up to the total economic activity or output that could be generated by the housing authority.
Total Economic Output
Indirect & Induced Expenditures
Total Salaries & Wages Total Jobs
Direct ExpendituresRIMS II
Input-Output Model

Stimulus Funding National Summary Impacts Econsult Corporation
7
Earnings and Employment Impacts
We also estimated the economic impacts of housing authority projects in terms of total earnings (wages and salaries) and total employment. Based on the direct expenditures of each housing authority, the Input-Output models can be used to generate estimates of earnings and employment based on the total spending in the industries.
In order to estimate these economic impact estimates, input-output models are used to estimate the inter- and intra-industry relationships for the local, regional and national economies. Specifically, we use the RIMS II (Regional Input-Output Modeling System) multipliers, which are maintained by the Bureau of Economic Analysis at the U.S. Department of Commerce.
Figure 2 Housing Authority Survey Respondents
The housing authorities included in the study, as shown in Figure 2 on PAGE 6, collectively own and manage approximately 25 percent of the public housing stock and received about 18 percent of all Recovery Act funds.
3.0 Economic Impacts of Recovery Act Capital Projects
This section details the amount of additional funding leveraged6 using recovery act funding, they types of Recovery Act projects7 completed, and the economic impact on the national economy.
3.1 Recovery Act Capital Projects
PHAs are statutorily restricted in the types of projects that can be completed using capital funds. In general, PHAs may only use these funds for modernization, development, financing, vacancy reduction, non-routine maintenance, management improvements, code compliance, economic self-sufficiency, and transfers to operations. The Recovery Act prevented PHAs from transferring funds to operations, and shortened the timeframe for PHAs to obligate and spend their resources. As a result, many agencies used funds on projects that were already in their capital plans. Others used the funds to build or obtain new housing.8 Table 1, on the next page, shows the general types of capital projects that the sampled PHAs completed using Recovery Act funds.
6 Leveraged funds include all other funds (private and public) that were used to complete projects with any Recovery Act funding, including
other public housing funds. HUD defined leveraged funds, for the purposes of awarding points for applications for the Recovery Act
competitive grants, as non-public housing funds.7 Recovery Act project includes any capital improvement project or other capital expenditure by a PHA that used Recovery Act capital funds.8 All agencies were required to amend their five-year plans to include projects that would be completed using Recovery Act capital funds.

Stimulus Funding National Summary Impacts Econsult Corporation
8
Table 1 Recovery Act Project Descriptions9
Akron Housing Authority unit rehab/modernization, environmental assessments, technology upgrades
Belding Housing Commission re-roofing of buildings
Brunswick Housing Authority repaving and elevator repairs
Burlington Housing Authority roof replacements
Cambridge Housing Authority unit modernization and revitalization, heating/ventilation, federalization of state housing
Charlotte Housing Authority site lighting, hot water heater replacement, HVAC upgrades, computer lab, landscaping
Chicago Housing Authority unit rehab, demolition, energy efficiency, ADA upgrades, green communities
Housing Authority of Fresno County unit acquisition/upgrades, site accessibility improvements
Housing Authority of Kansas City site acquisition, new unit development, unit rehab/modernization
Housing Authority of McDonough County parking lot renovation
Housing Authority of Portland fencing, playground equipment, parking lot, landscaping, carpentry, painting, kitchen remodeling, resident relocation, HVAC, electrical
Housing Authority of San Antonio playground equipment, HVAC, elevators, fire/security, roofing
Housing Authority of the city of Erie, PA energy conservation improvements
New York City Housing Authority roofing, unit restoration, oil tank replacement, elevator, heating upgrades, structural repairs
Paterson Housing Authority demolition, painting, window upgrades
Puerto Rico lighting, asbestos removal, painting, roofing, playground, paving, water heater, modernization
Trenton Housing Authority stair towers, unit rehab
Winnebago County Housing Authority building revitalization
Winslow Public Housing Department appliances, storage facility, painting, wheelchair accessibility
York Housing Authority back up generator
Source: Econsult Corporation 9 The types of projects listed in Table 1 do not necessarily reflect the projects completed by all 3,100 housing authorities.
Housing Authority Name Project Descriptions

Stimulus Funding National Summary Impacts Econsult Corporation
9
3.2 Impact of Recovery Act Funds on Properties and Units
PHA spending on capital improvements will improve accessibility for residents, provide opportunities for children to play and exercise safely, reduce energy and water consumption—all while extending the useful life of the property.
Eighteen of the 20 sampled PHAs made capital improvements in properties that contain more than 77,000 units, and all agencies reported improvements at 289 Asset Management Projects (AMPs). Five of the agencies reported bringing over 1,800 new housing units online, while 17 of the 20 agencies reported improving nearly 54,000 housing units. Table 3 provides a detailed breakdown of summary information for each housing authority.
Table 2 Summary Background Information10
Akron Housing Authority 22
Belding Housing Commission 140 1 120
Brunswick Housing Authority 191 1 141
Burlington Housing Authority 90 1 90
Cambridge Housing Authority 1,316 7 438 791
Charlotte Housing Authority 2,517 12 2,320
Chicago Housing Authority 10,824 98 896 1,901
Housing Authority of Fresno County 396 5 231 299
Housing Authority of Kansas City 180 1 180
Housing Authority of McDonough County 98 1 98
Housing Authority of Portland 511 18 130 511
Housing Authority of San Antonio 20
Housing Authority of the city of Erie, PA 143 1 122
New York City Housing Authority 48,725 45 36,485
Paterson Housing Authority 1,190 3 1,190
Puerto Rico 9,050 46 9,050
Trenton Housing Authority 1,576 4 121 304
Winnebago County Housing Authority 150 1 150
Winslow Public Housing Department 55 1
York Housing Authority 75 1 75
Grand Total 77,227 289 1,816 53,827
Housing Authority Name Total AMP Units AMP Projects Units Bought Online Due to Project
Preserved Housing Units
Source: Econsult Corporation
10 The Housing Authorities of Akron and San Antonio responded to a shorter version of the survey than the rest of the agencies.
They were not asked questions regarding the number of AMP units, the number of project days, the number of units brought
online, or the number of units.

Stimulus Funding National Summary Impacts Econsult Corporation
10
3.3 Leveraged Funds
As discussed earlier, public housing capital needs have been historically underfunded. This underfunding combined with numerous federal regulations made it difficult to comprehensively improve public housing properties. As a result, many properties fell into disrepair or became distressed. In 1992, in order to combat these problems, Congress enacted a demonstration program that was the predecessor to HOPE VI. HOPE VI was designed to provide large capital grants to replace deteriorating public housing properties. Despite relatively large grant amounts, the individual HOPE VI grants were inadequate to pay for the total redevelopment costs. This led many applicants to seek other sources of funds that were difficult to secure or could not be used in tandem with public housing funding such as low-income housing tax credits. The inability to use public housing funding to leverage additional tax credit equity led to an opinion by HUD’s general counsel in 1994 that allowed new ownership structures to facilitate tax credit and other types of private sector investment in public housing provided that the housing continued to be operated as public housing. Together, HOPE VI and the “Diaz Opinion” laid the ground work for mixed-finance transactions. Since the Diaz opinion, PHAs have used HOPE VI seed money and other public sources of funding to leverage both other public and non-public funding – including low-income housing tax credit equity - to transform entire neighborhoods. Since the program’s inception, PHAs have been able to leverage more than $1.63 for every dollar of HOPE VI funds.
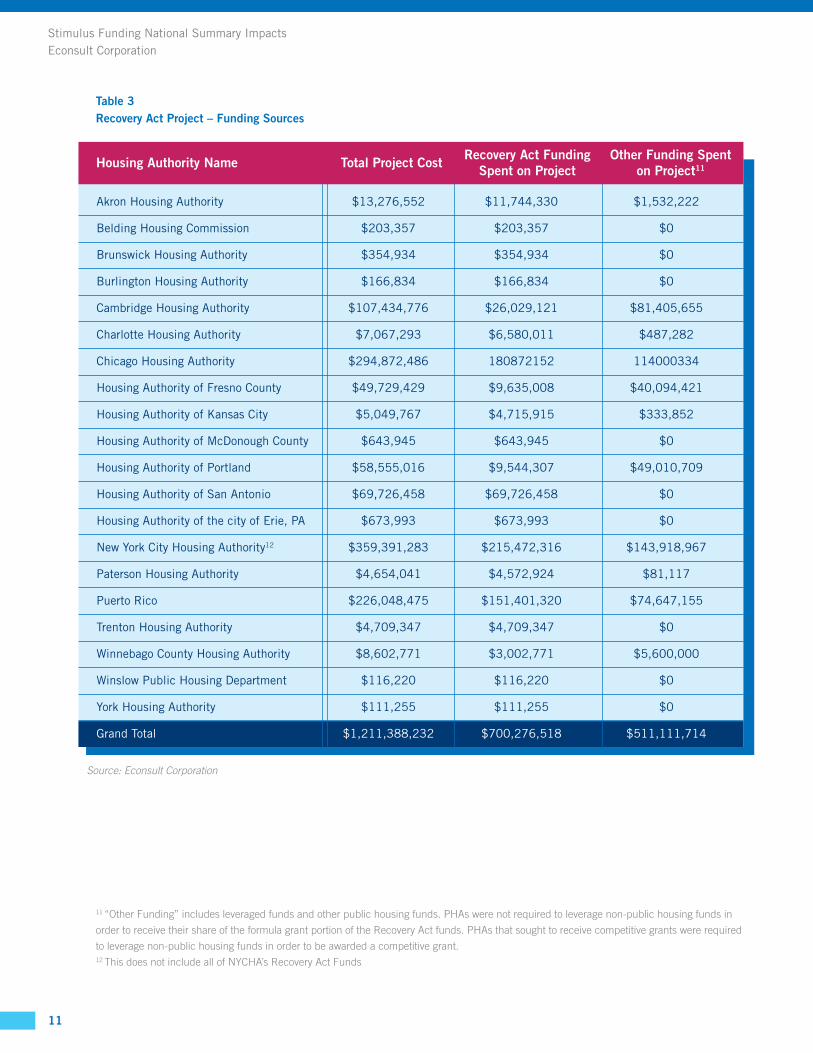
In order to complete the projects detailed in Table 1, PHAs used Recovery Act funding in concert with leveraged funds and accelerated public housing capital funds to maximize the impact of each Recovery Act project. The PHAs in the study used their $700 million in Recovery Act funds to leverage an additional $511 million for a total of more than $1.2 billion in direct expenditures. Table 3 page provides details on the project costs and source of funding.
Stimulus Funding National Summary Impacts Econsult Corporation
11
Source: Econsult Corporation
Table 3 Recovery Act Project – Funding Sources
Akron Housing Authority $13,276,552 $11,744,330 $1,532,222
Belding Housing Commission $203,357 $203,357 $0
Brunswick Housing Authority $354,934 $354,934 $0
Burlington Housing Authority $166,834 $166,834 $0
Cambridge Housing Authority $107,434,776 $26,029,121 $81,405,655
Charlotte Housing Authority $7,067,293 $6,580,011 $487,282
Chicago Housing Authority $294,872,486 180872152 114000334
Housing Authority of Fresno County $49,729,429 $9,635,008 $40,094,421
Housing Authority of Kansas City $5,049,767 $4,715,915 $333,852
Housing Authority of McDonough County $643,945 $643,945 $0
Housing Authority of Portland $58,555,016 $9,544,307 $49,010,709
Housing Authority of San Antonio $69,726,458 $69,726,458 $0
Housing Authority of the city of Erie, PA $673,993 $673,993 $0
New York City Housing Authority12 $359,391,283 $215,472,316 $143,918,967
Paterson Housing Authority $4,654,041 $4,572,924 $81,117
Puerto Rico $226,048,475 $151,401,320 $74,647,155
Trenton Housing Authority $4,709,347 $4,709,347 $0
Winnebago County Housing Authority $8,602,771 $3,002,771 $5,600,000
Winslow Public Housing Department $116,220 $116,220 $0
York Housing Authority $111,255 $111,255 $0
Grand Total $1,211,388,232 $700,276,518 $511,111,714
Housing Authority Name Total Project Cost Recovery Act Funding Spent on Project
Other Funding Spent on Project11
11 “Other Funding” includes leveraged funds and other public housing funds. PHAs were not required to leverage non-public housing funds in
order to receive their share of the formula grant portion of the Recovery Act funds. PHAs that sought to receive competitive grants were required
to leverage non-public housing funds in order to be awarded a competitive grant. 12 This does not include all of NYCHA’s Recovery Act Funds
Stimulus Funding National Summary Impacts Econsult Corporation
12
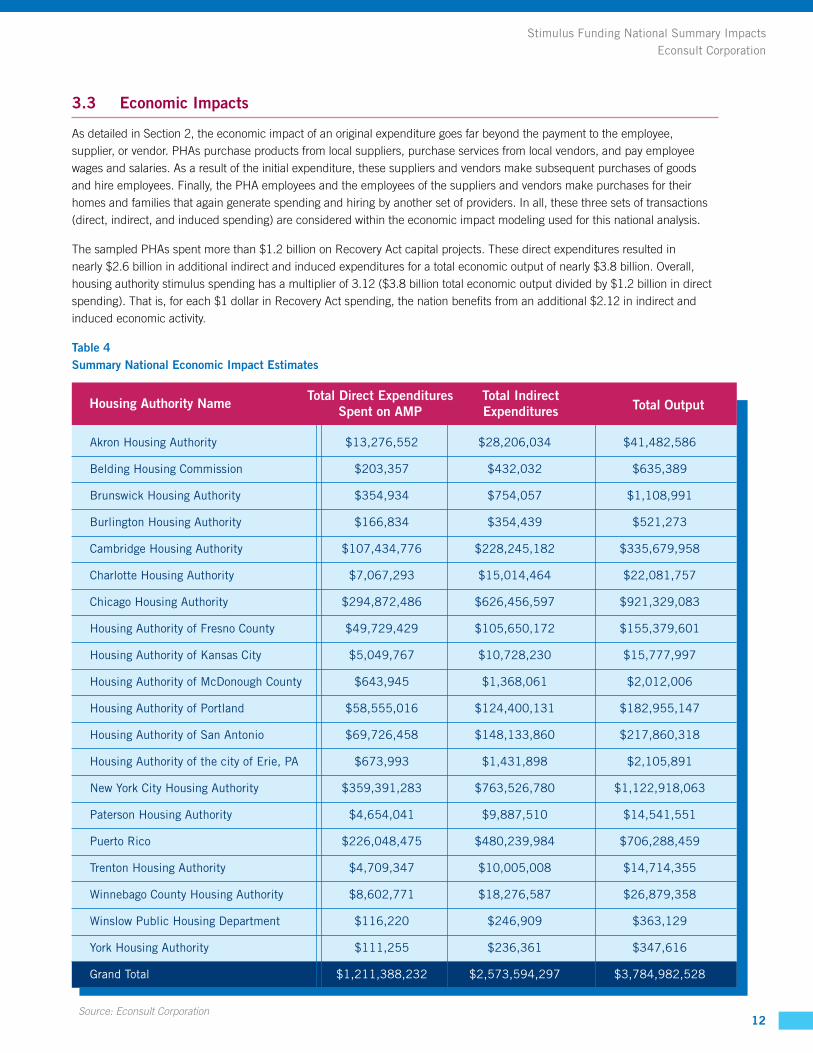
3.3 Economic Impacts
As detailed in Section 2, the economic impact of an original expenditure goes far beyond the payment to the employee, supplier, or vendor. PHAs purchase products from local suppliers, purchase services from local vendors, and pay employee wages and salaries. As a result of the initial expenditure, these suppliers and vendors make subsequent purchases of goods and hire employees. Finally, the PHA employees and the employees of the suppliers and vendors make purchases for their homes and families that again generate spending and hiring by another set of providers. In all, these three sets of transactions (direct, indirect, and induced spending) are considered within the economic impact modeling used for this national analysis.
The sampled PHAs spent more than $1.2 billion on Recovery Act capital projects. These direct expenditures resulted in nearly $2.6 billion in additional indirect and induced expenditures for a total economic output of nearly $3.8 billion. Overall, housing authority stimulus spending has a multiplier of 3.12 ($3.8 billion total economic output divided by $1.2 billion in direct spending). That is, for each $1 dollar in Recovery Act spending, the nation benefits from an additional $2.12 in indirect and induced economic activity.
Table 4 Summary National Economic Impact Estimates
Akron Housing Authority $13,276,552 $28,206,034 $41,482,586
Belding Housing Commission $203,357 $432,032 $635,389
Brunswick Housing Authority $354,934 $754,057 $1,108,991
Burlington Housing Authority $166,834 $354,439 $521,273
Cambridge Housing Authority $107,434,776 $228,245,182 $335,679,958
Charlotte Housing Authority $7,067,293 $15,014,464 $22,081,757
Chicago Housing Authority $294,872,486 $626,456,597 $921,329,083
Housing Authority of Fresno County $49,729,429 $105,650,172 $155,379,601
Housing Authority of Kansas City $5,049,767 $10,728,230 $15,777,997
Housing Authority of McDonough County $643,945 $1,368,061 $2,012,006
Housing Authority of Portland $58,555,016 $124,400,131 $182,955,147
Housing Authority of San Antonio $69,726,458 $148,133,860 $217,860,318
Housing Authority of the city of Erie, PA $673,993 $1,431,898 $2,105,891
New York City Housing Authority $359,391,283 $763,526,780 $1,122,918,063
Paterson Housing Authority $4,654,041 $9,887,510 $14,541,551
Puerto Rico $226,048,475 $480,239,984 $706,288,459
Trenton Housing Authority $4,709,347 $10,005,008 $14,714,355
Winnebago County Housing Authority $8,602,771 $18,276,587 $26,879,358
Winslow Public Housing Department $116,220 $246,909 $363,129
York Housing Authority $111,255 $236,361 $347,616
Grand Total $1,211,388,232 $2,573,594,297 $3,784,982,528
Housing Authority Name Total Indirect Expenditures Total Output
Total Direct Expenditures Spent on AMP
Source: Econsult Corporation

Stimulus Funding National Summary Impacts Econsult Corporation
13
In addition to generating additional economic activity, the level of economic activity generated by these agencies surpassed a number of other industries in terms of total economic output and salaries and wages. For example, for every $1 million spent by housing authorities, they generated $3.12 million in economic activity, and $1 million in salaries. In comparison, professional services generated $2.8 million in economic activity and $1 million in salaries, while real estate generated $1.8 million and only $300,000 in salaries and wages. Figure 3 provides a comparison of the economic impact and the salaries and wages generated for every $1 million spent by various industries.
Figure 3 Economic Impact and Salaries Generated Per $1 Million Spent By Various Industries
3.5
3.0
2.5
2.0
1.5
1.0
0.5
0.0
$3.1
$2.8
$2.6
$2.4 $2.4
$1.8
$1.0 $1.0
$0.8
$0.6 $0.6
$0.3
HA Am
p Sp
endin
g
Profe
ssion
al Se
rvice
s
Retail Tra
de
Telec
ommun
icatio
ns
Utiliti
es
Real E
state
Total Economic ActivityTotal Salaries
Source: Econsult Corporation

Stimulus Funding National Summary Impacts Econsult Corporation
14
The study estimates that the total economic impact of nearly $3.8 billion will include over $1.2 billion in total salaries and wages, supporting more than 31,400 total jobs, including over 14,580 direct jobs and 16,820 indirect jobs. Table 5 summarizes the jobs created and total salaries and wages generated by each PHA.
Table 5 Summary Job & Earnings Estimates National
Akron Housing Authority 160 184 344 $13,204,858
Belding Housing Commission 2 3 5 $202,259
Brunswick Housing Authority 4 5 9 $353,017
Burlington Housing Authority 2 2 4 $165,933
Cambridge Housing Authority 1,294 1,492 2,785 $106,854,628
Charlotte Housing Authority 85 98 183 $7,029,130
Chicago Housing Authority 3,551 4,094 7,645 $293,280,175
Housing Authority of Fresno County 599 690 1,289 $49,460,890
Housing Authority of Kansas City 61 70 131 $5,022,498
Housing Authority of McDonough County 8 9 17 $640,468
Housing Authority of Portland 705 813 1,518 $58,238,819
Housing Authority of San Antonio 840 968 1,808 $69,349,935
Housing Authority of the city of Erie, PA 8 9 17 $670,353
New York City Housing Authority 4,328 4,990 9,318 $357,450,570
Paterson Housing Authority 56 65 121 $4,628,909
Puerto Rico 2,722 3,139 5,861 $224,827,813
Trenton Housing Authority 57 65 122 $4,683,917
Winnebago County Housing Authority 104 119 223 $8,556,316
Winslow Public Housing Department 1 2 3 $115,592
York Housing Authority 1 2 3 $110,654
Grand Total 14,588 16,820 31,408 $1,204,846,735
Housing Authority Name Direct Jobs Indirect Jobs Total Jobs Total Salaries & Wages
Source: Econsult Corporation

Stimulus Funding National Summary Impacts Econsult Corporation
15
Housing authority Recovery Act spending has a job multiplier of 2.15 (31,408 total jobs divided by 14,588 direct jobs). For each direct job, an additional 1.15 indirect jobs are created. In addition, for every $1 million spent by PHAs on Recovery Act capital projects, on average, 26 direct, indirect, and induced jobs were supported. This estimate of the number of direct and indirect jobs created surpasses several other industries as detailed in Figure 4.
Figure 4Jobs Created Per $1 Million Spent By Various Industries
30
25
20
15
10
5
0
$2.8
$2.6
$2.4 $2.4
$1.8
HA Am
p Sp
endin
g
Profe
ssion
al Se
rvice
s
Retail Tra
de
Telec
ommun
icatio
ns
Utiliti
es
Real E
state
Total Jobs
26
22
27
13 12
9
Stimulus Funding National Summary Impacts Econsult Corporation
16
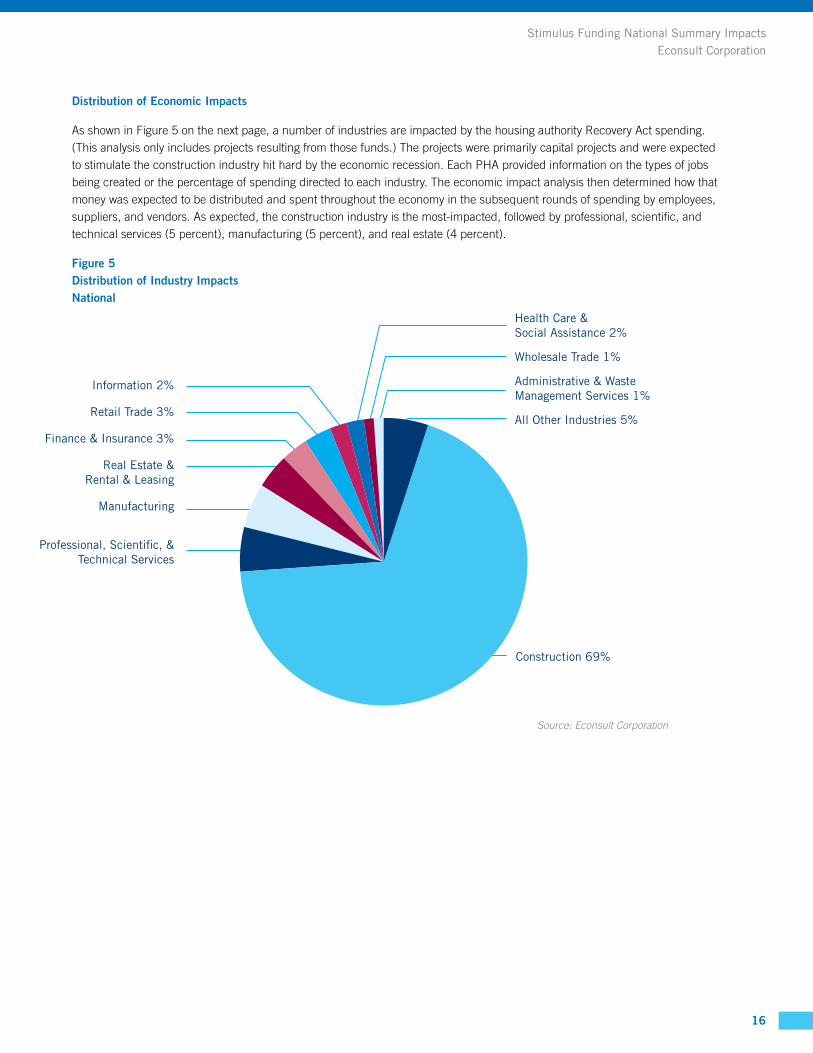
Distribution of Economic Impacts
As shown in Figure 5 on the next page, a number of industries are impacted by the housing authority Recovery Act spending. (This analysis only includes projects resulting from those funds.) The projects were primarily capital projects and were expected to stimulate the construction industry hit hard by the economic recession. Each PHA provided information on the types of jobs being created or the percentage of spending directed to each industry. The economic impact analysis then determined how that money was expected to be distributed and spent throughout the economy in the subsequent rounds of spending by employees, suppliers, and vendors. As expected, the construction industry is the most-impacted, followed by professional, scientific, and technical services (5 percent), manufacturing (5 percent), and real estate (4 percent).
Figure 5Distribution of Industry ImpactsNational
Construction 69%
Information 2%
Retail Trade 3%
Finance & Insurance 3%
Real Estate & Rental & Leasing
Manufacturing
Professional, Scientific, & Technical Services
Health Care & Social Assistance 2%
Wholesale Trade 1%
Administrative & Waste Management Services 1%
All Other Industries 5%
Source: Econsult Corporation

Stimulus Funding National Summary Impacts Econsult Corporation
17
4.0 Conclusions
Facing what many economists considered the worst recession since the Great Depression, the Obama Administration worked with the 111th Congress to create an infrastructure spending and tax cut package designed to fill the economic void left by a lack of capital availability and job losses in the private sector. The Recovery Act provided, among other infrastructure investments, $4 billion to public housing authorities to make capital improvements to a portfolio with an estimated $32 billion in capital backlog.
Within months of receiving their Recovery Act funds, PHAs had begun to obligate and spend these funds on shovel-ready projects. They did so despite an accelerated schedule and additional regulations on how the money could be spent. By the end of the first year, every PHA across the country had obligated all of their Recovery Act Funds, and according to HUD, they are on track to meet their expenditure deadlines in 2011 and 2012.
The PHAs in this study received more than $700 million in Recovery Act Capital Funds provided through a formula and through competitive grants. Using these funds, the agencies obtained more than $500 million in leveraged funds and accelerated capital funds for a total investment of $1.2 billion. Based on this economic impact analysis, in the 20 cities, we found that on average, every $1 spent on Recovery Act projects generated $3.12 in economic activity nationwide. This means that in these 20 cities, these agencies were able to take the one time investment of $1.2 billion (including $700 million in Recovery Act Capital Funds) and generate a total of $3.8 billion in economic activity.
The economic impact analysis also generated estimates of the number of jobs created and the amount of salaries and wages produced. The PHAs reported supporting more than 14,580 direct jobs. Based on our model of the subsequent economic activity, we project that an additional 16,820 jobs were supported nationwide for a total of 31,400 jobs. That means that for every $1 million spent by these PHAs on Recovery Act projects, 26 jobs were supported nationwide, which surpasses several other industries in terms of jobs supported. PHAs also generated more than $1.2 billion in salaries and wages nationwide. On average, our model projects that every $1 million spent by these housing authorities on Recovery Act projects results in $1 million in salaries and wages, surpassing several other industry studied.
In addition to the economic impact of the Recovery Act, there are also long-term benefits to properties and to the residents that reside in such properties. These agencies brought more than 1,800 units online and made improvements to nearly 54,000 units at nearly 300 properties. Additionally, several agencies made improvements that will lower PHA operating costs, including utility costs. The Cambridge Housing Authority, for example, will save more than $500,000 annually on utility costs due to improvements made using Recovery Act funds. Another example is the Resource Access Center (RAC) being built in Portland, Oregon. The RAC “will provide vital resources, shelter, and housing placement services to individuals and couples experiencing homelessness in Portland, and it will be the first LEED Platinum building of its kind in the country.”13
13 The description of the RAC is provided by the Housing Authority of Portland.

Stimulus Funding National Summary Impacts Econsult Corporation
18
Highlights of the Recovery Act Impact in Cambridge and Portland
Introduction PHAs spent about $2 billion on utilities and tenant utility allowances in 2008, about 30 percent of total operating expenses. PHA utility expenses have increased between $300 million and $400 million during the previous decade.
This is why $600 million of the $1 billion in Recovery Act challenge grants was dedicated to innovative green projects such as photovoltaic panels, geothermal heating, green roofs and wind turbines
There are few opportunities to make energy efficiency improvements to their portfolios. In general, PHAs are reimbursed for utility costs based on the three-year average consumption level from the time period ending 6 months in advance of the funding year. If a PHA makes an Energy Conservation Measure (ECM) in their property, the formula will provide savings for only three years before HUD resets their reimbursement level to reflect the lower rates. This rule is an impediment for PHAs to spend general capital funds on ECMs, particularly in light of the substantial capital backlog.
PHAs are also able to enter into Energy Performance Contracts with a third-party for the financing of ECMs. EPCs allow a PHA to freeze their consumption level that is the basis for their subsidy for up to 20 years, and use the savings resulting from the ECM to amortize the loan. Since 2000, there have been approximately 213 EPCs that have affected one-third of all public housing units. The total capital investment is over $700 million, while the annual utility savings is about $118 million. However, there are serious impediments, particularly for smaller and medium sized agencies, particularly related to transaction costs and lender interest.
Several housing authorities also directed formula funds to ECMs during comprehensive modernization of their projects. While spending on energy efficiency varied considerably by housing authorities, agencies that focused funds toward energy efficiency improvements have made strides towards reducing their energy bills. These examples demonstrate how upfront investment can significantly lower costs, in addition to making properties more sustainable.
5.0 Cambridge
Cambridge, Massachusetts is a Boston area suburban city with a population of just over 100,000 residents, in approximately 43,000 households. The median household income in Cambridge is more than $58,000. Approximately 10 percent of households in Cambridge had incomes that fell below the poverty level. More than two-thirds (68 percent) of Cambridge residents are White; 12 percent are Black; 7 percent are Hispanic. The median sales price for a single family home was nearly $800,000 in 2008, while the typical rental price for a 1 bedroom unit in Cambridge was nearly $2,000.
5.1 The Cambridge Housing Authority
The Cambridge Housing Authority (CHA) was established under Massachusetts state law by the City of Cambridge in 1935. Today CHA provides safe, high-quality, affordable housing for approximately 4,000 families through its Public Housing and Housing Choice Voucher programs. Sixty-eight percent of CHA residents make less than 30 percent of Area Median Income (AMI), while 89 percent make less than 50 percent of AMI. The average rent payment in all of CHA’s federal leased housing programs is $384. Approximately 50 percent of CHA households identify themselves as White, while 47 percent identify themselves as Black.
CHA is a charter member of the U.S. Department of Housing and Urban Development (HUD) Moving to Work (MTW) deregulation demonstration program, which allows CHA regulatory and fiscal flexibility to meet local challenges with locally designed solutions. CHA is staffed by over 160 employees and operates with an annual budget of approximately $70 million.

Stimulus Funding National Summary Impacts Econsult Corporation
19
CHA focuses on five core functions:
Ownership and management of over 2,600 units of housing•
Administration of over 2,700 state and federal housing vouchers•
New unit acquisition and development•
Resident services programs•
Innovative program design and administrative reforms•
5.2 Cambridge Housing Authority – Stimulus Funds
CHA was awarded nearly $26 million in Recovery Act public housing funds in 2009 - $4 million was provided through the formula grant, while $22 million was provided through competitive grants for energy efficient improvements and public housing transformation. The total construction budget for all of their seven projects totals more than $107 million, and CHA has leveraged nearly $62 million to supplement the Recovery Act funds. These funds will improve nearly 1,000 units in the CHA portfolio.
5.3 Funding and Leverage Table 5.1: Cambridge Housing Authority AMPs & Funding14
L.B. Johnson 186 0 176 $36,500,000 $10,557,694 $17,228,000 $8,714,306
Lincoln Way and Jackson Gardens 115 98 115 $58,300,000 $10,000,000 $41,385,000 $6,915,000
Washington Elms 176 0 145 $4,911,308 $1,284,651 $0 $3,626,657
State Public Housing Federalization 438 438 438 $2,891,000 $882,000 $2,009,000 $0
Harry S. Truman 66 0 59 $2,762,470 $1,712,470 $1,050,000 $0
Jefferson Park 187 0 10 $1,034,999 $796,153 $0 $238,846
Putnam Gardens 165 0 10 $1,034,999 $796,153 $0 $238,846
TOTAL 1,316 536 936 $107,434,776 $26,029,121 $61,672,000 $19,733,655
Percent 100.0% 24.2% 57.4% 18.4%
AMP NameUnits in Facility
Units Brought Online
Units Improved
Total Project Spending ARRA Spending
Total Leveraged Funding
Other Public Housing Funding Sources
Source: Cambridge Housing Authority
14 CHA received a Recovery Act Competitive Grant for Jefferson Park Apartments after this analysis was under way. They used the formula grant
funds that were originally slated for this project to make additional improvements to other housing units that is not reflected in these estimates.
As a result, these estimates likely underestimate the impact of the Recovery Act projects completed by CHA.

Stimulus Funding National Summary Impacts Econsult Corporation
20
As provided in Table 5.1, CHA was able to leverage additional funding in the following ways:
Of the $107,434,776 spent on projects, 24.2 percent originated from Recovery Act funding, and 57.4 percent originated •
from leveraged and accelerated public housing funds.
Four of the projects leveraged additional funding: L.B. Johnson, Lincoln Way and Jackson Gardens, State Public •
Housing Federalization, and Harry S. Truman.
L.B. Johnson leveraged $16,528,000 through low income tax credit equity and $700,000 through a solar power •
purchase agreement.
The Cambridge Housing Authority also used Recovery Act funds to transfer a total of 556 units from its state-assisted •
public housing program to the federal public housing program. This was done through two distinct projects.
> The first project at Lincoln Way and Jackson Gardens involved 98 public housing units and 17 project-based assistance (PBA) units, for a total of 115 units. Recovery Act funding supplied the $10 million necessary to close the funding gap.
> The $10 million leveraged an additional $45 million including: $17,200,000 through low income tax credit equity, $7,160,000 through state funding, $7,160,000 through city funding, $915,000 through a solar power purchase agreement, and $4,950,00015 through an acquisition loan
> The second project involved using $882,000 of ARRA funding at several sites to bring 441 units up federal program standards. The projects included elevator upgrades, kitchen and bathroom renovations, as well as exterior and site improvements. The ARRA funding enabled the leverage $2,009,000 through funding from the state of Massachusetts.
Harry S. Truman leveraged $500,000 through federal CFP (Capital Fund Program) funds and $550,000 through non-•
federal public housing leverage
Table 5.2: Long-Term Improvements from Recovery Act Spending
L.B. Johnson 186 0 176 At LBJ, substantial improvements to building core and systems with focus on energy efficiency and healthy homes. At UDIC, upgrade of building systems and finishes.
Lincoln Way and 115 98 115 Preservation of affordable housing units. New construction of 70 family units Jackson Gardens and gut rehabilitation of 45 units.
Washington Elms 176 0 145 Modernize 25-year old bathrooms, replacing piping and fixtures and improving ventilation and moisture control.
State Public Housing 438 438 438 Stabilize properties and provide long-term operational stability to properties Federalization due to federalization.
Harry S. Truman 66 0 59 Reduce energy cost, increase energy efficiency, and improve ventilation.
Jefferson Park 187 0 10 Comprehensive modernization of 10 units to upgrade building systems and finishes.
Putnam Gardens 165 0 10 Comprehensive modernization of 10 units to upgrade building systems and finishes.
AMP NameUnits in Facility
Units Brought Online
Units Improved
Impact on long-term sustainability of the AMP resulting from the project
Source: Cambridge Housing Authority15 $4,000,000 of which was a loan from the Cambridge Housing Authority.

Stimulus Funding National Summary Impacts Econsult Corporation
21
Table 5.2 provides a general description of the work being completed at each of the 7 properties that are being improved using Recovery Act funds. These improvements include:
Interior modernization and elevator upgrades at some of the state-assisted public housing that is being transferred into •
the federal program.
Energy efficiency, piping replacement, ventilation enhancement, moisture control, stabilization, and modernization.•
6 of the 7 projects reported improvements in ventilation.•
5 of the 7 projects reported improvements in indoor air quality.•
3 of the 7 projects reported improvements moisture control.•
2 of the 7 projects reported asbestos removal or abatement, and mold prevention.•
5.4 Energy Efficiency Improvements at Cambridge
Two of CHA’s properties reported utility data, which includes FY 2009 consumption of electricity, natural gas, and water/sewer, as well as projected savings for consumption of electricity, natural gas, and water/sewer. Both properties (L.B. Johnson and Harry S. Truman) used energy audits and energy modeling to determine FY 2009 consumption and expected future consumption. The impact of the Recovery Act funds on energy efficiency at these CHA properties include:
L.B. Johnson
Annual decrease in electricity consumption of 2,671,924 kWh, leading to an annual savings of $372,526 •
(an 88.9 percent decrease). The electricity savings was partially offset by increases in natural gas consumption
Increase in natural gas consumption of 74,528 therms, increasing annual expenditures by $86,419. •
The net savings from reduced electricity consumption and increased natural gas consumption is nearly •
$323,000 annually.
Decrease in water/sewer consumption of 3,773 hundred cubic feet (CcF), leading to an annual savings of $36,410.•
Utility savings (water and energy) at L.B. Johnson totals nearly $409,000 annually. •
Harry S. Truman
Annual decrease in electricity consumption of 741,627 kWh, leading to an annual savings of $106,906 (a 78.4 percent •
decrease). The savings are offset in part by increased natural gas consumption.
Increase in natural gas consumption of 31,630 therms, increasing annual expenditures by $48,687.•
The net savings at Truman from reduced energy consumption and increased natural gas consumption is nearly $73,000•
Decrease in water/sewer consumption of 1,276 hundred cubic feet (CcF), leading to an annual savings of $14,330•
Utility savings (water and energy) at Harry S. Truman total over $121,000•

Stimulus Funding National Summary Impacts Econsult Corporation
22
Lyndon B. Johnson Apartments, Cambridge Housing Authority

Stimulus Funding National Summary Impacts Econsult Corporation
23
6.0 Portland, Oregon
Portland, Oregon has a population of about 566,000 residents. The median household income in Portland is more than $50,000. Approximately 16 percent of households in Portland had incomes that fell below the poverty level. Nearly three-fourths (74 percent) of Portland residents are White; 6 percent are Black; 9 percent are Hispanic. The median sales price for a single family home was nearly $296,000 in 2009, and the typical rental price for a 1 bedroom unit in Portland was nearly $900.
6.1 Housing Authority of Portland
The Housing Authority of Portland (HAP) was established in 1941. Today, HAP provides safe, high-quality, affordable housing for approximately 9,000 families through its Public Housing and Housing Choice Voucher programs. About 85 percent of HAP public housing and voucher residents make less than 30 percent of Area Median Income (AMI), while virtually every family in HAP’s public housing and voucher programs make less than 50 percent of AMI. The average rent payment in HAP’s public housing program is $216 while the average rent payment in the voucher program is $326. Approximately 63 percent of HAP public housing households identify themselves as White, while 20 percent identify themselves as Black. The Housing Authority of Portland is a Moving to Work housing authority with a $108 million annual budget.
HAP focuses on five core functions:
Ownership and management of over 3,700 units of housing•
Administration of over 8,000 federal housing vouchers•
New unit acquisition and development•
Resident services programs•
Innovative program design and administrative reforms•
Under the Recovery Act, the Housing Authority of Portland received $9.5 million in public housing capital funds – $3.3 million was provided through a competitive grant. Of that amount, $6.3 million was dedicated to rehabilitating 17 properties from the public housing portfolio; another $3.3 million provided financing towards the development of the downtown Resource Access Center.
A revitalized playground at Powelhurst Woods, Portland Housing Authority

Stimulus Funding National Summary Impacts Econsult Corporation
24
6.2 Funding and Leverage Table 6.1: Housing Authority of Portland AMPs & Funding16
Renovations & Improvements
Alderwood 20 $1,003,413 $63,164 $939,278
Bel Park 10 $410,084 $350,590 $59,494
Camelia Court 14 $541,930 $475,420 $66,510
Celilo Court 28 $1,424,492 $270,344 $1,151,148
Chateau Apartments 10 $338,071 $30,445 $307,646
Cora Park Apartments 10 $428,624 $24,241 $404,383
Demar Downs 18 $985,959 $827,806 $158,153
Fir Acres 31 $1,388,337 $1,388,337 $0
Gallagher Plaza 85 $35,000 $35,000 $0
Harold Lee Village 10 $103,770 $12,083 $91,687
Hunter’s Run 10 $108,885 $12,009 $96,876
Powellhurst 34 $1,573,641 $25,349 $1,548,292
Stark Manor 30 $1,360,063 $1,279,150 $80,913
Tillicum North 18 $128,725 $12,134 $116,383
Tillicum South 12 $112,244 $12,134 $100,110
Townhouse Terrace 31 $1,364,115 $1,206,898 $157,217
Winchell Court 10 $300,045 $240,832 $59,213
TOTAL 381 $11,607,398 $6,265,936 $5,337,303
100% 54% 46%
New Construction
Resource Access Center 130 $46,951,076 $3,278,370 $43,627,706
100% 7% 93%
AMP NameUnits in
Amp
Total Recovery Act Capital Project Cost
Recovery Act Funding spent
at the AMP
Leveraged and Other Public Housing Funds
Source: Housing Authority of Portland
16 HAP received a competitive grant for Elderly and Disabled Accessibility improvements in the sum of $187,200.
Those funds are not included in this analysis.

Stimulus Funding National Summary Impacts Econsult Corporation
25
As detailed in Table 6.1 above, HAP used their Recovery Act funds in the following ways:
Of the 17 properties from the public housing portfolio 381 units were affected by $6,265,936 in funds from the •
American Recovery and Reinvestment Act.
Of the $11,607,398 spent on projects, 54 percent originated from Recovery Act funding, and 46 percent were provided •
through leveraged funds and accelerated public housing capital funds.
Eight of the projects were completed in 2009, eight of the projects were completed in 2010, one project (Resource •
Access Center) is scheduled to end in 2011, and one project (Gallagher Plaza) is scheduled to end in 2012.
The Resource Access Center leveraged funds through real estate sales proceeds, reinvested developer fees, grant •
funding from the Portland Development Commission, LP tax credit equity, housing energy grants, and Wells Fargo Bond Interest Revenue.
Aside from the Resource Access center, which is new construction, and Gallagher Plaza, which is a planning study for •
new units, funds from the American Recovery and Reinvestment Act benefited the other 16 projects by addressing deferred maintenance and reducing ongoing operating costs.
All 18 projects had health initiatives that improve ventilation, increase indoor air quality, control moisture, •
and prevent mold.
12 of the 18 projects prevented volatile organic compound (VOC) exposure from paint.•
11 of the 18 projects removed or abated asbestos.•
5 of the 18 projects decreased carbon monoxide exposure.•
6.3 Utilities Savings
Data were collected from each of the 17 HAP properties where formula grants were being spent regarding electricity consumption, natural gas consumption, and water/sewer consumption. Sixteen of the projects reported estimated changes in electricity consumption, 9 of the projects reported estimated changes in natural gas consumption, and no projects reported estimated changes in water/sewer consumption. All utility consumption calculations were determined using energy audits. The estimated changes in this section reflect only the projects that provided data. They are not projections of savings for all 17 projects.

Stimulus Funding National Summary Impacts Econsult Corporation
26
Table 6.2: Summary of Utility Savings
HAP provided FY 2009 and estimated annual reduction data for electricity consumption for 16 properties and FY 2009 and estimated annual reduction data for natural gas consumption for 9 properties. Total data was calculated by multiplying the consumption per unit given by each project by the number of units in that project and summing project totals.
In the 16 projects that supplied electricity consumption estimates, the estimated change in electricity consumption is a •
decrease of 339,767 kWh per year (a 6.2 percent decrease from 2009).
The estimated annual costs savings resulting from the reduction in electricity consumption is $50,640. •
In the 9 projects for which data on natural gas consumption was supplied, the estimated change in natural gas •
consumption is a decrease of 11,534 therms per year (a 10.4 percent decrease from 2009) for annual savings of $18,185.
The Townhouse Terrace project estimated the greatest reduction in utility use with a 90,718 kWt decrease in electricity •
consumption, resulting in estimated costs savings of $9,072 per year.
Alderwood $2,277 $2,910 $5,187
Bel Park $945 $945
Camelia Court 1220.89 $1,059 $2,281
Celilo Court $1,692 $3,157 $4,849
Chateau Apartments $1,643 $1,643
Cora Park Apartments $2,174 $2,174
Demar Downs $5,809 $5,809
Fir Acres $5,053 $5,053
Gallagher Plaza
Harold Lee Village $1,674 $1,195 $2,869
Hunter’s Run $1,504 $1,202 $2,706
Powellhurst $3,932 $5,379 $9,311
Stark Manor $6,163 $6,163
Tillicum North $2,785 $2,032 $4,817
Tillicum South $2,269 $1,251 $3,520
Townhouse Terrace $9,072 $9,072
Winchell Court $2,427 $2,427
Total $50,640 $18,185 $68,825
AMP Name Electricity Natural Gas Total
Source: Housing Authority of Portland

CLPHAStudy by:Econsult Corporation3600 Market Street, Sixth FloorPhiladelphia, PA 19104
Richard Voith, Ph.D.Senior Vice President & [email protected] Michael [email protected]
www.clpha.org
www.nahro.org
www.housingcenter.com
www.phada.org
This study was commissioned by the Council of Large Public Housing Authorities (CLPHA), the National Association of Housing and Redevelopment Officials (NAHRO) and the Public Housing Authority Directors Association (PHADA). It was funded by the Housing Authority Insurance (HAI) Group.