a report to alexandrina council 12 december 2019 bdo
TRANSCRIPT

ECONOMIC ANALYSIS OF GOOLWA WHARF PRECINCT PROJECT
A Report to Alexandrina Council
12 December 2019 Prepared by
BDO EconSearch
Level 7, BDO Centre, 420 King William Street Adelaide SA 5000 Tel: +61 (8) 7324 6190
https://www.bdo.com.au/en-au/econsearch


Economic Analysis of Goolwa Wharf Precinct Project iii Prepared by BDO EconSearch
TABLE OF CONTENTS
Tables ............................................................................................................................ v
Abbreviations .................................................................................................................. vi
Document History and Status .............................................................................................. vii
Executive Summary......................................................................................................... viii
1. Introduction ............................................................................................................. 1
2. Method of analysis and data ......................................................................................... 3
2.1. Cost Benefit Analysis – Method and Data .................................................................. 3
2.1.1. Purpose and scope of cost benefit analysis ....................................................... 3
2.1.2. Method of analysis ..................................................................................... 3
2.1.3. Costs and benefits ..................................................................................... 4
2.1.4. Data and assumptions ................................................................................. 5
2.2. Economic Impact – Method and Data ....................................................................... 9
2.2.1. Economic activity ...................................................................................... 9
2.2.2. Indicators of economic activity defined ........................................................... 9
2.2.3. Categories of economic activity ................................................................... 10
2.2.4. Economic impact modelling ........................................................................ 10
2.2.5. Data and assumptions ............................................................................... 11
3. Cost Benefit Analysis Results ...................................................................................... 12
3.1. Results ......................................................................................................... 12
3.2. Sensitivity Analysis ........................................................................................... 13
3.2.1. Discount rates ........................................................................................ 13
3.2.2. Investment costs ..................................................................................... 13
3.2.3. Increase in visitation ................................................................................ 14
3.2.4. Project delay under the base case ................................................................ 14
4. Economic Impact Results ........................................................................................... 16

Economic Analysis of Goolwa Wharf Precinct Project iv Prepared by BDO EconSearch
4.1. Construction Phase .......................................................................................... 16
4.2. Operating Phase .............................................................................................. 17
4.3. Sensitivity Analysis ........................................................................................... 17
References .................................................................................................................... 19
APPENDIX 1 An Overview of Economic Impact Analysis Using Input-Output Method .................... 21
APPENDIX 2 Detailed CBA Model .................................................................................. 31

Economic Analysis of Goolwa Wharf Precinct Project v Prepared by BDO EconSearch
TABLES
Table ES-1 Summary contribution to regional economic growth by the Goolwa Wharf Precinct
redevelopment ................................................................................................. x
Table 2-1 Alternative options for the cost benefit analysis ......................................................... 3
Table 2-2 Costs and benefits in the scope of the cost benefit analysis ........................................... 4
Table 2-3 Construction costs and time profile ........................................................................ 5
Table 2-4 Percentage increase in visitor nights year-on-year ...................................................... 5
Table 2-5 Tourism expenditure, with project ($m) .................................................................. 6
Table 2-6 Expected community benefits of Goolwa Wharf redevelopment, social analysis .................. 8
Table 3-1 Results of the senstitivity analysis – discount ratea .................................................... 13
Table 3-2 Results of the sensitivity analysis – investment costsa ................................................ 14
Table 3-3 Results of sensitivity analysis – increase in visitationa ................................................ 14
Table 3-4 Results of sensitivity analysis – project delaya .......................................................... 15
Table 4-1 Economic impact of the Goolwa Wharf Precinct redevelopment on the Alexandrina LGA
region, construction phase ................................................................................. 16
Table 4-2 Economic impact of the Goolwa Wharf Precinct redevelopment on the Alexandrina LGA
region, operating phase..................................................................................... 17
Table 4-3 Sensitivity of the economic impact results to the assumed increase in visitation,
2029/30 a ...................................................................................................... 18
Appendix Table 1-1 The structure of input-output multipliers for sector ia .................................... 25
Appendix Table 2-1 Detailed CBA modela ............................................................................. 31

Economic Analysis of Goolwa Wharf Precinct Project vi Prepared by BDO EconSearch
ABBREVIATIONS
BBRF Building Better Regions Fund
BCR benefit cost ratio
CBA cost benefit analysis
fte full time equivalent
GRP gross regional product
I-O Input Output
IRR internal rate of return
LGA local government area
NPS Net Promoter Score
NPV net present value
RISE Regional Industry Structure and Employment

Economic Analysis of Goolwa Wharf Precinct Project vii Prepared by BDO EconSearch
DOCUMENT HISTORY AND STATUS
Doc Version
Doc Status
Issued To Qty elec
Qty hard
Date Reviewed Approved
1 Draft Manuel Delgado Tanya Mitchell
1 Word 1 PDF
- 12/12/19 ADM ADM
2 Final Manuel Delgado Tanya Mitchell
1 Word 1 PDF
- 12/12/19 ADM ADM
Printed: 13/12/2019 2:43:00 PM
Last Saved: 13/12/2019 2:43:00 PM
File Name: I:\CLIENTS\City of Alexandrina\ES1940_Goolwa Wharf Precinct Update\Report\Goolwa
Wharf Precinct Economic Analysis_Final_191212_3yr.docx
Project Manager: Julian Morison
Principal Author/s: Heather Bailey and Jasmine Douglas
Name of Client: Alexandrina Council
Name of Project: Economic Analysis of Goolwa Wharf Precinct Project
Document Version: 1
Job Number: ES1940

Economic Analysis of Goolwa Wharf Precinct Project viii Prepared by BDO EconSearch
EXECUTIVE SUMMARY
Goolwa, situated on Fleurieu Peninsula, is a major town within the Alexandrina Council. The town is located
at the mouth of the Murray River on Lake Alexandrina, 83 km south of Adelaide and 19 km from Victor
Harbour. With a rich heritage as a thriving river port in the 1800’s and an ideal location for water sports,
outdoor activities and fishing, the town is a major tourist destination in the region. The Goolwa Wharf
Precinct is itself, a significant driver of economic and tourism activity within the Alexandrina Council and
Fleurieu Region.
However, the Precinct lacks quality, fit for purpose and state-of-the-art facilities for business expansion or
to attract new businesses to the Precinct. Without improvements there is the risk that tourism will decline
as visitors to South Australia may choose other destinations with better facilities.
The Goolwa Wharf Precinct project seeks to upgrade infrastructure within the Precinct that will improve
the access and amenity of the precinct, creating a more desirable environment for people to stay, enjoy
and learn about the region, thus increasing economic activity and creating jobs. It also seeks to make Goolwa
and the Fleurieu Region a more attractive place to live, work and visit and protect and celebrate the rich
cultural and heritage assets of the historic and Southern-most River Murray port.
Alexandrina Council propose to implement their Goolwa Wharf Precinct redevelopment with a $7.5 million
investment over 3 years. Alexandrina Council is seeking funding for the proposed redevelopment through
the Australian Government Building Better Regions Fund (BBRF). BDO EconSearch was commissioned by
Alexandrina Council to provide input into the BBRF application. Specifically, to address Merit Criterion 1:
Economic Benefit through an economic impact assessment and cost benefit analysis.
Method of Analysis
Two economic methods were utilised to provide the necessary outputs required for funding applications.
Firstly, cost benefit analysis (CBA) was used to determine the efficient allocation of resources. Secondly,
extended input-output (I-O) analysis was employed for estimation of regional economic impacts.
A key objective of this project was to undertake a CBA to determine the net benefit of the Goolwa Wharf
Precinct redevelopment. The proposed development (Option 1) was compared against a base case scenario,
as described below.
Base Case: Council funds the redevelopment using own funds resulting in a delay to the redevelopment
project of 10 years.
Option 1: The redevelopment is carried out as described, establishing improved wharf facilities (for
tourist cruise operators, occupants of the Wharf Shed and visitors), redeveloped Signal Point
Arts and Cultural Centre, improved open space and public facilities and wayfinding and wi-fi
facilities.
The CBA was conducted over a 25-year period and three standard evaluation criteria were employed: net
present value (NPV); benefit cost ratio (BCR); and internal rate of return (IRR).
The regional economic impacts were estimated using an extension of the conventional input-output method.
Over the past decade BDO EconSearch has developed an extended I-O model known as the RISE model
(Regional Industry Structure and Employment). I-O models are widely used to assess the economic

Economic Analysis of Goolwa Wharf Precinct Project ix Prepared by BDO EconSearch
contribution of existing levels of economic activity and the economic impacts of shocks. The indicators used
in impact analysis typically include employment and contribution to gross regional product (GRP) which are
used in this report. A RISE model for the Alexandrina local government area (LGA) economy was used for
the assessment of regional impacts.
Cost benefit analysis
While the impact analysis illustrates the economic activity arising from the proposed development, the CBA
shows whether or not the proposed investment represents an efficient use of public money. The results of
the CBA are as follows:
NPV of $0.36 million
BCR of 1.01
IRR of 8 per cent.
The results indicate that according to the three evaluation criteria used the redevelopment would increase
net social benefit. The NPV of $0.36 million indicates that, relative to the Base Case, the redevelopment
will generate a net benefit to the community of $0.36 million over a 25-year period. The decision rule is
that the investment will be worthwhile if the NPV is greater than zero.
The BCR of 1.01 indicates, in a broad sense, that for each dollar invested $1.01 will be returned over the
life of the project. For a project to be viable, the BCR must be greater than 1.0.
The IRR provides a measure for the rate of return to capital invested, here estimated to be 8 per cent. The
decision rule for a project to be viable is that the IRR be greater than the discount rate which, for this
project and projects of this kind is 7 per cent.
Accordingly, the net benefit of investing in the redevelopment outweigh the net benefits of delayed
investment (Base Case).
There are significant unquantified benefits associated with this project. This project will contribute
significantly to the liveability of the town and region, social connectedness, improved health, walkability
of the town and environmental benefits. It is expected to facilitate more community events providing
benefits of social cohesion and connectedness and improvements to pedestrian safety, and to raise the
profile and preservation Lakes and the Coorong National Park along with local European and Indigenous
heritage and culture. The project has a high level of support from the community along with the benefits
associated.
Economic impact analysis
The impact analysis investigated the economic impact to the Alexandrina LGA regional economy resulting
from the redevelopment of the Goolwa Wharf Precinct and the expenditures made by additional visitors to
the region as a result of the new/upgraded facilities.
The results are summarised as follows:
Construction
Total contribution to GRP over the three-year construction period of approximately $3.5 million,
$2.2 million directly and $1.3 million in flow-on impacts

Economic Analysis of Goolwa Wharf Precinct Project x Prepared by BDO EconSearch
Annual contribution to total employment of 13 fte jobs, 9 fte directly and 4 fte in flow-on impacts.
Tourism (ongoing)
Total contribution to GRP of approximately $3.9 million annually, $2.5 million directly and $1.4
million in flow-on impacts
Total contribution to employment of approximately 40 fte annually, 30 fte directly and 11 fte in
flow-on impacts
The extent to which the project will contribute to economic growth in the region is summarised in Table
ES-1.
Table ES-1 Summary contribution to regional economic growth by the Goolwa Wharf Precinct redevelopment
Economic Benefit Measurement
Efficient use of resources The cost benefit analysis provides indicators of economic efficiency. On all
counts this project performs positively with an NPV of $0.36 million and
benefit cost ratio of 1.01.
Increase to productivity The redevelopment will boost the GRP of the Alexandrina LGA regional
economy by around $3.5 million per year once complete. It will increase
productivity of the existing tourism operators and provide opportunities for
expansion by providing easier and safer access to the water for tour operators.
Employment beyond
construction phase
After the initial 13 fte jobs over the three-year construction period, the
redevelopment will generate around 40 on-going fte jobs in the region.
Increase in industry and
economic competitiveness
Tourism (including events and local markets) will benefit from the
redevelopment, gaining access to a broader and more varied market.
Diversification of local
business
New activity will occur in industries that are currently very small or non-
existent in the region. This includes establishing new businesses and the
opportunity for existing businesses to value-add and access a new market.
These industries include equipment rental, cultural and recreational services,
accommodation and food and beverage.
Use of locally produced
goods and services
During operation, the new services established by the redevelopment and the
new market for existing businesses can be expected to lead visitors to spend
locally when they visit Goolwa.
Halts the projected
decline in operating
businesses
The redevelopment will allow Goolwa to capture some of the expected
medium-term increase in visitors to the Fleurieu Peninsula. This will allow new
businesses to be established and existing businesses to expand, leading to the
predicted 40 additional on-going fte jobs for the Alexandrina LGA region.

Economic Analysis of Goolwa Wharf Precinct Project 1 Prepared by BDO EconSearch
1. INTRODUCTION
Goolwa, situated on Fleurieu Peninsula, is a major town within the Alexandrina Council. The town is located
at the mouth of the Murray River on Lake Alexandrina, 83 km south of Adelaide and 19 km from Victor
Harbour. With a rich heritage as a thriving river port in the 1800’s and an ideal location for water sports,
outdoor activities and fishing, the town is a major tourist destination in the region. The Goolwa Wharf
Precinct is itself, a significant driver of economic and tourism activity within the Alexandrina Council and
Fleurieu Region.
However, the Precinct lacks quality, fit for purpose and state-of-the-art facilities for business expansion or
to attract new businesses to the Precinct. Without improvements there is the risk that tourism will decline
as visitors to South Australia may choose other destinations with better facilities.
The Goolwa Wharf Precinct project seeks to upgrade infrastructure within the Precinct that will improve
the access and amenity of the precinct, creating a more desirable environment for people to stay, enjoy
and learn about the region, thus increasing economic activity and creating jobs. It also seeks to make Goolwa
and the Fleurieu Region a more attractive place to live, work and visit and protect and celebrate the rich
cultural and heritage assets of the historic and Southern-most River Murray port.
The project will include infrastructure upgrades such as:
Goolwa Wharf Shed and Wharf Upgrade –Upgrade of the Wharf and Wharf Shed and other supporting
facilities
Signal Point Regional Art & Cultural Centre – new roof, improved internal and external access and
enhanced riverside entrance
Open air function space, shared paths, communal public areas and car park extension - open space
for large communal festivals and events, off road shared paths for safe pedestrian access and
improved access for large vehicles - touring buses, caravans and trailers
Wayfinding and Wi-Fi – to meet visitor demands and expectations for high quality and smart
technology at destination places
The Australian Government is providing $841.6 million (Department of Industry, Innovation and Science
2019a) to fund priority infrastructure and community investments in local communities through the Building
Better Regions Fund (BBRF). Alexandrina Council is seeking funding for the proposed redevelopment. BDO
EconSearch was commissioned by Alexandrina Council to provide specific input into the BBRF application.
Of the four BBRF assessment criteria BDO EconSearch have been asked to contribute to one, namely:
BBRF Merit Criterion 1: Economic Benefit
Under Merit Criterion 1 the requirement is to demonstrate the economic benefits attributable to the
redevelopment, described in terms of the economic benefits that the project will deliver to the region
during and beyond the construction phase.
Two economic methods were utilised to provide the necessary outputs required for the application.
Extended input-output (I-O) analysis was employed for estimation of regional economic impacts. Cost
benefit analysis (CBA) was used to determine the efficient allocation of resources.

Economic Analysis of Goolwa Wharf Precinct Project 2 Prepared by BDO EconSearch
The remainder of the report is presented in three parts. Section 2 outlines the methods and data used.
Section 3 presents the CBA results (including sensitivity analysis) and Section 4 presents the economic impact
assessment results (including sensitivity analysis).
Economic Analysis of Goolwa Wharf Precinct Project 3 Prepared by BDO EconSearch
2. METHOD OF ANALYSIS AND DATA
2.1. Cost Benefit Analysis – Method and Data
2.1.1. Purpose and scope of cost benefit analysis
A key objective of this study was to undertake a cost benefit analysis (CBA) to determine the net benefit of
the redevelopment. The proposed redevelopment was compared against a base case scenario, as described
in Table 2-1. The base case and proposed redevelopment option are detailed in the following sections.
Table 2-1 Alternative options for the cost benefit analysis
Option Description
Base Case Council funds the redevelopment using own funds resulting in a delay to the
redevelopment project of 10 years.
Redevelopment Case The redevelopment is carried out as described, establishing improved wharf facilities,
upgraded Signal Point facility and improved open space and public facilities.
2.1.2. Method of analysis
The cost benefit analysis conducted for this project conforms to South Australian and Commonwealth
Government guidelines for conducting evaluations of public sector projects (Department of Treasury and
Finance (2008) and Department of Finance and Administration (2006), Department of Industry, Innovation
and Science & Department of Infrastructure, Transport, Cities and Regional Development (2019b)).
The starting point for the economic analysis was to develop the ‘base case’ scenario, that is, the benchmark
against which the redevelopment was compared.
Given that costs and benefits were specified in real terms (i.e. constant 2019 dollars), future values were
converted to present values by applying a discount rate of 7 per cent. The choice of discount rate is
consistent with the rate advised by Department of Industry, Innovation and Science & Department of
Infrastructure, Transport, Cities and Regional Development (2019b).
The economic analysis was conducted over a 25-year period and results were expressed in terms of net
benefits, that is, the incremental benefits and costs of the Redevelopment Case relative to those generated
by the Base Case. The evaluation criteria employed for this analysis are described below.
Net present value (NPV) – discounted redevelopment benefits less discounted redevelopment costs.
Under this decision rule the redevelopment is considered to be potentially viable if the NPV is
greater than zero. The NPV for the redevelopment (Dev) was calculated as an incremental NPV,
using the standard formulation:
𝑁𝑃𝑉𝐷𝑒𝑣 = 𝑃𝑉(𝐵𝐷𝑒𝑣 − 𝐵𝐵𝑎𝑠𝑒 𝐶𝑎𝑠𝑒) − 𝑃𝑉(𝐶𝐷𝑒𝑣 − 𝐶𝐵𝑎𝑠𝑒 𝐶𝑎𝑠𝑒)

Economic Analysis of Goolwa Wharf Precinct Project 4 Prepared by BDO EconSearch
Internal rate of return (IRR) – the discount rate at which the NPV of the redevelopment is equal to
zero. Under this decision rule the redevelopment is considered to be potentially viable if the IRR
is greater than the benchmark discount rate (i.e. 7 per cent).
Benefit cost ratio (BCR) – the ratio of the present value of benefits to the present value of costs.
Under this decision rule the redevelopment is considered to be potentially viable if the BCR is
greater than one. The ratio was expressed as:
𝐵𝐶𝑅𝐷𝑒𝑣 =𝑃𝑉(𝐵𝐷𝑒𝑣 − 𝐵𝐵𝑎𝑠𝑒 𝐶𝑎𝑠𝑒)
𝑃𝑉(𝐶𝐷𝑒𝑣 − 𝐶𝐵𝑎𝑠𝑒 𝐶𝑎𝑠𝑒)
2.1.3. Costs and benefits
The costs and benefits of the redevelopment were measured using a ‘with’ and ‘without’ project framework,
that is, quantification of the incremental changes associated with the option (i.e. the Redevelopment Case)
compared to the Base Case. The method, data sources and assumptions used to quantify these values are
described below. Consideration was given to those benefits and costs likely to occur over a 25-year period.
The major economic costs and benefits of the project are listed in Table 2-2.
Table 2-2 Costs and benefits in the scope of the cost benefit analysis
Item Cost or
Benefit
Agent Description
Base Case
As per Redevelopment Case As per Redevelopment Case, with delay
Redevelopment Case
Visitation revenue Benefit Existing
businesses
Direct increase in revenue for the region due to increased
tourism
Residual value of capital Benefit Alexandrina
Council
Value of the initial investment at the end of the period of
analysis (25 years)
Non-market social benefits Benefit Community Value gained by the community and tourists by using the
public facilities such as ablutions, paths, barbeques,
wharf, park, Wi-Fi facilities, etc. Not quantified.
Construction costs Cost Alexandrina
Council
Capital expenditure for the redevelopment
Visitation costs Cost Existing
businesses
Increased intermediate expenditures and wages paid by
businesses who service the increase in tourism
Economic Analysis of Goolwa Wharf Precinct Project 5 Prepared by BDO EconSearch
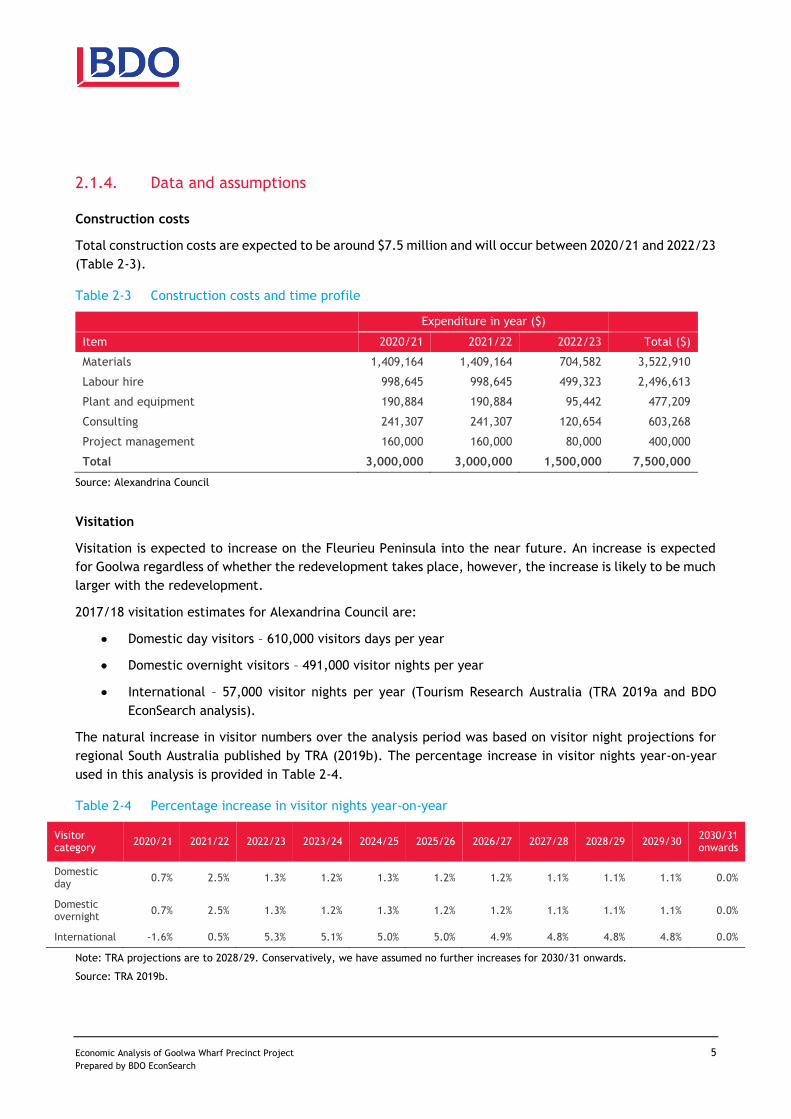
2.1.4. Data and assumptions
Construction costs
Total construction costs are expected to be around $7.5 million and will occur between 2020/21 and 2022/23
(Table 2-3).
Table 2-3 Construction costs and time profile
Expenditure in year ($)
Item 2020/21 2021/22 2022/23 Total ($)
Materials 1,409,164 1,409,164 704,582 3,522,910
Labour hire 998,645 998,645 499,323 2,496,613
Plant and equipment 190,884 190,884 95,442 477,209
Consulting 241,307 241,307 120,654 603,268
Project management 160,000 160,000 80,000 400,000
Total 3,000,000 3,000,000 1,500,000 7,500,000
Source: Alexandrina Council
Visitation
Visitation is expected to increase on the Fleurieu Peninsula into the near future. An increase is expected
for Goolwa regardless of whether the redevelopment takes place, however, the increase is likely to be much
larger with the redevelopment.
2017/18 visitation estimates for Alexandrina Council are:
Domestic day visitors – 610,000 visitors days per year
Domestic overnight visitors – 491,000 visitor nights per year
International – 57,000 visitor nights per year (Tourism Research Australia (TRA 2019a and BDO
EconSearch analysis).
The natural increase in visitor numbers over the analysis period was based on visitor night projections for
regional South Australia published by TRA (2019b). The percentage increase in visitor nights year-on-year
used in this analysis is provided in Table 2-4.
Table 2-4 Percentage increase in visitor nights year-on-year
Visitor category
2020/21 2021/22 2022/23 2023/24 2024/25 2025/26 2026/27 2027/28 2028/29 2029/30 2030/31 onwards
Domestic day
0.7% 2.5% 1.3% 1.2% 1.3% 1.2% 1.2% 1.1% 1.1% 1.1% 0.0%
Domestic overnight
0.7% 2.5% 1.3% 1.2% 1.3% 1.2% 1.2% 1.1% 1.1% 1.1% 0.0%
International -1.6% 0.5% 5.3% 5.1% 5.0% 5.0% 4.9% 4.8% 4.8% 4.8% 0.0%
Note: TRA projections are to 2028/29. Conservatively, we have assumed no further increases for 2030/31 onwards.
Source: TRA 2019b.

Economic Analysis of Goolwa Wharf Precinct Project 6 Prepared by BDO EconSearch
The visitation increases as a result of the project (i.e. beyond natural increases) were estimated to be
around 5 per cent (Alexandrina Council, pers. comm.). This assumption was applied uniformly across the
three categories of visitors (i.e. domestic day, domestic overnight and international visitors). The additional
visitation to Goolwa was assumed to commence in 2023/24, after construction is complete.
The following visitor expenditures were estimated for Alexandrina Council area:
Domestic day visitors – $83/day
Domestic overnight visitors – $159/night
International – $60/night (TRA (2019a) and BDO EconSearch analysis).
Based on the assumptions described above, a profile of tourism expenditure was generated (summarised in
Table 2-5).
Table 2-5 Tourism expenditure, with project ($m)
Visitor category
2020/21 2021/22 2022/23 2023/24 2024/25 2025/26 2026/27 2027/28 2028/29 2029/30 2030/31 onwards
Domestic day
0.00 0.00 0.00 2.93 2.97 3.00 3.04 3.07 3.10 3.14 3.14
Domestic overnight
0.00 0.00 0.00 4.51 4.57 4.62 4.68 4.73 4.78 4.83 4.83
International 0.00 0.00 0.00 0.18 0.19 0.20 0.21 0.22 0.23 0.24 0.24
Total 0.00 0.00 0.00 7.62 7.72 7.82 7.92 8.01 8.11 8.21 8.21
Note: These expenditures occur under the base case with a 10-year delay.
BDO EconSearch analysis.
Visitation costs
The expenditures by the additional visitors resulting from the project generates additional activity (revenue
and expenditures) by local businesses providing goods and services to the visitors. These costs include
expenditures on intermediate goods and services (e.g. food, electricity, accountancy services, etc.) and on
wages. A RISE model of the Alexandrina Council local government area (LGA) was used to estimate these
costs within the region, based on the expected tourist expenditure profile (Table 2-5).
Visitation revenue
As per visitation costs, A RISE model of the Alexandrina Council LGA was used to estimate the revenues
generated by businesses servicing the additional visitors within the region, based on the expected tourist
expenditure profile (Table 2-5).
Residual value of project capital
The residual value of capital at the end of the period of analysis (25 years) was estimated using a straight
line depreciation schedule and estimated asset life for capital items (materials and plant and equipment).
An asset life of 25 years was assumed.

Economic Analysis of Goolwa Wharf Precinct Project 7 Prepared by BDO EconSearch
Unquantified benefits
There are significant unquantified benefits associated with this project.
Social analysis using two focus groups of participants representative of the Alexandrina Council community
has been undertaken (Action Market Research & Hudson Howells 2019) and identified expected benefits
from the Goolwa Wharf redevelopment. These included the following:
Benefits to their local community
A much greater ‘presence’ as the current Precinct is not immediately obvious.
A much greater level of amenity with improved access and wayfinding.
A better recreational place for families to visit.
Increased visitor numbers and therefore increased business opportunities and growth.
Inter-generational engagement with more families mixing with older people and young people.
Enhanced cultural awareness about local history through understanding more about the buildings
and why the area was established in the first place.
A much more tourist-friendly destination with associated economic flow-on effects, i.e. increased
tourism expenditure benefiting local business and creating local jobs.
More services/venues for locals and holiday makers to spend their money in Goolwa which will
assist in attracting and maintaining a younger population.
Inbound visitor growth and the associated business flow-on and an expected increase in permanent
population to follow with this being particularly beneficial during the winter months when visitor
number are traditionally lower making trading conditions challenging.
Benefits to the broader South Australian community:
Improved opportunities for promoting the region’s rich Indigenous culture and history.
Increased inbound tourism to South Australia including regional tourism.
Converting what is currently a tourism location into a tourism destination that will add value to
South Australia’s overall tourism appeal.
Greater awareness of the region's European and Indigenous history, bringing tourism from outside
the Fleurieu Peninsula and from interstate and overseas.
A focus on the environmental importance of Goolwa and the Murray mouth to South Australia and
positioning Goolwa as an accessible ‘day trip’ destination.
Making a trip to the South Coast even more worthwhile for South Australians.
Providing a destination for day trippers and tourists that gives a lot of ‘bang for their buck’ - water,
history, food, wine, art and culture particularly indigenous culture.
Another reason for people to visit South Australia and stay longer.
An increased tourist presence in the area resulting in more tourism generally in the region and
South Australia.
Economic Analysis of Goolwa Wharf Precinct Project 8 Prepared by BDO EconSearch
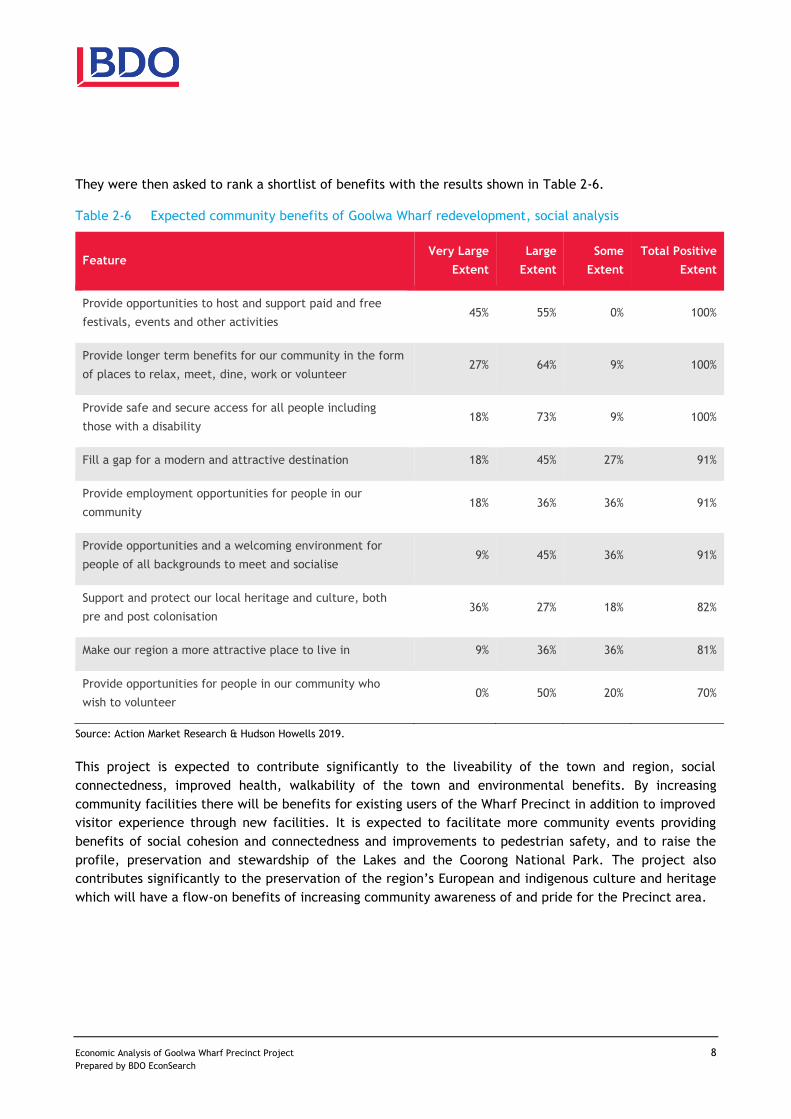
They were then asked to rank a shortlist of benefits with the results shown in Table 2-6.
Table 2-6 Expected community benefits of Goolwa Wharf redevelopment, social analysis
Feature Very Large
Extent
Large
Extent
Some
Extent
Total Positive
Extent
Provide opportunities to host and support paid and free
festivals, events and other activities 45% 55% 0% 100%
Provide longer term benefits for our community in the form
of places to relax, meet, dine, work or volunteer 27% 64% 9% 100%
Provide safe and secure access for all people including
those with a disability 18% 73% 9% 100%
Fill a gap for a modern and attractive destination 18% 45% 27% 91%
Provide employment opportunities for people in our
community 18% 36% 36% 91%
Provide opportunities and a welcoming environment for
people of all backgrounds to meet and socialise 9% 45% 36% 91%
Support and protect our local heritage and culture, both
pre and post colonisation 36% 27% 18% 82%
Make our region a more attractive place to live in 9% 36% 36% 81%
Provide opportunities for people in our community who
wish to volunteer 0% 50% 20% 70%
Source: Action Market Research & Hudson Howells 2019.
This project is expected to contribute significantly to the liveability of the town and region, social
connectedness, improved health, walkability of the town and environmental benefits. By increasing
community facilities there will be benefits for existing users of the Wharf Precinct in addition to improved
visitor experience through new facilities. It is expected to facilitate more community events providing
benefits of social cohesion and connectedness and improvements to pedestrian safety, and to raise the
profile, preservation and stewardship of the Lakes and the Coorong National Park. The project also
contributes significantly to the preservation of the region’s European and indigenous culture and heritage
which will have a flow-on benefits of increasing community awareness of and pride for the Precinct area.
Economic Analysis of Goolwa Wharf Precinct Project 9 Prepared by BDO EconSearch
The social analysis provided a Net Promoter Score1 of +55 indicating an excellent support and loyalty from
the community for the project.
2.2. Economic Impact – Method and Data
An important component of the economic analysis task is to undertake an economic impact assessment. The
regional economic impact analysis uses an extension of the conventional input-output method. Over the
past decade BDO EconSearch has developed an extended input-output model known as the RISE model
(Regional Industry Structure & Employment). The RISE model provides a comprehensive economic framework
that is extremely useful in the resource planning process, particularly for regional economic impact
applications.
The indicators used in impact analysis typically include employment and gross regional product which are
used in this report.
2.2.1. Economic activity
Economic activity indicators: the focus of this report is the generation of economic activity resulting from
the redevelopment. The key economic activity indicators considered in the analysis are employment and
gross regional product (GRP).
Economic impact: changes in economic activity are referred to as economic impacts. Generally, changes in
economic activity indicators result from some stimulus or external shock imposed. In this analysis the
concept of economic impact includes the increase in economic contribution from the construction and
operation of the redevelopment, i.e. the contribution the redevelopment makes to the economy. This
economic impact is measured in terms of the economic activity indicators referred to above.
2.2.2. Indicators of economic activity defined
Employment units: Employment numbers are usually reported in either full time equivalent (fte) units or
total job units defined as follows:
fte: is a way to measure a worker's involvement in a project or industry activity. An fte of 1.0
means that the person is equivalent to a full-time worker, while an fte of 0.5 signals that the
worker is only half-time. Typically, different scales are used to calibrate this number, depending
on the type of industry and scope of the analysis but the basic calculation is the total hours worked
divided by average annual hours worked in full-time jobs.
Jobs: is used to refer to the number of workers employed in an industry or on a project at any point
in time. It typically refers to either:
- the maximum number of workers required at any point over the analytical period or the
duration of the project; or
1 Participants answered a question on how likely they would be to recommend visiting the redeveloped Precinct to fa friend or family member on a scale of 0-10. Participants who gave a score of 9 or 10 are Promotors. Those who gave a score of 6 or less are Detractors. Those who gave a score of 7 or 8 are Passives (neutral). The Net Promoter Score (NPS) is calculated by deducting the percentage of Detractors from the percentage of Promotors. This gives a potential range of -100 to +100. Based on global standards any score above 0 is good (majority of community is loyal and supportive) with a score of 50+ being excellent. NPS is a globally recognised tool for measuring customer loyalty.

Economic Analysis of Goolwa Wharf Precinct Project 10 Prepared by BDO EconSearch
- the average number of workers required over the analytical period/duration of the project.
This can be calculated on a daily, weekly, monthly or annual basis.
In this report employment has been reported in terms of fte units on a per annum basis.
Gross regional product (GRP): is a measure of the contribution of an activity to the economy. GRP is
measured as value of gross output (business revenue) less the cost of goods and services (including imports)
used in producing the output. In other words, it can be measured as the sum of household income, gross
operating surplus and gross mixed income net of payments to owner managers and taxes less subsidies on
products and production. It represents payments to the primary inputs of production (labour, capital and
land). Using GRP as a measure of economic impact avoids the problem of double counting that may arise
from using value of output for this purpose.
2.2.3. Categories of economic activity
A useful way to think about economic activity and economic impact (as measured by employment, GRP,
etc.) is using the concept of a ‘supply chain’. The supply chain, in the context of an infrastructure project,
includes the planning and management of all activities involved in sourcing and procurement, conversion of
materials, and all the logistics management activities. It also includes coordination and collaboration with
suppliers, intermediaries and third-party service providers.
Broadly speaking there are four categories of employment and GRP along the infrastructure supply chain.
1. Direct employment and GRP – this is employment in those firms, businesses and organisations that
are directly engaged in providing goods and services to the Precinct redevelopment.
2. First round employment and GRP - refers to employment in firms that supply inputs and services
to the ‘direct employment’ businesses, i.e. those categorised under #1 above.
3. Industrial-support employment and GRP - is the term applied to 'second and subsequent round'
effects as successive waves of output increases occur in the economy to provide industrial support,
as a response to the original expenditure. This category excludes any employment associated with
increased household consumption.
4. Consumption-induced employment and GRP - is the term applied to as those effects induced by
increased household income associated with the original expenditure. The expenditure of
household income associated with all three categories of employment (direct, first round and
industrial-support) will generate economic activity that will in itself generate jobs.
Flow-on (or indirect) economic impact is the sum of categories 2, 3 and 4. In this analysis direct and flow-
on employment and GRP generated by the supply chain have been reported.
For this project these categories of economic impact will apply to the construction of the redevelopment
and to the increase in expenditures made by visitors to the region.
2.2.4. Economic impact modelling
Over the past decade BDO EconSearch has developed an extended input-output (I-O) model known as the
RISE model (Regional Industry Structure & Employment). BDO EconSearch updates the RISE model annually
for use by the Department of the Premier and Cabinet, Government of South Australia (EconSearch 2017).
A RISE model based on the 2015/16 financial year of the Alexandrina LGA was used to make regional
economic estimates.

Economic Analysis of Goolwa Wharf Precinct Project 11 Prepared by BDO EconSearch
Input-output models are widely used to assess the economic contribution of existing levels of economic
activity and the economic impacts of shocks. The models are based upon I-O tables that describe the
interdependencies between industries within the regional economy and with the economy outside of the
region. This makes the comprehensive economic framework provided by the RISE model extremely useful
for disentangling the direct and flow-on effects of activity in a regional economy.
The I-O method used in the RISE model has been extended to incorporate population and unemployment
changes. Modelling population change allows for the estimation of impacts on population driven sectors,
such as government administration, health, defence and education. Modelling unemployment change allows
estimation of an offsetting effect on consumption-induced flow-on impacts as some new employees may
have previously claimed unemployment benefits in the region and some may be new to the region. These
extensions improve the reliability of RISE model estimates compared to conventional I-O models
2.2.5. Data and assumptions
The data and assumptions used to calculate the economic impacts are the same as those used for the cost
benefit analysis (Section 2.1.4).
In addition to the assumptions embodied in the input-output model itself (see Appendix 1), it was necessary
to make a number of other general assumptions in estimating the economic impacts:
The impacts were measured using a model that represents the structure of the regional economy
for the year in which the most recent data are available (2015/16). However, over time there are
likely to be improvements in primary factor productivity in these economies. To allow for the
improvements an across-the-board (all sectors) labour productivity improvement rate of 1 per cent
per annum for subsequent years of the construction and operation phases have been incorporated
into the modelling.
When new jobs are created, it should be determined where the people come from to fill those
jobs. In some cases, the jobs will be taken by previously unemployed locals or by someone who is
currently employed locally but whose own job is taken by a previously unemployed local. In both
cases the impact of the newly created job and associated income is partially offset by the fact that
someone who was previously receiving unemployment benefits for example is no longer doing so.
To calculate this effect requires estimates of the parameter rho (see Appendix 1), the proportion
of new jobs that are likely to be filled by previously unemployed locals. For the construction and
operating phases, it was estimated to be 0.6 for the local area.
Economic Analysis of Goolwa Wharf Precinct Project 12 Prepared by BDO EconSearch
3. COST BENEFIT ANALYSIS RESULTS
3.1. Results
The primary focus of the cost benefit analysis in this study was the costs and benefits that accrue as a result
of the redevelopment. That is, the cost benefit analysis was used to determine whether the redevelopment
would increase net social benefits relative to the Base Case.
The results of the analysis have been expressed in terms of three evaluation criteria, the net present value
(NPV), the internal rate of return (IRR) and the benefit cost ratio (BCR). The NPV is a measure of the
aggregate, annual net benefits (i.e. benefits – costs) of the redevelopment over a 25-year period, discounted
(i.e. expressed as a present value) using a discount rate of 6 per cent. If the NPV for a scenario is positive,
then it is preferred to the Base Case. The BCR is a ratio of the present value of benefits to the present value
of costs after 25 years and the IRR is the discount rate at which the NPV of the redevelopment equals zero
after 25 years. While the impact analysis illustrates the economic activity arising from the proposed
investment, the CBA shows whether or not the proposed investment represents a more efficient allocation
of resources. The results of the CBA are as follows2:
NPV of $0.36 million
BCR of 1.01
IRR of 8 per cent.
The results indicate that according to the three evaluation criteria used the redevelopment would increase
net social benefit. The NPV of $036 million indicates that, relative to the Base Case, the redevelopment will
generate a net benefit to the community of $0.36 million over a 25-year period. The decision rule is that
the investment will be worthwhile if the NPV is greater than zero.
The BCR of 1.01 indicates, in a broad sense, that for each dollar invested $1.01 will be returned over the
life of the project. For a project to be viable, the BCR must be greater than 1.0.
The IRR provides a measure for the rate of return to capital invested, here estimated to be 8 per cent. The
decision rule for a project to be viable is that the IRR be greater than the discount rate which, for this
project and projects of this kind is 7 per cent.
Accordingly, the net benefit of investing in the redevelopment outweigh the net benefits of delayed
investment (Base Case).
As outlined in Section 2.1.4, there are significant unquantified benefits associated with this project. This
project will contribute significantly to the liveability of the town and region, social connectedness, improved
health, walkability of the town and environmental benefits. It is expected to facilitate more community
events providing benefits of social cohesion and connectedness and improvements to pedestrian safety, and
to raise the profile and preservation Lakes and the Coorong National Park along with local European and
Indigenous heritage and culture. The project has a high level of support from the community along with the
benefits associated.
2 For more detailed results see Appendix Table 2-1.

Economic Analysis of Goolwa Wharf Precinct Project 13 Prepared by BDO EconSearch
3.2. Sensitivity Analysis
The results of the CBA were re-estimated using values for key variables that reflect the uncertainty of those
variables. The sensitivity analysis included the following:
discount rates
investment costs
increase in visitation
project delay under the base case.
The range of values used for each uncertain variable and detailed results of the sensitivity analysis are set
out below with some interpretation of the results. Note that the sensitivity analysis for each uncertain
variable was undertaken by holding all other variables constant at their ‘expected’ values. The assumptions
and results of the sensitivity analysis are summarised and described in the following sections.
3.2.1. Discount rates
Costs and benefits are specified in real terms (i.e. constant 2019 dollars) and future values were converted
to present values by applying a discount rate of 7 per cent. A sensitivity analysis was conducted using
discount rates of 3 and 10 per cent (Table 3-1).
Table 3-1 Results of the senstitivity analysis – discount ratea
Discount Rate NPV ($m) BCR IRR
3% 3.21 1.09 8%
7%b 0.36 1.01 8%
10% -1.11 0.96 8%
a In 2019 dollars.
b Expected value.
Source: BDO EconSearch analysis
As expected, the NPV and BCR improve with the lower (3 per cent) discount rate. This occurs because,
although the bulk of the project costs are ‘up front’ and are not significantly affected by the discount rate,
the benefits accrue over many years and are greater, in present value terms, when the discount rate is
lower.
Under the higher (8 per cent) discount rate the NPV and BCR indicate that the 'with BBRF investment'
scenario is still preferable to the base case. Note that the IRR is not affected by the discount rate. In fact,
it can be interpreted as the discount rate at which the NPV is equal to zero.
3.2.2. Investment costs
The projected investment costs have the potential to vary from currents estimates. Accordingly, a sensitivity
analysis was undertaken to illustrate the effect of a 25 per cent increase or 25 per cent decrease in
investment costs. The results of this analysis are summarised in Table 3-2.

Economic Analysis of Goolwa Wharf Precinct Project 14 Prepared by BDO EconSearch
Table 3-2 Results of the sensitivity analysis – investment costsa
Investment costs NPV ($m) BCR IRR
75% 1.23 1.04 10%
100%b 0.36 1.01 8%
125% -0.52 0.98 6%
a In 2019 dollars.
b Expected value.
Source: BDO EconSearch analysis
The results are moderately sensitive to the investment cost assumptions. With a 25 per cent increase in
operating costs, the project would become unviable. Not surprisingly, the appeal of the redevelopment
option by all three indicators would improve if investment costs were 25 per cent less than the expected
values.
3.2.3. Increase in visitation
The expected increase in visitation has the potential to vary from currents estimates (5 per cent).
Accordingly, a sensitivity analysis was undertaken to illustrate the effect of a 50 per cent decrease or 50
per cent increase in expected visitation. The results of this analysis are summarised in Table 3-3.
Table 3-3 Results of sensitivity analysis – increase in visitationa
Increase in visitation NPV ($m) BCR IRR
50% -1.57 0.91 4%
100%b 0.36 1.01 8%
150% 2.28 1.05 11%
a In 2019 dollars.
b Expected value.
Source: BDO EconSearch analysis
The results are sensitive to the visitation increase assumption. With a 50 per cent decrease in expected
additional visitation, the project would become unviable. Not surprisingly, the appeal of the redevelopment
option by all three indicators would improve if additional visitation were 50 per cent more than the expected
value.
3.2.4. Project delay under the base case
Under the base case it was assumed that the Goolwa Wharf Precinct redevelopment would go ahead without
government investment but with a delay of 10 years. This is an uncertain assumption as Alexandrina Council
may take different investment decisions due to unforeseen circumstances. A sensitivity analysis was
undertaken to illustrate the effect of a 5-year delay (50 per cent less than the expected value) and 15-year
delay (50 per cent more than the expected value). The results of this analysis are summarised in Table 3-4.

Economic Analysis of Goolwa Wharf Precinct Project 15 Prepared by BDO EconSearch
Table 3-4 Results of sensitivity analysis – project delaya
Project delay under the base case (yrs) NPV ($m) BCR IRR
5 0.21 1.01 8%
10b 0.36 1.01 8%
15 0.46 1.01 8%
a In 2019 dollars.
b Expected value.
Source: BDO EconSearch analysis
The results are moderately sensitive to the project delay assumption under the base case. However, even
with a 50 per cent decrease in this assumption, the project would still be viable. Not surprisingly, the appeal
of the redevelopment option by all three indicators would improve if the project delay under the base case
was 50 per cent more than the expected value.

Economic Analysis of Goolwa Wharf Precinct Project 16 Prepared by BDO EconSearch
4. ECONOMIC IMPACT RESULTS
The impact analysis investigated the economic impact to the Alexandrina LGA region resulting from the
construction of the redevelopment and the expenditures made by visitors to Goolwa as a result.
4.1. Construction Phase
The capital cost estimates for the redevelopment are detailed in Section 2.1.4. The redevelopment will
involve a total capital investment of around $7.5 million over a 3 year period (Table 2-3). The economic
impact of the redevelopment will be determined by the extent of local labour and raw materials used and
the level of expenditures associated with the specialised contractors and equipment that will occur in the
region.
Of the total capital investment, approximately $3.88 million (52 per cent) is expected to be purchased from
goods and service providers from within the Alexandrina LGA region.
Gross regional product (GRP)
GRP is a measure of the net contribution of an activity or industry to the regional economy. It represents
payments to the primary inputs of production (labour, capital and land) and is a regional level equivalent
of gross domestic product. Estimates for the 3-year construction period are provided in Table 4-1.
The total contribution to GRP as a result of the construction expenditure is expected to be around $3.5
million, $2.2 million directly and $1.3 million in flow-on impacts (Table 4-1).
Table 4-1 Economic impact of the Goolwa Wharf Precinct redevelopment on the Alexandrina LGA region, construction phase
2020/21 2021/22 2022/23 Totala
GRP ($m)
Direct 0.9 0.9 0.4 2.2
Flow-on (production induced) 0.3 0.3 0.2 0.9
Flow-on (consumption induced) 0.2 0.2 0.1 0.4
Total 1.4 1.4 0.7 3.5
Employment (fte)
Direct 10 10 5 9
Flow-on (production induced) 4 4 2 3
Flow-on (consumption induced) 1 1 0 1
Total 15 15 7 13
a GRP impacts are a total over the three-year construction period and employment impacts are an average over the same period.
Source: BDO EconSearch analysis.
Employment (fte)
Employment is a key indicator of both regional economic activity and the welfare of regional households.
The estimates presented in Table 4-1 show that the direct employment effect in the Alexandrina LGA region
is expected to be 9 fte jobs on average, peaking at 10 fte in 2020/21 and 2021/22. Including indirect effects

Economic Analysis of Goolwa Wharf Precinct Project 17 Prepared by BDO EconSearch
(impacts on local businesses and service organisations), the employment effect is projected to 13 fte jobs
on average, peaking at 15 fte in 2020/21 and 2021/22.
4.2. Operating Phase
The second component of the economic impact estimates relates to the operational phase of the proposed
development. As described in Section 2.1.4, across the board it is expected that the annual number of
visitors to the Alexandrina LGA region will grow by around 5 per cent per annum due to the Goolwa Wharf
Precinct redevelopment. Because of the uncertainty of these projections, the sensitivity analysis (Section
4.3) considers a range of 2.5 and 7.5 per cent rates of attribution to the development.
Based on the projected growth in visitor numbers and profile of visitor expenditure (Table 2-5), the impact
of visitor expenditure over the 10 years to 2029/30 on the Alexandrina LGA economy are presented in Table
4-2.
Gross regional product (GRP)
The expected contribution to GRP once the redevelopment is complete is $3.7 million in 2023/24 rising to
$4.0 million by 2029/30.
Table 4-2 Economic impact of the Goolwa Wharf Precinct redevelopment on the Alexandrina LGA region, operating phase
2023/24 2024/25 2025/26 2026/27 2027/28 2028/29 2029/30 Av.
Annual
GRP ($m)
Direct 2.4 2.4 2.4 2.5 2.5 2.5 2.6 2.5
Flow-on (production induced) 0.9 0.9 0.9 0.9 0.9 0.9 1.0 0.9
Flow-on (consumption induced) 0.4 0.4 0.5 0.5 0.5 0.5 0.5 0.5
Total 3.7 3.8 3.8 3.9 3.9 3.9 4.0 3.9
Employment (fte)
Direct 29 29 30 30 30 30 30 30
Flow-on (production induced) 8 8 8 8 8 8 8 8
Flow-on (consumption induced) 3 3 3 3 3 3 3 3
Total 40 40 40 40 40 40 40 40
Source: BDO EconSearch analysis.
Employment (fte)
The estimates presented in Table 4-2 show that total employment generated by the redevelopment in the
RDAWEP region is expected to be around 40 on-going fte jobs from 2023/24 through to 2029/30.
4.3. Sensitivity Analysis
As described in Section 4.2, there is uncertainty around the expected growth in visitor numbers (5 percent)
due to the Goolwa Wharf Precinct redevelopment and a sensitivity analysis was undertaken using values 50
per cent less (2.5 per cent) and 50 per cent more than expected (8 per cent). The results of the sensitivity
analysis are presented in Table 4-3.
Economic Analysis of Goolwa Wharf Precinct Project 18 Prepared by BDO EconSearch
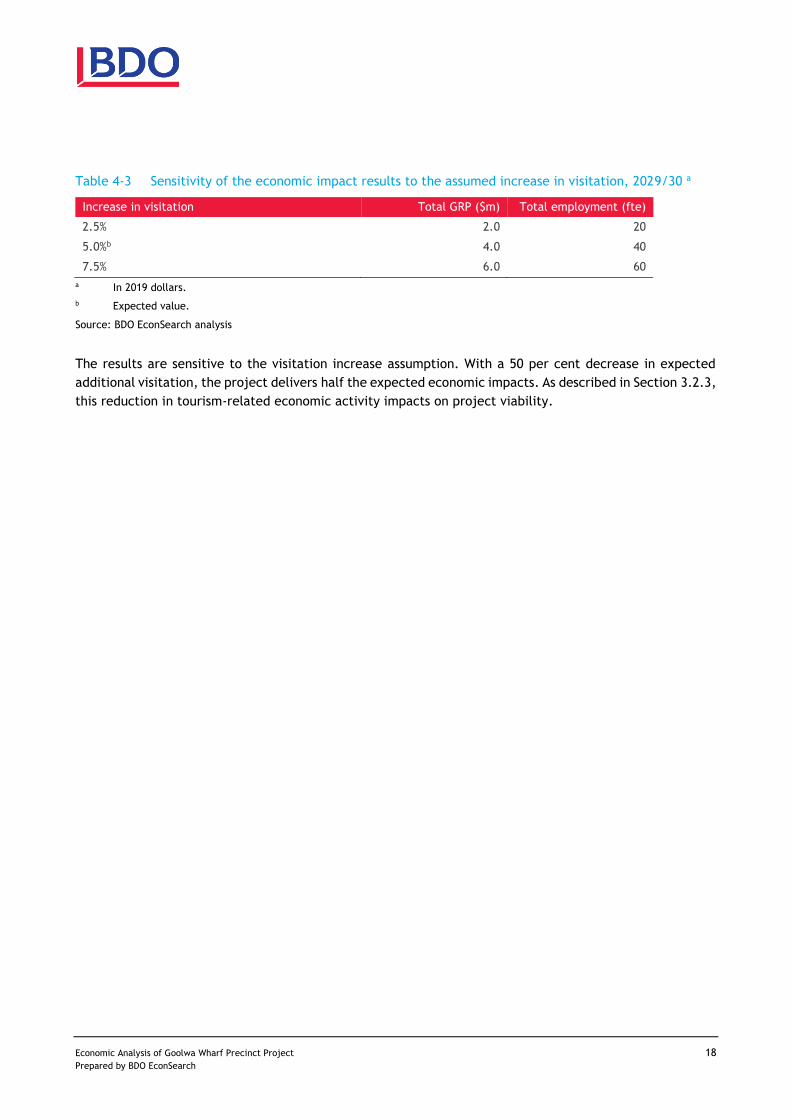
Table 4-3 Sensitivity of the economic impact results to the assumed increase in visitation, 2029/30 a
Increase in visitation Total GRP ($m) Total employment (fte)
2.5% 2.0 20
5.0%b 4.0 40
7.5% 6.0 60
a In 2019 dollars.
b Expected value.
Source: BDO EconSearch analysis
The results are sensitive to the visitation increase assumption. With a 50 per cent decrease in expected
additional visitation, the project delivers half the expected economic impacts. As described in Section 3.2.3,
this reduction in tourism-related economic activity impacts on project viability.

Economic Analysis of Goolwa Wharf Precinct Project 19 Prepared by BDO EconSearch
REFERENCES
Action Market Research and Hudson Howells 2019, Goolwa Wharf Precinct Upgrade Social Impacts Study, for Alexandrina Council, December.
BDO EconSearch 2019, Input-Output Tables for South Australia and its Regions 2017/18 Update: Technical Report, report prepared for Department of the Premier and Cabinet, December.
Department of Finance and Administration 2006, Handbook of Cost-Benefit Analysis, Financial Management Reference Material No. 6, Commonwealth of Australia, Canberra.
Department of Industry, Innovation and Science and Department of Infrastructure and Regional Development 2019a, Building Better Regions Fund: Community Investments Stream Round Four, November.
Department of Industry, Innovation and Science and Department of Infrastructure, Transport, Cities and Regional Development 2019b, Building Better Regions Fund Round Four – Cost-Benefit Analysis, Canberra, October.
Department of Treasury and Finance 2008, Guidelines for the Evaluation of Public Sector Initiatives, South Australia.
EconSearch 2017, Input-Output Tables for South Australia and its Regions 2015/16 Update: Technical Report, report prepared for Department of the Premier and Cabinet, May.
Mangan, J. and Phibbs, P. 1989, Demo-Economic Input-Output Modelling with Special Reference to the Wollongong Economy, Australian Regional Developments 20, AGPS, Canberra.
Tourism Research Australia (TRA) 2019a, Regional Tourism Profiles 2017/18, Canberra.
TRA 2019b, Tourism Forecasts 2019, August.
Disclaimer
The assignment is a consulting engagement as outlined in the ‘Framework for Assurance Engagements’,
issued by the Auditing and Assurances Standards Board, Section 17. Consulting engagements employ an
assurance practitioner’s technical skills, education, observations, experiences and knowledge of the
consulting process. The consulting process is an analytical process that typically involves some combination
of activities relating to: objective-setting, fact-finding, definition of problems or opportunities, evaluation
of alternatives, development of recommendations including actions, communication of results, and
sometimes implementation and follow-up.
The nature and scope of work has been determined by agreement between BDO and the Client. This
consulting engagement does not meet the definition of an assurance engagement as defined in the

Economic Analysis of Goolwa Wharf Precinct Project 20 Prepared by BDO EconSearch
‘Framework for Assurance Engagements’, issued by the Auditing and Assurances Standards Board, Section
10.
Except as otherwise noted in this report, we have not performed any testing on the information provided to
confirm its completeness and accuracy. Accordingly, we do not express such an audit opinion and readers
of the report should draw their own conclusions from the results of the review, based on the scope, agreed-
upon procedures carried out and findings.

Economic Analysis of Goolwa Wharf Precinct Project 21 Prepared by BDO EconSearch
APPENDIX 1 An Overview of Economic Impact Analysis Using Input-Output Method
Economic impact analysis based on an input-output (I-O) model provides a comprehensive economic
framework that is extremely useful in the resource planning process. Broadly, there are two ways in which
the I-O method can be used.
First, the I-O model provides a numerical picture of the size and shape of an economy and its essential
features. The I-O model can be used to describe some of the important features of an economy, the
interrelationships between sectors and the relative importance of the individual sectors.
Second, I-O analysis provides a standard approach for the estimation of the economic impact of a particular
activity. The I-O model is used to calculate industry multipliers that can then be applied to various
development or change scenarios.
The input-output database
Input-output analysis, as an accounting system of inter-industry transactions, is based on the notion that no
industry exists in isolation. This assumes, within any economy, each firm depends on the existence of other
firms to purchase inputs from, or sell products to, for further processing. The firms also depend on final
consumers of the product and labour inputs to production. An I-O database is a convenient way to illustrate
the purchases and sales of goods and services taking place in an economy at a given point in time.
As noted above, I-O models provide a numerical picture of the size and shape of the economy. Products
produced in the economy are aggregated into a number of groups of industries and the transactions between
them recorded in the transactions table. The rows and columns of the I-O table can be interpreted in the
following way:
The rows of the I-O table illustrate sales for intermediate usage (i.e. to other firms in the region)
and for final demand (e.g. household consumption, exports or capital formation).
The columns of the I-O table illustrate purchases of intermediate inputs (i.e. from other firms in
the region), imported goods and services and purchases of primary inputs (i.e. labour, land and
capital).
Each item is shown as a purchase by one sector and a sale by another, thus constructing two sides
of a double accounting schedule.
In summary, the I-O model can be used to describe some of the important features of a state or regional
economy, the interrelationships between sectors and the relative importance of the individual sectors. The
model is also used for the calculation of sector multipliers and the estimation of economic impacts arising
from some change in the economy.
Using input-output analysis for estimation of economic impacts
The I-O model conceives the economy of the region as being divided up into a number of sectors and this
allows the analyst to trace expenditure flows. To illustrate this, consider the example of a vineyard that, in
the course of its operation, purchases goods and services from other sectors. These goods and services would
include fertiliser, chemicals, transport services, and, of course, labour. The direct employment created by
Economic Analysis of Goolwa Wharf Precinct Project 22 Prepared by BDO EconSearch
the vineyard is regarded in the model as an expenditure flow into the household sector, which is one of
several non-industrial sectors recognised in the I-O model.
Upon receiving expenditure by the vineyard, the other sectors in the regional economy engage in their own
expenditures. For example, as a consequence of winning a contract for work with vineyard, a spraying
contractor buys materials from its suppliers and labour from its own employees. Suppliers and employees in
turn engage in further expenditure, and so on. These indirect and induced (or flow-on) effects, as they are
called, are part of the impact of the vineyard on the regional economy. They must be added to the direct
effects (which are expenditures made in immediate support of the vineyard itself) in order to arrive at a
measure of the total impact of the vineyard.
It may be thought that these flow-on effects (or impacts) go on indefinitely and that their amount adds up
without limit. The presence of leakages, however, prevents this from occurring. In the context of the impact
on a regional economy, an important leakage is expenditure on imports, that is, products or services that
originate from outside the region, state or country (e.g. machinery).
Thus, some of the expenditure by the vineyard (i.e. expenditure on imports to the region) is lost to the
regional economy. Consequently, the flow-on effects get smaller and smaller in successive expenditure
rounds due to this and other leakages. Hence the total expenditure created in the regional economy is
limited in amount, and so (in principle) it can be measured.
Using I-O analysis for estimation of regional economic impacts requires a great deal of information. The
analyst needs to know the magnitude of various expenditures and where they occur. Also needed is
information on how the sectors receiving this expenditure share their expenditures among the various
sectors from whom they buy, and so on, for the further expenditure rounds.
In applying the I-O model to economic impact analysis, the standard procedure is to determine the direct
or first-round expenditures only. No attempt is made to pursue such inquiries on expenditure in subsequent
rounds, not even, for example, to trace the effects in the regional economy on household expenditures by
vineyard employees on food, clothing, entertainment, and so on, as it is impracticable to measure these
effects for an individual case, here the vineyard.
The I-O model is instead based on a set of assumptions about constant and uniform proportions of
expenditure. If households in general in the regional economy spend, for example, 13.3 per cent of their
income on food and non-alcoholic beverages, it is assumed that those working in vineyards do likewise.
Indeed, the effects of all expenditure rounds after the first are calculated by using such standard proportions
(i.e. multiplier calculations). Once a transactions table has been compiled, simple mathematical procedures
can be applied to derive multipliers for each sector in the economy.
Input-output multipliers
Input-output multipliers are an indication of the strength of the linkages between a particular sector and
the rest of the state or regional economy. As well, they can be used to estimate the impact of a change in
that particular sector on the rest of the economy.
Detailed explanations on calculating I-O multipliers, including the underlying assumptions, are provided in
any regional economics or I-O analysis textbook (see, for example, Jensen and West (1986)). They are
calculated through a routine set of mathematical operations based on coefficients derived from the I-O
transactions model, as outlined below.

Economic Analysis of Goolwa Wharf Precinct Project 23 Prepared by BDO EconSearch
The transactions table may be represented by a series of equations thus:
where Xi = total output of intermediate sector i (row totals);
Xij = output of sector i purchased by sector j (elements of the intermediate quadrant); and
Yj = total final demand for the output of sector i.
It is possible, by dividing the elements of the columns of the transactions table by the respective column
totals to derive coefficients, which represent more clearly the purchasing pattern of each sector. These
coefficients, termed 'direct' or 'I-O' coefficients, are normally denoted as aij, and represent the direct or
first round requirements from the output of each sector following an increase in output of any sector.
In equation terms the model becomes:
where aij (the direct coefficient ) = Xij/Xj. This may be represented in matrix terms:
X = AX + Y
where A = [aij], the matrix of direct coefficients.
The previous equation can be extended to:
(I-A)X = Y
where (I-A) is termed the Leontief matrix,
or X = (I-A)-1Y
where (I-A)-1 is termed the 'general solution', the 'Leontief inverse' or simply the inverse of the open model.
The general solution is often represented by:
Z = (I-A)-1 = [zij]
The I-O table can be 'closed' with respect to certain elements of the table. Closure involves the transfer of
items from the exogenous portions of the table (final demand and primary input quadrants) to the
endogenous section of the table (intermediate quadrant). This implies that the analyst considers that the
transferred item is related more to the level of local activity than to external influences. Closure of I-O
tables with respect to households is common and has been adopted in this project.
X X X X Y
X X X X Y
X X X X Y
n
n
n n n nn n
1 11 12 1 1
2 21 22 2 2
1 2
....................
....................
....................
X a X a X a X Y
X a X a X a X Y
X a X a X a X Y
n n
n n
n n n nn n n
1 11 1 12 2 1 1
2 21 1 22 2 2 2
1 11 2 2
....................
....................
....................

Economic Analysis of Goolwa Wharf Precinct Project 24 Prepared by BDO EconSearch
The 'closed' direct coefficients matrix may be referred to as A*. The inverse of the Leontief matrix formed
from A* is given by:
Z* = (I- A*)-1 = [z*ij]
Z* is referred to as the 'closed inverse' matrix.
A multiplier is essentially a measurement of the impact of an economic stimulus. In the case of I-O
multipliers the stimulus is normally assumed to be an increase of one dollar in sales to final demand by a
sector. The impact in terms of output, contribution to gross regional product, household income and
employment can be identified in the categories discussed below.
(i) The initial impact: refers to the assumed dollar increase in sales. It is the stimulus or the cause
of the impacts. It is the unity base of the output multiplier and provides the identity matrix of
the Leontief matrix. Associated directly with this dollar increase in output is an own-sector
increase in household income (wages and salaries, drawings by owner operators etc.) used in the
production of that dollar. This is the household income coefficient hj. Household income,
together with other value added (OVA), provide the total gross regional product from the
production of that dollar of output. The gross regional product coefficient is denoted vj.
Associated also will be an own-sector increase in employment, represented by the size of the
employment coefficient. This employment coefficient ej represents an employment/output ratio
and is usually calculated as 'employment per million dollars of output'.
(ii) The first round impact: refers to the effect of the first round of purchases by the sector providing
the additional dollar of output. In the case of the output multiplier this is shown by the direct
coefficients matrix [aij]. The disaggregated effects are given by individual aij coefficients and the
total first-round effect by aij. First-round household income effects are calculated by
multiplying the first-round output effects by the appropriate household income coefficient (hj).
Similarly, the first-round gross regional product and employment effects are calculated by
multiplying the first-round output effects by the appropriate gross regional product (vj) and
employment (ej) coefficients.
(iii) Industrial-support impacts. This term is applied to 'second and subsequent round' effects as
successive waves of output increases occur in the economy to provide industrial support, as a
response to the original dollar increase in sales to final demand. The term excludes any increases
caused by increased household consumption. Output effects are calculated from the open Z
inverse, as a measure of industrial response to the first-round effects. The industrial-support
output requirements are calculated as the elements of the columns of the Z inverse, less the
initial dollar stimulus and the first-round effects. The industrial support household income, gross
regional product and employment effects are defined as the output effects multiplied by the
respective household income, gross regional product and employment coefficients. The first-
round and industrial-support impacts are together termed the production-induced impacts.
(iv) Consumption-induced impacts: are defined as those induced by increased household income
associated with the original dollar stimulus in output. The consumption-induced output effects
are calculated in disaggregated form as the difference between the corresponding elements in
the open and closed inverse (i.e. z*ij - zij, and in total as (z*ij - zij). The consumption-induced
household income, gross regional product and employment effects are simply the output effects

Economic Analysis of Goolwa Wharf Precinct Project 25 Prepared by BDO EconSearch
multiplied by the respective household income, gross regional product and employment
coefficients.
(v) Flow-on impacts: are calculated as total impact less the initial impact. This allows for the
separation of 'cause and effect' factors in the multipliers. The cause of the impact is given by the
initial impact (the original dollar increase in sales to final demand), and the effect is represented
by the first-round, industrial-support and consumption-induced effects, which together
constitute the flow-on effects.
Each of the five impacts are summarised in Appendix Table 2-1. It should be noted that household income,
gross regional product and employment multipliers are parallel concepts, differing only by their respective
coefficients hj, vj and ej.
The output multipliers are calculated on a 'per unit of initial effect' basis (i.e. output responses to a one
dollar change in output). Household income, gross regional product and employment multipliers, as
described above, refer to changes in household income per initial change in output, changes to gross regional
product per initial change in output and changes in employment per initial change in output. These
multipliers are conventionally converted to ratios, expressing a 'per unit' measurement, and described as
Type I and Type II ratios. For example, with respect to employment:
Type I employment ratio = [initial + first round + industrial support]/initial
and
Type II employment ratio = [initial + production induced3 + consumption induced]/initial
Appendix Table 1-1 The structure of input-output multipliers for sector ia
Impacts General formula
Output multipliers ($)
Initial 1
First-round iaij
Industrial-support izij-1-iaij
Consumption-induced iz*ij-izij
Total iz*ij
Flow-on iz*ij-1
Household Income multipliers ($)
3 Where (first round + industrial support) = production induced.
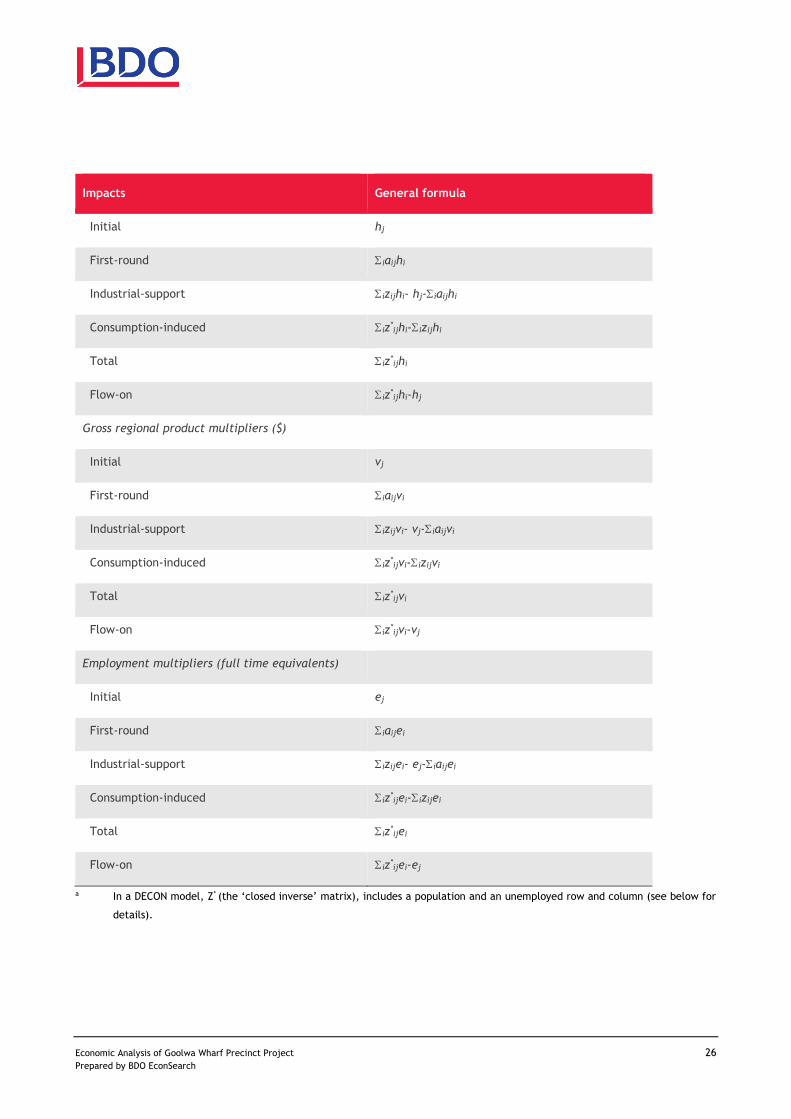
Economic Analysis of Goolwa Wharf Precinct Project 26 Prepared by BDO EconSearch
Impacts General formula
Initial hj
First-round iaijhi
Industrial-support izijhi- hj-iaijhi
Consumption-induced iz*ijhi-izijhi
Total iz*ijhi
Flow-on iz*ijhi-hj
Gross regional product multipliers ($)
Initial vj
First-round iaijvi
Industrial-support izijvi- vj-iaijvi
Consumption-induced iz*ijvi-izijvi
Total iz*ijvi
Flow-on iz*ijvi-vj
Employment multipliers (full time equivalents)
Initial ej
First-round iaijei
Industrial-support izijei- ej-iaijei
Consumption-induced iz*ijei-izijei
Total iz*ijei
Flow-on iz*ijei-ej
a In a DECON model, Z* (the ‘closed inverse’ matrix), includes a population and an unemployed row and column (see below for
details).

Economic Analysis of Goolwa Wharf Precinct Project 27 Prepared by BDO EconSearch
Model assumptions
There are a number of important assumptions in the I-O model that are relevant in interpreting the
analytical results.
Industries in the model have a linear production function, which implies constant returns to scale
and fixed input proportions.
Another model assumption is that firms within a sector are homogeneous, which implies they
produce a fixed set of products that are not produced by any other sector and that the input
structure of the firms are the same. Thus it is preferable to have as many sectors as possible
specified in the models and the standard models for this study were compiled with 66 sectors.
The model is a static model that does not take account of the dynamic processes involved in the
adjustment to an external change, such as a permanent change in natural resources management.
Extending the standard economic impact model as a DECON model
Based on work undertaken by EconSearch (2009 and 2010a) and consistent with Mangan and Phibbs (1989),
the I-O model developed for this project was extended as demographic-economic (DECON) model. The two
key characteristics of the DECON model, when compared with a standard economic model, are as follows.
1. The introduction of a population ‘sector’ (or row and column in the model) makes it possible to
estimate the impact on local population levels of employment growth or decline.
2. The introduction of an unemployed ‘sector’ makes it possible to account for the consumption-
induced impact of the unemployed in response to economic growth or decline.
The population ‘sector’
The introduction of a population ‘sector’ to the standard I-O model allows for the calculation of population
multipliers. These multipliers measure the flow-on population impact resulting from an initial population
change attributable to employment growth or decline in a particular sector of the regional economy.
Calculation of population multipliers is made possible by inclusion of a population row and column in the
'closed' direct coefficients matrix of the I-O model.
Population row: the population coefficient (pj) for sector j of the DECON model is represented as:
pj = -rhoj * ej * family sizej
where rhoj = the proportion of employees in sector j who remain in the region after they lose their job
(negative employment impact) or the proportion of new jobs in sector j filled by previously
unemployed locals (positive employment impact);
ej = the employment coefficient for sector j; and
family sizej = average family size for sector j.
Population column: the population column of the DECON model is designed to account for growth or decline
in those sectors of the economy that are primarily population-driven (i.e. influenced by the size of the
population) rather than market-driven (i.e. dependent upon monetary transactions). Clearly, many of the

Economic Analysis of Goolwa Wharf Precinct Project 28 Prepared by BDO EconSearch
services provided by the public sector fit this description and, for the purpose of this analysis, it was assumed
that the following intermediate sectors were primarily population-driven:
public administration and defence;
education;
health and community services; and
cultural and recreational services.
Thus, the non-market coefficient for sector j of the DECON model is represented as expenditure on that
non-market service (by governments) in $million per head of population.
The population multiplier for sector j is represented as: z*pj / ppj
where z*pj = coefficient of the ‘closed inverse’ matrix in the population row for sector j; and
ppj = coefficient of the direct coefficients matrix in the population row for sector j.
Sources of local data for the population sector of the DECON models used in this project included the
following.
rho: little or no published data are available to assist with estimation of this variable, particularly
at a regional level. The DECON models have been constructed to enable the analyst to estimate
this variable on the basis of the availability superior data or assumptions.
Family size: in order to estimate average family size by industry, relevant data were extracted
from the Australian Bureau of Statistics 2006 Census of Population and Housing using the
TableBuilder database. These data were modified by the consultants in order to ensure consistency
with the specification and conventions of the I-O models.
The unemployed ‘sector’
As outlined above, the introduction of an unemployed ‘sector’ to the standard I-O model makes it possible
to account for the consumption-induced impact of the unemployed in response to economic growth or
decline.
Through the inclusion of an unemployed row and column in the 'closed' direct coefficients matrix of the
standard I-O model it is possible to calculate Type III multipliers (for output, gross regional product,
household income and employment).
The key point to note is that, in the situation where at least some of the unemployed remain in a region
after losing their job (negative employment impact) or some of the new jobs in a region are filled by
previously unemployed locals (positive employment impact), Type III multipliers will be smaller than the
more frequently used Type II multipliers.
Unemployed row: the unemployed coefficient (uj) for sector j of the DECON model is represented as:
uj = -rhoj * (1-essj) * ej

Economic Analysis of Goolwa Wharf Precinct Project 29 Prepared by BDO EconSearch
where rhoj = the proportion of employees in sector j who remain in the region after they lose their job
(negative employment impact) or the proportion of new jobs in sector j filled by previously
unemployed locals (positive employment impact);
essj = the proportion of employed in sector j who are not eligible for welfare benefits when they
lose their job; and
ej = the employment coefficient for sector j.
Unemployed column: the unemployed column of the DECON model is an approximation of total consumption
expenditure and the consumption pattern of the unemployed. It is represented as dollars per unemployed
person rather than $million for the region as a whole, as is the case for the household expenditure column
in a standard I-O model.
Sources of local (i.e. state and regional) data for the unemployed sector of the DECON models used in this
study included the following.
ess: in order to estimate the proportion of employed by industry who are not eligible for welfare
benefits when they lose their job, relevant data were were extracted from the Australian Bureau
of Statistics 2006 Census of Population and Housing using the TableBuilder database. These data
were modified by the consultants in order to ensure consistency with the specification and
conventions of the I-O models.
Unemployed consumption: total consumption expenditure by the unemployed was based on an
estimate of the Newstart Allowance whilst the pattern of consumption expenditure was derived
from household income quintiles in the 2003/04 Household Expenditure Survey (ABS 2006).
Incorporating a tourism demand profile in the I-O model
Tourism expenditure is a measure of the value of sales of goods and services to visitors to the state or region.
The following method and data sources were used to estimate tourism expenditure by industry sector for
the region.
The primary data were sourced from Tourism Research Australia (TRA).
Base datasets included total tourism expenditure by TRA tourism region and average expenditure
profiles, by region, across a range of goods and services (e.g. food and drink, fuel, shopping, etc.).
Estimates were available for domestic day, domestic overnight and international visitor
expenditure.
The first adjustment to the base data was the development of a concordance between the TRA
tourism regions and I-O model regions and the allocation of these base data to the relevant I-O
model region. These allocations were based, in turn, on an ABS concordance between TRA tourism
regions and SLAs.
The second adjustment to the base data was the application of a more detailed expenditure
breakdown from the ABS Australian National Accounts: Tourism Satellite Account for both domestic
and international visitor expenditure (ABS 2010d).
The third adjustment to the base data was the conversion of tourism expenditure estimates from
purchasers’ to basic prices (i.e. reallocation of net taxes (taxes minus subsidies) and marketing and

Economic Analysis of Goolwa Wharf Precinct Project 30 Prepared by BDO EconSearch
transport margins) to make the data consistent with accounting conventions used in the national,
state and regional I-O models. Purchasers’ to basic price ratios for tourism expenditure categories
were derived from ABS data.
The final adjustment to the base data was the allocation of the tourism expenditure data in basic
prices to the relevant input-output sectors (intermediate sectors, taxes less subsidies or imports)
in which the expenditure occurred, thus compiling a profile of sales to final demand. This process
was undertaken for each type of tourism expenditure (domestic day, domestic overnight and
international visitor) and the results aggregated to form a single tourism demand profile. Profiles
were developed at the state and regional levels.
Constructing a RISE v6.04 economic impact model
In the final model construction stage the data described above were incorporated into a Microsoft Excel®
spreadsheet based economic impact model for the region and state (i.e. RISE v6.04)4. This model allows for
description of the structure of the economy. It can also be used for the estimation of economic impacts
over time in response to the introduction of a new industry or a change in the final demand for the output
of one or many sectors. Model assumptions can be modified to account for:
price changes between the model construction year (2009/10) and the base year for the analysis;
labour productivity change over time (as above and for the subsequent years);
the level of regional migration (e.g. for a positive employment impact, the proportion of new jobs
filled by previously unemployed locals).
4 For further details on the use and application of this type of model see BDO EconSearch (2019).

Economic Analysis of Goolwa Wharf Precinct Project 31 Prepared by BDO EconSearch
APPENDIX 2 Detailed CBA Model
Appendix Table 2-1 Detailed CBA modela
PV 2021 2022 2023 2024 2030 2031 2032 2033 2034 2044 2045
Base case 0 0 0 0 0 1 2 3 4 14 15
Benefits ($m)
Visitation revenue 17,273,079 0 0 0 0 0 0 0 0 4,669,216 5,028,898 5,028,898
Residual value of project capital 359,606 0 0 0 0 0 0 0 0 0 0 1,824,054
Total benefits ($m) 17,632,685 0 0 0 0 0 0 0 0 4,669,216 5,028,898 6,852,952
Costs ($m)
Construction costs 3,616,344 0 0 0 0 0 3,000,000 3,000,000 1,500,000 0 0 0
Visitation costs 15,084,090 0 0 0 0 0 0 0 0 4,077,651 4,391,495 4,391,495
Total Costs ($m) 18,700,435 0 0 0 0 0 3,000,000 3,000,000 1,500,000 4,077,651 4,391,495 4,391,495
Option 1 1 2 3 4 10 11 12 13 14 24 25
Benefits ($m)
Visitation revenue 47,676,805 0 0 0 4,669,216 5,028,898 5,028,898 5,028,898 5,028,898 5,028,898 5,028,898 5,028,898
Residual value of project capital 56,780 0 0 0 0 0 0 0 0 0 0 288,009
Total benefits ($m) 47,733,585 0 0 0 4,669,216 5,028,898 5,028,898 5,028,898 5,028,898 5,028,898 5,028,898 5,316,907
Costs ($m)
Construction costs 7,113,896 3,000,000 3,000,000 1,500,000 0 0 0 0 0 0 0 0
Visitation costs 41,634,534 0 0 0 4,077,651 4,391,495 4,391,495 4,391,495 4,391,495 4,391,495 4,391,495 4,391,495
Total Costs ($m) 48,748,430 3,000,000 3,000,000 1,500,000 4,077,651 4,391,495 4,391,495 4,391,495 4,391,495 4,391,495 4,391,495 4,391,495
Incremental benefits ($m) 30,403,726 0 0 0 4,669,216 5,028,898 5,028,898 5,028,898 5,028,898 359,682 0 -
1,536,046
Incremental costs ($m) 30,047,996 3,000,000 3,000,000 1,500,000 4,077,651 4,391,495 1,391,495 1,391,495 2,891,495 313,844 0 0
Net benefits (NPV) ($m) 355,731 -
3,000,000 -
3,000,000 -
1,500,000 591,565 637,403 3,637,403 3,637,403 2,137,403 45,837 0
-1,536,046
Benefit Cost Ratio 1.01
Internal rate of Return 8% a Years 2024/25 – 2028/29 and 2034/35 – 2042/43 are hidden for presentational purposes. Source: BDO EconSearch analysis