a resonance condition encountered in a shop overspeed
TRANSCRIPT

A Resonance Condition Encountered in a Shop Overspeed Machine Due to Inertia Effects
-The Theoretical Basis and Practical Experience
Martin D. Maier Principal Rotor Dynamic Analysis Engineer Dresser-Rand, A Siemens Business Olean, New York, USA Tristen Barnes
Product Design Engineer Dresser-Rand, A Siemens Business Olean, New York, USA
Mark J. Kuzdzal
R&D Head of Advanced Components and Methods Dresser-Rand, A Siemens Business Olean, New York, USA Sean Frier
Manufacturing Engineer Dresser-Rand, A Siemens Business Olean, New York, USA
ABSTRACT
Martin D. Maier is a Principal Rotor Dynamic Analysis Engineer at Dresser-Rand, part of Siemens Gas and Power division. He has 42 years of experience with Dresser-Rand in torsional and lateral rotor dynamic analysis, coupling, bearing and seal design, and machinery vibration analysis as it relates to product development and production support. His experience includes program automation, engineering standards development and vibration troubleshooting. He is a licensed P. E. in New York State, since 1991, and is a member of the Vibration Institute with a Level IV, Machinery Analyst Certification.
Tristen Barnes is a centrifugal compressor Product Design Engineer at Dresser-Rand, part of Siemens Gas and Power division. He has 6 years of experience with the design, manufacture, and test of centrifugal turbomachinery. He holds a BS in Mechanical Engineering for the University of Clarkson, Potsdam, NY.
Sean Frier is a Manufacturing Engineer in the Rotor Center at Dresser-Rand, part of a Siemens Gas and Power division. He has 6 years of manufacturing experience in impeller turning, milling, welding, balance and overspeed. He holds a BS in Industrial Engineering for The State University of New York at Buffalo.
Mark J. Kuzdzal is currently the R&D Head of the Advanced Components and Methods group at Dresser-Rand, part of Siemens Gas and Power division. Prior to this assignment he was the Director of Business Development for the supersonic compression product. Prior to this and for nearly a decade, Mark was the Manager of Core Technologies for Dresser-Rand Company, responsible for Rotordynamics, Materials & Welding, Solid Mechanics, Aero/thermo dynamics and Acoustics disciplines. Mark started his career with Dresser-Rand after earning a B.S. Degree (Mechanical Engineering, 1988) from the State University of New York at Buffalo. He has co-authored numerous technical papers and holds over a dozen U.S. Patents. Mr. Kuzdzal is an emeritus member of the Texas A&M turbomachinery advisory committee and the Penn State Behrend Mechanical Engineering Technology industrial advisory committee.

Copyright© 2019 by Turbomachinery Laboratory, Texas A&M Engineering Experiment Station Page 2
ABSTRACT This lecture will discuss the theory relating to an inertia dominant resonance condition and the associated vibration characteristics of a high-speed rotor system when the ratio of the polar moment of inertia and transverse moment of inertia approaches a value of one. Impeller overspeed testing is a likely place for these inertia values to converge. An example is provided for a 51-inch (1295 mm) diameter centrifugal impeller operating in an overspeed vacuum pit at 5,780 RPM at a tip speed of 1294 ft/sec [394 m/sec]. After a methodical, stepwise testing campaign, the problem was corrected by redesigning the rotor system to produce an inertia ratio less than 0.70. This lecture discusses the theoretical basis for this phenomenon, compares the results of the rotor dynamic simulations with overspeed vibration test data and provides an approach for assessing the level of risk for the occurrence of this resonance condition as a function of inertia ratio.
INTRODUCTION Centrifugal impellers that meet API requirements must be individually balanced and oversped to 115% of maximum continuous operating speed (MCOS). The impellers shown in this paper were manufactured to API Standard 617-Part 1, 8th Edition [1]. Section 4.8.8.1 and Section 6.3.3.1 states the following regarding balance and overspeed respectively:
4.8.8.1 Major parts of the rotating element, such as the shaft, balancing drum, and impellers, shall be individually dynamically balanced before assembly, to ISO 1940 Grade G0.67 or better… 6.3.3.1 Each impeller shall be subjected to an overspeed test at not less than 115% of MCOS for a minimum duration of 1 minute…
The impellers were balanced to API 617, 8th Edition (ISO 1940/1 G0.67). This was accomplished before each run in the overspeed machine. The overspeed machine can be outfitted with various mandrels to accommodate various sizes of impellers and speeds, while also holding a vacuum of 5.8 PSIA (0.4 bara). The machine constantly measures vacuum pressure, speed, and vibration during the test. The vibration is measured with a proximity probe and the unit will trip and shut down when a maximum vibration of 8 mils (200 microns) is reached. This is referred to as 100% full scale (FS) amplitude. It uses rolling element bearings with a squeeze film damper bearing in series and a key phaser was added to enable rotordynamics analysis investigation. A 150 HP (112 Kw) main drive motor is connected to the mandrel via a belt drive. The shafting is oriented in a vertical direction and a ‘bumper’ bearing is located on the bottom of the machine. The mandrel is manufactured so that a pin is located at the bottom of the mandrel. During mandrel installation, the pin fits inside the bumper bearing with a 0.020 inch (0.51 mm) clearance. This limits motion of the mandrel and impeller in the event of excessive vibrational amplitude. Figure 1 is a photo of the overspeed pit. The mandrel assembly is positioned on the cart (at far left) which is rolled under the overspeed machine where it is fastened to the spindle. It is then lowered into the pit and a vacuum pump evacuates the chamber to minimize power required to drive the impeller and heat generation associated with windage. Historically, the authors’ company has used the same mandrel on a given job both for balancing and overspeed of an impeller, saving both time and money. As a result, the mandrel must be designed to the length of the overspeed machine and be able to withstand the bending moment of the impeller mounted on the balance machine during balance. This can result in a rotor system where the ratio of the polar and transverse moments of inertia (Ip and It, respectively) is approaching one. In this paper, ‘Ip’ is defined as polar mass moment of inertia and ‘It’ is defined as transverse (diametral) moment of inertia. Inertia is typically expressed in units of Lb-in2 (Customary) and Kg-m2 (Metric). The manufacturer of the overspeed machine provides operational guideline based on these parameters. It states that Ip/It ratios between 0.70 and 1.20 should be avoided. See Figure A-1 of the Appendix for excerpt from the Users Manual. The theoretical basis for this operational guideline will now be explored.

Copyright© 2019 by Turbomachinery Laboratory, Texas A&M Engineering Experiment Station Page 3
Figure 1: Overspeed Pit
BASIC THEORY
The equation for a simple Laval-Jeffcott rotor from Vance [2] is given below:
Figure 2: Jeffcott Rotor & Natural Frequencies:
𝜔1 = 𝜔2 = √2𝐾
𝑀
𝜔3 = 𝐼𝑝
2𝐼𝑡∗ 𝜔 + √
𝐾𝐿2
2𝐼𝑡+ (
𝐼𝑝
2𝐼𝑡∗ 𝜔)
2
𝜔4 = 𝐼𝑝
2𝐼𝑡∗ 𝜔 − √
𝐾𝐿2
2𝐼𝑡+ (
𝐼𝑝
2𝐼𝑡∗ 𝜔)
2
L
K
M Ip It
Disc Where, K – Bearing stiffness M – Effective mass of rotor Ip – Polar moment of inertia It – Transverse (or diametral) moment of inertia L – Bearing span 𝜔 – Rotational Speed 𝜔1, 𝜔2, 𝜔3,𝜔4 – Natural Frequencies Shaft is assumed to be massless Shaft stiffness is assumed to be infinite
K
Copyright© 2019 by Turbomachinery Laboratory, Texas A&M Engineering Experiment Station Page 4
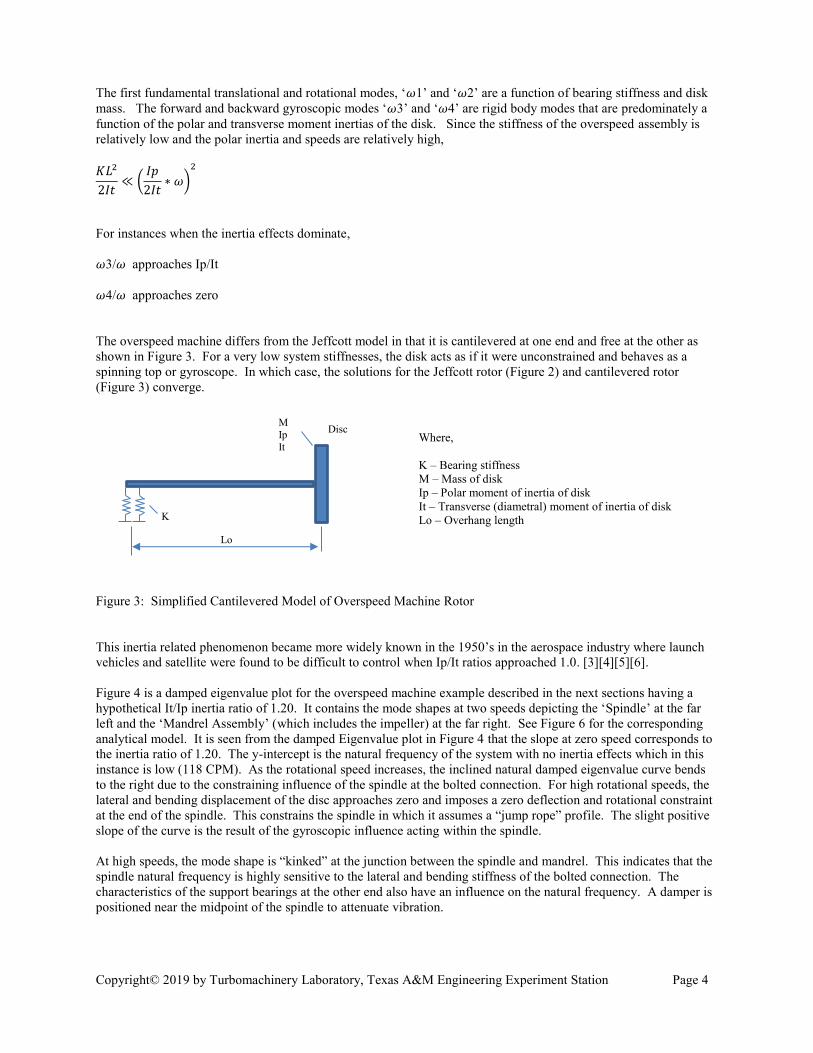
The first fundamental translational and rotational modes, ‘𝜔1’ and ‘𝜔2’ are a function of bearing stiffness and disk mass. The forward and backward gyroscopic modes ‘𝜔3’ and ‘𝜔4’ are rigid body modes that are predominately a function of the polar and transverse moment inertias of the disk. Since the stiffness of the overspeed assembly is relatively low and the polar inertia and speeds are relatively high, 𝐾𝐿2
2𝐼𝑡≪ (
𝐼𝑝
2𝐼𝑡∗ 𝜔)
2
For instances when the inertia effects dominate, 𝜔3/𝜔 approaches Ip/It 𝜔4/𝜔 approaches zero
The overspeed machine differs from the Jeffcott model in that it is cantilevered at one end and free at the other as shown in Figure 3. For a very low system stiffnesses, the disk acts as if it were unconstrained and behaves as a spinning top or gyroscope. In which case, the solutions for the Jeffcott rotor (Figure 2) and cantilevered rotor (Figure 3) converge.
Figure 3: Simplified Cantilevered Model of Overspeed Machine Rotor This inertia related phenomenon became more widely known in the 1950’s in the aerospace industry where launch vehicles and satellite were found to be difficult to control when Ip/It ratios approached 1.0. [3][4][5][6]. Figure 4 is a damped eigenvalue plot for the overspeed machine example described in the next sections having a hypothetical It/Ip inertia ratio of 1.20. It contains the mode shapes at two speeds depicting the ‘Spindle’ at the far left and the ‘Mandrel Assembly’ (which includes the impeller) at the far right. See Figure 6 for the corresponding analytical model. It is seen from the damped Eigenvalue plot in Figure 4 that the slope at zero speed corresponds to the inertia ratio of 1.20. The y-intercept is the natural frequency of the system with no inertia effects which in this instance is low (118 CPM). As the rotational speed increases, the inclined natural damped eigenvalue curve bends to the right due to the constraining influence of the spindle at the bolted connection. For high rotational speeds, the lateral and bending displacement of the disc approaches zero and imposes a zero deflection and rotational constraint at the end of the spindle. This constrains the spindle in which it assumes a “jump rope” profile. The slight positive slope of the curve is the result of the gyroscopic influence acting within the spindle. At high speeds, the mode shape is “kinked” at the junction between the spindle and mandrel. This indicates that the spindle natural frequency is highly sensitive to the lateral and bending stiffness of the bolted connection. The characteristics of the support bearings at the other end also have an influence on the natural frequency. A damper is positioned near the midpoint of the spindle to attenuate vibration.
M Ip It
Lo
K
Disc Where, K – Bearing stiffness M – Mass of disk Ip – Polar moment of inertia of disk It – Transverse (diametral) moment of inertia of disk Lo – Overhang length

Copyright© 2019 by Turbomachinery Laboratory, Texas A&M Engineering Experiment Station Page 5
Attempts have been made to develop a closed form solution for overhung systems similar to this. Tiwari [7] developed a solution for a cantilevered shaft with a disk and a stick mounted at the free end. Gozdawa [8] described a numerical solution developed to simulate behavior of an impeller in an overspeed pit. Al-Khazali [9] and Chattoraj [10] performed dynamic simulations and experimental verification for simple overhung rotors which demonstrated strong gyroscopic effects. It is evident from the complexity of the subject rotor system that it necessitates a numerical solution to accurately determine the resonant frequency (i.e. intersection point) on the damped eigenvalue plot, particularly when the inertia ranges from 1.0 to 1.2.
Figure 4: Damped Eigenvalue Plot for Ip/It ratio of 1.20.
Copyright© 2019 by Turbomachinery Laboratory, Texas A&M Engineering Experiment Station Page 6
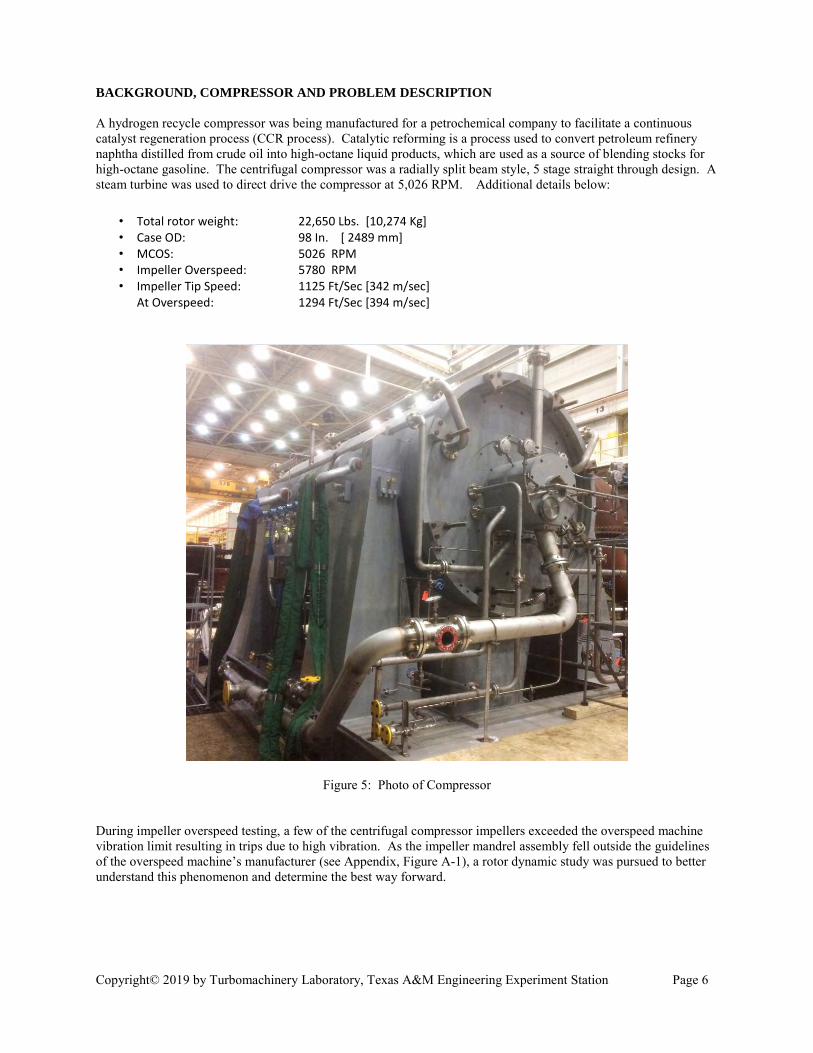
BACKGROUND, COMPRESSOR AND PROBLEM DESCRIPTION A hydrogen recycle compressor was being manufactured for a petrochemical company to facilitate a continuous catalyst regeneration process (CCR process). Catalytic reforming is a process used to convert petroleum refinery naphtha distilled from crude oil into high-octane liquid products, which are used as a source of blending stocks for high-octane gasoline. The centrifugal compressor was a radially split beam style, 5 stage straight through design. A steam turbine was used to direct drive the compressor at 5,026 RPM. Additional details below:
Figure 5: Photo of Compressor
During impeller overspeed testing, a few of the centrifugal compressor impellers exceeded the overspeed machine vibration limit resulting in trips due to high vibration. As the impeller mandrel assembly fell outside the guidelines of the overspeed machine’s manufacturer (see Appendix, Figure A-1), a rotor dynamic study was pursued to better understand this phenomenon and determine the best way forward.
• Total rotor weight: 22,650 Lbs. [10,274 Kg] • Case OD: 98 In. [ 2489 mm] • MCOS: 5026 RPM • Impeller Overspeed: 5780 RPM • Impeller Tip Speed: 1125 Ft/Sec [342 m/sec]
At Overspeed: 1294 Ft/Sec [394 m/sec]

Copyright© 2019 by Turbomachinery Laboratory, Texas A&M Engineering Experiment Station Page 7
BASELINE ANALYTICAL STUDY
An analytical model was created in the rotor dynamic simulation software [11][12] which has the capability of performing both speed-based and time-based rotor dynamic simulations . This rotor model is shown in Figure 6.
Figure 6: Rotor Dynamic Model The model consists of the overspeed spindle and a mandrel assembly which contains the impeller. The mandrel assembly (a rigid member) is bolted to the spindle (a flexible member) at the location shown in Figure 6. The mass properties of the mandrel assembly were determined from a 3-D CAD model. Recall this rotor assembly is vertical with the support spindle above the mandrel. Two annular disks were used to model the impeller. The axial width and outer diameter (OD) of the disks were chosen to match the total impeller weight and polar moment of inertia. The separation distance between the disks was chosen to match the transverse (diametral) inertia of the impeller. The axial location of the disks were chosen to match the impeller’s center of gravity (CG). The stiffness and damping characteristics of the bearings were provided by the manufacturer of the overspeed machine. Hysteresis material damping was not considered as the shaft elements do not experience oscillating tension or compression in the outer fibers as the orbit profile is one of circular precession. The lateral and bending stiffnesses of the bolted connection were selected to fine tune the model to approximately match the natural frequency of 4800 CPM as determined from base run testing. Figure 7 is a damped Eigenvalue plot which shows the lateral natural frequencies as plotted as a function of rotor speed. This type plot is discussed in detail by Vance [1] and Childs [13]. In this diagram, the intersection between the natural frequency lines and the inclined synchronous speed line identifies the system resonances. Normally, natural frequency lines are relatively horizontal. The lines may trend upward or downward due to the speed dependent characteristics of the bearings and gyroscopic effects. However, in this instance, it is seen that the natural frequency tracts the synchronous speed line and intersects it at 4800 CPM. The reason for this is the strong gyroscopic influence associated with the extended cantilevered support and inertia properties.
Copyright© 2019 by Turbomachinery Laboratory, Texas A&M Engineering Experiment Station Page 8
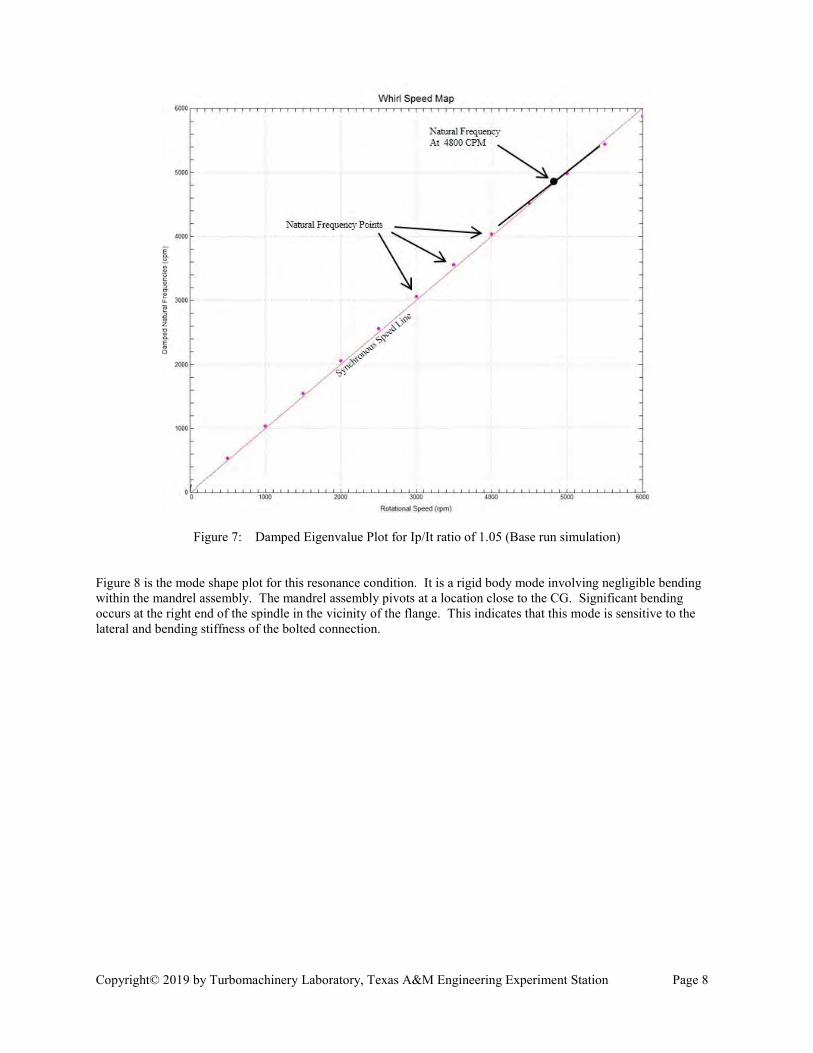
Figure 7: Damped Eigenvalue Plot for Ip/It ratio of 1.05 (Base run simulation) Figure 8 is the mode shape plot for this resonance condition. It is a rigid body mode involving negligible bending within the mandrel assembly. The mandrel assembly pivots at a location close to the CG. Significant bending occurs at the right end of the spindle in the vicinity of the flange. This indicates that this mode is sensitive to the lateral and bending stiffness of the bolted connection.

Copyright© 2019 by Turbomachinery Laboratory, Texas A&M Engineering Experiment Station Page 9
Figure 8: Mode Shape Plot At 4800 CPM (Forward Whirl) Figure 9 is an unbalance response plot which shows a pronounced peak at 4800 CPM with a classic 180 degrees phase change. The unbalance used in the analysis corresponds to 0.0001 inch (2.54 microns) of mass eccentricity. This translates to an unbalance of approximately 8W/N. This was assigned as a static unbalance at an axial position midway between the impeller cover and disk which correspond to the two balance planes.
Figure 9: Unbalance Response Plot From Steady State Analysis

Copyright© 2019 by Turbomachinery Laboratory, Texas A&M Engineering Experiment Station Page 10
INITIAL OVERSPEED TESTING
During initial overspeed testing of the 3rd stage impeller, the machine tripped out due to high vibration at a speed of approximately 4800 RPM as shown in Figure 10. This chart shows vibrational amplitude (green curve) and speed (orange curve) vs. time based on a full-scale amplitude of 8 mils (200 microns). The Impeller was run with a multi-piece, built-up, mandrel with the impeller shroud facing upward. The overspeed requirement for this impeller was 5780 RPM.
Figure 10: Initial Run Up – Time Based This data was converted from a time -based plot to a speed-based plot as shown in Figure 11.
Figure 11: Initial Run Up- Speed Based

Copyright© 2019 by Turbomachinery Laboratory, Texas A&M Engineering Experiment Station Page 11
It is seen from this figure that the vibration exceeds the classic speed-squared trend relationship documented by Childs [1993]. This indicates that the increase in vibration is the result of more than just the system’s response to a fixed amount of unbalance. A static “bump” (or ring) test was performed immediately following the overspeed test with the mandrel suspended vertically in the overspeed machine. This was done to determine if there was a resonance in the vicinity of 4800 RPM. Figure 12 is a spectrum plot which shows a mild response at approximately 5300 CPM. A magnified scale was used to display this response. The amplitude is on the same order as the noise floor (i.e. down in the weeds!) which indicates that this is not responsible for the observed vibration excursion.
Figure 12: Static Ring Test of Free Hanging Assembly
After further investigation, it was suspected that this vibration trip event was the result of a rigid body resonance condition as the Ip/It inertia ratio was outside the recommended operating limits identified in the overspeed machine manual. See Figure A-1 in Appendix. The Ip/It inertia ratio was 1.05. It became evident that it was necessary to understand this phenomenon more clearly to determine the best way of addressing it. Two approaches were explored:
1) Accelerating rapidly through resonance with the existing mandrel design
2) Modifying the mandrel inertia ratio to shift the resonance outside of the range of operation.

Copyright© 2019 by Turbomachinery Laboratory, Texas A&M Engineering Experiment Station Page 12
Acceleration Study
A parametric study was performed to determine if it was possible to accelerate (and decelerate) through this mode at such a rate to prevent the vibration from building to unacceptable levels. The rationale being that the greater the acceleration rate, the less time the system has to absorb energy and amplify. An unbalance force corresponding to a 0.0001 inch (2.54 micron) mass eccentricity (approximately 8 W/N) was used in the study. This unbalance was placed at an axial location midway between the impeller disk and shroud which correspond to the two balance planes. The transient response at the vibration probe location was calculated while accelerating from 0 to 6000 RPM in 0.1, 1.0 and 10 minutes as shown in Figures 13a, 13b, 13c respectively. It is seen that the calculate peak response approaches the steady state solution of 0.0125 inch (0.31 mm) for these acceleration times. It is suspected that the reason for this result is that the system is dwelling in a state of “quasi- resonance” throughout the speed range. This is evident from the damped Eigenvalue plot shown in Figure 7 where the natural frequency curve tracks the synchronous frequency line throughout the speed range. In this example, the calculated peak amplitude of 0.0125 inch (0.31 mm) is greater than the 0.0039 inch (100 micron) zero-to-peak vibration trip setting of the overspeed machine. The actual acceleration time in the overspeed machine was in excess of 100 minutes based on the maximum torque transmission capability of the belt drive. Since the system is essentially operating at the steady state condition at resonance, it is evident that it is not possible to successfully traverse the resonance condition due to the practical limits of the overspeed machine and levels of residual unbalance present in the mandrel assembly.

Copyright© 2019 by Turbomachinery Laboratory, Texas A&M Engineering Experiment Station Page 13
Figure 13a: Transient Response At Probe Location For 0.1 Minute Accel Time
Figure 13b: Transient Response At Probe Location For 1 Minute Accel Time
Figure 13c: Transient Response At Probe Location For 10 Minute Accel Time
Steady State Solution
Steady State Solution
Steady State Solution

Copyright© 2019 by Turbomachinery Laboratory, Texas A&M Engineering Experiment Station Page 14
Inertia Ratio Study
In this study, the separation distance between the disks was varied to change the transverse inertia and associated Ip/It inertia ratio. Figure 14 is a Damped Eigenvalue Plot which shows curves for Ip/It inertia ratios ranging from 1.20 to 0.70. It is seen that the resonance frequencies (intersections with the synchronous speed line) changes rapidly as the inertia ratio is reduced from 1.10 to 1.0 so this region should be avoided. For inertia ratios below 1.0, the resonance frequency is in the 100 CPM to 300 CPM range. It is evident that the natural frequencies for inertia ratios close to 1.0 are sensitive to small variations in modeling, boundary conditions and assumptions. For this reason, operation at inertia ratios between 1.0 and 0.95 should also be avoided.
Figure 14: Damped Eigenvalue Plot For Mandrel Assemblies With Various Inertia Ratios

Copyright© 2019 by Turbomachinery Laboratory, Texas A&M Engineering Experiment Station Page 15
Addition of Flywheel to Increase Ip/It inertia ratio above 1.20.
Following the high vibration of the impeller overspeed test, a decision was made to pursue a parallel path to resolve the issue in order to avoid disruptions in the production schedule. The two options that were pursued were:
• Install a flywheel on existing mandrel to increase inertia ratio above 1.20 (shorter lead time) • Redesign the mandrel to a one-piece mandrel with reduced inertia ratio below 0.70 (longer lead time)
The flywheel option was first implemented as a suitable flywheel forging was readily available. The flywheel was designed in such a way to increase the Ip/It inertia from 1.05 to 1.33, above the recommended minimum guideline of 1.20. Figure 15 shows the CAD model. Figure 16 is a photo of the assembly mounted in the low speed balance machine.
Figure 15: CAD model of assembly after the addition of the flywheel
Figure 16: Photo of the mandrel with the added flywheel

Copyright© 2019 by Turbomachinery Laboratory, Texas A&M Engineering Experiment Station Page 16
A sliding fit was selected between the flywheel and mandrel as there was concern with removal if a heat shrink interference was used. The flywheel assembly was axially clamped together in an attempt to maintain concentricity at speed. Figure 17 shows the subsequent run where the machine tripped at 4700 RPM. It was observed that the vibration was not repeatable between startup and shutdown. For example, at 4000 RPM, the vibration was 18% Full Scale (FS) during startup and 105% FS during shutdown.
Figure 17: Vibration Plot for Flywheel Case
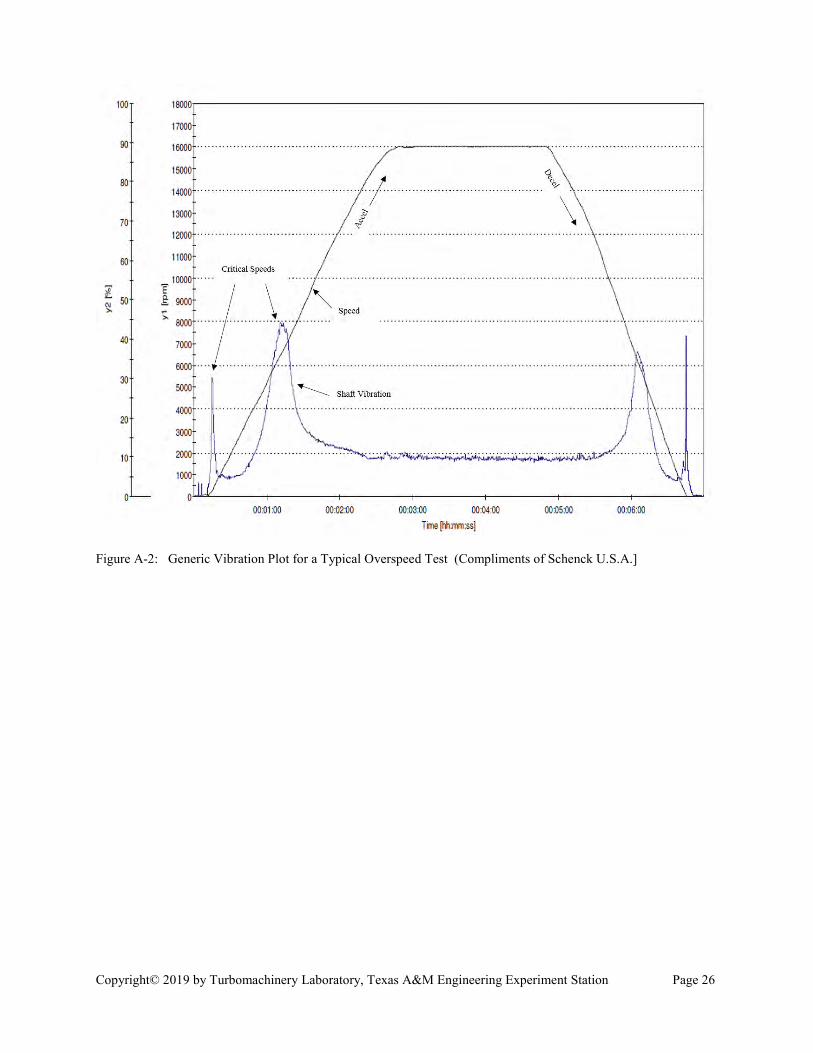
For reference, Figure 18 is a plot from the earlier run without the flywheel. The vibration during startup and shutdown is repeatable with amplitudes of 38% FS and 43% FS during startup and shutdown, respectively. For reference, Figure A-2 in the Appendix provides an idealized example of repeatable behavior for constant acceleration and deceleration rates.
Figure 18: Vibration Plot of Initial Run Without Flywheel (Annotated version of Figure 10)

Copyright© 2019 by Turbomachinery Laboratory, Texas A&M Engineering Experiment Station Page 17
Going into this test it was suspected that maintaining flywheel concentricity would be a challenge. This result suggests that the flywheel came loose at the bore and the mass center assumed an eccentric position relative to the shaft centerline resulting in higher unbalance. A finite element analysis showed that as the impeller bore increased with speed, the impeller contracted axially due to the Poisson Effect which reduced the axial force of the clamped assembly thereby reducing the friction force that constrained the impeller and flywheel. Successful overspeed testing of the 3rd stage Impeller
During the flywheel testing campaign, it was noted by shop personnel that in some instances, impellers run better when the impeller is mounted with the shroud facing downward. Because the new mandrel was not yet available and taking their suggestion, the flywheel was removed and the impeller was mounted on the existing mandrel with the shroud facing down. This is illustrated in Figure 19.
Figure 19a: Impeller Shroud Facing Up Figure 19b: Impeller Shroud Facing Downward This rotor assembly successfully reached overspeed. One factor that may account for this result is that the Ip/It inertia ratio increased from 1.05 to 1.13 after flipping the impeller. Another factor is that the residual unbalance may have shifted closer to the impeller/mandrel assembly’s CG. The rotor dynamic calculations shown in Figure 20 indicate that if the unbalance shifts by a little as 1.0 inch (25.4 mm) such that it coincides with the mode’s pivot point, the system response is virtually eliminated. Note that the amplitude scale is the same in both plots.

Copyright© 2019 by Turbomachinery Laboratory, Texas A&M Engineering Experiment Station Page 18
Figure 20 – Rotor Dynamic Calculation Comparing System Response with CG Shift By 1.0 inch
Successful overspeed testing of the 2nd stage impeller
At this point in time, the new mandrel was manufactured and available for use for overspeed testing of the 2nd stage impeller. The 2nd and 3rd stage impellers are very similar, though not identical. A comparison of mass properties of the mandrel assemblies of the 2nd stage impeller with the previously tested 3rd stage impeller based on the original mandrel with shroud facing downward is included in Table 1 below. As can be seen, the mass properties are almost identical:
Table 1: Comparison of Mass Properties with Impellers Mounted on Original Mandrel
Stage: 3rd Stage (Tested First)
2nd Stage (Tested Second)
Percent difference
Diameter: [In.] 51.3 51.3 0 % Weight: [Lbs.] 2749 2761 0.4 % CG: [In. from toe] 26.2 25.9 -1.1 % Ip: [Lb-In2] 467,576 472,558 +1.1 % It: [Lb-In2] 412,271 416,814 +1.0 % Ip/It [- ] 1.13 1.13 0 %
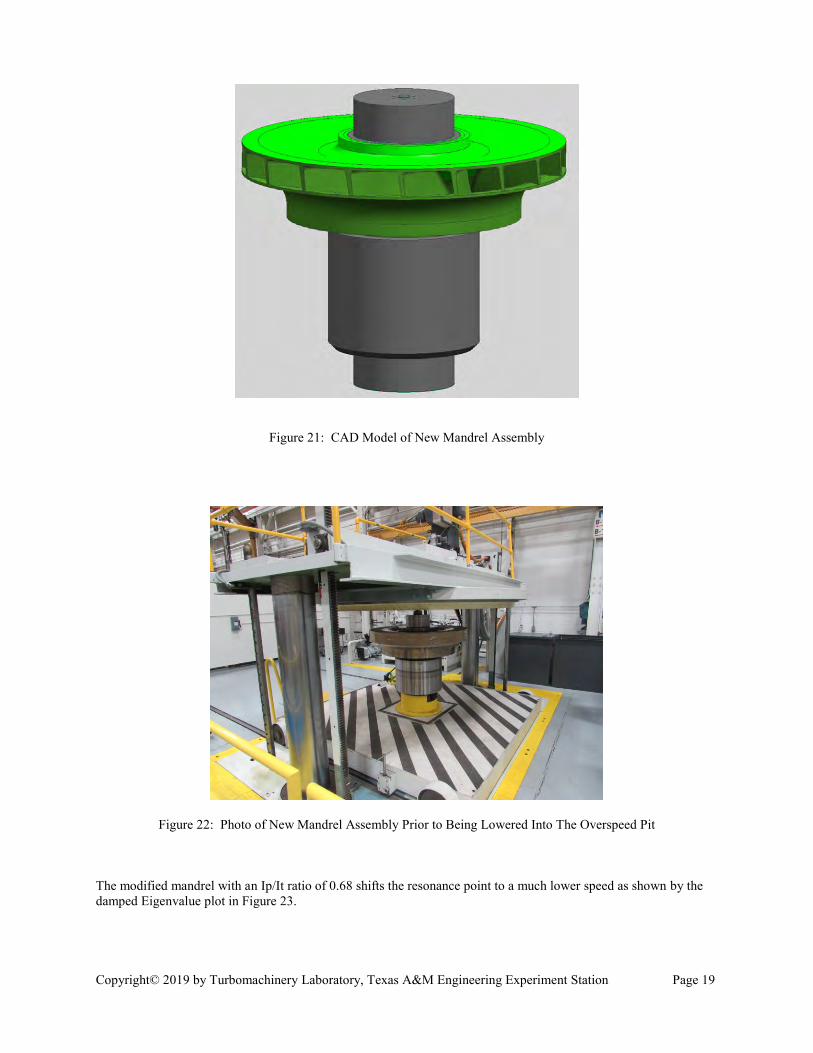
The new mandrel was design such that the Ip/It inertia ratio of the mandrel assembly was reduced from 1.13 to 0.68. Figure 21 is a CAD model of the impeller installed on the new mandrel. Figure 22 is a photograph of the same prior to being lowered into the overspeed pit.
Deflected Mode Shape
1 inch shift
Deflected Mode Shape
Copyright© 2019 by Turbomachinery Laboratory, Texas A&M Engineering Experiment Station Page 19
Figure 21: CAD Model of New Mandrel Assembly
Figure 22: Photo of New Mandrel Assembly Prior to Being Lowered Into The Overspeed Pit
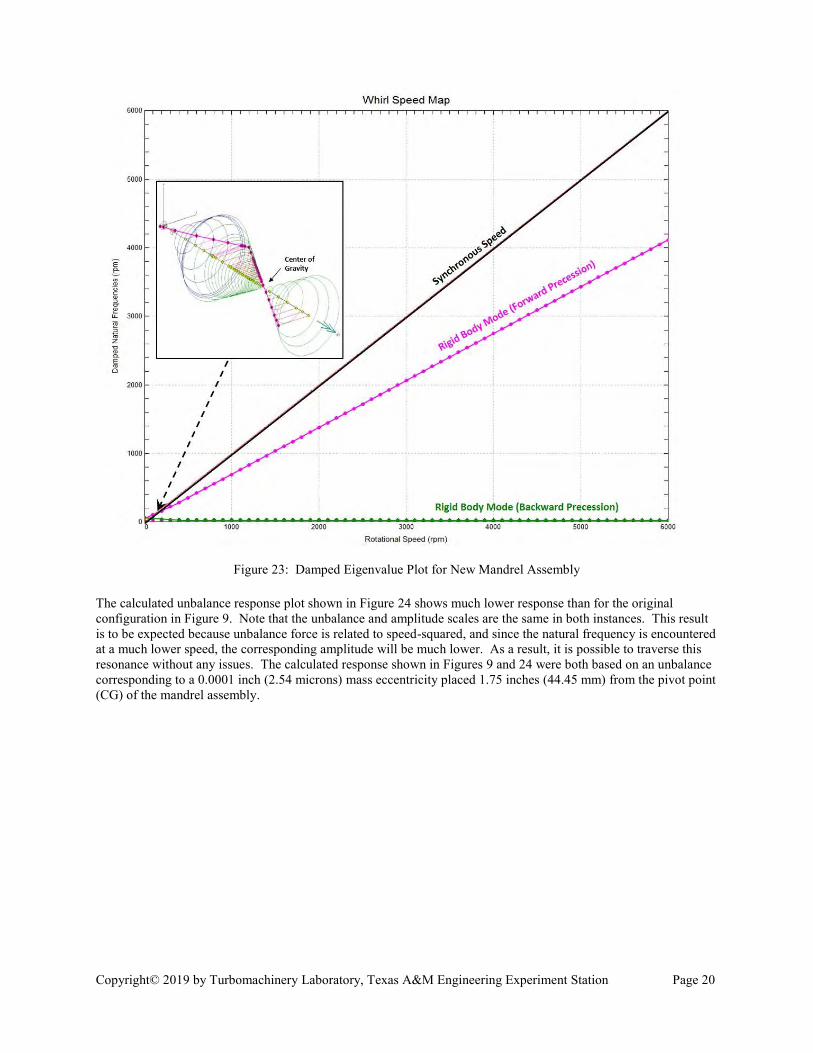
The modified mandrel with an Ip/It ratio of 0.68 shifts the resonance point to a much lower speed as shown by the damped Eigenvalue plot in Figure 23.
Copyright© 2019 by Turbomachinery Laboratory, Texas A&M Engineering Experiment Station Page 20
Figure 23: Damped Eigenvalue Plot for New Mandrel Assembly
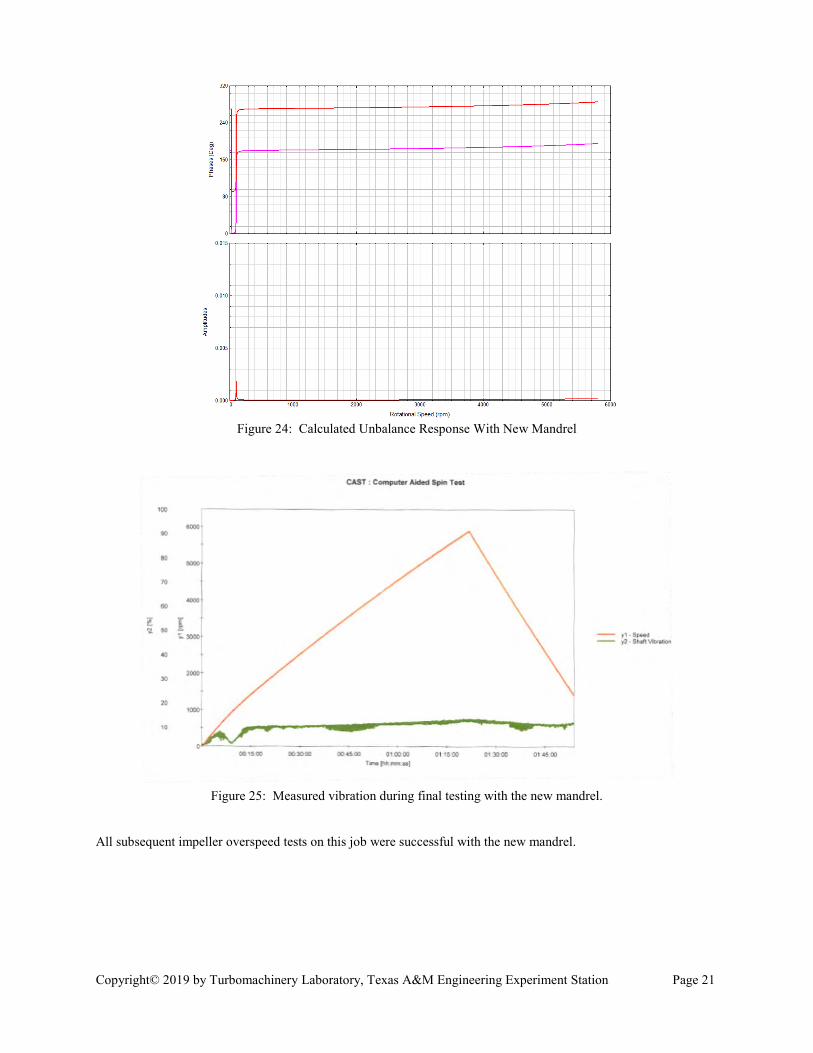
The calculated unbalance response plot shown in Figure 24 shows much lower response than for the original configuration in Figure 9. Note that the unbalance and amplitude scales are the same in both instances. This result is to be expected because unbalance force is related to speed-squared, and since the natural frequency is encountered at a much lower speed, the corresponding amplitude will be much lower. As a result, it is possible to traverse this resonance without any issues. The calculated response shown in Figures 9 and 24 were both based on an unbalance corresponding to a 0.0001 inch (2.54 microns) mass eccentricity placed 1.75 inches (44.45 mm) from the pivot point (CG) of the mandrel assembly.
Copyright© 2019 by Turbomachinery Laboratory, Texas A&M Engineering Experiment Station Page 21
Figure 24: Calculated Unbalance Response With New Mandrel
Figure 25: Measured vibration during final testing with the new mandrel.
All subsequent impeller overspeed tests on this job were successful with the new mandrel.

Copyright© 2019 by Turbomachinery Laboratory, Texas A&M Engineering Experiment Station Page 22
CONCLUSIONS
A resonance condition resulting in high shaft vibration can occur when the ratio of a rotor system polar moment of inertia and transvers moment of inertia approaches a value of one. Impeller overspeed testing is a likely place for these inertia values to converge. An example is provided for a 51-inch (1295 mm) diameter centrifugal impeller operating in an overspeed vacuum pit at 5,780 RPM at a tip speed of 1286 ft/sec [392 m/sec]. After a methodical, stepwise testing campaign, the problem was corrected by redesigning the rotor system to produce an inertia ratio less than 0.70. The following guidelines are suggested to assess the level of risk when operating near this resonance condition.
Figure 28: Suggested Inertia Ratio Guideline The overspeed machine manufacturer’s criteria contained in the appendix serve as a good general guideline in the absence of a detailed analysis. However, if a detailed analysis is performed for the project specific mandrel assembly, our experience shows that it is possible to operate within the stated limits. Attempting to “balance out” this particular type of resonance condition and/or accelerate rapidly through it has a low probability of success and can result in equipment damage. This is based largely on the torque transmission limitation of the belt drive system to both accelerate (run up) and decelerate (brake) the mandrel assembly, especially with large impellers. The probability for success when operating near the 0.95 < Ip/It <1.10 inertia ratio range improves if the following guidelines are observed:
• Align the CG of the impeller close to the pivot point of the rigid body mode. The pivot point is near the CG of the mandrel assembly. This will help to reduce system response. In this example, installing the impeller on the mandrel with the shroud side down resulted in a successful overspeed run, while violating the overspeed machine manufacturer’s Ip/It guidelines.
• Confirm that the component fits are sufficient to remain engaged to maintain concentricity throughout the speed range.
This lecture discussed the theoretical basis for this phenomenon, compared the results of the rotor dynamic simulations with overspeed vibration test data and provided an approach for assessing the level of risk for the occurrence of this phenomenon as a function of inertia ratio. In summary, the best approach when dealing with this phenomenon is to design the rotor assembly with an Ip/It ratio far removed from a value of 1.0.
Inertia Ratio of
Rotor AssemblyAction Discussion
Ip/It > 1.20 No issues anticipated
1.15 < Ip/It < 1.20 Detailed CAD Evaluation Accurate value for Ip and It required to confirm ratio is above 1.15.
1.10 < Ip/It < 1.15 Rotor Dynamic Analysis May be possible if target speed is relatively low.0.95 < Ip/It < 1.10 Avoid High Vibration Possible
0.90 < Ip/It < 0.95 Rotor Dynamic Analysis Results will be subject to error due to modeling inaccuracies and uncertainties relating to the boundary conditions
0.80 < Ip/It < 0.90 Detailed CAD Evaluation Accurate value for Ip and It required to confirm ratio is below 0.90.
Ip/It < 0.80 No issues anticipated

Copyright© 2019 by Turbomachinery Laboratory, Texas A&M Engineering Experiment Station Page 23
NOMENCLATURE K = Shaft Stiffness (Lbs./In.) L = Bearing Span Length (In.) Lo= Overhang Length (In.) M = Mass (Lbs.) Ip = Polar Moment of Inertia (Lbs.-In.2) IT = Transverse Moment of Inertia (Lbs – In2) 𝜔 = Rotational Speed (RPM) 𝜔1 = First Bending Critical Speed (CPM) 𝜔2 = Second Bending Critical Speed (CPM) 𝜔3 = Forward, Rigid Body, Critical Speed (CPM) 𝜔4 = Backward, Rigid Body, Critical Speed (CPM) REFERENCES
[1] API Standard 617, 8th edition, September 2014, Axial and Centrifugal Compressors and Expander-Compressors. [2] Vance, J.M., 1988, Rotor Dynamics of Turbomachinery, pages 125-130, John Wiley & Sons, Inc., New York. [3] Bracewell, R. N., and Garriott, O. K., 1958, Rotation of Artificial Earth Satellites, Nature, Vol. 182, Sept. 1958, pp. 760-762. [4] Hoffman, Henry, Lessons Learned from Six Decades of Spacecraft Guidance and Control Experiences, AIAA Guidance, Navigation and Control Conference and Exhibit, Guidance, Navigation, and Control and Co-located Conferences, () [5] Peraire,j., Widnall, S., 2008, MIT, Lecture L27 - 3D Rigid Body Dynamics: Kinetic Energy; Instability; Equations of Motion [6] Rigid-Body Mechanics, Chapter 6, page 351, http://renaissance.ucsd.edu/courses/mae207/wie_chap6.pdf [7] Tiwari, Dr R., Analysis and Identification in Rotor-Bearing Systems, Chapter 5: Gyroscopic Effects in Rotors,
2010, IIT Guwahati. [8] Gozdawa, Richard J. and Crook, Alfred W. , 2008, An Analysis of the Motion of a Centrifugal Impeller in
Overspeed Test Pit, Proceedings of ASME Turbo Expo: Power for Land Sean and Air, GT2008-50699. [9] Al-Khazali, H.A., Askari, M., 2011, Modal Analysis Design to Exposure Gyroscopic Effect in Rotating
Machinery Using Experimental and Analytical/Computational Techniques, International Journal of Engineering Science and Technology (IJEST), Volume 3, No 9, September 2011
[10] Chattoraj, C., Sengupta, S.N., Majumder, M.C, 2009, Whirling of a Rotor on Isotropic Shaft Considering
Gyroscopic Effect and Asymmetric Bearing Stiffness, 14th National Conference on Machines and Mechanisms, NaCoMM-09, India.
[11] ‘DyRoBeS’, Integrated Rotor Dynamics Program, W.J. Chen, Copyright 1991-2018, Eigen Technologies, Inc.,
www.DyRoBeS.com. [12] Chen, Wen Jeng and Gunter, Edgar J., 2007, Introduction to Dynamics of Rotor-Bearing Systems (DyRoBeS),
Eigen Technologies, Inc., Trafford Publishing. [13] Childs,D., 1993, Turbomachinery Rotordynamics, John Wiley & Sons, Inc., New York. [14] Schenck U.S.A., Users Manual, Model BIU4 with a M385-S7 control system.

Copyright© 2019 by Turbomachinery Laboratory, Texas A&M Engineering Experiment Station Page 24
ACKNOWLEDGEMENTS We would like to express our appreciation to Tarek El-Sawaf, Director Business Development, Schenck U.S.A., for the support that his team provided through the course of this project. DISCLAIMER
The troubleshooting procedure and suggested guidelines described in this paper are based on the study of the cited example only and is intended to demonstrate the evaluation process recognizing that other applications may produce different results.

Copyright© 2019 by Turbomachinery Laboratory, Texas A&M Engineering Experiment Station Page 25
APPENDIX
Figure A-1: Excerpt from the Schenck Users Manual [14]
Copyright© 2019 by Turbomachinery Laboratory, Texas A&M Engineering Experiment Station Page 26
Figure A-2: Generic Vibration Plot for a Typical Overspeed Test (Compliments of Schenck U.S.A.]