a review of atmospheric chemistry observations at mountain sites
TRANSCRIPT

REVIEW Open Access
A review of atmospheric chemistryobservations at mountain sitesSachiko Okamoto* and Hiroshi Tanimoto*
Abstract
Located far from anthropogenic emission sources, high-altitude mountain stations are considered to be ideal sites formonitoring climatic and environmentally important baseline changes in free tropospheric trace gases and aerosols. Inaddition, the observations taken at these stations are often used to study the long-range transport of dust as well asanthropogenic and biomass burning pollutants from source regions and to evaluate the performance of global andregional models. In this paper, we summarize the results from past and ongoing field measurements of atmosphericconstituents at high-altitude stations across the globe, with particular emphasis on reactive trace species includingtropospheric ozone, along with its precursors such as carbon monoxide, nitrogen oxides, total reactive nitrogen, andnonmethane hydrocarbons. Over the past decades, our understanding of the temporal variability and meteorologicalmechanisms of long-range transport has advanced in tandem with progress in instrumentation and modeling. Finally,the future needs of atmospheric chemistry observations at mountain sites are addressed.
Keywords: Atmospheric observation, High-altitude station, Long-range transport, Seasonal cycle, Long-term trend,Biomass burning, Anthropogenic pollution
IntroductionTrace gases and aerosols present in the atmosphere areresponsible for global changes in the environment andclimate of the Earth. These changes include globalwarming, which has caused a temperature increase of0.85 °C during the period from 1880 to 2012, primarilydue to increases in the atmospheric concentrations ofgreenhouse gases (GHGs) since the pre-industrial era(Intergovermental Panel on Climate Change 2013), poorair quality associated with high levels of photo-oxidants,and fine particulate matter with particle diameters of lessthan 2.5 μm (PM2.5). These changes have been traced tohigh population densities and hasty industrialization inrapidly developing regions (World Health Organization2006). Such air pollution problems, which can causedamage to human health and to vegetation growth, arenow recognized as important, and robust evidence basedon reliable observations is needed to support relatedpolicymaking processes.Located far from anthropogenic emissions, high-
altitude mountain stations are ideal sites for monitoring
the temporal variations of trace gases and aerosols in theatmosphere at background levels. As a result, atmos-pheric monitoring programs have been established at asubstantial number of mountain stations in order toobtain information on the levels, variability, and trendsof trace gases and aerosols in the free troposphere (FT),as well as to assess the influence of anthropogenic andnatural emission sources. It is widely accepted that ob-servations at mountain sites are affected by the horizon-tal and vertical transport of polluted air masses from theground surface (Henne et al. 2004; Trickl et al. 2003).Based on the analysis of tropospheric ozone (O3) datacollected at 27 stations located in mountainous and ruralareas in Western Europe at altitudes ranging from 115to 3550 m above sea level (a.s.l.), Chevalier et al. (2007)suggested that ground-based stations devoted to themonitoring of background free tropospheric O3 shouldbe settled, if possible, above 2000 m a.s.l.Tropospheric O3, which is an important GHG, has an
estimated radiative forcing (RF) of 0.40 ± 0.20 W m−2
(Intergovermental Panel on Climate Change 2013). TheRF from tropospheric O3 depends strongly on altitudeand latitude due to the coupling of O3 changes withtemperature, water vapor, and clouds (Bowman et al.
* Correspondence: [email protected]; [email protected] for Global Environmental Research, National Institute forEnvironmental Studies, 16-2 Onogawa, Tsukuba, Ibaraki 305-8506, Japan
Progress in Earth and Planetary Science
© The Author(s). 2016 Open Access This article is distributed under the terms of the Creative Commons Attribution 4.0International License (http://creativecommons.org/licenses/by/4.0/), which permits unrestricted use, distribution, andreproduction in any medium, provided you give appropriate credit to the original author(s) and the source, provide a link tothe Creative Commons license, and indicate if changes were made.
Okamoto and Tanimoto Progress in Earth and Planetary Science (2016) 3:34 DOI 10.1186/s40645-016-0109-2

2013; Worden et al. 2008, 2011). O3 is the main sourceof hydroxyl radicals (OH), which drive the oxidizingcapacity of the atmosphere. It is widely accepted thattropospheric O3 has two sources: subsidence transportfrom the stratosphere and in situ photochemical produc-tion, which occurs when carbon monoxide (CO) and hy-drocarbons are photo-oxidized in the presence of nitrogenoxides (NOx =NO+NO2) (Crutzen 1974; Monks et al.2009). The major loss pathways for O3 in the troposphereinclude dry deposition to the Earth’s surface, chemical de-struction via photolysis to O(1D) which reacts with watervapor, and chain reaction with hydroperoxyl radicals(HO2) and OH (Seinfeld and Pandis 2006). The lifetime ofO3 in the troposphere varies strongly in different seasonsand locations, ranging from a few days in the tropicalboundary layer to 1 year in the upper troposphere. Themodeled mean lifetime of tropospheric O3 has beenreported as 22.3 ± 2 days (Stevenson et al. 2006).Although CO is not a radiatively active gas, it affects
the climate indirectly via its interaction with OH radi-cals, which are the primary CO sink. The oxidation ofCO by OH leads to the formation of HO2, which thencan become involved in reactions to produce O3 inNOx-rich environments. In contrast, CO oxidation byOH radicals can lead to O3 destruction through catalyticcycles of HOx in low-NOx environments (Kanakidou andCrutzen 1999). The changes in the OH radical concentra-tion due to changes in CO can perturb the concentrationsof GHGs such as methane (CH4) (Thompson andCicerone 1986) and chlorofluorocarbon (CFC) along withothers such as hydrochlorofluorocarbons (HCFCs) andhydrofluorocarbons (HFCs). The major sources of COemissions into the atmosphere are direct emissions fromincomplete combustion of biomass and fossil fuels associ-ated with in situ production via the oxidation of hydrocar-bons such as CH4 and isoprene (C5H8). Global estimatesfor anthropogenic and biomass burning emissions for2000 were 611 and 459 Tg (CO) year−1, respectively(Lamarque et al. 2010). The global mean troposphericlifetime of CO is relatively long at approximately 2 months(e.g., Prather 1996) and seasonal and spatial CO lifetimevariations have been reported in the study of Duncanet al. (2007). In the Northern Hemisphere winter season,the lifetime tends to be long, so CO from fossil fuelsand industry accumulates. Conversely, in the SouthernHemisphere, CO approaches its seasonal minimum inaustral summer because its lifetime is short and biomassburning activities are at a minimum. This latitudinalgradient becomes weak as summer approaches becausethe CO lifetime declines, over a scale of weeks to months,across most of the Northern Hemisphere. Simultaneously,however, the CO lifetime increases at southern mid-latitudes since the biomass-burning season is beginning inthe Southern Hemisphere.
The term “background” concentrations have been usedwith various definitions in the literature over time.Calvert (1990) described “background concentration” as“the concentration of a given species in a pristine airmass, in which anthropogenic impurities of a relativelyshort lifetime are not present”. However, because thetroposphere is globally influenced by the long-rangetransport of pollution, Parrish et al. (2012) adopted theterm “baseline,” which refers to measurements obtainedwhen local emission influences are determined to benegligible. Since remote coastal or mountainous sites areregarded as having no direct influence from localsources/sinks, such sites are the primary choices whenlooking to obtain representative data on continental tohemispheric scales. The US Environmental ProtectionAgency (EPA) defined the “Policy Relevant Background(PRB)” concentration as the concentration that would occurin the USA in the absence of anthropogenic emissions incontinental North America (U.S. Environmental ProtectionAgency, 2006). Hence, since the sources of PRB concentra-tions include natural emissions and long-range transport ofpollutants, they cannot be controlled by domestic regula-tions in the USA and/or neighboring countries.Most studies have assumed the representativeness of
mountain sites without providing evidence to supportthe assumption. Nappo et al. (1982) suggested that“representativeness is the extent to which a set ofmeasurements taken in a space-time domain reflects theactual conditions in the same or different space-timedomain taken on a scale appropriate for a specific appli-cation”. However, representativeness not only varies withtime, it also strongly depends on the trace gases becausethe concentration within a certain volume is controlledby vertical/horizontal transport and mixing, chemicaltransformations, surface deposition, and emissions.The spatial representativeness of monitoring sites has
been assessed by different approaches, primarily inEurope (e.g., Henne et al. 2010; Joly and Peuch 2012;Kovač-Andrić et al. 2010; Spangl et al. 2007; Tarasova etal. 2007). In addition, observations at mountain-basedstations provide information of the lower FT, which islocated between the planetary boundary layer (PBL) andthe tropopause. Many species in the FT, such as O3,have longer lifetimes than those in the PBL owing to thelower temperatures and lack of deposition in the FT,which is also where most of the transport of chemicalspecies within the atmosphere occurs. The combinationof long-range transport and longer chemical lifetimes inthe FT indicates that the chemistry of this zone is animportant factor when determining the chemicalcomposition of regions remote from pollutant sources(Hemispheric Transport of Air Pollution 2007).However, observations at ground-based stations can
often be influenced by local sources. The objective of
Okamoto and Tanimoto Progress in Earth and Planetary Science (2016) 3:34 Page 2 of 52

data selection is to differentiate the concentrationsrepresentative of well-mixed air masses near the sitefrom those substantially affected by local sources or me-teorology. Data selection can be performed on the basisof independently measured parameters such as winddirection and speed, statistical approaches for rejectingparticular data, or combined meteorological and statis-tical filters. For example, statistical approaches have beenapplied to trend analyses of trace gases (e.g., Novelliet al. 1998, 2003; Ruckstuhl et al. 2012; Schuepbachet al. 2001; Thoning et al. 1989; Zellweger et al. 2009) inorder to evaluate source regions and their emission esti-mates (e.g., Greally et al. 2007; Prinn et al. 2001) and tomodel the long-range transport of trace gases (BalzaniLööv et al. 2008).When using measurements at mountainous sites, it is
necessary to consider upslope flow, which often imposespollution from local anthropogenic sources located inthe foothills. This source is the most likely factor in thecontamination of clean air masses arriving at the sitefrom the FT. Conversely, in the absence of emissionsources near the site, the upslope flow can transportclean air masses from the boundary layer that have at-mospheric compositions that are different from thatfrom the FT (e.g., Hahn et al. 1992; Oltmans et al.1996b; Peterson et al. 1998).Upslope flow on isolated mountains results from two
primary mechanisms: mechanically forced lifting andbuoyant upslope flow. Mechanically forced lifting iscaused by the deflection of strong winds by a mountainslope. The importance of this mechanism differs amongmountains and depends mainly on the height of themountain and the mean speed of the wind. Buoyantupslope flow is caused by the daytime solar heating ofair near the surface of the mountain. During the day,warmed air masses rise toward the summit. At night,flows down the mountain occur due to radiative coolingof the ground surface. Both the upslope and downslopeflows are important for mountain meteorology and thetransport of local pollution (e.g., Furger et al. 2000). Inpractice, however, determination of baseline concentra-tions is difficult because the nature and magnitude of suchlocal influence depend on the mountain topography, localwind patterns, and the characteristics of local emissionsources.The World Meteorological Organization (WMO)
launched the Global Atmosphere Watch (GAW)Programme in 1989 to promote systematic and reliableobservations of the chemical composition of the atmos-phere. Currently, the GAW has the most extensive meas-urement program. Its focal areas include aerosols, GHGs,selected reactive gases, O3, ultraviolet (UV) radiation, andprecipitation chemistry. In October 1990, WMO desig-nated the Japan Meteorological Agency (JMA) in Tokyo
as the World Data Centre for Greenhouse Gases(WDCGG) and tasked it with collecting, archiving, andproviding data related to GHGs and reactive gases in theatmosphere and oceans from observation sites throughoutthe world that participate in the GAW and other scientificmonitoring programs.Since its establishment, WDCGG has provided users
with data and other information through its regularpublications and the WDCGG website (http://ds.data.jma.go.jp/gmd/wdcgg/). In addition, observational data iscurrently provided by many regional monitoring programsworldwide including the European Monitoring andEvaluation Programme (EMEP; http://www.emep.int) inthe European region, the Clean Air Status and TrendsNetwork (CASTNET; http://www.epa.gov/castnet), theInteragency Monitoring of Protected Visual Environments(IMPROVE; http://vista.cira.colostate.edu/improve/) inNorth America, which monitors visibility conditions,tracks changes in visibility, and works to identify sourcesand causes of regional haze in class I areas (including na-tional parks, wilderness areas, and national memorialparks), and the Acid Deposition Monitoring Network inEast Asia (EANET; http://www.eanet.asia/).In this paper, we describe past and current atmospheric
observations conducted at high-altitude stations onmountains, the data of which are available in public data-bases or published papers. First, overviews of the individ-ual mountain stations above 1500 m a.s.l. are given. Next,we review temporal variations, particularly the long-termtrends and seasonal variations of reactive species includingtropospheric O3, and its precursors such as CO, NOx,total reactive nitrogen (NOy), and nonmethane hydrocar-bons (NMHCs), but excluding long-lived GHGs. Sinceobservations of aerosol optical properties at high-altitudestations are well described by Andrews et al. (2011),short-lived species—with the exceptions of carbon dioxide(CO2) and mercury (Hg) described in association with theanalysis of reactive species—are mainly discussed here.We will review previous observations of the long-rangetransport of pollutants from anthropogenic and biomassburning sources, desert dust, and volcanic plumes fromeruption events, along with the downward transport ofstratospheric air masses into the troposphere as importantsources of O3. Moreover, we also review the modelingstudies using photochemical box models and chemicaltransport models.
ReviewHigh-elevation mountain sitesThe ground-based stations for atmospheric chemistryobservations presented in this study are located at highaltitudes above 1500 m a.s.l., as shown in Fig. 1; detailedsite information is listed in Table 1. In total, the list con-tains 31 stations. These stations were selected because
Okamoto and Tanimoto Progress in Earth and Planetary Science (2016) 3:34 Page 3 of 52

they provide reliable observational data that have beenutilized in numerous previous studies. Furthermore, wetried to cover the entire world except for Arctic andAntarctic Polar Regions. Many stations are located innorthern mid-latitudes, particularly in central Europeand western North America. Compared to the NorthernHemisphere, significantly fewer stations are in theSouthern Hemisphere, and no high-altitude stations arepresent in the Oceania region.
Region I: AfricaAssekrem (ASK), Algeria ASK is a GAW Global sta-tion operated by the Déportent Météorologique Régional
Sud of the Office National de la Météorologie (ONM),Algeria, and is located on the summit of the secondhighest point of the Hogger Mountain Range in theSahara Desert (Zellweger et al. 2007). It plays an import-ant role in capturing air pollutants from continentalAfrica.
Mt. Kenya (MKN), Kenya MKN is a GAW Global sta-tion that has been designated for long-term measurementsof various chemical compounds and physical and meteoro-logical parameters in the lower troposphere. The mainoffice is the Kenya Meteorological Department (KMD).MKN is located on the northwestern slope of Mt. Kenya
Fig. 1 Map showing the distribution of high-altitude mountain stations discussed in this paper. Circles with abbreviations denote stations providing thedata presented in this paper. ASK Assekrem, CHA Chiricahua NM, CMN Monte Cimone, GRB Great Basin NP, HPO Mt. Happo, ISK Issyk-Kul, IZO Izãna, JFJJungfraujoch, KVV Krvavec, LAV Lassen Volcanic NP, LLN Lulin, LQO La Quiaca Observatorio, MBO Mt. Bachelor Observatory, MKN Mt. Kenya, MDY Mondy,MLO Mauna Loa, NWR Niwot Ridge, PMO Pico Mountain Observatory, PYR Nepal Climate Observatory–Pyramid, SNB Sonnblick, TAR Tanah Rata, WHIWhistler Mountain, WLG Mt. Waliguan, YEL Yellowstone NP, YOS Yosemite NP, ZSF Zugspitze–Schneefernerhaus, ZUG Zugspitze–Gipfel. Triangles withabbreviations denote stations for which data are not presented but are reviewed in this paper. ARO Arosa, FWS Mt. Fuji, KSL Kislovodsk
Okamoto and Tanimoto Progress in Earth and Planetary Science (2016) 3:34 Page 4 of 52

Table 1 List of stations mentioned in this paper
Station ID Country Latitude Longitude Altitude (m) Data source
Region I: Africa
Assekrem ASK Algeria 23.27° N 5.63° E 2710 WDCGGa
Mt. Kenya MKN Kenya 0.06° S 37.30° E 3678 WDCGGa
Izaña (Tenerife) IZO Spain 28.31° N 16.50° W 2373 NMHCs: Schmittand Schultz et al. (1998)Other: WDCGGa
Region II: Asia
Mt. Waliguan WLG China 36.29° N 100.90° E 3810 WDCGGa
Issyk-Kul ISK Kyrgyzstan 42.62° N 76.98° E 1640 WDCGGa
Nepal Climate Observatory–Pyramid PYR Nepal 27.96° N 86.81° E 5079 WDCGGa
Lulin LLN Taiwan 23.47° N 120.87° E 2862 LLN websiteb
Mondy MDY Russian Federation 51.65° N 100.92° E 2006 EANETc
Mt. Abu MAB India 24.65° N 72.78° E 1680 Naja et al. (2003)d
Mt. Happo HPO Japan 36.70° N 137.80° E 1850 CO: Kato et al. (2000); Narita et al. (1999);Pochanart et al. (2004)e
NMHCs: Sharma et al. (2000)Other: EANETc
Mt. Fuji FWS Japan 35.37° N 138.73° E 3776 –
Region III: South America
La Quiaca Observatorio LQO Argentina 22.10° S 65.60° W 3459 WDCGGa
Region IV: North and Central America
Whistler Mountain WHI Canada 50.06° N 122.96° W 2182 Macdonald et al. (2011)f
Great Basin NP GRB USA 39.01° N 114.22° W 2060 CASTNETg
Mt. Bachelor Observatory MBO USA 43.98° N 121.69° W 2743 Gratz et al. (2015); Weiss-Penzias et al. (2007)h
Niwot Ridge NWR USA C1: 40.04° NT-van: 40.05° N
C-1: 105.54° WT-van: 105.59° W
C-1: 3021T-van: 3523
WDCGGa
Chiricahua NM CHA USA 32.01° N 109.39° W 1570 CASTNETg
Lassen Volcanic NP LAV USA 40.54° N 121.58° W 1756 O3: CASTNETg
Aerosol: IMPROVEi
Yellowstone NP YEL USA 44.57° N 110.40° W 2430 CASTNETg
Yosemite NP YOS USA 37.71° N 119.71° W 1605 CASTNETg
Region V: South–West Pacific
Tanah Rata TAR Malaysia 4.48° N 101.37° E 1545 WDCGGa
Mauna Loa MLO USA 19.54° N 155.58° W 3397 NOx and NOy: Ridley et al. (1998)Aerosol: IMPROVEi
Other: WDCGGa
Okam
otoand
Tanimoto
Progressin
Earthand
PlanetaryScience
(2016) 3:34 Page
5of
52
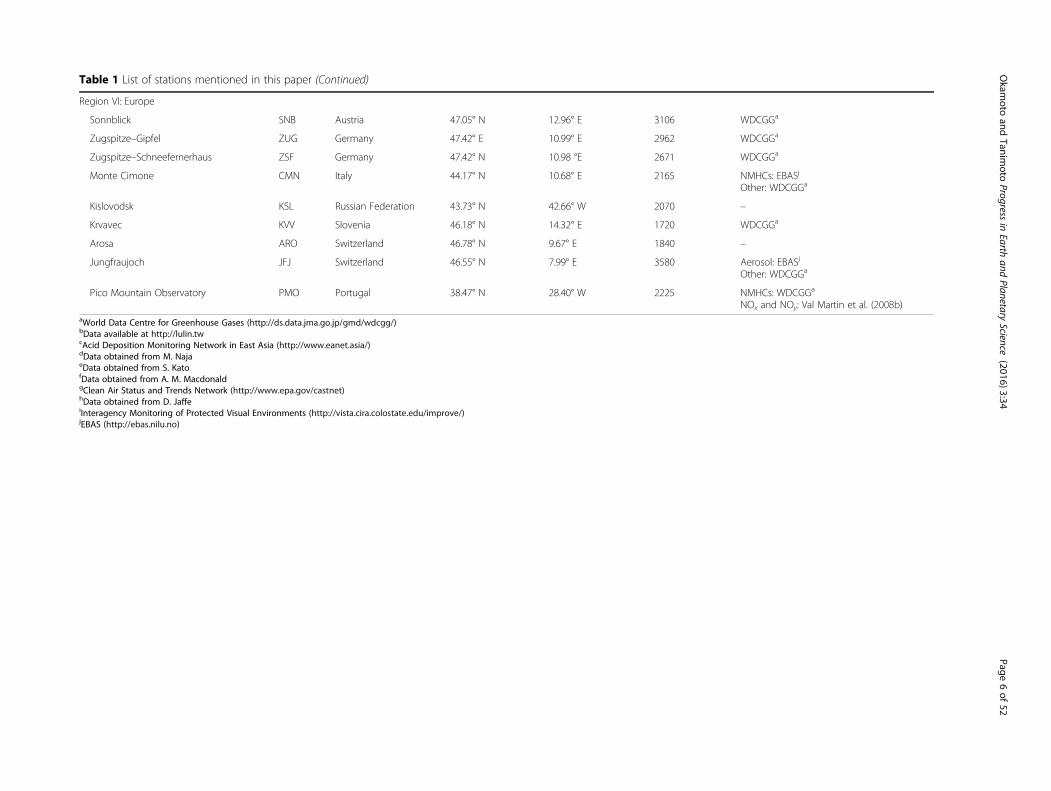
Table 1 List of stations mentioned in this paper (Continued)
Region VI: Europe
Sonnblick SNB Austria 47.05° N 12.96° E 3106 WDCGGa
Zugspitze–Gipfel ZUG Germany 47.42° E 10.99° E 2962 WDCGGa
Zugspitze–Schneefernerhaus ZSF Germany 47.42° N 10.98 °E 2671 WDCGGa
Monte Cimone CMN Italy 44.17° N 10.68° E 2165 NMHCs: EBASj
Other: WDCGGa
Kislovodsk KSL Russian Federation 43.73° N 42.66° W 2070 –
Krvavec KVV Slovenia 46.18° N 14.32° E 1720 WDCGGa
Arosa ARO Switzerland 46.78° N 9.67° E 1840 –
Jungfraujoch JFJ Switzerland 46.55° N 7.99° E 3580 Aerosol: EBASj
Other: WDCGGa
Pico Mountain Observatory PMO Portugal 38.47° N 28.40° W 2225 NMHCs: WDCGGa
NOx and NOy: Val Martin et al. (2008b)aWorld Data Centre for Greenhouse Gases (http://ds.data.jma.go.jp/gmd/wdcgg/)bData available at http://lulin.twcAcid Deposition Monitoring Network in East Asia (http://www.eanet.asia/)dData obtained from M. NajaeData obtained from S. KatofData obtained from A. M. MacdonaldgClean Air Status and Trends Network (http://www.epa.gov/castnet)hData obtained from D. JaffeiInteragency Monitoring of Protected Visual Environments (http://vista.cira.colostate.edu/improve/)jEBAS (http://ebas.nilu.no)
Okam
otoand
Tanimoto
Progressin
Earthand
PlanetaryScience
(2016) 3:34 Page
6of
52
and in a protected portion of the Mount Kenya NationalPark. The climate of equatorial East Africa is dominated byseasonal displacement of the intertropical convergencezone (ITCZ). During boreal summer, the ITCZ is situatedfar to the north, resulting in southerly to southeasterlywinds over Kenya. From September onward, the ITCZ be-gins to retreat southward, followed by a rainy period frommid-October to December over Kenya. Throughout borealwinter, the ITCZ is situated south of the equator. As a re-sult, a northeasterly monsoon circulation dominates EastAfrica. When the ITCZ begins to progress northward again,it brings a second rainy period from mid-March to the be-ginning of June to equatorial East Africa. One noteworthyfeature of the boreal monsoon circulation is the East Afri-can low-level jet (EALLJ), which develops from May on-ward in the southeast trade winds over Madagascar.With the northward transition of the ITCZ, the EALLJstrengthens and extends northward, reaching its max-imum extent in June or July. Its counterpart, blowingfrom the north along the East African coast during bor-eal winter, is less pronounced (Henne et al. 2008).
Izaña (IZO), Spain IZO is a GAW Global station oper-ated by the Agencia Estatal de Meteorología (AEMET)for long-term measurements of various chemical com-pounds and physical and meteorological parameters.The station is located on the Island of Tenerife roughly300 km west of the African coast. As typically occurs insubtropical oceanic atmospheres to the west of continents,the low troposphere in this region is strongly stratifiedowing to the synoptic-scale subsidence conditions. Twoair masses are well differentiated by the presence of atemperature inversion layer: the marine boundary layer(MBL) and the FT (Rodríguez et al. 2009).In the moist and cool MBL, the north to northeast trade
wind blows. Because the condensation level is usuallylower than the inversion level under the trade wind re-gime, the top of the MBL, which is frequently located justbelow the temperature inversion layer, is characterized bya layer of stratocumulus clouds formed by the condensa-tion of water vapor onto available pre-existing particles.The presence of this stratocumulus layer creates a quasi-continuous foggy and rainy regimen throughout the yearat altitudes between 800 and 2000 m a.s.l. on the island.In the FT, northwest subsiding dry airflows dominate
throughout the year, except in summer, when theyfrequently alternate with southeast airflows laden withSaharan mineral dust particles (Chiapello et al. 1999). Inwinter (January to March), air masses originate from theNorth Atlantic, North America, and the Sahara (Cuevaset al. 2013). In spring (April to June), a pattern similar tothat in winter is observed. The contributions from theSahara and the southern part of the North Atlantic areweaker, and the transport from North America is more
well-defined than that in winter. In summer (July toSeptember), essentially only two geographical sectors ofthe air mass pathways are identified: that from NorthAmerica and that from the Sahara and Northern Sahel.Air masses from North America and the North Atlantictravel at relatively high altitudes, whereas those from theSahara originate from low levels.The observational records of a Fourier transform infra-
red (FTIR) spectrometer that began routine operation inMarch 1999 have been utilized in many studies (García etal. 2012; Schneider et al. 2005a, b, 2008; Sepúlveda et al.2012; Viatte et al. 2011). The instrument is part of theTotal Column Carbon Observation Network (TCCON),which is a network of ground-based Fourier transformspectrometers designed to retrieve precise and accuratecolumn abundances of atmospheric constituents includingCO2, CH4, nitrous oxide (N2O), hydrogen fluoride (HF),CO, and water vapor isotopologues (Wunch et al. 2011).The TCCON was established in 2004 and is currentlyaffiliated with 26 sites. In addition, other remote sensingobservations have been conducted by lidar (Welton et al.2000), multipass optical absorption spectroscopy (MOAS)(Armerding et al. 1997; Comes et al. 1995, 1997), differen-tial optical absorption spectrometry (DOAS) (Carslaw etal. 1997; Gil et al. 2000, 2008), and multi axis-DOAS(MAX-DOAS) (Puentedura et al. 2012).
Region II: AsiaMt. Waliguan (WLG), China WLG is a GAW Globalstation operated by the China Meteorological Administra-tion (CMA). This station is located at the edge of thenortheastern boundary of the Qinghai–Tibetan Plateau.Mt. Waliguan is 90 km from Xining and 260 km fromLanzhou, which are the main industrial and most popu-lated regions of central–eastern China. The wind patternsnear WLG are controlled by the Qinghai–Tibetan Plateaumonsoon and are thus associated with seasonal variations.The predominant wind directions are from the southwestin cold seasons and from the east in warm seasons.Locally, WLG is affected by the mountain–valley breezes(Fu et al. 2012). Xue et al. (2011) identified three majortypes of air masses at WLG in summer: those originatingfrom the east and southeast having passed over populatedregions of China, those originating from the west havingpassed over remote regions of central Asia and Xinjiang,and those originating mainly from the north having passedover regions of Siberia and Mongolia. During a recent 10-year period (2000 to 2009); the transport regime at WLGin summer was dominated by air originating from the eastthat may have passed over populated regions in China.
Issyk-Kul (ISK), Kyrgyzstan ISK is located in thenorthern Tien-Shan Mountains along the shoreline ofLake Issyk-Kul. The Issyk-Kul lake region is surrounded
Okamoto and Tanimoto Progress in Earth and Planetary Science (2016) 3:34 Page 7 of 52
by two giant mountain chains including Kungey Ala-Tooto the north and Terskey Ala-Too to the south, whichtogether form a closed area. The mountain chains im-pede the transport of the polluted air from Chu Valley inBishkek, the capital of Kyrgyzstan, and from Almaty, ahuge industrial center in Kazakhstan (Semenov et al.2005). Observations of a long-term total O3 column(Aref ’ev et al. 1995; Visheratin et al. 2006), total NO2
column (Aref ’ev et al. 1995, 2009; Ionov et al. 2008),total CO column (Aref ’ev et al. 2013), and height meanconcentrations of CO2 (Kashin et al. 2007, 2008) have beenreported along with atmospheric spectral transparency ob-servations (Aref ’ev and Semenov 1994, Aref ’ev et al. 2008;Semenov et al. 2005).
Nepal Climate Observatory–Pyramid (PYR), NepalPYR is a GAW Global station installed within the frame-work of the Stations at High Altitude for Research on theEnvironment (SHARE) project of Everest-K2 National Re-search Council (Ev-K2-CNR) and the atmospheric browncloud (ABC) project of the United Nations EnvironmentalProgramme (UNEP) in order to obtain information on theatmospheric background conditions in this region (Bonasoniet al. 2008). This station is located at the confluence of thesecondary Lobuche valley and the main Khumbu valley inSagarmatha National Park in the eastern Nepal Himalaya.In the Himalayan region, a 3 km thick brownish layer
of pollutants known as Asian brown clouds has beenobserved to extend from the Indian Ocean to theHimalayan range (Ramanathan and Crutzen 2003). Thisphenomenon strongly affects the air quality, visibility,and the energy budget of the atmosphere over the entireIndian subcontinent. The high-altitude meteorology inthe Himalayas is strongly influenced by the Asian mon-soon circulation and by local mountain wind systems(Bollasina et al. 2002). The mountain–valley wind systemis predominant, with a strong valley wind from the southto southwest during daytime and a weak mountain windat night. In summer, the valley wind prevails throughoutthe day.Nepal, including its borders with India and Bangladesh,
is the most frequent origin of air masses transported inthe PBL that reach PYR throughout the year (Gobbi et al.2010). The atmospheric conditions in the Himalayas areinfluenced by the transport of polluted air masses fromSouth Asia and the Indo–Gangetic Plains, the northwest-to-northeast region extending from eastern Pakistanacross India to Bangladesh and Myanmar. Occurrences ofbrown clouds over the Himalayan foothills and NorthernIndo–Gangetic Plains have been identified by high aerosoloptical depth (AOD) values >0.4 and are associated withhigh concentrations of pollutants measured at PYR, ascharacterized by an up-valley breeze circulation (Bonasoniet al. 2010).
Lulin (LLN), Taiwan LLN is located inside Jade MountainNational Park, which is part of the Central MountainRange. This station is operated by National CentralUniversity (NCU), Taiwan. Owing to the mountain–valleycirculation, LLN is frequently located in the FT, particularlyduring the winter, and is generally free from surface pollu-tion in the boundary layer (Ou-Yang et al. 2014; Sheu et al.2010; Wai et al. 2008). Taiwan is located at the edge of thewestern Pacific Ocean and is southeast of the East Asiancontinent. The southwest monsoon prevails in summer,whereas the northeast monsoon prevails between late falland spring. Additionally, since the Westerlies prevail at ahigher elevation in spring (Ou Yang et al. 2012), LLN is af-fected by pollution outflows from Southeast Asia and theAsian continent.
Mondy (MDY), Russian Federation MDY is located incentral Eastern Siberia near the Russia–Mongolia border,which is known to be a very lightly populated continentalarea of the world. MDY is operated by the LimnologicalInstitute, Russian Academy of Sciences, and contributes tothe EANET program. Air masses reaching MDY are typic-ally classified into four groups: long-range transport fromEurope, Siberia east of the Ural Mountains, high-latitudepolar regions, and much shorter-range transport usuallyless than several hundred kilometers from the southwest(Pochanart et al. 2003).
Mt. Abu (MAB), India MAB is located at a mountaintopknown as Guru Shikhar, which is the highest peak in thesouthern end of Aravalli Mountain Range in westernIndia. In this region, northwest winds dominate in winter(November to February) and southwest winds dominatein summer (May to August) (Kumar and Sarin 2010; Najaet al. 2003; Ram et al. 2008; Ram and Sarin 2009; Rastogiand Sarin 2005, 2008). Diurnal O3 concentration varia-tions in spring and summer at MAB show a unique pat-tern, whereas those in autumn and winter show a patterntypical of high-latitude sites (Naja et al. 2003). Naja et al.(2003) suggested that this seasonal change in diurnal vari-ation might be caused by changes in the wind pattern indifferent seasons and changes in the boundary layermixing height during the day and at night.
Mt. Happo (HPO), Japan HPO is operated by theMinistry of the Environment (MOE) of Japan, whichcontributes to the EANET program. This station is lo-cated in a mountainous area near the coast of the JapanSea. During fall to spring, westerly winds are dominant(Pochanart et al. 1999), and most of the air masses passover the Asian continent, particularly over Mongolia andnorthwestern China, driven by the Siberian High (Liuet al. 2013). The North Pacific high-pressure system isstrong in summer, and the Siberian High reverses to a
Okamoto and Tanimoto Progress in Earth and Planetary Science (2016) 3:34 Page 8 of 52

low-pressure system. This behavior is typical of the sum-mer monsoon in East Asia. Associated with the summermonsoon, pristine air masses from the Pacific are trans-ported to HPO more frequently, particularly in the bound-ary layer. Domestic pollution plumes have only beenobserved during limited periods in summer, particularly inAugust, when the land–sea air circulation over Tokyo Bayoccasionally transports pollution from Tokyo to cause alate-afternoon daily maximum (Chang et al. 1989).
Mt. Fuji, Japan (FWS), Japan FWS was operated by theJMA until 2004, after which the nonprofit organization(NPO) Valid Utilization of Mount Fuji Weather Station(http://npofuji3776-english.jimdo.com) assumed respon-sibility for its operation. Mt. Fuji, which is the highestmountain in Japan, is located in the central part of themain Japanese island of Honshu. Its summit is posi-tioned in the FT for most of the year (Igarashi et al.2004). Westerly winds prevail at FWS, particularlystrong winds in winter, owing to the southward shift ofthe polar jet stream (Nakazawa et al. 1984).
Region III: South AmericaLa Quiaca Observatorio (LQO), Argentina LQO is op-erated by the Servicio Meteorológico Nacional (SMNA).This station is located in the Puna–Altiplano Plateau(15–26° S, 65–69° W) in the central portion of theAndes, which is an important dust activity region(Gaiero et al. 2013; Prospero et al. 2002). The Altiplanois situated between the hyper-arid Pacific coastal desertto the west and the moist continental lowlands to theeast. The prevailing flows in the middle and uppertroposphere over the Altiplano are westerly from May toOctober in the dry season and easterly from Decemberto March in the rainy season (Garreaud et al. 2003).
Region IV: North and Central AmericaWhistler Mountain (WHI), Canada WHI is located onthe summit of Whistler Mountain in a part of the CoastMountain Range approximately 100 km north ofVancouver. The station was established in 2002 to meas-ure aerosols and trace gases in the lower troposphereand is operated by Environment and Climate Canada(Macdonald et al. 2011). In this region, synoptic scaleclimatology is controlled by the Aleutian Low and thePacific High. In winter, the zonal flow is generally stron-ger, and the Aleutian Low causes a more southwesterlyflow over British Columbia. In summer, the intensifiedPacific High causes more a northwesterly flow over thesouth coast of British Columbia (Klock and Mullock2001). PBL influence was found to occur mostly duringspring and summer and less frequently in late autumnand winter (Gallagher et al. 2011, 2012). Biogenic pro-cesses characterized during the Whistler Aerosol and
Cloud Study 2010 (WACS 2010), which was a largemeasurement campaign with a focus on aerosols andclouds, have also been shown to be important at thestation during late spring and summer (e.g., Ahlm et al.2013; Lee et al. 2012; Pierce et al. 2012; Wainwrightet al. 2012; Wong et al. 2011).
Mt. Bachelor Observatory (MBO), USA MBO islocated on the summit of an extinct volcano in the Cas-cade Ridge of central Oregon. This station is operatedby the University of Washington. At this altitude, theflow is predominantly from the southwest to thenorthwest. Owing to its elevation, the prevailing westerlywinds, regional topography, and the lack of large urban/industrial emission sources upwind, MBO is wellpositioned for sampling FT air masses near the WestCoast of the USA with minimal influence from local an-thropogenic emissions (Weiss-Penzias et al. 2006). Threedistinct pollution influences have been identified atMBO: Asian long-range transport, North American bio-mass burning, and North American industry (Jaffe et al.2005; Weiss-Penzias et al. 2007; Reidmiller et al. 2010).
Niwot Ridge (NWR), USA NWR is located approxi-mately 35 km west of Boulder, Colorado, on the Contin-ental Divide for North America with runoff on the twosides destined for the Colorado and Mississippi Rivers,respectively. The station is situated on land owned bythe Mountain Research Station of the University ofColorado and is used as a Long-Term EcologicalResearch (LTER) site with support from the NationalScience Foundation. This site is also used by theNational Oceanic and Atmospheric Administration(NOAA) Global Monitoring Division for long-termmonitoring, flask sampling, and for the collection of airthat is used for preparing calibration standards of tracegases. Continuous O3 measurement has been conductedat two sites, data from both of which are available at theWDCGG website. We used the O3 data from the C-1 re-search site located at 3021 m a.s.l. in a subalpine forest10 km east of the Continental Divide of the Americas.For CO data, we used observations from the treeline van(T-van) research site at 3523 m a.s.l. located in an alpinefellfield. Weekly and bi-weekly flask samplings have beenalso operated at the T-van. Wind patterns at NWR aredominated by Westerlies (Haagenson 1979), although, attimes, upslope flows from the south or southeast trans-port air from Denver to the site (Hahn 1981).
Chiricahua National Monument (CHA), USACHA is located in Arizona and is operated as a CleanAir Markets Program site by the EPA. CHA contributesto the CASTNET program (https://www3.epa.gov/castnet/site_pages/CHA467.html), which monitors air quality
Okamoto and Tanimoto Progress in Earth and Planetary Science (2016) 3:34 Page 9 of 52

and deposition including O3 concentration, and to theIMPROVE program.
Great Basin National Park (GRB), USA GRB is locatedon the northeastern flank of the Snake Range in Nevada.This station is operated by the Great Basin NationalPark and is sponsored by the National Park Service(NPS) Air Resources Division. This agency administersan extensive air monitoring program that measures airpollution levels in national parks for visibility, gaseouspollutants, and atmospheric deposition. GRB contrib-utes to the CASTNET (https://www3.epa.gov/castnet/site_pages/GRB411.html) and IMPROVE programs.
Lassen Volcanic National Park (LAV), USA LAV islocated on the northwest flank of Mt. Lassen, thesouthernmost active volcano in the Cascade MountainRange in northern California. This station is operated bythe Lassen Volcanic National Park and is sponsored bythe NPS Air Resources Division. LAV contributes to theCASTNET (https://www3.epa.gov/castnet/site_pages/LAV410.html) and IMPROVE programs.
Yellowstone National Park (YEL), USA YEL is locatedin Wyoming. It is operated by the Yellowstone NationalPark and is sponsored by the NPS Air ResourcesDivision. YEL contributes to the CASTNET (https://www3.epa.gov/castnet/site_pages/YEL408.html) andIMPROVE programs.
Yosemite National Park (YOS), USA YOS is operatedby Yosemite National Park and is sponsored by theNPS Air Resources Division. YOS is located on thewestern slope of the Sierra Nevada Mountains in northernCalifornia. YOS contributes to the CASTNET program(https://www3.epa.gov/castnet/site_pages/YOS404.html)and IMPROVE programs.
Region V: South–West PacificTanah Rata (TAR), Malaysia TAR and the co-locatedCameron Highlands Meteorological Station are operatedby the Malaysian Meteorological Department (MMD)(Toh et al. 2013) and participate in the EANET program.Malaysia’s climate can be categorized into four seasons:the northeast monsoon (winter monsoon) fromNovember to early March, the southwest monsoon(summer monsoon) from late May to September, and twotransition periods between the monsoons (Yonemuraet al. 2002). The mean wind direction at TAR depends onthe monsoon season. The prevailing winds during thenortheast and southwest monsoons are from thenortheast and southwest, respectively. The precipitationpattern has two maximum and two minimum periods,
and temperatures are approximately constant throughoutthe year.
Mauna Loa (MLO), USA MLO is a GAW Globalstation operated by the Global Monitoring Division(GMD), NOAA Earth System Research Laboratory(NOAA/ESRL). This station is located on the slope ofthe active Mauna Loa volcano and is free from continen-tal pollution sources. Atmospheric constituents havebeen continuously monitored since the 1950s. Currently,MLO is well known for its measurements of rising an-thropogenic CO2 (e.g., Keeling et al. 1995). Winds atMLO are controlled by several factors including thestrength of synoptic scale or trade winds, the height andstrength of the trade wind inversion, the flow of the syn-optic winds around the island mountain topography,and the daily heating and cooling cycle on the island. Atnight, the station is above the inversion layer in the freetropospheric atmosphere with minimal influence fromlocal emissions. A long-term trend analysis of aerosoloptical properties (Collaud Coen et al. 2013) has shownsignificant negative trends for the backscatter fractionand Ångström exponent and positive trends for thescattering and absorption coefficients.
Region VI: EuropeSonnblick (SNB), Austria SNB is located on the highestpeak among the main ridges of the Austrian Alps. Thisstation is organized by the Environment Agency,Austria, and is one of the high-altitude stations of theMonitoring Network in the Alpine Region for Persistentand other Organic Pollutants (MONARPOP). Since itsfoundation in 1886, most of the main meteorological pa-rameters have been measured. These data serve as aunique long-term climate record (Schöner et al. 2012).The origins of pollution reaching SNB are typically in-dustrial areas in southern and central Germany, mostparts of northeastern Europe, and the northern parts ofItaly near the Milan agglomeration (Holzinger et al.2010). Local pollution sources reach SNB by convectivemixing, particularly in the daytime, when the mixingheight surpasses the altitude of SNB. Henne et al. (2010)assessed the parameters reflecting site representativenessin consideration of population (emission proxy), depos-ition, and transport at 34 sites in western and centralEurope. They classified SNB as a “mostly remote” sitewhere the total population influence, population vari-ability, and total deposition influence are small.
Zugspitze–Gipfel (ZUG) and Zugspitze–Schneefernerhaus(ZSF), Germany Zugspitze is the highest mountain ofthe Wetterstein Mountains in the Bavarian Alps. Moni-toring activities began at ZSF and were later moved toZUG in 2001 and 2002. ZUG and ZSF are both GAW
Okamoto and Tanimoto Progress in Earth and Planetary Science (2016) 3:34 Page 10 of 52

Global stations and are located at the summit and onthe southern slope of Zugspitze, respectively.ZSF has been jointly operated by the Federal Environ-
mental Agency (Umweltbundesamt, UBA) and theGerman Weather Service (Deutscher Wetterdienst,DWD). Because ZUG/ZSF, which is located at the north-ern flank of the Alps, is more distant from the centralAlps and at a lower elevation compared with SNB,Henne et al. (2010) classified ZUG/ZSF as a “weakly in-fluenced, constant deposition” site where the total popu-lation influence, population variability, and depositionvariability are systematically larger than those at “mostlyremote” sites. ZUG is a TCCON site, at which total col-umns of GHGs have been measured by means of FTIRspectroscopy (e.g., Angelbratt et al. 2011a, b; Rinslandet al. 2003; Vigouroux et al. 2008).
Monte Cimone (CMN), Italy CMN is a GAW Globalstation operated by the Institute of AtmosphericSciences and Climate of the National Research Councilof Italy (ISAC-CNR). Mt. Cimone is the highest peak ofthe northern Italian Apennines and is the only highmountain station for atmospheric research located be-tween the Southern Alps and the northern MediterraneanSea. The Apennines are the first mountain chain affectedby air masses from the Sahara on their way to Europe(Bonasoni et al. 2004). The station is considered to berepresentative of the baseline conditions of theMediterranean FT (Bonasoni et al. 2000a; Fischer et al.2003). Even during the warm seasons, the influence of theboundary layer air is substantial owing to convection andthe mountain breeze (Fischer et al. 2003; Van Dingenen etal. 2005). The Mediterranean basin is located at theboundary between the tropical zone and northern mid-latitudes. It serves as a crossroad for air masses originatingfrom Europe, Asia, and Africa, where anthropogenic emis-sions encounter natural emissions (Kanakidou et al. 2011;Lelieveld et al. 2002). Henne et al. (2010) classified CMNas a “weakly influenced, constant deposition” site.
Kislovodsk (KSL), Russian Federation KSL is orga-nized by the Oboukhov Institute of Atmospheric Physics(IFA), Russian Academy of Sciences. This station islocated on the mountain plateau at the northern slope ofthe side ridge in the North Caucasus. The main featuresof air transport to KSL in the summer are the prevailingnorthern components, which include the town ofKislovodsk and the Caucasus foothills, and the northeasterncomponents, which include the northern Caspian. In thewinter, the main air transport features are the prevailingsouthern components, which include the regions behindthe Caucasus and Asia Minor deserts, and the southwest-ern components, which include the Mediterranean and thedeserts of North Africa (Tarasova et al. 2003).
During the warm season from April to October, themountain–valley air circulation affects the O3 concentration(Elansky et al. 1995; Senik and Elansky 2001). Simultaneousmeasurements of O3 concentration were conducted at KSLand at the nearest town located 18 km to the north (Seniket al. 2005). That study indicated that surface O3 at KSL isonly slightly influenced by the pollutants accumulatedwithin the atmospheric boundary layer and revealed infor-mation relating primarily to the regional and global state ofthe troposphere. Observations of the total O3 and NO2
columns have also been reported (Elansky et al. 1995).
Krvavec (KVV), Slovenia KVV, managed by the Hydro-meteorological Institute of Slovenia (HIS), is located onthe slope of Mt. Krvavec in the Kamniško–SavinjskeAlps, which are part of the southern margin of the Alps.At this station, continuous measurements of blackcarbon (BC) and O3 have been conducted within theframework of the EMEP, which is a science-based andpolicy-driven program of the Convention on Long-Range Transboundary Air Pollution (CLRTAP) programset up to facilitate international cooperation in solvingtransboundary air pollution problems.
Arosa (ARO), Switzerland ARO is located within theeastern part of the Swiss Alps at the end of PlessurValley. This station is surrounded by mountains withheights ranging from 2500 to 3000 m a.s.l. The transportof emissions from large cities such as Chur and Davos toARO is rare due to a channeling effect (Li et al. 2005).The longest available total O3 record in the world is fromARO, where total O3 measurements have been conductedcontinuously since late 1926. The total O3 data are basedon measurements of ultraviolet (UV) radiation by Dubsonspectrophotometers and have been homogenized (Staehelinet al. 1998a). These data have been utilized in numerousstudies (e.g., Brönnimann et al. 2003; Hoegger et al. 1992;Krzyścin 2000; Rieder et al. 2010a, b; Scarnato et al. 2010;Staehelin et al. 1998b).
Jungfraujoch (JFJ), Switzerland JFJ is a GAW Globalstation located on a mountain crest on the northernedge of the Swiss Alps. As part of the station is incorpo-rated into the Swiss National Air Pollution MonitoringNetwork (NABEL), a wide range of in situ trace gasobservations is performed by the Swiss Federal Labora-tories for Materials Science and Technology (Empa) inassociation with the Swiss Federal Office for theEnvironment (FOEN). First sporadic aerosol observationsat JFJ started in the 1970s, but the majority of the oper-ational long-term measurements of aerosols and aerosoloptical properties were initiated by the Paul ScherrerInstitute (PSI) in the mid-1990s (Bukowiecki et al. 2016;Collaud Coen et al. 2007; Fierz-Schmidhauser et al. 2010;
Okamoto and Tanimoto Progress in Earth and Planetary Science (2016) 3:34 Page 11 of 52

Nyeki et al. 2012). The site has been shown to be excellentfor studies on new particle formation (Bianchi et al. 2016)or aerosol–cloud interaction, including mixed-phase andglaciated clouds (Hoyle et al. 2016; Verheggen et al. 2007).In addition, remote sensing investigations have beenperformed by FTIR spectroscopy, which allows for quasi-simultaneous investigation of total column concentrationsof a large number of gaseous constituents (e.g., Barret etal. 2002, 2003a, b; De Mazière et al. 1999; Dils et al. 2011;Duchatelet et al. 2009, 2010; Krieg et al. 2005; Mahieu etal. 1997; Melen et al. 1998; Rinsland et al. 1991, 1992,1996, 2000, 2008; Vigouroux et al. 2007; Zander et al.2008, 2010). JFJ is exposed mostly to FT air masses in au-tumn and winter. In late spring and summer, it is intermit-tently influenced by vertically exported polluted airmasses transported in the PBL over Europe (e.g.,Zellweger et al. 2000, 2003). Henne et al. (2010) classifiedJFJ as a “mostly remote” site.
Pico Mountain Observatory (PMO), Portugal PMO islocated on the summit caldera of Mt. Pico on the AzoresIslands in the central North Atlantic. PMO was jointlyestablished in 2001 by scientists from the University ofthe Azores and Michigan Technological University andhas been operated by these two groups, along with sci-entists from the University of Colorado, Boulder, sincethen. The Azores Islands are often affected by continen-tal outflow. Emissions from North America are trans-ported in the lower FT to the Azores. Episodically,emissions exported from the eastern US are transportedby warm conveyor belts associated with convectionfollowed by subsidence and reach the Azores within 5 to7 days (Owen et al. 2006). In addition, the Azores regionis affected by transport from high latitudes. Trace gasesand aerosols emitted from boreal wildfires in Canada,Alaska, and Siberia are transported to the Azores overlong periods ranging from 6 to 15 days (Honrath et al.2004; Lapina et al. 2008; Val Martin et al. 2008a). PMOalso has the advantage of being located in the lower FTmost of the time due to the mechanically forced upslopeflow resulting from the deflection of strong winds by themountain slope (Kleissl et al. 2007). In addition, the in-fluence of local sources on the island via upslope flowsis relatively small (Helmig et al. 2008; Kleissl et al. 2007;Val Martin et al. 2008b).
Instrumentation and measurement techniques for ozoneand its precursorsO3 concentrations can be measured by UV absorption,gas-phase titration, or conventionally by iodometric (KI)titration. The GAW Programme established a guidelinefor O3 measurement that recommends the use of UVabsorption in O3 analyzers as a routine measurementtechnique for continuous in situ observation (World
Meteorological Organization 2013). This measurementmethod is based on the absorption of radiation at253.7 nm by O3 in the gas cells of the instrument. AnO3 photometer is used as the primary standard, andtraceability is ensured through instrument comparisons(Tanimoto et al. 2007).The CO concentrations reported in this paper were
determined by collection of discrete air samples in flaskswith subsequent analysis in the laboratory, in addition tocontinuous measurements. GC/HgO, which refers to gaschromatography combined with mercury oxide (HgO)reduction detection, was used for measurements of COconcentrations in flasks. Non-dispersive infrared radiometry(NDIR), wavelength-scanned cavity ring down spectroscopy(WS-CRDS), or gas chromatography with flame ionizationdetection (GC-FID) were used for in situ measurements.All measurement methods require reference gases. In theGAW Programme, the gas standards for CO measurementshave been established and maintained by the NOAA/ESRL(World Meteorological Organization 2010).The NMHC concentrations reported in this paper
were determined by collection of discrete air samples inflasks with subsequent analysis in the laboratory, inaddition to continuous measurements. Gas chromatog-raphy with mass spectrometry (GC-MS) was used for insitu measurements, and GC-FID was used for in situand laboratory measurements.NO concentrations can be measured by ozone chemilu-
minescence detection (CLD), which utilizes the gas-phasereaction of ambient NO with O3 added in excess to the airsample. NO2 concentrations can be also measured by CLDvia reduction to NO by photolytic conversion. CLD com-bined with a thermal Au catalytic convertor has been usedfor NOy measurements. Intercomparisons of NOy measure-ments were performed at IZO (Zenker et al. 1998) andMLO (Atlas et al. 1996). The NO2 instrument at HPO usesa molybdenum (Mo) converter to thermally decomposeNO2 into NO. It has been shown that oxidized nitrogencompounds such as nitrous acid (HONO), peroxyacetylnitrate (PAN), and nitric acid (HNO3) are also converted toNO with high efficiency by the Mo convertor, and thereforecontribute to the overestimation of NO2 concentrationunder certain conditions (Fehsenfeld et al. 1987). In ruraland remote sites, where NOx is small compared to NOy,the interference is negligible. Therefore, we regard NOx
concentrations at HPO as NOy concentrations.
Seasonal and long-term changesTropospheric ozoneStratospheric vs. tropospheric processes Numerousobservations in the Northern Hemisphere have enabledthe analysis of the seasonal and long-term variations intropospheric O3. For a long period of time, stratosphere–troposphere exchange (STE) followed by subsiding
Okamoto and Tanimoto Progress in Earth and Planetary Science (2016) 3:34 Page 12 of 52

transport to the middle and lower troposphere wasconsidered to be the primary source of tropospheric O3
(e.g., Danielsen 1968; Junge 1962). Junge (1962) found auniform seasonal cycle of tropospheric O3 with amaximum in spring and a minimum in winter within theNorthern Hemisphere. Because the maximum was laterthan that of stratospheric O3 by 2 months, this delay wasthought to be caused by the response time that dependson the rate of O3 destruction within the troposphere.Seasonal cycles of radionuclides were also investigated
as evidence for STE. Beryllium-7 (7Be), beryllium-10(10Be), and lead-210 (210Pb) radionuclides, with half-livesof 53.3 days, 1.5 × 10⁶ years, and 22 years, respectively,are useful tracers for tracking the movement of airflowand convective activity in the atmosphere. 7Be and 10Beare produced by cosmic ray spallation reactions with Nand O atoms in the stratosphere and upper troposphere.More than half (~67%) of the 7Be and 10Be sources arelocated in the stratosphere. The remainder are located inthe troposphere, particularly in the upper troposphere(Lal and Peters 1967).In addition to the independent use of 7Be and 10Be,
the 10Be/7Be ratio has been considered as a stratospherictracer because its value in the stratosphere is signifi-cantly higher than that in the troposphere because of themarkedly longer radioactive half-life of 10Be than that of7Be (Koch and Rind 1998). 210Pb is a daughter nuclide ofradon-222 (222Rn), which is emitted from soils and has ahalf-life of 3.8 days (Turekian et al. 1977). Therefore,high 7Be concentrations with respect to low 210Pb concen-trations could indicate strong air subsidence from upperaltitudes, which can increase surface 7Be and O3 concen-trations, because these components are produced mainlyin the stratosphere/upper troposphere (Cristofanelli et al.2006, 2015; Cuevas et al. 2013; Tsutsumi et al. 1998; Zaniset al. 1999).Contrastingly, O3 produced photochemically within
polluted air masses in the troposphere can be traced bya high concentration of 210Pb. The combined use of 7Beand 210Pb can clarify information about the origin of theair masses (Graustein and Turekian 1996; Heikkilä et al.2008; Lee et al. 2007; Zanis et al. 2003b). Gros et al.(2001) utilized CO and its isotopic composition (13C, 18O,and 14C) together with 7Be as an STE tracer because14CO is produced by the neutron–proton exchange re-action in nitrogen-14 (14N) prior to its oxidation.Approximately three fourths of all 14CO in the atmos-phere is of direct cosmogenic origin. Gros et al. (2001)determined the proportion of stratospheric air in an airmass by examining the background and stratospherelevels of 14CO at SNB.The origins of air masses associated with high-O3
episodes and the contributions from the stratosphereand the troposphere have previously been discussed in
detail, along with the correlations of O3 with water vaporand anthropogenically emitted compounds such as CO,CO2, NMHCs, and total atmospheric Hg (Ambrose et al.2011; Bonasoni et al. 2000b; Cristofanelli et al. 2006, 2015;Kajii et al. 1998; Tsutsumi et al. 1998; Wang et al. 2006).Cristofanelli et al. (2006) investigated the influence ofstratospheric intrusion by using 7Be, relative humidity,potential vorticity (PV), and total column O3. Based onthe aforementioned methods, Cristofanelli et al. (2015)reconstructed the frequency of days influenced by strato-spheric intrusion at CMN for the period from 1996 to2011. Liang et al. (2008) utilized the oxygen isotopic ratioof atmospheric CO2 (δ
18O(CO2)) as a tracer at WLG. Theδ18O(CO2) and Δ17O(CO2) values were found to beenhanced by CO2 originating in the stratosphere and tohave a seasonal cycle that differed from those of surfacesources (Assonov et al. 2010).PV (1 PVU = 10−6 m2 s−1 K kg−1) analysis has also
been widely used to detect the STE (Cristofanelli et al.2006, 2009a, 2015; Cuevas et al. 2013; Ding and Wang2006; Kentarchos et al. 2000; Leclair De Bellevue et al.2006; Schuepbach et al. 1999; Tsutsumi et al. 1998). PVis the product of absolute vorticity and thermodynamicstability. Because PV is conserved in adiabatic, frictionlessflow, the dynamical tropopause is generally considered tobe a well-defined continuous surface with a quasi-materialcharacter. Air parcels can only cross the dynamical tropo-pause when diabatic or other non-conservative processes(such as friction) change the PV. In the atmosphere above350 hPa, PV rapidly increases with altitude, reaching typ-ical values from 1.0 PVU (Danielsen 1968) to 3.5 PVU(Hoerling et al. 1991).On the other hand, during the Los Angeles smog epi-
sodes in the 1950s, it was revealed that O3 was producedvia photochemical reactions in the polluted air contain-ing NOx and hydrocarbons (Haagen-Smit 1952). Later inthe 1970s and 1980s, photochemistry involving theoxidation of CO and hydrocarbons in the remote atmos-phere had been regarded as the major source of tropo-spheric O3 (e.g., Chameides and Walker 1973). Theseasonal cycles of tropospheric O3 have been argued as aclue to understanding the contributions from the strato-spheric influence and the tropospheric photochemistry.The spring O3 maximum has widely been observed atmany remote sites across the mid-latitudes in theNorthern Hemisphere (Monks 2000; Oltmans et al.2004). Arguments have been presented on the possiblemechanisms, sources, and processes of this variation, par-ticularly the roles of stratospheric intrusion and tropo-spheric photochemistry (Monks 2000; Scheel et al. 1997).As we discussed above, the former was considered to
be more important in 1960, while the latter was consid-ered to play a key role in later years, triggered by thefinding of a springtime PAN maximum, which is an
Okamoto and Tanimoto Progress in Earth and Planetary Science (2016) 3:34 Page 13 of 52

unambiguous marker for tropospheric photochemistry.It has been suggested that the onset of photochemicalO3 production from the accumulation of O3 precursorssuch as CO and NMHCs over the winter may be relatedto the springtime maximum of O3 (Penkett and Brice1986). Additionally, the lifetime of O3 in winter is longenough to allow its accumulation once produced fromthe precursors emitted from anthropogenic sources(Fenneteaux et al. 1999; Liu et al. 1987). Intensivecampaigns such as the Mauna Loa Observatory Photo-chemistry Experiment (MLOPEX) were made to gain anunderstanding of the detailed photochemical mecha-nisms of tropospheric O3 in the pristine marineatmosphere, thereby suggesting an important role of insitu photochemical production of O3 (e.g., Ridley andRobinson 1992).In more recent years, chemistry transport models,
evaluated against the seasonal cycles of tropospheric O3,predicted that photochemical production and strato-spheric influence were 4974 ± 223 and 556 ± 154 Tg(O3)year−1, respectively, thereby highlighting the importanceof photochemical production of O3 (e.g., Stevenson et al.2006; Sudo and Akimoto 2007). Based on these state-of-science models, the contribution of stratospheric O3 tothe spring maximum is thought to be minor. Nagashimaet al. (2010) showed the seasonal variations of the con-tributions from the stratosphere, PBL, and FT at 25 se-lected sites including ZSF, ISK, MDY, HPO, NWR, andMLO and concluded that the stratospheric contributionsfrom surface sites, including the interior of the Eurasiancontinent (ISK and MDY), had a minimum in summerand autumn.However, arguments on the role of the stratospheric
O3 in the tropospheric O3 distributions and variationscontinue, with emphasis on the differences in the season,region, and altitude. Škerlak et al. (2014) compiled a glo-bal 33 year climatology of STE for the period 1979 to2011 by using the ERA-Interim reanalysis dataset fromthe European Centre for Medium-Range Weather Fore-casts (ECMWF) and showed the geographical and sea-sonal distributions of stratospheric O3 fluxes across thetropopause and down to the top of PBL. They reportedthat western North America (from March to May) andthe Tibetan Plateau (in except for the period fromSeptember to November) are the regions where surfaceO3 levels were most likely affected by the STE, with amaximum value of more than 120 kg km−2 month−1.This could have significant implications for surface O3
air quality. However, these estimates could still havelarge uncertainties resulting from uncertainties and/orbiases in the reanalysis datasets used.
Seasonal variations The seasonal cycle of O3 is controlledby the interaction of photochemical and dynamical
processes and shows clear dependences on the latitude, alti-tude, and availability of precursors. Figure 2 shows the sea-sonal cycles of O3 at the 26 high-altitude stations aroundthe globe. Here, we show only data that were available onthe public websites or by the referred publications; the dataproviders are summarized in Table 1. The aforementionedtypical small springtime O3 maxima have been reported atnumerous stations on remote islands such as IZO, withpeak concentration of ~55 parts per billion (ppb) (Cuevaset al. 2013; Rodrıguez et al. 2004; Schmitt and Volz-Thomas 1997; Fig. 2f); MLO, at ~50 ppb (Oltmans et al.1996a, 2006; Fig. 2q); and PMO (Kumar et al. 2013). In alater study, Hauglustaine et al. (1999) utilized a photochem-ical box model in conjunction with the MLOPEX 2 mea-surements to evaluate the processes and species controllingphotochemistry and to provide insight into the O3, odd ni-trogen, and odd hydrogen budget in the FT over the Pacific.Their analysis indicated a well-balanced production anddestruction of O3 during all seasons. The net productionrate of O3 was slightly negative, indicating that this regionor the tropical Pacific troposphere acted as a net photo-chemical sink for O3.In continental Europe, including stations ZSF, SNB, JFJ,
KVV CMN, and KSL, the seasonal cycle of O3 at high alti-tudes exhibits a minimum in winter and a broad maximumbeginning in spring and extending to summer. This behav-ior represents a combination of the spring maximumgenerally observed in the Northern Hemisphere and a sec-ondary summer maximum, which is attributed to enhancedregional pollution associated with persistent anticyclonicweather (Chevalier et al. 2007). Such broad spring/summermaxima in O3 have been reported at SNB (~55 ppb) (Gilgeet al. 2010; Fig. 2b), ZSF (~55 ppb) (Gilge et al. 2010;Schuepbach et al. 2001; Fig. 2a), CMN (~60 ppb) (Bonasoniet al. 2000a; Campana et al. 2005; Fig. 2e), KSL (Elansky etal. 1995; Senik and Elansky 2001; Senik et al. 2005;Tarasova et al. 2003, 2009), KVV (~55 ppb; Fig. 2d), ARO(Campana et al. 2005; Pochanart et al. 2001; Staehelin et al.1994), and JFJ (~60 ppb; Balzani Lööv et al. 2008; Gilge etal. 2010; Schuepbach et al. 2001; Zanis et al. 2007; Fig. 2c).During three intensive observations known as the FREETropospheric Experiment (FREETEX), which covered theperiod of O3 buildup from late winter to late spring, theconcentrations of peroxy radicals (HO2+RO2) showed agradual increase from February to May (Zanis et al. 2003a).The calculated net O3 production rate showed an increas-ing seasonal trend from late winter to late spring. Zanis etal. (2003a) suggested that in situ photochemistry is import-ant and might have played a dominant role in controllingthe O3 accumulation from winter to spring in the lower FTover the European Alps.In East Asia, a distinct spring maximum associated
with a summer minimum with a small secondary peakin autumn was reported at HPO (~70 ppb; Kajii et al.
Okamoto and Tanimoto Progress in Earth and Planetary Science (2016) 3:34 Page 14 of 52

Fig. 2 Seasonal variations in tropospheric O3 concentration at 26 mountain stations (a–z). The lines with circles denote the average observed O3
concentrations during a particular period. The years in parentheses denote the averaging periods. The red shaded bands and error bars denote thestandard deviations
Okamoto and Tanimoto Progress in Earth and Planetary Science (2016) 3:34 Page 15 of 52

1998; Pochanart et al. 2004; Fig. 2l) and FWS (Tsutsumiet al. 1994) in Japan and at LLN (~50 ppb; Ou Yanget al. 2012; Fig. 2o) in Taiwan. This seasonal pattern andmagnitude are controlled by a combination of two fac-tors. Although O3 produced by photochemical activityaccumulates from winter to summer, the East Asianmonsoon brings pristine air masses from the PacificOcean during summer, yielding the spring maximumand the summer minimum (Tanimoto et al. 2005). Itshould be noted that the mean concentration at thespring peak during the period from 2008 to 2012 atHPO is 70 ppb, which is higher than those at Europeanand North American sites owing to the substantial ef-fects of anthropogenic activity in East Asia. It is consid-ered likely that air mass intrusion from the stratospheremight not contribute directly to the high springtime O3
concentration at HPO, according to analysis of the cor-relation between O3 and absolute humidity (Kajii et al.1998). In East Siberia, the seasonal cycle of O3 at MDYshowed a spring maximum and summer minimum(~50 ppb; Pochanart et al. 2003; Fig. 2k). This summerminimum is not caused by a continental–marine airmass exchange because MDY is located in the middle ofSiberia. Rather, it is caused by an O3 sink that includessurface deposition and more active vegetation (Pochanartet al. 2003). Wild et al. (2004) reported that the meanEuropean influence on the O3 concentration at MDY var-ied between 3.5 ppb in spring and 0.5 ppb in summer. InSouth Asia, the seasonal cycle at PYR showed a springmaximum and a summer minimum (~65 ppb; Bonasoniet al. 2010; Fig. 2m), which is similar to the case in EastAsia. This likely occurred because PYR is under a greaterinfluence from the South Asian monsoon, which bringsclean maritime air masses during summer (Bonasoni et al.2010). In addition, STE events at PYR showed frequencymaxima during the dry winter and pre-monsoon springseasons, which affected the O3 concentration (Bracci et al.2012; Cristofanelli et al. 2009a). The estimated average O3
increase with respect to the average mean values by STEevents for the period from 2006 to 2008 was 24 % (Bracciet al. 2012). The seasonal cycle of O3 at MAB alsodepends on the South Asian monsoon. However, spring-time O3 at MAB did not show a value as high as that atPYR, and the seasonal cycle was characterized by thesummer minimum and late autumn–winter maximum inthe period from October to February of ~50 ppb (Najaet al. 2003; Fig. 2n). It is considered likely that one of thereasons for the disagreement is the altitude difference ofapproximately 3400 m. Because the stratospheric influ-ence generally increases with an increase of altitude, PYRwas frequently influenced by STE in spring (Bracci et al.2012; Cristofanelli et al. 2009a).In central Asia, a broad summer maximum was found
in the surface O3 concentration observed at ISK
(~50 ppb; Fig. 2j) in Kyrgyzstan and at WLG on theQinghai–Tibetan Plateau (~60 ppb; Ding and Wang2006; Lee et al. 2007; Liang et al. 2008; Ma et al. 2005;Wang et al. 2006; Xu et al. 2015; Xue et al. 2011; Zhu etal. 2004; Fig. 2i). Analyses of the summer maximum atWLG have yielded contradicting results that have led totwo competing hypotheses on its cause: long-rangetransport of polluted air masses from central–easternChina and intrusion of O3-rich air masses from thestratosphere. In a three-dimensional (3D) regional chem-ical transport model study, Zhu et al. (2004) concludedthat the seasonal O3 transitions associated with theAsian monsoon system and transport from eastern–cen-tral China, central–South Asia, and even Europe are re-sponsible for the distinct seasonal O3 cycle at WLG. Analternative theory is that downward transport of airmasses from the upper troposphere–lower stratosphereplays a key role in controlling the seasonal cycle of O3 atWLG (Ma et al. 2005). An analysis of O3 measurementsand tropospheric and stratospheric tracers such as watervapor, CO, NMHCs, PV, and δ18O (CO2) attributed thesummertime O3 enhancements at WLG to stratosphericintrusion rather than the transport of anthropogenic pol-lution (Ding and Wang 2006; Liang et al. 2008; Wanget al. 2006). From measurements of 7Be and 210Pb, Leeet al. (2007) suggested that the combined processes ofthe downward transport of the stratospheric–uppertropospheric air masses and the long-range transport ofpolluted air masses from eastern–central China causedthe summertime O3 peak. A model calculation using theNested Air Quality Prediction Modeling System(NAQPMS) estimated the contributions of the regionaltransport of photochemically produced O3 and strato-spheric O3 at 10–25 and ~5 ppb, respectively (Li et al.2009). An analysis of backward trajectories for theperiod from 2000 to 2009 revealed that air masses fromcentral–eastern China dominated the airflow at WLG insummer, suggesting strong impacts of anthropogenicforcing on the surface O3 and other trace constituentssuch as CO, NO, NO2, NOy, PAN, HNO3, and particu-late nitrate (NO3
−) on the Tibetan Plateau (Xue et al.2011). Using a photochemical box model constrained byobservations, Xue et al. (2013) calculated the photo-chemical budgets of O3 and radicals and showed that O3
production was significantly greater than O3 destructionduring daytime in both spring and summer, which isindicative of net O3 production in both seasons. In con-trast, Ma et al. (2002) reported that the net O3 produc-tion is positive in winter but negative in summer. Xueet al. (2013) determined that the key factor leading tothis disagreement was the difference in NO levels andsuggested that the transport of anthropogenic pollutionfrom central–eastern China might perturb the chemistryin the background atmosphere over the Tibetan Plateau.
Okamoto and Tanimoto Progress in Earth and Planetary Science (2016) 3:34 Page 16 of 52

The circumstances described above indicate that thesummer maximum at WLG can be attributed to thetransport of anthropogenic pollution. Based on thesource-receptor analysis, Nagashima et al. (2010)suggested that the summer maximum of O3 at ISK wasmainly due to the enhanced contribution of O3
produced in the surrounding regions.In North America, three different types of seasonal
cycle were found in surface O3. A spring maximum wasobserved at WHI (~50 ppb; Macdonald et al. 2011;Fig. 2r) and CHA (~55 ppb; Fig. 2y). A broad spring–summer maximum was observed at GRB (~50 ppb;Fig. 2w), LAV (~45 ppb; Fig. 2u), MBO (~50 ppb; Gratzet al. 2015; Weiss-Penzias et al. 2007; Fig. 2s), NWR(~55 ppb; Oltmans and Levy 1994; Fig. 2v), and YEL(~50 ppb; Fig. 2t). A distinct summer maximum was ob-served at YOS (~60 ppb; Fig. 2x). It is possible that thesetypes of seasonal cycle in western North America reflecta difference in the influence of the boundary layer ateach site. All high-O3 events at MBO were observed be-tween early March and late September and were causedby the Asian long-range transport, the subsidence of O3-rich air from the upper troposphere–lower stratosphere,and the mixed influence of these two mechanisms(Ambrose et al. 2011). Therefore, the seasonal cycle atMBO might have been caused by the spring peak ofbackground O3 in the Northern Hemisphere and highO3 events occurring between early spring and latesummer.Compared with the Northern Hemisphere, O3 seasonal
cycle observations have not been conducted extensively inthe Southern Hemisphere and the equatorial regions, andthe O3 seasonal cycles observed at MKN and TAR, whichare located in the tropics, appear to be rather flat relativeto those at other mid-latitude sites. The O3 concentrationsat MKN exhibit little variation, with a minimum inNovember and a broad maximum in boreal summer(Henne et al. 2008). This cycle can be explained by theseasonal variation of monsoon flow over equatorial EastAfrica, which is driven by seasonal displacement of theITCZ. Although the seasonal variations in O3 at TAR werenot pronounced (Fig. 2p), based on observations from2006 to 2008, Toh et al. (2013) reported a substantial sea-sonal cycle associated with a minimum that occurredtwice a year in the November–December and March–April timeframes, along with a maximum that occurred inthe summer monsoon season in late May–September,which that coincided with the regional biomass burningperiod. This discrepancy is likely to be due to the interan-nual variability of O3 in tropical regions. The seasonalcycle at ASK, which is located in the Sahara Desert ofAlgeria between IZO and MKN, has an autumn minimumand a summer maximum in the July–August timeframe(~45 ppb; Fig. 2g). In South America, the seasonal cycle of
O3 observed at LQO is characterized by an autumn mini-mum in the March to May period and a spring maximumin September–October timeframe (~40 ppb; Fig. 2z). Itshould be noted that while these O3 maximum periodscoincide with the August to October biomass burningseason in the Southern Hemisphere (Duncan et al. 2003),the actual mechanism involved in the seasonal cycles hasnot been investigated.The latitudinal gradient in tropospheric O3 has also
been discussed in previous research. For example, Scheelet al. (1997) found that the O3 seasonal cycle amplitudewas smaller in the northwest area than in the southeastarea within Europe, and Winkler (1988) showed that thesurface O3 concentration over the Atlantic Ocean, whichwas twice as high in the Northern Hemisphere as that inthe Southern Hemisphere, generally increased withlatitude, and then dropped rapidly at 70° N. Figure 3shows the annual mean concentrations and the ampli-tude (annual maximum and minimum) of the seasonalcycles of tropospheric O3 observed at the mountain sitesas a function of latitude or altitude for the period of2008 to 2012. As can be seen in this figure, the mean O3
concentrations and the seasonal amplitude generallyincreased with latitude for the range of 0°–40° N and de-creased or stabilized at higher latitudes (Fig. 3c). Themeans were ~50 ppb in Europe and 30–45 ppb in Africa.Those in Asia were 35–50 ppb depending on the loca-tion, although three maxima were noted above 45 ppb atWLG, PYR, and HPO. In particular, the maxima at HPOand PYR were higher than those at other sites. Althoughone of the reasons for such a high value at PYR isbelieved to be its altitude at 5079 m a.s.l., no altitude de-pendency was observed for the annual mean O3 concentra-tion (Fig. 3a). Therefore, the high maximum values at PYRand HPO are associated with their seasonal cycle springmaxima. The minima were in the range of 30–50 ppb forall of the mid-latitude stations except for LLN. The tropicalsites differed from other mid-latitude sites, showing smallvariability over the course of the year. Insufficient data wereavailable to discuss the latitudinal gradient south of ~20° N.The seasonal amplitude for the 22 stations was 10–20 ppb,and again, the magnitude was generally dependent on thelatitude. Moreover, the seasonal amplitude at MAB, LLN,HPO, and PYR, at ~25–30 ppb (Fig. 3d) was substantiallylarger than that at the other stations. This result was causedby either a larger spring or autumn maximum due to in-tense photochemical production, and a smaller summerminimum due to the Asian monsoon, than those reportedat other sites. No altitude dependency was observed for theamplitude of the O3 concentration (Fig. 3b).
Long-term trends The long-term trends for tropo-spheric O3 have been actively examined and summarizedin many studies (e.g., Cooper et al. 2014; Oltmans et al.
Okamoto and Tanimoto Progress in Earth and Planetary Science (2016) 3:34 Page 17 of 52

2006, 2013; Vingarzan 2004). The abundance of O3 wasfirst observed in the 19th century. The relevancies of oldmeasurement data were examined and an apparent in-crease in the background O3 levels was observedthroughout the 20th century in Europe (Marenco et al.1994; Volz and Kley 1988). More recently, Gilge et al.(2010) calculated the long-term trends for surface O3 atSNB, ZUG/ZSF, and JFJ to be 0.22 ± 0.17 ppb year−1
(1989–2007), 0.42 ± 0.09 ppb year−1 (1975–2007), and0.26 ± 0.16 ppb year−1 (1986–2007), respectively. Duringthe past 40 years, the O3 concentrations at ZUG/ZSFshowed significant increases in the 1980s that slowed inthe 1990s (Gilge et al. 2010; Logan et al. 2012; Oltmanset al. 2013; Parrish et al. 2012). In the 1990s, O3 in-creases at European stations including SNB, CMN,ARO, ZUG/ZSF, and JFJ were broadly observed, indicat-ing that the increasing trend of O3 is a regional-scalephenomenon. The O3 concentrations at European sta-tions peaked in the late 1990s or early 2000s, followedby the current decreasing trend (Brönnimann et al.2002; Cristofanelli et al. 2015; Cui et al. 2011; Gilge et al.2010; Logan et al. 2012; Parrish et al. 2012; Oltmanset al. 2013; Staehelin et al. 1994). For the period from2000 to 2009, Logan et al. (2012) calculated the meanrate of O3 decrease at seven European alpine sitesincluding SNB, ZUG/ZSF, and JFJ to be −0.16 ±0.14 ppb year−1. They discussed possible contributingfactors to the O3 changes in central Europe, includingchanges in stratospheric input and in O3 precursors. Inaddition, they showed that emissions of NOx from both
the USA and Europe were almost constant in the 1980sbut decreased in the 1990s. Model studies havesuggested that variations in domestic emissions shouldhave the largest influence on O3 in summer, whereasvariations in emissions in North America and Asia shouldhave the largest influence in spring and late autumn overEurope (Fiore et al. 2009; Jonson et al. 2010). Such studiesconcluded that CO and CH4 emissions should have only aminor influence on O3 trends. However, the relationshipbetween the observed O3 trends and anthropogenic emis-sion changes is complex. Although total anthropogenicNOx emissions at northern mid-latitudes increased byonly ~14 % for the period from 1980 to 2010, long-termO3 trends showed remarkable increases (Parrish et al.2014). The long-term trend for surface O3 at KSL inCaucasus differed from that in central and southern Eur-ope (Senik and Elansky 2001; Tarasova et al. 2003, 2009)with the former showing a decreasing trend in the 1990s(Senik and Elansky 2001; Tarasova et al. 2003). For theperiod from 1991 to 2001, a strong concentration changeof −0.91 ± 0.17 ppb year−1 was observed, after which theO3 changes decreased to −0.37 ± 0.14 ppb year−1 for theperiod from 1997 to 2006 (Tarasova et al. 2009). Tarasovaet al. (2009) reported that the O3 surface trend differencewas caused by differences in the station locations relativeto the source areas affecting the O3 variations. The de-creasing O3 trend at KSL was caused by both substantialemission decreases in the 1990s due to the breakdown ofthe former USSR and emission control measures imple-mented in Europe.
Fig. 3 Annual mean concentration and range (maximum–minimum) of seasonal cycles of tropospheric O3 observed at mountain sites with respect tolatitude and altitude of station (a–d). The error bars denote the maxima and minima
Okamoto and Tanimoto Progress in Earth and Planetary Science (2016) 3:34 Page 18 of 52

In the North Atlantic, the surface O3 record at IZOshowed a slightly positive trend at 0.09 ± 0.02 ppb year−1
for the period from 1988 to 2009 with a rapid increasebetween 1996 and 1998 (Cuevas et al. 2013). Cuevaset al. (2013) suggested that the abrupt changes in the O3
levels reflect a phase shift of the North Atlantic Oscilla-tion (NAO), which altered the transport pattern to IZO.The predominant high positive phase of the NAO chan-ged from 1995 to 1996. IZO is influenced by flow fromboth the mid-latitudes and the subtropics and NAOchanges have resulted in an increased flow of the West-erlies in the mid-latitude subtropical North Atlantic,thus favoring the transport of O3 and its precursors fromNorth America. This process increased the troposphericO3 in the subtropical North Atlantic region after 1996.In East Asia, a positive O3 surface trend at 0.25 ±
0.17 ppb year−1 was observed at WLG for the periodfrom 1994 to 2013 (Xu et al. 2015), and an especiallystrong increase was found in autumn, followed byspring. HPO in Japan experienced a generally large in-crease in springtime O3 compared with the increasesover Europe and North America during the 2000s(Tanimoto 2009; Parrish et al. 2012). The mean growthrate in springtime O3 was ~1 ppb year−1 for the periodfrom 1998 to 2006 (Tanimoto et al. 2009). Tanimoto etal. (2009) showed that variations in NOx emissions andsatellite observations of tropospheric NO2 for East Asiawere consistent with a remarkable increase of O3 atHPO. Although this increasing trend is consistent withthe increasing anthropogenic emissions in East Asia, itcan only explain half of the observed increase by themodel calculation. In the western USA, positive trendsin springtime O3 concentrations have been reported(e.g., Cooper et al. 2014; Jaffe et al. 2003b; Jaffe and Ray2007; Parrish et al. 2012; Vingarzan 2004). Jaffe and Ray(2007) reported positive trends in O3 concentration atLAV and at YEL in all seasons with growth rates of 0.33and 0.50 ppb year−1, respectively, based on the analysisof deseasonalized monthly mean O3 concentrations(daytime data only) for the period from 1987 to 2004.Moreover, they proposed possible explanations for theseO3 trends that include (1) increases in regional emis-sions, (2) changes in the distribution of emissions, (3) in-creases in biomass burning in the western USA, and (4)increases in global background O3. Jaffe et al. (2008)showed that the increase in fires is largely responsiblefor the increase in summertime O3, but fires could notexplain the trend in O3 for other seasons. Jaffe (2011)found statistically significant correlations betweenspringtime O3 at 11 sites in the western USA includingCHA, GRB, and YEL and free tropospheric O3, as mea-sured by an ozonesonde in Boulder. This correlation in-dicates a downward transport of enhanced O3 from theFT to the surface. In summer, free tropospheric and
surface O3 concentrations and the number of days ex-ceeding the US National Ambient Air Quality Standards(NAAQS) threshold were all significantly correlated withemissions from biomass burning in the western USA.This also indicates that wildfires had a large impact onO3 concentrations in the western USA. The meanspringtime O3 at MBO showed significant increases of0.73 ± 0.54 ppb year−1 for the period from 2004 to 2013,whereas the annual mean O3 did not show a significanttrend (Gratz et al. 2015). An analysis of transport pat-terns by Gratz et al. (2015) suggested that long-rangetransport from Asia has a dominant influence on the in-creasing springtime O3. At HPO and MBO, which areboth strongly influenced by springtime outflow fromEast Asia, the O3 levels showed larger increases athigher percentile levels than those at lower percentilelevels (Gratz et al. 2015; Tanimoto 2009). A statisticallysignificant positive trend in the mean maximum daily 8-haverage (MDA8) O3 concentration at 0.12 ppb year−1 wasobserved at CHA for the period from 1989 to 2010(Chalbot et al. 2013). The surface O3 recorded at MLO inthe Northern Pacific has shown a significant increase of0.16 ± 0.04 ppb decade−1 (Oltmans et al. 2013). Oltmanset al. (2013) showed an increasing trend into the early2000s followed by a decline in later years. In the earliestperiod, the increase was observed primarily in spring, butin the most recent decade, increases during autumn andearly winter were observed to be greater. This change isattributed to a shift in the transport pattern associatedwith greater outflow from higher latitudes north of 30° N(Oltmans et al. 2006). Such a seasonal shift in the O3
maximum has not been observed at most stations in themid-latitudes, but shifts in the seasonal cycle to anearlier time of the year were observed at ZUG/ZSF, at5.1 ± 3.5 days decade−1 (Parrish et al. 2013); JFJ, at5.6 ± 4.1 days decade−1 (Parrish et al. 2013); and LAV,at 14 ± 19 days decade−1 (Cooper et al. 2014; Parrishet al. 2013). Additional studies are needed to determinewhy the seasonal O3 cycle shifts across northern mid-latitudes are only seen at some sites and not others.Parrish et al. (2014) showed comparisons of long-term O3
records observed at northern mid-latitude sites with threechemistry–climate model results. Some disagreement wasnoted between the observed and modeled results, suggest-ing that only limited confidence can be placed in the esti-mates of the present RF of tropospheric O3 derived frommodeled historic concentration changes and in the predic-tion of future O3 concentrations.Some differences between the changes in O3 concen-
trations at high-altitude sites and those at low-latitudesites have been observed. The temporal behavior atMace Head, which is a remote site in western Ireland,was similar to that at the alpine site, even though the O3
increase in the late 1990s occurred earlier at ZUG/ZSF
Okamoto and Tanimoto Progress in Earth and Planetary Science (2016) 3:34 Page 19 of 52

than at Mace Head (Logan et al. 2012). Parrish et al.(2012) showed the long-term O3 trends of 11 datasetsregarded as baseline conditions. These datasets coveredthe range from low level to FT level, and included ZUG/ZSF, ARO, JFJ, HPO, and LAV data. They showed thatboth absolute O3 concentrations and positive trends inO3 generally increased with the altitude of the measure-ment site. In addition, they suggested that the changesin O3 concentration showed a high degree of longitu-dinal uniformity over the last half of the 20th century atnorthern mid-latitudes.
Carbon monoxideIn the Northern Hemisphere, the seasonal maximum ofCO occurs in late winter and early spring, and the sea-sonal minimum occurs in summer (Novelli et al. 1998);the maximum occurs 3 to 4 months after the seasonalminimum in OH radicals. The summer minimum in COis explained well by the maximum occurrence of OH radi-cals, which are a CO main sink in the troposphere. Thetime lag for the CO maximum in late winter–early springreflects the mixed effects of the seasonal variations in OHradical concentrations and CO emissions. The slowerchemical destruction of CO by OH leads to a longer COlifetime in winter, which allows more accumulation. Be-cause the lifetime of CO is long enough for it to be trans-ported across the globe, the long-range transport ofindustrial and biomass burning emissions originating onthe Asian and North American continents can have sub-stantial impacts on seasonal variations, depending on thelocation of the observation site (Novelli et al. 2003; Pfisteret al. 2006; Yurganov et al. 2004, 2005).Figure 4 shows seasonal cycles of CO at 16 high-
altitude stations around the globe. The aforementioned,well-known seasonal cycles of CO have been reported atnumerous stations on remote islands such as at IZO,with a peak concentration of ~115 ppb (Gomez-Pelaezet al. 2013; Fig. 4f ); PMO (Kumar et al. 2013), and MLOat ~105 ppb (Greenberg et al. 1996; Jaffe et al. 1997;Fig. 4m). The seasonal cycle at ASK, at ~115 ppb(Fig. 4g), is similar to that at IZO.In continental Europe including ZUG, SNB, JFJ, KVV,
and CMN, the seasonal cycle of CO at high altitudes ex-hibits a maximum in late winter–early spring and aminimum in summer. The levels, amplitude, and timingdiffer slightly among sites, with SNB at ~160 ppb (Gilgeet al. 2010; Gros et al. 2001; Fig. 4b), ZUG at ~180 ppb(Gilge et al. 2010; Fig. 4a), CMN at ~150 ppb (Cristofa-nelli et al. 2013; Fig. 4e), KVV at ~180 ppb (Fig. 4d), andJFJ at ~140 ppb Balzani Lööv et al. 2008; Dils et al.2011; Forrer et al. 2000; Gilge et al. 2010; Zellweger etal. 2009; Fig. 4c).Maxima in late winter–early spring and minima in sum-
mer also occur in North America, with WHI at ~180 ppb
(Macdonald et al. 2011; Fig. 4n), NWR at ~135 ppb(Turnbull et al. 2007; Fig. 4p), and MBO at ~150 ppb(Weiss-Penzias et al. 2007; Fig. 4o).In East Asia, the timing of the maximum shifts late to-
ward the spring in association with a summer minimumand shows a small secondary peak in autumn, as observedat HPO with ~225 ppb (Kajii et al. 1998; Kato et al. 2000,2002; Narita et al. 1999; Pochanart et al. 2004; Fig. 4j), andLLN with ~215 ppb (Cheng et al. 2013; Lin et al. 2010;Ou-Yang et al. 2014; Fig. 4l). Similar to that of O3, the sea-sonal pattern and magnitude are controlled by a combin-ation of two factors: the impact of continental outflowfrom the Asian continent from winter to spring and theEast Asian monsoon that brings pristine air masses fromthe Pacific Ocean during summer. It should also be notedthat the mean concentration of the spring peak during theperiod from 2008 to 2012 at HPO and LLN was between200 and 250 ppb, which is higher than those at Europeanand North American sites, due to substantial impactsfrom anthropogenic activities in East Asia in the case atHPO (Pochanart et al. 2004), and Southeast Asia biomassburning activities in the case at LLN (Cheng et al. 2013;Ou-Yang et al. 2014). The seasonal cycle at MAB, at~180 ppb (Naja et al. 2003; Fig. 4k), shows a different pat-tern, with the maximum occurring after the monsoon sea-son, as observed with O3, due to transported pollutionfrom the northeast.In inland Asia, two types of seasonal cycle were found.
The seasonal cycle at MDY is a typical pattern with aspring maximum and a summer minimum (Pochanart etal. 2003). Wild et al. (2004) reported that the meanEuropean influence on the CO concentration at MDYvaried between 30 ppb in spring and 10 ppb in summer.However, the seasonal pattern at WLG (Zhang et al.2011) has a broad spring and summer maximum, whichis similar to that of O3 at WLG, thereby suggesting thatboth O3 and CO are controlled by the same mechanism.At WLG, the CO data plotted in the present studyshowed a different seasonal cycle from that found byZhang et al. (2011), which showed a late winter andearly spring maximum. This discrepancy is likely causedby large interannual variability and variance in the flasksampling data (Fig. 4i).In the tropics, the seasonal cycle of MKN, located
in the equatorial region, differs from that at other sta-tions. The maximum CO levels occur in January toMarch, followed by a sharp decrease toward Apriland May and an increase by the end of the year(Henne et al. 2008). Henne et al. (2008) determinedthat this seasonal cycle is associated with two maximain February and August and is caused by the oscilla-tion of monsoon circulation. The winter and springmaximum is caused by advection of CO-enriched airmasses in the Northern Hemisphere during boreal
Okamoto and Tanimoto Progress in Earth and Planetary Science (2016) 3:34 Page 20 of 52

winter. In contrast, the summer maximum was ob-served during advection of air masses from theSouthern Hemisphere that were affected by biomass-burning emissions in southern Africa.Similar to O3, CO also shows a gradient from south to
north and greater seasonal amplitude in the NorthernHemisphere than that in the Southern Hemisphere. Basedon the analysis of the global distribution of surface COdetermined by flask sampling, Novelli et al. (2003) re-vealed a gradient between the Northern and SouthernHemispheres, with a greater seasonal amplitude in theNorthern Hemisphere than that in the Southern Hemi-sphere and greater interannual variations in CO concen-trations in the Southern Hemisphere than that in the
Northern Hemisphere. Figure 5 shows the annual meanconcentrations and amplitude of the seasonal cycles oftropospheric CO observed at the mountain sites as a func-tion of altitude or latitude for the period from 2008 to2012. The annual mean concentrations and amplitude(annual maximum/minimum) of the seasonal cycles ofCO generally increased with latitude (Fig. 5c, d). This is areverse latitudinal distribution of tropospheric OH (e.g.,Spivakovsky et al. 1990). The annual mean concentrationsand amplitude of the seasonal cycles of CO generallydecreased with altitude (Fig. 5a), reflecting the fact thatthe emission sources of CO are located at the groundsurface. The means were from 120 to 180 ppb in Europeand Asia and 100 ppb in Africa, and the maxima at HPO
Fig. 4 Seasonal variations in CO concentration at 16 mountain stations (a–p). The lines with circles denote the average observed CO concentrationsduring a particular period. The years in parentheses denote the averaging periods. The asterisks denote CO data obtained by flask sampling. The redshaded bands and error bars denote the standard deviations
Okamoto and Tanimoto Progress in Earth and Planetary Science (2016) 3:34 Page 21 of 52

and LLN were higher than those at other sites. One of thereasons for such a high value at HPO is believed to be itsaveraging of the period from 1998 to 2003. The seasonalamplitude for the 15 stations except for LLN fell into therange of 85 to 180 ppb (Fig. 5b, d). The large seasonalamplitude at LLN was caused by a high spring maximumof ~215 ppb due to biomass burning activity in SoutheastAsia (Ou-Yang et al. 2014), rather than the low CO of~85 ppb in summer due to the Asian monsoon, becausethe summertime CO concentration at LLN was not sig-nificantly lower than that at other stations.The CO levels increased in the Northern Hemisphere
from the 1950s to the 1980s and then decreased in thelate 1980s (Khalil and Rasmussen 1994; Novelli et al.1998, 2003; Zander et al. 1989). Based on observationsfrom NOAA Climate Monitoring and DiagnosticsLaboratory sites, Novelli et al. (2003) estimated that theglobal mean CO concentrations decreased at a rate of−0.52 ± 0.10 ppb year−1 for the period from 1991 to2001. Worden et al. (2013) examined satellite observa-tion data for total column CO recorded by the Measure-ments of Pollution in the Troposphere (MOPITT)instrument from 2000 through 2011 and reported a con-tinued decreasing trend in the Northern Hemisphere.They stated that further studies are needed in order tounderstand the trends and the contributions fromanthropogenic emissions and possible changes in atmos-pheric chemistry through reactions with OH radicals.Few records of continuous observations of CO are avail-able beginning in the 1990s at high-altitude stations
other than MLO (Novelli et al. 1998, 2003) and JFJ (Dilset al. 2011; Gilge et al. 2010; Zellweger et al. 2009). Thetrend of CO at JFJ for the period 1996–2007 has beendetermined to be −3.36 ± 1.08 ppb year−1 (Gilge et al.2010) and −2.65 ± 0.04 ppb year−1 (Zellweger et al. 2009)calculated using background data, respectively. At MBOin the western USA, the mean springtime CO showed asignificant decrease for the period from 2004 to 2013,whereas the annual average CO did not show a signifi-cant trend (Gratz et al. 2015).
Other trace gases: NMHCs, NOx, and NOy
NMHCs Atmospheric NMHCs show considerable vari-ation on spatial and temporal scales, but it is difficult todetermine these variations on a regional basis because ofthe limited observational data on NMHCs available fromhigh-altitude stations. In the troposphere, NMHCs arepredominantly transformed not only by the chemicalprocesses of photolysis and reaction with OH radicaltypically during daytime but also by reaction with theNO3 radical during nighttime, and reaction with O3 forunsaturated species, in addition to coastal and marinearea reactions with chlorine (Cl) atoms, during daytime(Atkinson 2000). The reaction rate constants increasewith molecular weight within a given class of NMHCs,causing lighter, saturated NMHCs to exhibit sloweratmospheric decay and longer lifetimes (Atkinson andArey 2003). NMHC concentrations are determined bythe strength of the emission sources and their atmos-pheric removal processes. Generally, the seasonal cycles
Fig. 5 Annual mean concentration and range (maximum–minimum) of seasonal cycles of tropospheric CO observed at mountain sites withrespect to latitude and altitude of station (a–d). The error bars denote the maxima and minima
Okamoto and Tanimoto Progress in Earth and Planetary Science (2016) 3:34 Page 22 of 52
of NMHCs show a maximum in winter and a minimumin summer owing to reaction with OH radicals. NMHCconcentration ratios are useful indicators of the degreeof photochemical processing or aging because NMHCsare removed at different rates, and their concentrationpatterns change during transport due to reaction ratedifferences, which span several orders of magnitude(e.g., Helmig et al. 2008, 2015).Figure 6 shows the seasonal cycles of NMHCs at eight
high-altitude stations. In this paper, only relatively long-lived species that are subject to intercontinentaltransport are shown, based on the lifetime or rate con-stant data reported by Atkinson and Arey (2003). Ethane(C2H6) with a lifetime of ~47 days showed a distinct sea-sonal cycle with a winter–spring maximum and a sum-mer minimum with peak concentrations of ~1870 ppt atJFJ (Fig. 6a), ~1390 ppt at PMO (Helmig et al. 2008,2015; Fig. 6b), ~1910 ppt at HPO (Sharma et al. 2000;Fig. 6c), ~1240 ppt at IZO (Schmitt and Volz-Thomas1997; Fig. 6d), ~1210 ppt at ASK (Fig. 6e), and ~950 pptat MLO (Greenberg et al. 1996; Fig. 6f ) in the NorthernHemisphere. The seasonal cycle at MKN in the equator-ial region showed two minima in April and October andtwo maxima in January and August, with a peak concen-tration of ~690 ppt (Fig. 6g). This pattern correspondsto the climate pattern in equatorial East Africa inducedby the displacement of the ITCZ. Acetylene (C2H2), witha lifetime of ~16 days, showed a distinct seasonal cyclewith a winter maximum and summer minimum at CMNwith ~340 ppt (Fig. 6h), IZO with ~250–280 ppt(Schmitt and Volz-Thomas 1997; Fig. 6j), and MLO with~260–320 ppt (Greenberg et al. 1996; Fig. 6k). The sea-sonal cycle at HPO showed a summer maximum with~800 ppt, which might be the result of a local source(Sharma et al. 2000; Fig. 6i). However, based on data thateliminated the polluted air masses, Sharma et al. (2000)showed a distinct seasonal cycle of C2H2 with a max-imum in winter and a minimum in summer. Propane(C3H8), with a lifetime of ~11 days, also shows a distinctseasonal cycle with a maximum in late winter–springand a minimum in summer with ~720 ppt at JFJ (Fig. 6l),CMN with ~770 ppt (Fig. 6m), PMO with ~380 ppt(Helmig et al. 2008, 2015; Fig. 6n), HPO with ~790 ppt(Sharma et al. 2000; Fig. 6o), ~440 ppt at IZO (Schmittand Volz-Thomas 1997; Fig. 6p), ~265 ppt at ASK(Fig. 6q), and ~140 ppt at MLO (Fig. 6r). The seasonalcycle at MKN showed two minima in April and Octoberand two maxima in January and June at ~95 ppt (Fig. 6s).Benzene (C6H6), with a lifetime of ~10 days, showed adistinct seasonal cycle with a winter maximum and sum-mer minimum at JFJ with ~105 ppt (Fig. 6t), CMN with~150 ppt (Fig. 6u), IZO with ~90–110 ppt (Fig. 6v), andMLO with ~40–60 ppt (Fig. 6w). Generally speaking, theamplitudes of the seasonal cycles of C2H6 and C3H8
depend on the latitude, with smaller amplitudes at thelower-latitude sites and higher amplitudes at the higher-latitude sites (Fig. 7c, d). This feature is caused by a lar-ger seasonal contrast of photochemical removals athigher latitudes than at lower latitudes. Li et al. (2005)showed that the concentrations of NMHCs, includingC6H6 at ARO, were higher than those at JFJ because thecontributions from the boundary layer emissions weregenerally higher at ARO due to the lower altitude. Theannual maximum concentrations of C2H6 and C3H8 athigher-altitude stations are higher than those at lower-altitude stations within each latitudinal band (Fig. 7a, b).
NOx and NOy NOx in the troposphere are importantprecursors for tropospheric O3 and also affect OH andperoxy radicals (ROx) concentrations, which govern thelifetimes of various gases in the troposphere (e.g., Levy1971). In the troposphere, nitrogen species are primarilyemitted in the form of NOx from anthropogenic sourcesand are subsequently oxidized to other reactive nitrogenspecies along numerous different pathways (Fahey et al.1986). The atmospheric lifetime of NOx is generally inthe order of hours to a day (Seinfeld and Pandis 2006).NOy, which includes the sum of NOx and its oxidationproducts such as PAN, dinitrogen pentoxide (N2O5),nitrous acid (HNO2), HNO3, and particulate nitrate(NO3
−), plays an important role in the overall oxidizingcapacity of the troposphere (Logan 1983).In European countries, NOx emissions declined signifi-
cantly in the early 1990s due to the mandated installa-tion of catalytic converters in vehicles and otheremission reduction measures. Long-term measurementsof NOy, NOx, and NO have been conducted at JFJ (Gilgeet al. 2010; Pandey Deolal et al. 2012). For the periodfrom 1998 to 2009, the overall annual averages of O3
and NOy were the highest in 2003, which was the hottestyear in recorded European history caused by an excep-tionally prolonged summer heat wave (e.g., Tressol et al.2008). For the period from 1998 to 2002, the NOy trendwas positive but not significant, whereas in the periodfrom 2004 to 2009, a significant decreasing tendency wasobserved at a rate of −0.048 ± 0.012 ppb year−1. For theperiod from 1998 to 2009, no significant trend was found(Pandey Deolal et al. 2012). The comparison of PAN con-centrations between the period from 1997 to 1998 andfrom 2009 to 2010 has indicated slightly lower values inrecent measurements (Pandey Deolal et al. 2013).NOy measurements showed a broad spring and sum-
mer maximum at SNB, with a peak concentration of~1.4 ppb (Kaiser 2009; Fig. 8f ); ZUG, at ~1.5 ppb(Fig. 8g); and JFJ, at ~1.1 ppb (Gilge et al. 2010; PandeyDeolal et al. 2012; Zanis et al. 2007; Fig. 8h). On theother hand, NOx showed a minimum during these sea-sons at SNB, with a peak concentration of ~0.6 ppb
Okamoto and Tanimoto Progress in Earth and Planetary Science (2016) 3:34 Page 23 of 52

Fig. 6 Seasonal variations in C2H6, C2H2, C3H8, and C6H6 concentrations at eight mountain stations (a–w). The lines with circles denote the averageNMHCs for observations during a particular period. The years in parenthesis denote the averaging periods. The red shaded bands and error bars denotethe standard deviations
Okamoto and Tanimoto Progress in Earth and Planetary Science (2016) 3:34 Page 24 of 52

(Kaiser 2009; Fig. 8a); ZUG, at ~0.7 ppb (Fig. 8b); andJFJ, at ~0.4 ppb (Gilge et al. 2010; Pandey Deolal et al.2012; Zanis et al. 2007; Fig. 8c). Because the NOx life-time is significantly shorter in summer than in winter(e.g., Schaub et al. 2007), NOx concentrations are higherduring the cold season. At JFJ, PAN measurements alsoshowed a broad spring and summer maximum in thestudy of Pandey Deolal et al. (2013). They concludedthat the mechanism of hydrocarbon accumulation in theFT in winter and the photochemically produced PAN inspring is not a dominant factor of the springtime PANmaximum. Rather, their analysis indicated a combinationof strong photochemical activity in spring and summerwith enhanced vertical transport from the EuropeanPBL. The seasonal cycle of NOy at HPO showed aspring–early summer maximum at ~2.0 ppb (Fig. 8k).This cycle and level are similar to those of NOy inEurope. At WLG, the NO2 level did not show a mini-mum in summer in the study of Meng et al. (2010). Maet al. (2002) also reported higher NOx concentrations inJuly than in January. The NOx and NOy concentrationsare low on remote islands such as IZO and MLO. AtMLO, the seasonal cycle of NOx, averaged only for freetropospheric observations, showed a spring maximum at~0.04 ppt, and NOy showed a maximum in spring, witha peak concentration of ~0.4 ppb (Ridley et al. 1998;Fig. 8d, h). NOx/NOy ratios were fairly invariant over theyear, which implied that the partitioning of NOy wasnear steady state (Ridley et al. 1998). NOx observations
at PMO exhibited a distinctive seasonal cycle with a Julyto October peak concentration of ~0.04 ppb that waslarger than those in other months (Val Martin et al.2008b; Fig. 8e). Val Martin et al. (2008b) concluded that insitu sources of NOx such as PAN decomposition and po-tential photolysis of HNO3 are required to provide NOx
levels because the lifetime of NOx is shorter than its transittime from continental source regions. NOy observations ex-hibited a distinct seasonal cycle with a peak concentrationof ~0.4 ppb, which was larger from June to September thanfrom November to March due to boreal forest wildfires anda more efficient export and transport from eastern NorthAmerica (Val Martin et al. 2008a; Fig. 8j).
Long-range transport from continental sourcesAnthropogenic emissionsDuring the past several decades, global anthropogenicemissions have increased markedly, following the dramaticgrowth of socioeconomic activity and energy use (e.g.,Bond et al. 2007; Lamarque et al. 2010) particularly inChina, which has become the largest contributor of Asianemissions. The growth rates for China’s anthropogenicemissions are also the highest because of the unremittingincrease in energy consumption, economic activity, andinfrastructural development (e.g., Kurokawa et al. 2013).Trace gases and aerosols emitted from anthropogenicsources in East Asia have been observed at a number ofmountain sites in Asia and North America includingWLG (Cheng et al. 2007; Fu et al. 2012; Mu et al. 2007;
Fig. 7 Annual maximum concentration and range (maximum–minimum) of seasonal cycles of C2H6 and C3H8 observed at mountain sites withrespect to latitude and altitude of station (a–d)
Okamoto and Tanimoto Progress in Earth and Planetary Science (2016) 3:34 Page 25 of 52

Fig. 8 Seasonal variations in NOx and NOy concentrations at six mountain stations. The lines with circles denote the average observed NOx and NOy concentrationsduring a particular period. The years in parenthesis denote the averaging periods. The red shaded bands and error bars denote the standard deviations. Theconcentrations of NOx and NOy were measured using photolytic (a–e), thermal Au (f–j), and Mo (k) convertors, followed by chemiluminescence detection
Okamoto and Tanimoto Progress in Earth and Planetary Science (2016) 3:34 Page 26 of 52

Wang et al. 2006; Xue et al. 2011, 2013; Zhang et al.2009a, 2011), HPO (Liu et al. 2013; Pochanart et al. 2004;Sharma et al. 2000; Tanimoto 2009; Tanimoto et al. 2009),FWS (Igarashi et al. 2004, 2006), MLO (Brasseur et al.1996; Jaffe et al. 1997; Levy and Moxim 1989; Luria et al.1992; Perry et al. 1999), LAV (Jaffe et al. 2003a), and MBO(Ambrose et al. 2011; Fischer et al. 2010a, b; Genualdi etal. 2009; Jaffe et al. 2005; Primbs et al. 2008a, b; Reidmilleret al. 2009, 2010; Strode et al. 2008; Swartzendruber et al.2006; Timonen et al. 2013; Weiss-Penzias et al. 2006,2007; Wolfe et al. 2007). These emissions are illustrated inFig. 9. HPO, which is located near the Sea of Japan, is anappropriate site for assessing the influence of air masstransport from the continent. Wild et al. (2004) estimatedthat local sources in Japan and regional East Asian sourcescontributed about 15 and 8 %, respectively, to O3 observedat HPO in April 1996. The mass concentration of BC atHPO in a study by Liu et al. (2013) showed the highestvalue in spring and the lowest value in winter. By usingthe 3D Community Multiscale Air Quality (CMAQ)chemical transport model combined with the Process, Age,and Source Region Chasing Algorithm (PASCAL) sourceand process apportionment method, Liu et al. (2013) esti-mated that approximately 53 % of the observed BC wastransported from northern China. Tanimoto et al. (2009)examined the contribution of Asian anthropogenic emis-sions to the observed O3 trends at HPO by using CMAQ.However, a discrepancy was found between the observationand model results, thereby suggesting a significant under-estimation of the actual growth of the Asian anthropogenicemissions or incompleteness of the modeling of pollutionexported from continental Asia. MBO has proven to be ef-fectively positioned for observing the transpacific transport
of Asian plumes. Ambrose et al. (2011) described the de-tailed mechanism of Asian long-range transport to MBO.Surface emissions are lifted from the Asian boundary layerinto the FT by convective, frontal, and orographic lifting(Bey et al. 2001; Cooper et al. 2004; Liang et al. 2004; Liu etal. 2003a). Frontal lifting is the primary mechanism fordelivering eastern Asian emissions to the FT (Liu et al.2003a). Once lifted to the FT, pollutants can be efficientlytransported eastward toward North America by the prevail-ing westerly winds. Stohl et al. (2002) estimated the timescale of the trans-Pacific transport in the FT to be from 4to 10 days. Subsidence wind over the northeast Pacific de-livers air masses bearing Asian emissions to the lower FTover the US West Coast. This eastward export of Asianemissions is most efficient in spring due to intense frontalactivity coupled with a strong westerly jet over the centralPacific (Liu et al. 2003a; Yienger et al. 2000). A calculationusing the Goddard Earth Observing System chemical trans-port model (GEOS-Chem) revealed that, during the Inter-continental Chemical Transport Experiment Phase B(INTEX-B) period (Zhang et al. 2009b), most of the O3 pro-duction in Asian O3 pollution events occurred over EastAsia, with maxima over northeast China and southern Japanin the spring of 2006. This model predicted significant O3production over the North Pacific during plume transport.The plume on May 1 passed a more northerly and higher-altitude route than that on May 10, resulting in less O3 pro-duction over the Pacific (Zhang et al. 2008). Both plumesshowed a secondary O3 production maximum at the WestCoast of the USA, where the subsidence of air massescaused PAN decomposition and more O3 production (e.g.,Zhang et al. 2008). In addition to the trans-Pacific transport,regional pollution from North America has been observed
Fig. 9 Schematic overview of long-range transport pathways for dust (blue arrows), anthropogenic pollutants (yellow arrows), biomass burning(red arrows), and volcanic emissions (green arrows), which have been reported in the literature over time
Okamoto and Tanimoto Progress in Earth and Planetary Science (2016) 3:34 Page 27 of 52

at MBO (Fischer et al. 2010b; Primbs et al. 2008a, b; Reid-miller et al. 2010; Strode et al. 2008; Weiss-Penzias et al.2006) and WHI (Macdonald et al. 2011). The influence ofAsian anthropogenic emissions on MLO has been identifiedthrough observations of CO (Jaffe et al. 1997) and aerosols(Perry et al. 1999). Jaffe et al. (1997) concluded that the ma-jority of the elevated CO events occurred during spring andwere usually associated with transport from Asia. Perry et al.(1999) estimated that at least one third of the sulfate (SO4
2−)species including sulfuric acid (H2SO4), ammonium bisulfate((NH4)HSO4), and ammonium sulfate ((NH4)2SO4) detectedduring spring from 1993 to 1996 were anthropogenic in ori-gin. This result is consistent with the seasonal cycles ofbromine (Br), lead (Pb), and zinc (Zn), high concentrationsof which are found in the fine fractions of fly ash from coal-fired power plants. Levy and Moxim (1989) concluded thatthe NOy maximum in the summer was caused by fossil fuelcombustion in the USA, and that the Asian emissions con-tributed to only a small increase in spring.Air masses affected by anthropogenic emissions have
been observed at WLG by the enhancement of O3, CO,NOy, total gaseous mercury (TGM), and volatile organiccompounds (VOCs). Backward trajectory analysis at WLGfor the summers of 2000 to 2009 suggests the dominanceof anthropogenic pollution transported from central andeastern China in most years (Xue et al. 2011). Fu et al.(2012) identified potential source regions of anthropo-genic pollutants at WLG as eastern Gansu, easternQinghai, western Shanxi, Ningxia, and northern India,while Zhang et al. (2009a) described the transport mecha-nisms for polluted air from Lanzhou, the capital of Gansuprovince. They found that the plumes from Lanzhou wereadvected by strong easterly winds, which were vented tothe FT by a belt-like mountain and were transported toWLG, either directly or by mixing, by nighttime mountainbreezes. In addition, the high concentrations of organo-chlorine pesticides (OCPs) such as hexachlorocyclohexane(γ-HCH), dichlorodiphenyltrichloroethanes (DDTs), andpolybrominated biphenyls (PBDEs) were found to be re-lated mainly to air masses passing over Russia andKazakhstan (Cheng et al. 2007). The particle number con-centration at WLG was higher during the summer andlower during the rest of the year in the study of Kivekäset al. (2009). Their back trajectory analysis revealed thatair masses transported from the east are associated withhigher particle number concentrations than those trans-ported from other directions. As a result, they concludedthat the eastern air masses might be affected by regionalpollution sources such as Xining and Lanzhou.The atmospheric conditions at PYR can be influenced
by the transport of polluted air masses from South Asiaand the Indo–Gangetic Plains and the ABCs extendfrom the Indian Ocean to the Himalayan ridge (Bonasoniet al. 2010). Bonasoni et al. (2010) showed that a mountain
valley can provide an efficient channel favoring the trans-port of pollutants to high altitudes when the brown cloudsextend as far as the Himalayan foothills under active valleybreezes. They found that the most frequent direct trans-port of brown clouds occurred during the pre-monsoonseason, occupying 20 % of total pre-monsoon days. Aero-sol total number concentration, aerosol optical properties,PM1, PM1–10, and BC showed a maximum during the pre-monsoon season and a minimum during the monsoonseason (Marcq et al. 2010; Marinoni et al. 2010; Sellegri etal. 2010). The monsoon minimum was attributed to wetscavenging caused by frequent clouds and precipitation.The pre-monsoon maximum was linked to an increase inanthropogenic emissions in the Indian subcontinentcoupled with dry meteorological conditions, and to thelarge vertical extent of the regional PBL on the Indo–Gan-getic Plains. At MAB, ammonium (NH4
+), NO3−, and non-
sea-salt SO42− (nss-SO4
2−) aerosol concentrations showed adistinctive seasonal cycle, with a decrease (increase) dur-ing the wet (dry) season (Rastogi and Sarin 2005). They at-tributed the low levels of NH4
+, NO3−, and nss-SO4
2−
concentrations during the wet season to the predomin-ance of the oceanic air mass and the high levels during thedry season to the enhanced downwind transport of pollut-ants and the lack of wet removal. The relative enrichmentof NH4
+ and nss-SO42− and their linear relationship in
PM2.5 suggests that their predominant source is anthropo-genic in northern India in winter (Kumar and Sarin 2010).Francis (2012) identified a high sulpher dioxide (SO2) re-gion surrounded by (30° N, 75° E) north of MAB by usingthe GEOS-Chem model and concluded that the observedspikes in SO2 concentration at MAB were caused by thetransport from that high-SO2 region.Emissions transported from North America have been
observed at IZO (Cuevas et al. 2013; Schultz et al. 1998),PMO (Honrath et al. 2004), ARO (Huntrieser et al. 2005),ZUG/ZSF (Huntrieser et al. 2005), and JFJ (Guerova et al.2006; Huntrieser et al. 2005; Pandey Deolal et al. 2013).Most of the elevated CO events observed at PMO duringthe summers of 2001 to 2003 were attributed to the out-flow of North American pollution and the long-rangetransport of biomass-burning emissions, whereas O3 andCO concentrations were strongly correlated with the flowfrom the eastern USA when the biomass-burning effectswere absent (Honrath et al. 2004). The concentration ra-tios of NMHCs have been used as indicators of the degreeof photochemical processing or aging, mainly via reactionwith OH radicals, because the ratios evolve as atmos-pheric processing occurs depending on the individual OHrate constants (e.g., Parrish et al. (2007). Honrath et al.(2008) demonstrated that continuous measurements ofNMHCs are a useful tool for identifying and characteriz-ing pollution transport events. Owen et al. (2006) de-scribed the transport mechanisms of North American CO
Okamoto and Tanimoto Progress in Earth and Planetary Science (2016) 3:34 Page 28 of 52

emissions to PMO in the lower FT over the central NorthAtlantic. They found that two mechanisms were respon-sible for the export of pollution from the North Americanboundary layer that led to the enhanced CO events atPMO: direct advection from the continental boundarylayer eastward over the Atlantic Ocean and uplift ahead ofcold fronts. In another study, NOy levels were significantlyincreased in the presence of North American anthropo-genic emissions (Val Martin et al. 2008a). Zhang et al.(2014) analyzed the chemical evolution of two pollutionplumes transported from North America to PMO in thesummers of 2009 and 2010. They concluded that the en-hanced change in O3 relative to CO (ΔO3/ΔCO), whichhas been frequently used as an indicator of O3 productionin transported plumes, might not reflect O3 chemistryalone, and that the CO destruction in the plume couldalso explain the higher values. Kumar et al. (2013) showedsignificant decreasing trends of CO and O3 for the periodfrom 2001 to 2011 by in situ measurements at PMO andmodel simulations using GEOS-Chem. They concludedthat the most important factor contributing to thesedecreasing trends was the decline in anthropogenic emis-sions from North America. Under the framework of theConvective Transport of Trace Gases into the Middle andUpper Troposphere over Europe (CONTRACE) project,aged plumes of North American pollution that passedover Europe were observed by Huntrieser et al. (2005) atARO, ZUG/ZSF, and JFJ. They used the FLEXiblePARTicle (FLEXPART) Lagrangian particle dispersionmodel to simulate the transport pathway of the pollutionplume over the Atlantic and its dispersion over Europe.The passage of the North American plumes over Europerequired almost 3 days. The time elapsed since thepollutant emission, derived by the NOy/CO slope in thepolluted plumes, was in good agreement with that simu-lated by the FLEXPART age spectra. Furthermore, a posi-tive correlation between O3 and CO in the plumessuggested that photochemical O3 production occurred. Acomparison of the model results with observations at JFJrevealed that the GEOS-Chem model tended to underesti-mate the O3 concentrations (Guerova et al. 2006). Becausethe stratospheric contribution to the estimates based onthe 7Be/10B ratio was shown to be reasonable (Zanis et al.2003b), Guerova et al. (2006) suggested that this discrep-ancy resulted from an underestimation of the Europeancontribution. They found that a substantial North Ameri-can contribution over Europe did not always result in O3
enhancement in summer. Cui et al. (2009) estimated thecontribution of stratospheric intrusion and intercontinen-tal transport from the North American PBL to JFJ in 2005by using FLEXPART and the Lagrangian analysis tool(LAGRANTO) trajectory model. They determined thatJFJ was influenced by stratospheric intrusion during 19and 18 % of the total annual time and by intercontinental
transport from North American PBL during 13 and 12 %of the total annual time, as indicated by FLEXPART andLAGRANTO, respectively. At IZO, a good correlation be-tween O3 and CO in winter and spring was observed, sug-gesting long-range transport of photochemically generatedO3 from North America (Cuevas et al. 2013). Sholkovitzet al. (2009) estimated that from 12 to 30 % of the annualapportionment of the soluble aerosol Fe fluxes was con-tributed by anthropogenic aerosols. IZO has also been in-fluenced by North African pollution. During the summer,IZO remains in the altitude of the Saharan Air Layer(SAL), which is exported westward at low tropicallatitudes (<15° N) in winter and at higher subtropicallatitudes in summer (15–30° N; Rodríguez et al. 2011).Rodríguez et al. (2011) suggested that North Africanindustrial pollutants, including emissions from crude oilrefineries, the phosphate-based fertilizer industry, andpower plants located at the Atlantic coast of Morocco,northern Algeria, eastern Algeria, and Tunisia might bemixed with desert dust and before being exported to theNorth Atlantic in the SAL. Verver et al. (2000) reportedpollution outbreaks both from the Iberian Peninsula andnorthern or central Europe to IZO during the SecondAerosol Characterization Experiment (ACE-2) campaign.The Alps, located in the center of Europe, are sur-
rounded by regions of intensive air pollutant emissions.Transport of anthropogenic emissions in Europe to thehigh-altitude Alpine stations have been observed at SNB(Gros et al. 2001; Jabbar et al. 2012; Kaiser 2009; Kaiseret al. 2007; Karl et al. 2001a, b; Seibert et al. 1998),ZUG/ZSF (Jabbar et al. 2012; Kaiser et al. 2007), CMN(Bonasoni et al. 1997; Cristofanelli and Bonason 2009,2013), KVV (Kaiser et al. 2007), ARO (Campana et al.2005; Pochanart et al. 2001), and JFJ (Collaud Coen et al.2011; Forrer et al. 2000; Kaiser et al. 2007; Kuebler et al.2001; Lanz et al. 2009; Legreid et al. 2008; Lugauer et al.1998; Pandey Deolal et al. 2013; Seibert et al. 1998; Tuz-son et al. 2011). The Po Basin is a densely populated andhighly industrialized region located immediately adjacentto the Alps that is known to have a relatively high levelof air pollution. Emissions transported from the PoBasin have been observed at ARO (Campana et al.2005), CMN (Bonasoni et al. 1997; Cristofanelli andBonason 2009), SNB (Seibert et al. 1998), and JFJ (Lanzet al. 2009; Seibert et al. 1998). By using trajectory-basedmethods, Kaiser et al. (2007) showed potential source re-gions of air pollutants and air flow regimes connectedwith pollution events at ZUG, SNB, JFJ, and KVV. Theydetermined that the influence of emissions from the PoBasin was strongest in the west Alps (JFJ), whereas theinfluence of emissions from Eastern Europe was stron-gest at SNB. In another study, the influences of meteoro-logical processes on the regional transport to JFJ weresubdivided into two categories: thermally driven
Okamoto and Tanimoto Progress in Earth and Planetary Science (2016) 3:34 Page 29 of 52

transport, which occurs on a local scale, and transport atregional (foehn) or synoptic (front) scales (Forrer et al.2000). Thermally induced processes were observedmainly in spring and summer, and processes at the re-gional and synoptic scales were observed during the en-tire year. Continuous measurements of the total andbackward scattering coefficients, absorption coefficient,condensation nuclei concentrations, epiphaniometersignals, total suspended particulate matter (TSP) massconcentrations, and major PM1 and TSP compounds atJFJ have shown distinct seasonal cycles with a summermaximum and a winter minimum (Baltensperger et al.1997; Cozic et al. 2008; Henning et al. 2003; Lugauer etal. 1998; Nyeki et al. 1998a, b). The seasonal cycles ofSO4
2−, NO3−, and NH4
+ of aerosols at SNB also showed asummer maximum and a winter minimum (Kasper andPuxbaum 1998). During winter, JFJ and SNB are influ-enced mainly by the clean FT, resulting in low concen-trations of most aerosol components. Higher massconcentrations have been found during summer when con-vection occasionally transports polluted air masses to JFJand SNB. At different non-urban sites located along awest–east transect in Europe including SNB, Oliveira et al.(2007) showed year-round variations of lipophilic particu-late organic compounds emitted from vehicle exhaustconstituents, meat smoke tracers, phytosterols of higherphotosynthetic plants, and wood smoke components. Theydetermined that the concentrations at SNB maximized dur-ing summer, whereas an absence of seasonal variation wasobserved at the oceanic site. At ARO, the O3 concentra-tions were found to depend significantly on the residencetimes of air masses over the polluted region of Europe dur-ing spring and summer (Pochanart et al. 2001). An increasein O3 concentrations has been observed in the aged airmasses, which is the result of direct photochemical accu-mulation of O3 when the air masses pass over large-scaleanthropogenically influenced regions in Europe. Southfoehn is a typical Alpine meteorological phenomenon char-acterized by south to north advection and is caused by astrong pressure gradient across the Alps that leads to a de-scending air stream northward (Seibert 1990). Campanaet al. (2005) observed enhanced O3 concentrations duringsouth foehn events during spring and summer at ARO. Inthe case of the south foehn, the continental-scale influenceof pollutant emissions on O3 appeared to be far less import-ant than the direct influence of the Po Basin emissions. Themain sources of NOx and CO are air masses with long resi-dence times over the European continent (Kaiser et al.2007). Kaiser et al. (2007) showed the differences betweenthe main NOx source regions, including northwest Europeand the region covering East Germany, the Czech Republic,and southeast Poland, and the main CO source regions in-cluding the central, northeastern, and eastern parts ofEurope. The statistics for O3 concentrations show strong
seasonal effects. Near-ground air masses are poor (rich) inO3 in winter (summer). The main source of high O3 con-centrations in winter is air masses that subside from higherelevations. During summer, the Mediterranean constitutesan important additional source of high O3 concentrations,particularly for air masses that have crossed the Po Basin.The transport of polluted air masses from Europe and othercontinents can exert an influence on southern Europe andthe Mediterranean basin. In particular, anthropogenic pol-lutants emitted from continental Europe are transported to-ward southern Europe and the Mediterranean basin duringsummer (e.g., Duncan et al. 2008; Henne et al. 2005). Basedon modeled CO concentrations, Folini et al. (2009) quanti-fied the regions of influence (ROIs) of 13 European ruralbackground and high-altitude stations including SNB,CMN, ZUG/ZSF, and JFJ. The ROI definition of a measure-ment site is the area near the station from which surfaceemissions contribute substantially to the short-term variabil-ity of the measured trace gas concentrations. Folini et al.(2009) defined an individual site as one that roughly coversa circular area of 400 km in radius and said that large citiesor other strong emission sources within 100 km from thesite should be avoided. The seasonal cycle of BC at CMNwas characterized by the presence of a winter minimum(December–January) and maxima in spring (April–May)and late summer (August–September), reflecting a higherefficiency of uplift during warmer months and the subse-quent transport of polluted air masses from the boundarylayer. In addition, a secondary minimum was observed inJune, when wet deposition is expected to peak owing tomaximum rainfall (Cristofanelli et al. 2013). They indicatedthat CMN was affected by air masses rich in anthropogenicCO during spring and summer. In addition, Cristofanelli etal. (2013) identified three main regimes of the seasonalcorrelation among CO, O3, and BC at CMN: negativecorrelation between CO and O3 during the period fromOctober to December, significant positive correlation be-tween CO and O3 during the period from May toSeptember, and almost no correlation between CO and O3
and BC enhancements mainly associated with relatively oldanthropogenic emissions during the period from January toApril. They considered it likely that the negative correlationbetween O3 and CO was attributed to the combinedprocesses concurrent in enhanced O3 with low CO (i.e.,STE) and O3 titration with NO in polluted air masses alongwith low photochemical activity. The seasonal cycle of O3 atKSL in the Caucasus, as well as at other stations in the Alps,showed a broad spring–summer maximum. Although theaforementioned stations are under the effects of Europeanemissions, particularly from Po Basin, KSL is influenced bysemi-polluted air masses from the regions of the northernCaspian, southern Urals, and Volga, which causes photo-chemical O3 production in these air masses, therebyresulting in seasonal O3 maxima (Tarasova et al. 2003).
Okamoto and Tanimoto Progress in Earth and Planetary Science (2016) 3:34 Page 30 of 52

Biomass burningBiomass burning is a significant global source of gaseousand particulate species emissions to the troposphere.Emissions from biomass burning are known to be animportant source of GHGs and chemically active gaseson regional and global scales (e.g., Andreae and Merlet2001). Interannual variations in biomass burning can bedramatic, depending on natural and socioeconomic fac-tors such as rainfall and political incentives to clear land.In some regions of the world, biomass burning occursthroughout the year, even though on the global scale itusually peaks in March and again in September (Duncanet al. 2003). The peak in December to April during thedry season in the Northern Hemisphere is predominatelyassociated with burning in the tropical regions of NorthAfrica and Southeast Asia, with much smaller contribu-tions from Central America and Mexico and northernSouth America. The peak in August to October duringthe Southern Hemisphere dry season is associated withburning in South Africa and Brazil, with smaller contri-butions from Indonesia and Malaysia. Although theIndonesia and Malaysia region straddles the equator, theburning season generally occurs in the latter half of theyear. Figure 9 shows a schematic overview of the long-range transport of trace gases and aerosols emitted frombiomass-burning sources.MKN is rarely influenced directly by African biomass
burning emissions, which are most prominent in the westernpart of the continent. Henne et al. (2008) attributed theboreal summer maximum of CO at MKN to advection ofSouthern Hemispheric air loaded with emissions from bio-mass burning in South Africa. They analyzed fire counts andfire radiative power (FRP) recorded by Moderate ResolutionImaging Spectroradiometer (MODIS) sensors and concludedthat the interannual variability of this summer maximumcould be mostly explained by a combination of changes intransport patterns and biomass burning intensity.Biomass burning is a seasonally important source of
emissions in Central Europe (Lanz et al. 2010). Cristofa-nelli et al. (2009b) identified the transport of a biomass-burning plume with mineral dust from North Africa bymeans of air mass circulation analysis and aerosol chem-ical characterization. Cristofanelli et al. (2013) determinedthat biomass-burning effects on CMN were maximizedduring the warm months from July to September. More-over, they analyzed the source regions of biomass burningevents by using FLEXPART and identified transport at thelocal scale in the central Alps, North Africa, southernItaly, and Greece; that at the regional scale in Russia; andthat at the global scale in North America and westernequatorial Africa.CO and BC influences from Siberian boreal forest fires
have been observed at HPO (Kato et al. 2002; Liu et al.2013; Pochanart et al. 2004), and aerosol influences have
been observed at FWS (Kaneyasu et al. 2007). It is con-sidered likely that biomass burning contributed to themass concentration of BC values at HPO, particularly inspring (Liu et al. 2013). An increase in the observedmass concentration of BC values in April and May 2008suggested substantial effects of very active biomassburning in Siberia. Wang et al. (2006) investigated theinfluence of biomass burning activities on the levels oftrace gases at WLG. They concluded that forest fires incentral Asia affected WLG observations during spring.In contrast, in eastern Siberia, forest fires occurredmainly during summer, and those air masses were rarelytransported to WLG.LLN has been influenced by Southeast Asian biomass
burning activities in spring (Chang et al. 2013; Chen etal. 2013; Chi et al. 2010; Lee et al. 2011; Lin et al. 2010;Ou Yang et al. 2012, 2014; Sheu et al. 2010). Spring isthe major biomass-burning season in the Indochina Pen-insula (Streets et al. 2003). Lee et al. (2011) determinedthat PM2.5 at LLN was highest during the biomass-burning season, particularly in March. They also con-cluded, based on back trajectory analysis, that the ob-served high PM2.5 levels were attributed mainly to thebiomass-burning events. Backward trajectory analysis byLin et al. (2010) showed that most air masses observed byLLN originated from India, the Indochina Peninsula, andsouthern coastal China, which together accounted for85 % of the total trajectory. A different transport mechan-ism that favors CO transport from Indochina to thedownwind Taiwan area was identified via a Weather Re-search and Forecasting (WRF) meteorological modelsimulation (Cheng et al. 2013). The results indicated theformation of a thermal forcing-induced low-pressure sys-tem in Indochina and that the high terrain located in thenorthern part of Southeast Asia further forced the upliftof biomass-burning emissions. Contrastingly, a sufficientlystrong northeasterly monsoonal flow intruding intoIndochina would hinder the development of the thermallow and would weaken the upward movement, whichwould, in turn, prevent the transport of biomass-burningemissions from Indochina to the Taiwan area. During thedry period of the year, the biomass burning in Sumatranormally begins around May and lasts until September orOctober. The mass concentration of PM10 at TAR in thestudy of Streets et al. (2003) showed a cycle similar to thatof O3, with two minima in March or April and Novemberor December, and a maximum during the summer mon-soon, thereby indicating that the O3 and PM10 precursorshad a common source. Toh et al. (2013) showed that thetransport of air pollutants from biomass burning inSumatra released large amounts of precursors and led toincreases in O3 and PM10.Occasionally, MLO has been influenced by biomass
burning plumes transported from Southeast Asia and
Okamoto and Tanimoto Progress in Earth and Planetary Science (2016) 3:34 Page 31 of 52

the Indian subcontinent across the Pacific (Karl et al.2003), and from North America (Perry et al. 1999). Karlet al. (2003) measured the levels of methanol (CH3OH),acetonitrile (CH3CN), acetone (C3H6O), C5H8, methylvinyl ketone (MVK), and methacrolein (MACR) inspring 2001 and found high correlations among CO,C3H6O, and CH3CN during the event.WHI has been influenced by regional biomass burn-
ing, particularly in northern California, Oregon, Alaska,and Yukon Territory (Macdonald et al. 2011; McKendryet al. 2010, 2011). MBO has also experienced numerousevents associated with biomass-burning emission origin-ating from Alaska (Weiss-Penzias et al. 2007) and thenorthwestern USA including California and Oregon(Finley et al. 2009; Primbs et al. 2008a, b; Weiss-Penziaset al. 2007). In July and August 2008, two regionalbiomass-burning events induced increases of CO and O3
concentrations at both WHI and MBO (McKendry et al.2011). Takahama et al. (2011) analyzed the organic func-tional groups of aerosols collected during thosebiomass-burning periods and showed a large contribu-tion of ketones, at 26 % on average, to the organic aero-sol mass in addition to sharp peaks of ketones attributedto plant wax. Macdonald et al. (2011) examined the in-fluence of different transport and source regions on theO3 and CO concentrations at WHI. They noted little dif-ference between trans-Pacific air masses and the cleanbackground in summer. The air masses from NorthAmerica showed the greatest increases in O3 and COconcentrations above the background values duringyears when the largest areas of western North Americaarea burned. Finley et al. (2009) reported that regionalwildfire events produced larger enhancement of CO(ΔCO), aerosol scatter coefficient (Δσsp), and NOy(ΔNOy) values than the Asian long-range transportevents due to the significantly shorter transport timesfrom source to receptor, which meant less plume dilu-tion, photochemical removal, and wet particle depos-ition. Jaffe et al. (2008) showed that the area of summerburning in the western USA was significantly correlatedwith daytime summer O3 concentrations at LAV andYEL, which indicates that the presence of fire played animportant role in increasing the summer O3 in the west-ern USA. Chalbot et al. (2013) indicated that regionalfire incidents might trigger high O3 episodes. They esti-mated a 3 ppb increase in the MDA8 O3 concentrationat CHA in Arizona by such incidents within 400 km ofthe sites. McKendry et al. (2010) emphasized the import-ance of permanent lidar installations in mountainous lo-cations for understanding the vertical transport processand the analysis of the chemical time series.In past decades, significant intercontinental transport
of air masses containing abundant biomass burningemissions from North America to Europe and the North
Atlantic have been reported in many studies. Emissiontransport from North American and Siberian boreal wildfires has substantially affected the concentrations oftrace gases at PMO (Helmig et al. 2008; Honrath et al.2004; Lapina et al. 2008; Pfister et al. 2006; Val Martínet al. 2006; Val Martin et al. 2008a, b). The NOx/COemission ratio is related to the relative amounts ofsmoldering and flaming combustion because CO con-centrations typically show maxima during smolderingcombustion while NOx concentrations show maximaduring flaming combustion (Lobert et al. 1991). TheNOx/CO emission ratios from boreal fires had highervalues in early summer and lower values in late summer,which is consistent with the smoldering combustionvariation (Lapina et al. 2008). Lapina et al. (2008) sug-gested that this change in fuel properties affects the re-sults for the O3 production rate in model calculationsbecause it impacts the relative properties of the speciesreleased from fires and an increase in the overall fuelconsumption. During summer 2004, extensive wildfiresin Alaska and western Canada released large amounts oftrace gases and aerosols into the atmosphere. For ex-ample, CO emitted from mid-June to August was in theorder of anthropogenic CO emissions for the entire con-tinental USA during the same period (Pfister et al. 2005;Turquety et al. 2007). Intense boreal wildfires plumeswere observed at PMO during the InternationalConsortium for Atmospheric Research on Transportand Transformation (ICARTT) study (Pfister et al. 2006;Val Martín et al. 2006). This long-range transport ofboreal wildfire emissions resulted in large enhancementsof CO, BC, NOy, and NOx (Val Martín et al. 2006).Emissions from these wildfires frequently affected PMOdownwind 6 to 15 days later. The enhancement ratiosrelative to CO were variable in the plumes sampled dueto variations in wildfire emissions and removal processesduring transport. Analyses of ΔBC/ΔCO, ΔNOy/ΔCO,and ΔNOx/ΔCO ratios indicated that NOy and BC were,on average, efficiently exported in these plumes, andsuggested that the decomposition of PAN to NOx was asignificant source of NOx. High levels of NOx suggestedthe continuing formation of O3 in these well-agedplumes. Pfister et al. (2006) simulated the O3 productionfrom boreal forest fires based on a case study of wildfiresin Alaska and Canada in summer 2004 by using a chem-istry transport model, the Model for O3 and RelatedChemical Tracers (MOZART-4). Their results indicatethat fires in the boreal region could have a significantimpact on the O3 production over large parts of theNorthern Hemisphere.
Dust and volcanic emissionsEvery year, massive amounts of mineral dust are upliftedinto the atmosphere (1950 to 2400 Tg year−1; Ginoux
Okamoto and Tanimoto Progress in Earth and Planetary Science (2016) 3:34 Page 32 of 52

et al. 2004). The desert region of North Africa (65 % ofthe global dust emissions) is the largest source of soildust suspended in the atmosphere while Asia’s desertsare the second largest source (25 %). Saharan dust hassignificant climatic and environmental impacts in theNorth Atlantic and in Europe (Fig. 9). Mineral dust istransported from North Africa along three pathways:westward across the Atlantic to the Americas, northwardacross the eastern Mediterranean to Europe, andeastward across the eastern Mediterranean to the MiddleEast and Asia (Middleton and Goudie 2001). Saharandust events have often been observed at IZO (Alastueyet al. 2005; Arimoto et al. 1995; Díaz et al. 2006; Kandleret al. 2007; Maring et al. 2000; Rodríguez et al. 2011;Salisbury et al. 2006; Schmitt and Volz-Thomas 1997;Smirnov et al. 1998), CMN (Bonasoni et al. 1997, 2004;Cristofanelli and Bonason 2009; Cristofanelli et al.2009b; de Reus et al. 2005; Gobbi et al. 2003; Hanke etal. 2003; Marenco et al. 2006; Putaud et al. 2004; VanDingenen et al. 2005), and JFJ (Chou et al. 2011; CollaudCoen et al. 2004; Cozic et al. 2008; Fierz-Schmidhauseret al. 2010; Nyeki et al. 1998b; Schwikowski et al. 1995;Zieger et al. 2012). Furthermore, long-range transport ofSaharan dust over a pathway spanning from Asia and thePacific to western North America has been identified atWHI by McKendry et al. (2007).Mineral dust affects the gas phase chemistry in the
troposphere by providing a reactive surface that is ableto support heterogeneous trace gas reactions (e.g., Usheret al. 2003). Hanisch and Crowley (2003) investigatedthe heterogeneous reaction between O3 and Saharandust surfaces in a Knudsen reactor and observed the de-struction of O3 on the dust surface and the formation ofO2. The phenomena of low O3 and high dust concentra-tions have been observed in the field (e.g., Bonasoniet al. 1997; Prospero et al. 1995). As part of the MineralDust and Tropospheric Chemistry (MINATROC)project, which was an intensive field measurementcampaign conducted at CMN from June 1 to July 5,2000 (Balkanski et al. 2003; Bauer et al. 2004; Bonasoniet al. 2004; de Reus et al. 2005; Fischer et al. 2003; Gobbiet al. 2003; Hanke et al. 2003; Putaud et al. 2004; VanDingenen et al. 2005) and at IZO from July 15 to August15, 2002 (de Reus et al. 2005; Salisbury et al. 2006;Umann et al. 2005). Their aim was to fully characterizegas and aerosol species with a complete set of measure-ments in order to identify the heterogeneous reactionsof dust. Bonasoni et al. (2004) showed that the O3
concentrations during the dust events at CMN were 4 to21 % lower than the de-trended monthly mean dusttransport values, thus suggesting that Saharan dust has asubstantial influence on the O3 levels, even in a pollutedregion of Southern Europe. During the Saharan dustadvection period, mixing of fine particles from
anthropogenic particles and coarse particles from theSaharan region was observed at CMN (Putaud et al.2004). Putaud et al. (2004) suggested that NO3
− wasshifted toward the aerosol super-μm fraction in thepresence of dust. Hanke et al. (2003) and Umann et al.(2005) observed an efficient uptake of gaseous HNO3 bymineral dust aerosol particles, thereby suggesting thatmineral dust might be a significant sink for HNO3 in thetroposphere. Hence, it could affect the photochemicalcycles and O3 production. Bauer et al (2004) estimatedthe impact of heterogeneous chemical reactions at thesurface of mineral dust on global O3 chemistry using aglobal general circulation model, coupled online withatmospheric chemistry and mineral aerosol modules thatwere evaluated based on observational data during theMINATROC campaign. The model simulated a decreasein global tropospheric O3 mass by ~5 % due to heteroge-neous reactions, and implied that the most importantheterogeneous reaction was the uptake of HNO3 on thedust surface. Salisbury et al. (2006) observed the concen-trations of the organic compounds CO, CH3OH, formal-dehyde (HCHO), acetaldehyde (CH3CHO), C3H6O, C3H8,C5H8, and toluene (C6H5CH3) under both normal condi-tions and during large dust storms, in order to investigatethe effects of mineral dust on oxygenated organic species.However, no clear production for CH3CHO or HCHO ondust particles was ascertained. By using the Module Effi-ciency Calculating the Chemistry of the Atmosphere(MECCA) chemistry box model, de Reus et al. (2005) con-cluded that the reduced ROx and NOx concentrations inthe Saharan dust plume contributed to a reduced net O3
production rate, which likely explains the observed rela-tively low O3 concentrations.After reaching CMN, Saharan dust plumes often move
farther northward and eastward to eventually reachnorthern Italy, the Alps, and central Europe. At JFJ,Saharan dust events have been detected as a pronouncedchange in aerosol properties compared with the back-ground conditions (Chou et al. 2011; Collaud Coen et al.2004; Cozic et al. 2008; Fierz-Schmidhauser et al. 2010;Nyeki et al. 1998b; Schwikowski et al. 1995; Zieger et al.2012). Collaud Coen et al. (2004) summarized theannual distribution of Saharan dust events in Europe,the Mediterranean basin, West Africa, and over theAtlantic Ocean and explained that Saharan dust eventsfrequently occurred during spring and less frequently inJuly and August. Figure 10a shows the seasonal vari-ation of Ca2+ (a component of mineral dust) concen-tration in total suspended particles (TSP) at JFJ.Associated with relatively large monthly variabilitycaused by occasional intense events, seasonal varia-tions are not very distinct. However, the annual max-imum is seen in February (~0.10 μg m−3) associatedwith large variability.
Okamoto and Tanimoto Progress in Earth and Planetary Science (2016) 3:34 Page 33 of 52

Asian dust particles known collectively as “Kosa” aregenerated when the surface soil particles in the arid andsemi-arid regions of inland Asia (such as Taklamakanand Gobi deserts) are lifted by the winds and trans-ported over long distances by strong westerly winds.Intense Asian dust events are observed each spring inChina, Korea, Japan, and even occasionally in Hawaiiand North America (Fig. 9). This phenomenon normallyoccurs in spring. Weak dust layers occur in the FT overJapan during periods with no evident dust outbreaks oreven in seasons other than spring (e.g., Iwasaka et al.1983). Asian dust events have been observed at FWS(Suzuki et al. 2008, 2010), MLO (Bodhaine 1995; Clarkeand Charlson 1985; Darzi and Winchester 1982; Holmesand Zoller 1996; Hyslop et al. 2013; Parrington et al.1983; Parrington and Zoller 1984; Perry et al. 1999;VanCuren and Cahill 2002; Zieman et al. 1995), LAV(Jaffe et al. 2003b; Liu et al. 2003a; VanCuren 2003;VanCuren and Cahill 2002; VanCuren et al. 2005), andWHI (Leaitch et al. 2009; McKendry et al. 2008). Adistinct seasonal cycle with a spring maximum of Ca2+
concentration can be seen at HPO (~0.25 μg m−3;Fig. 10b) and MLO (~0.05 μg m−3; Fig. 10c). At LAV,two peaks can be seen in spring (~0.05 μg m−3) andsummer (Fig. 10d). The concentrations at two
IMPROVE stations (MLO and LAV) and at HPO weredetermined by PM2.5 and TSP analyses, respectively.VanCuren and Cahill (2002) found that the tropical windbands were displaced to the south of Hawaii and thatstrong westerly circulation can reach the islands todeliver Asian aerosols, particularly at MLO from Decemberto May. Other studies have reported that in January orFebruary, many elements associated with continental crustexperienced an increase in the mass of samples. Theaerosol concentration of crustal elements remained ele-vated until June or July, suggesting that the dust season isfrom late winter to mid-summer (Parrington et al. 1983;Zieman et al. 1995). VanCuren et al. (2005) concluded thatAsian aerosols influence LAV throughout spring, summer,and fall.Mineral dust is a major component of PM10 observed
at PYR by Decesari et al. (2010). They suggested that theincrease in mineral components in the pre-monsoonseason is due mainly to an increase in the backgroundconcentration. This increase is likely related to changesin their long-range transport from the arid regions ofwestern India, possibly to upwind regions such as theArabian deserts. Aerosols at MAB are dominated bymineral dust (Kumar and Sarin 2009, 2010; Ram et al.2008; Rastogi and Sarin 2005). Kumar and Sarin (2009)
Fig. 10 Seasonal variations in Ca2+ concentrations at four mountain stations. The lines with circles denote the average observed Ca2+ concentrationsduring a particular period. The years in parenthesis denote the averaging period. The red shaded bands and error bars denote the standard deviations.The concentrations of Ca2+ in TSP were measured at JFJ (a) and HPO (b) and those in PM2.5 were measured at MLO (c) and LAV (d)
Okamoto and Tanimoto Progress in Earth and Planetary Science (2016) 3:34 Page 34 of 52

showed that the mass concentration of PM10–2.5 at MABis influenced by the uniform contribution of dust (60 to80 %) throughout the year. The predominant of sourcesof MAB are the Thar and Arabian deserts during sum-mer months and the Indo–Gangetic Plain during wintermonths (Kumar and Sarin 2009).Volcanic emissions such as ash clouds, aerosols, and
volcanic gases often affect local or regional air quality(e.g., Huebert et al. 2001). Furthermore, the volcanicaerosols released by explosive eruption affect the strato-spheric aerosol layer (Deshler 2008), which is importantfor radiation (e.g., Solomon et al. 2011) and atmosphericchemistry, particularly O3 depletion (e.g., Solomon1999). In the later part of the twentieth century, the sig-natures of major volcanic eruptions such as El Chichónin 1982 and Mt. Pinatubo in 1991 were identified in thetotal O3 records at ISK (Visheratin et al. 2006) and ARO(Rieder et al. 2010a, b) and in the total column NO2
records at JFJ (De Mazière et al. 1998). The oxidizingcapacity of the troposphere can also be affected becausethe amount of UV radiation reaching the tropospheredecreases due to the enhanced stratospheric aerosolsand SO2. Bândă et al. (2015) showed that the sulfuremissions from Pinatubo significantly affected the CH4
budget using a 3D global chemistry model.In spring 2010, eruptions of Eyjafjallajökull volcano
(63.63° N, 19.62° W) in Iceland had a major impact onaviation because ash from the April–May summiteruption was transported with northwesterly winds to-ward Europe and the North Atlantic. The volcanicplume resulting from that eruption was observed atCMN (Sandrini et al. 2014), KVV (Beeston et al. 2012),ZSF (Flentje et al. 2010; Schäfer et al. 2011), and JFJ(Bukowiecki et al. 2011). Moreover, enhanced PM10 andSO2 concentrations were observed at ZSF and JFJ.Monthly mean SO2 concentrations in the spring of 2010at JFJ were higher than those in other years (Fig. 11a).These observations suggest that the large volcaniceruption had a significant impact on the sulfur cycle ona regional scale.
On July 8, 2000, Miyake-jima volcano (34.09° N,139.53° E), located in the northwest Pacific Ocean, beganto erupt. In winter, volcanic emissions were transportedsoutheastward to the Pacific Ocean due to the pre-vailing northwesterly wind, while in summer volcanicemissions were transported southwestward to Japan,Korea, and Taiwan due to the subtropical high-pressure system (Kajino et al. 2004). At FWS, Naoe etal. (2003) showed that the large fraction of the SO4
2−
concentrations in aerosols was most likely producedin the volcanic plume from Miyake-jima. At HPO,aerosols, precipitation, and gaseous pollutants includ-ing O3, SO2, NO, and NO2 were observed prior to theeruption, and short-term aerosol sampling was con-ducted by Satsumabayashi et al. (2004). They reportedunchanged O3 levels, a fourfold enhancement of SO2
concentration, and increased SO42− and NH4
+ levels inaerosols following the eruption. When the volcanicplume was transported directly, the atmospheric SO2
and SO42− concentrations in the aerosols increased
simultaneously, and the NO3− and chlorine (Cl−) con-
centrations decreased. Monthly mean SO2 concentra-tions at HPO for the period from the summer of 2000to the spring of 2001 were higher than those in otheryears (Fig. 11b). Kajino et al. (2005) quantitativelyestimated the indirect acidification of nonvolcanicNO3
− and Cl− as a result of the increase in SO42− aero-
sol concentration from the eruption. They concludedthat the contribution of indirect acidification couldnot be negligible and that this effect should be consid-ered in general air pollution because SO2 emissionscould be expected to continue increasing—especiallyin Asia.
Recommendations for future atmospheric monitoringThis paper has provided a comprehensive review on theseasonal and long-term variations and long-range trans-ports of tropospheric O3 and its precursors based onpast observations made at mountain sites. The main
Fig. 11 Seasonal variations in SO2 concentrations at two mountain stations. The thick and thin lines with circles denote the monthly average SO2
in the year of the volcanic eruption and in the pre- and post-eruption years, respectively. The eruptions of Eyjafjallajökull volcano and Miyake-jimavolcano occurred in 2010 (a) and in 2000 (b), respectively
Okamoto and Tanimoto Progress in Earth and Planetary Science (2016) 3:34 Page 35 of 52

recommendations for future atmospheric monitoring aresummarized as follows:
1) Expanding the continuous measurements of tracespecies other than O3 at high-altitude stations.
The observed species and temporal coverage differamong stations and research programs for which indi-vidual stations are operated. For example, O3 and COdata are available, even though the data of other compo-nents are limited. Continuous measurements of NOx
and NMHCs are carried out mainly in Europe. For ex-ample, the number and mass concentrations, AOD, andvisibility of aerosols have been reported extensively, butobservations of their chemical properties are currentlylimited to high-altitude stations. Because of this bias inobservations of aerosol parameters at high-altitudestations, it is still unfeasible to provide a regionallyconsistent summary on their long-term trends andseasonal variations. Accordingly, observations of tracespecies and parameters ancillary to tropospheric O3 suchas NOx, SO2, NMHCs, and aerosols should be increased inthe future.
2) Expanding the global atmospheric observationalcapability through the establishment of high-altitudestations.
The geographical locations of the current high-altitudestations are not well distributed across the globe. Manyare located in the northern mid-latitudes includingNorth America, Europe, and Asia, and several are lo-cated in Africa. In contrast, few stations are located inSiberia, in spite of the importance of its role. In theSouthern Hemisphere, there are severe data limitationsbecause only a few sites are located in South America;and none are located in Oceania regions. Recently, twonew stations were established in the South Hemisphere.One is located on Mt. Mäido, Réunion Island, which is avolcanic island located in the southwestern part of theIndian Ocean (Baray et al. 2013). The second is locatedin a high-altitude basin known as the Altiplano, Bolivia(Rose et al. 2015). Sofen et al. (2016) indicated that thecurrent monitoring network of surface O3 (includinglow-altitude stations) is insufficient for measurements inkey regions (China, India, Amazon, Africa, tropicaloceans, and Southern Ocean) and suggested theestablishment of 20 possible sites (10 island and 10continental). A strategy should be implemented tofacilitate observations of key species in areas in whichfew observatories are located. It should also be notedthat continuous observational data at mountain sites areuseful for checking the consistency between sondes andregular aircraft, which cannot perform continuous
ambient sampling (Tanimoto et al. 2015), when makingglobally consistent datasets for tropospheric species suchas tropospheric O3.
3) Building an objective and homogenous classificationfor assessment of the spatial representativeness ofspecific pollutants.
Remote mountainous sites are important because theyare designed to provide representative data on continen-tal to hemispheric scales and data for the lower FT.However, except for some European stations, most siteshave never been assessed. In general, chemical specieswith strong surface sources or sinks, and with shortatmospheric lifetimes due to photochemistry anddeposition, show stronger spatial variability. Therefore,these species have smaller areas of representativenessthan species with weak surface fluxes and long lifetimes.It is beneficial for any analysis, such as validation of sat-ellite data, comparison of model outputs, and evaluationof long-term trends to consider the representativeness ofatmospheric observational data.
4) Building a filtering method that can be applied to theobservational data at baseline sites in the same way.
Filtered data are the most ideal for the analysis oflong-term changes. Depending on the purpose, differentfiltering methods should be applied. For the estimationof “background” concentrations, the influences of localpollution (e.g., buoyant upslope flow) and long-rangetransport should be excluded, while for the estimation of“baseline” concentrations, only local pollution should beexcluded. In most cases, unfiltered data have been usedfor trend analysis on regional or global scales because itis difficult to make determinations on baseline concen-trations at individual stations (e.g., Logan et al. 2012;Parrish et al. 2012). The specifications of each observa-tional site should be determined before handling thedata, which primarily represent the regional and inter-continental scale concentrations. For example, Loganet al. (2012) confirmed that local influence was not ofgreat concern for their analysis based on the amplitudesof diurnal variation and comparison to ozone sondedata. Meanwhile, Parrish et al. (2012) showed that thelong-term trends derived from the unfiltered data weresimilar to those from filtered data analyzed by differentmethods at seven elevated sites including JFJ, ZUG/ZSF,and LAV, even though the trend for unfiltered data wasdifferent from that for filtered data at Mace Head, whichreceives air masses recirculated from the local continent.As the influences of local pollution levels were negligible,these two studies examined the trends for baseline concen-trations. However, this does not mean that filtering is
Okamoto and Tanimoto Progress in Earth and Planetary Science (2016) 3:34 Page 36 of 52

unnecessary. Calculated trends for CO at JFJ for the periodfrom 1996 to 2007 were different between background data(−2.65 ± 0.04 ppb year−1; Zellweger et al. 2009) and unfil-tered data (−3.36 ± 1.08 ppb year−1; Gilge et al. 2010).It is important to consider all of the above recommen-
dations because observational data at remote sites cancontribute to improvements in satellite observations,model simulations, and emission inventories. Observa-tions at mountain sites have often been used for com-parison with the outputs of global and regionalchemistry-transport models when evaluating their per-formance levels. This tests our understanding of keyprocesses and mechanisms in the troposphere such asthe long-range transport of dust and biomass burningfrom the source regions, photochemistry in the FT, andthe budget of reactive species. Although chemistry-transport models are useful for obtaining a better under-standing of the mechanisms causing spatiotemporal vari-ations in trace gases and aerosols, and for deriving theirglobal/regional budget and assessing the impacts to hu-man health and ecosystems, the current models stillhave limitations (e.g., Fiore et al. 2014). Disagreementsbetween observation and model results might lead toimprovements in existing models, although such guid-ance remains unclear. In addition, the role of mountain-based observations in filling the gap between the viewsfrom the ground and those from space should be en-hanced in the future. Satellite observations have emergedas a useful technique for the long-term monitoring oftropospheric compositions of species such as O3, CO,and NO2 (e.g., Chehade et al. 2014; van der A et al.2008; Worden et al. 2013). Its capability to make reliableobservations in the FT has been demonstrated over thelast decades. The spatial and temporal resolution of satel-lite observations has been improved in recent years, andthe number of observable species has increased from basicchemical species such as O3 and CO to other minor butimportant species such as NO2, HCHO, and CH3CN(Streets et al. 2013). It is important to expand themountain-based platforms in a systematic manner to com-plement satellite observations, and thus to improve our un-derstanding of the chemistry and dynamics in the FT.The greatest advantage of models and satellite observa-
tions is their global coverage. However, this fact does notnecessarily indicate a lack of interest in mountain-basedobservations. Indeed, observations in mountainous re-gions have several advantages. The uncertainty is signifi-cantly lower for in situ observations at mountainous sitesthan that for satellites. In addition, mountain-based obser-vations have the capability to observe multiple compo-nents simultaneously with a higher time-resolution than ispossible by satellites, and in most cases, those measure-ments are continuous. This advantage enables the captur-ing of occasional events as well as climatological features,
which helps us to examine the chemical and physicalprocesses in greater detail. Moreover, direct sampling forthe analysis of ultra-trace components such as isotopes ispossible at mountainous sites. Therefore, even though it isdifficult to construct, operate, and maintain stations on re-mote mountains, the assistance they provide in tacklingthe above issues makes the effort and expense worthwhile.
ConclusionsHerein, we summarized the findings from past and on-going field measurements and analyses of atmosphericconstituents conducted at mountainous sites across theglobe. Observations at mountain-based stations couldprovide representative data at continental to hemisphericscales and the lower FT. Many species in the FT havelonger lifetimes than those in the PBL due to the lowertemperatures and the lack of deposition in the FT. Inaddition, most of the transport of chemical specieswithin the atmosphere occurs in the FT. The combin-ation of long-range transport and longer chemical life-times indicate that the chemistry of the FT is importantin determining the chemical compositions of regions re-mote from pollutant source regions. We identified ob-servations at 31 mountain stations on the continents ofEurope, North and South America, Eurasia, and Africaand islands in the Pacific, Indian, and Atlantic Oceans.These stations were selected because of their reliableobservational data and because many previous studieshave utilized these data. Furthermore, we adopted thestations located in regions in which few atmospheric ob-servations have been conducted thus far, thereby cover-ing the entire world, except for the Antarctic and theArctic regions. Particular emphasis was placed on react-ive species including tropospheric O3 and its precursorssuch as CO, NOx, NOy, and NMHCs.Numerous studies have shown that the tropospheric
O3 maximum occurs during spring in wide regionsacross the mid-latitudes in the Northern Hemisphere,including the remote islands in the North Pacific andNorth Atlantic Oceans. The seasonal cycle of O3 atEuropean stations has a minimum in winter and a broadmaximum in spring–summer that represents a combin-ation of a spring maximum with a secondary maximumin summer. This broad summer maximum is caused byenhanced regional pollution in Europe. Largely influ-enced by the Asian monsoon, the seasonal cycle of O3 inthe margin of East Asia and Himalayan region has adeep minimum in summer. In contrast, surface O3 overthe Qinghai–Tibetan Plateau and central Asia exhibits asummertime maximum. In North America, the seasonalcycle of O3 shows a broad spring–summer peak or twopeaks in spring and summer. The seasonal cycle of O3 inAfrica shows a minimum in boreal autumn and a broadmaximum in boreal summer. In the Northern Hemisphere,
Okamoto and Tanimoto Progress in Earth and Planetary Science (2016) 3:34 Page 37 of 52
the mean concentration of O3 and the amplitude of theseasonal cycle depend on latitude, with larger values athigher latitudes. The mean concentrations are ~50 ppb inEurope and 30 to 45 ppb in Africa. The tropical sites differfrom other mid-latitude sites, with small variability shownover the course of the year. The seasonal amplitudes in EastAsia and South Asia are substantially larger than thosefound at other stations, likely due to the intense photo-chemical production in spring and the Asian monsooninfluence in summer.In the Northern Hemisphere, the seasonal maximum
and minimum for CO occur in late winter–early springand in summer, respectively. The summer CO minimumis caused by the maximum occurrence of OH radicals,which are the main sink for CO in the troposphere. TheCO maximum in late winter–early spring reflects thecombined effects of the minimum in OH radical concen-tration and the enhancement of winter CO emissions.The maximum and minimum concentrations of CO andthe amplitude of the CO seasonal cycle depend onlatitude, with lower values found at higher altitudes. Thisindicates that the emission sources for CO are located atthe ground surface. The means are between 120 and180 ppb in Europe and Asia and 100 ppb in Africa. Themaxima in East Asia are higher than those at other sitesowing to intense springtime air pollution. The seasonalamplitude at the 15 stations falls into the range of 85 to180 ppb, except for LLN in Taiwan. This large seasonalamplitude for CO can be attributed to the combination ofa high spring maximum and summer low, at ~215 ppb,caused by the effect of the Asian monsoon and biomassburning activity in Southeast Asia.Unlike O3 and CO, NMHCs, NOx, and NOy have only
been observed continuously at very few stations. The sea-sonal cycles of C2H6, C2H2, C3H8, and C6H6 in theNorthern Hemisphere generally show a maximum in win-ter and a minimum in summer owing to reaction with theOH radical. The seasonal cycle at MKN in the equatorialregion shows a different cycle with two minima and twomaxima corresponding with the climate pattern in equa-torial East Africa induced by the displacement of theITCZ. Although NMHC concentration ratios are usefulindicators of the degree of photochemical processing oraging (e.g., Helmig et al. 2008), such studies have beenrarely conducted at mountainous sites. Generally, theamplitudes of the seasonal cycles of C2H6 and C3H8 de-pend on the latitude, with smaller amplitudes at thelower-latitude sites and higher amplitudes at the higher-latitude sites. The annual maximum concentrations ofC2H6 and C3H8 at higher-altitude stations are higher thanthose at lower-altitude stations within each latitudinalband.NOy measurements show a broad spring and summer
maximum, whereas NOx shows a minimum during these
seasons at SNB, ZUG, and JFJ. The seasonal cycle ofNOy at HPO show a spring and early summer max-imum. The NOx and NOy concentrations are low onremote islands such as IZO and MLO. At MLO, theseasonal cycle of both NOx and NOy shows a springmaximum, but their concentrations are fairly invariantover the year, which implies that the partitioning ofNOy is almost steady state. NOx observations at PMOexhibit a distinct seasonal cycle from July to Octoberthat is larger than those in other months, while NOy
observations exhibit a distinct seasonal cycle which islarger from June to September than from Novemberto March, primarily due to boreal forest wildfires andmore efficient export and transport from easternNorth America. Despite the importance of the photo-chemistry of tropospheric O3, continuous measurementsof these species, which are precursors and by-products of O3 photochemistry at high-altitude sta-tions, are very limited.The observations at European stations in the 1990s
show increases in tropospheric O3. The O3 concentrationsat these stations peak in the late 1990s or early 2000sbefore exhibiting a decreasing trend. The long-term trendsfor surface O3 observed at SNB, ZUG/ZSF, and JFJ are0.22 ± 0.17 ppb year−1 (1989–2007), 0.42 ± 0.09 ppb year−1
(1975–2007), and 0.26 ± 0.16 ppb year−1 (1986–2007),respectively. The mean rate of O3 decrease at theseven European alpine sites including SNB, ZUG/ZSF,and JFJ for the period from 2000 to 2009 is −0.16 ±0.14 ppb year−1. In the North Atlantic, the surface O3
record at IZO shows a slightly positive trend with arate of 0.09 ± 0.02 ppb year−1 for the period from1988 to 2009. In particular, a rapid increase is foundbetween 1996 and 1998 that coincides with the phaseshift of the NAO. In East Asia, a positive trend ofsurface O3 at 0.25 ± 0.17 ppb year−1 is observed atWLG for the period from 1994 to 2013. Of particularnote, the strongest increase is found in autumn. HPOin Japan experiences a generally large increase inspring O3 of ~1 ppb year−1 for the period from 1998to 2006. In the western USA, the mean spring O3 atMBO shows a significant increase of 0.73 ±0.54 ppb year−1 for the period from 2004 to 2013. AtHPO and MBO, which are significantly influenced byEast Asian outflow in spring, larger increasing trendsin the levels of O3 occur in higher percentiles than inlower percentile levels.In the Northern Hemisphere, the CO levels ob-
served at mountainous sites increase from the 1950suntil the 1980s, and then decrease beginning in thelate 1980s. The decreasing rate of the global mean COconcentrations was estimated to be −0.52 ±0.10 ppb year−1 for the period from 1991 to 2001.The trend for CO at JFJ for the period from 1996 to
Okamoto and Tanimoto Progress in Earth and Planetary Science (2016) 3:34 Page 38 of 52

2007 is about −3 ppb year−1. At MBO in the westernUSA, the mean spring CO shows a significant de-crease for the period from 2004 to 2013, whereas theannual average CO did not show a significant trend.This result is consistent with satellite observations oftotal column CO, which show a continued decreasingtrend from 2000 through 2011 in the NorthernHemisphere.There are few long-term measurements of NOy and
NOx at high-altitude stations. In European countries,NOx emissions declined significantly in the early1990s due to the mandated installation of catalyticconverters in vehicles and other emission reductionmeasures. For the period from 1998 to 2002, thetrend in NOy was positive but not significant, whereasin the period 2004 to 2009, a significant decreasingtendency was observed at a rate of −0.048 ±0.012 ppb year−1. The overall annual averages of O3
and NOy were the highest in 2003, which was thehottest year in recorded European history due to anexceptional prolonged summer heat wave.
List of stationsARO, ArosaASK, AssekremCHA, Chiricahua National MonumentCMN, Monte CimoneFWS, Mt. FujiGRB, Great Basin National ParkHPO, Mt. HappoISK, Issyk-KulIZO, IzãnaJFJ, JungfraujochKSL, KislovodskKVV, KrvavecLAV, Lassen Volcanic National ParkLLN, LulinLQO, La Quiaca ObservatorioMAB, Mt. AbuMBO, Mt. Bachelor ObservatoryMDY, MondyMKN, Mt. KenyaMLO, Mauna LoaNWR, Niwot RidgePMO, Pico Mountain ObservatoryPYR, Nepal Climate Observatory–PyramidSNB, SonnblickTAR, Tanah RataWHI, Whistler MountainWLG, Mt. WalliguanYEL, Yellowstone National ParkYOS, Yosemite National ParkZSF, Zugspitze–SchneefernerhausZUG, Zugspitze–Gipfel
AbbreviationsABC: Atmospheric brown cloud; ACE-2: Second Aerosol CharacterizationExperiment; AEMET: Agencia Estatal de Meteorología; CASTNET: Clean Air Statusand Trends Network; CLRTAP: Convention on Long-Range Transboundary AirPollution; CMA: China Meteorological Administration; CONTRACE: ConvectiveTransport of Trace Gases into the Middle and Upper Troposphere over Europe;DWD: German Weather Service (Deutscher Wetterdienst); EANET: AcidDeposition Monitoring Network in East Asia; ECMWF: European Centre forMedium-Range Weather Forecasts; EMEP: European Monitoring and EvaluationProgramme; Empa: Swiss Federal Laboratories for Materials Science andTechnology; EPA: US Environmental Protection Agency; ESRL: Earth SystemResearch Laboratory; Ev-K2-CNR: Everest-K2 National Research Council;FOEN: Swiss Federal Office for the Environment; FREETEX: Free TroposphericExperiments; GAW: Global Atmosphere Watch; GMD: Global MonitoringDivision; HIS: Hydrometeorological Institute of Slovenia; ICARTT: InternationalConsortium for Atmospheric Research on Transport and Transformation;IFA: Oboukhov Institute of Atmospheric Physics; IMPROVE: InteragencyMonitoring of Protected Visual Environments; INTEX-B: IntercontinentalChemical Transport Experiment Phase B; ISAC-CNR: Institute of AtmosphericSciences and Climate of the National Research Council of Italy; JMA: JapanMeteorological Agency; KMD: Kenya Meteorological Department; LTER: Long-Term Ecological Research; MINATROC: Mineral Dust and TroposphericChemistry; MLOPEX: Mauna Loa Observatory Photochemistry Experiment;MMD: Malaysian Meteorological Department; MOE: Ministry of the Environment(Japan); MONARPOP: Monitoring Network in the Alpine Region for Persistentand Other Organic Pollutants; NABEL: Swiss National Air Pollution MonitoringNetwork; NCU: National Central University; NOAA: National Oceanic andAtmospheric Administration; NPS: National Park Service; ONM: DéportentMétéorologique Régional Sud of the Office National de la Météorologie;PSI: Paul Scherrer Institute; SHARE: Stations at High Altitude for Research on theEnvironment; SMNA: Servicio Meteorológico Nacional; TCCON: Total ColumnCarbon Observation Network; UBA: Federal Environmental Agency(Umweltbundesamt); UNEP: United Nations Environmental Programme; WACS2010: Whistler Aerosol and Cloud Study 2010; WDCGG: World Data Centre forGreenhouse Gases; WMO: World Meteorological Organization
AcknowledgementsThe authors thank the Acid Deposition Monitoring Network in East Asia (EANET,http://www.eanet.asia/), EBAS (http://ebas.nilu.no), the US Environmental ProtectionAgency Clean Air Markets Division Clean Air Status and Trends Network (CASTNET,http://www.epa.gov/castnet), the Interagency Monitoring of Protected VisualEnvironments (IMPROVE, http://vista.cira.colostate.edu/improve/), and the WorldData Centre for Greenhouse Gases (WDCGG, http://ds.data.jma.go.jp/gmd/wdcgg/)for providing the observational data. The Office National de la Météorologie (ONM),Algeria and the Earth System Research Laboratory, NOAA (NOAA/ESRL) providedthe Assekrem data. The Kenya Meteorological Department (KMD) provided the Mt.Kenya data. The Izana Atmospheric Research Center, Meteorological State Agencyof Spain (AEMET) provided the Izaña data. The China Meteorological Administration(CMA) and NOAA/ESRL provided the Mt. Waliguan data. The Kyrgyz NationalUniversity (KSNU) provided the Issyk-Kul data. The National Research Council,Institute of Atmospheric Sciences and Climate (ISAC) in collaboration withDepartment of Pure and Applied Science, University of Urbino, provided thePyramid and Monte Cimone data. Prof. Neng-Huei Lin at the National CentralUniversity, which is managed by the Taiwan Environmental ProtectionAdministration, provided the Lulin data. EANET provided the Mondy data. Dr.Manish Naja at the Aryabhatta Research Institute for Observational Sciences andDr. Shyam Lal at the Physical Research Laboratory provided the Mt. Abu data. Dr.Shungo Kato at Tokyo Metropolitan University and EANET provided the Mt.Happo data. The National Weather Service (SMNA) provided the La QuiacaObservatorio data. Environment and Climate Change Canada provided theWhistler Mountain data. Dr. Dan Jaffe at the University of Washington providedthe Mt. Bachelor Observatory data. NOAA/ESRL provided the Niwot Ridge andMauna Loa data. CASTNET and IMPROVE provided the Chiricahua NM, Great BasinNP, Lassen Volcanic NP, Yellowstone NP, and Yosemite NP data. The MalaysianMeteorological Department (MMD) provided the Tanah Rata data. The EnvironmentAgency Austria provided the Sonnblick data. The Federal Environmental AgencyGermany provided the Zugspitze data. The Slovenian Environment Agency (ARSO)provided the Krvavec data. Swiss Federal Laboratories for Materials Testing andResearch (Empa) and the Laboratory of Atmospheric Chemistry of the PaulScherrer Institute (PSI) provided the Jungfraujoch data. The data at PicoMountain Observatory were collected in a collaboration among Michigan
Okamoto and Tanimoto Progress in Earth and Planetary Science (2016) 3:34 Page 39 of 52

Technological University, the University of Colorado and NOAA/ESRL. The NMHCsampling at Assekrem, Mt. Kenya, Izaña, and Mauna Loa is a component of theNOAA Global Greenhouse Gas Reference Network, with NMHC in the collectedwhole air samples being analyzed by the Institute of Arctic and Alpine Researchat the University of Colorado. The authors also thank Dr. Edit Nagy-Tanaka, Dr.Hajime Akimoto of the National Institute of Environmental Studies (NIES), alongwith the editor and anonymous reviewers for providing valuable comments.
FundingNot applicable.
Authors’ contributionsSO reviewed the literature data and conducted the experimental study.SO and HT proposed the topic, conceived, and then designed the study.Both authors have read and approved the final manuscript.
Competing interestsThe authors declare that they have no competing interests.
Received: 20 November 2015 Accepted: 6 October 2016
ReferencesAcid Deposition Monitoring Network in East Asia (EANET). http://www.eanet.asia/.
Accessed 15 Jan 2016Ahlm L, Shakya KM, Russell LM, Schroder JC, Wong JPS, Sjostedt SJ, Hayden KL,
Liggio J, Wentzell JJB, Wiebe HA, Mihele C, Leaitch WR, Macdonald AM(2013) Temperature-dependent accumulation mode particle and cloudnuclei concentrations from biogenic sources during WACS 2010. AtmosChem Phys 13:3393–3407. doi:10.5194/acp-13-3393-2013
Alastuey A, Querol X, Castillo S, Escudero M, Avila A, Cuevas E, Torres C, RomeroP-M, Exposito F, García O, Diaz JP, Van Dingenen R, Putaud JP (2005)Characterisation of TSP and PM2.5 at Izaña and Sta. Cruz de Tenerife (CanaryIslands, Spain) during a Saharan Dust Episode (July 2002). Atmos Environ39:4715–4728. doi:10.1016/j.atmosenv.2005.04.018
Ambrose JL, Reidmiller DR, Jaffe DA (2011) Causes of high O3 in the lower freetroposphere over the Pacific Northwest as observed at the Mt. BachelorObservatory. Atmos Environ 45:5302–5315. doi:10.1016/j.atmosenv.2011.06.056
Andreae MO, Merlet P (2001) Emission of trace gases and aerosols from biomassburning. Glob Biogeochem Cycles 15:955–966. doi:10.1029/2000GB001382
Andrews E, Ogren JA, Bonasoni P, Marinoni A, Cuevas E, Rodríguez S, Sun JY, JaffeDA, Fischer EV, Baltensperger U, Weingartner E, Collaud Coen M, Sharma S,Macdonald AM, Leaitch WR, Lin N-H, Laj P, Arsov T, Kalapov I, Jefferson A,Sheridan P (2011) Climatology of aerosol radiative properties in the freetroposphere. Atmos Res 102:365–393. doi:10.1016/j.atmosres.2011.08.017
Angelbratt J, Mellqvist J, Blumenstock T, Borsdorff T, Brohede S, Duchatelet P,Forster F, Hase F, Mahieu E, Murtagh D, Petersen AK, Schneider M, SussmannR, Urban J (2011a) A new method to detect long term trends of methane(CH4) and nitrous oxide (N2O) total columns measured within the NDACCground-based high resolution solar FTIR network. Atmos Chem Phys11:6167–6183. doi:10.5194/acp-11-6167-2011
Angelbratt J, Mellqvist J, Simpson D, Jonson JE, Blumenstock T, Borsdorff T,Duchatelet P, Forster F, Hase F, Mahieu E, De Mazière M, Notholt J, Petersen AK,Raffalski U, Servais C, Sussmann R, Warneke T, Vigouroux C (2011b) Carbonmonoxide (CO) and ethane (C2H6) trends from ground-based solar FTIRmeasurements at six European stations, comparison and sensitivity analysis withthe EMEP model. Atmos Chem Phys 11:9253-9269. doi:10.5194/acp-11-9253-2011
Aref’ev VN, Semenov VK (1994) Spectral transparency of the atmosphere in thecenter of the European-Asian continent. Atmos Environ 28:997–999.doi:10.1016/1352-2310(94)90259-3
Aref’ev VN, Kamenogradskiy NY, Semyonov VK, Sinyakov VP (1995) Ozone andnitrogen dioxide in the atmosphere above the Northern Tien Shan. IzvAtmos Ocean Phys 31:15–20
Aref’ev VN, Kashin FV, Krasnosel’tsev AV, Semenov VK, Sinyakov VP (2008) Structure of timevariations in the atmospheric transparency in Central Eurasia (Issyk Kul monitoringstation). Izv Atmos Ocean Phys 44:615–620. doi:10.1134/S0001433808050071
Aref’ev VN, Kashin FV, Semenov VK, Sinyakov VP (2009) Variations in nitrogendioxide in the atmosphere over central Eurasia (Issyk Kul monitoring station).Izv Atmos Ocean Phys 45:575–582. doi:10.1134/S0001433809050053
Aref’ev VN, Kashin FV, Orozaliev MD, Sizov NI, Sinyakov VP, Sorokina LI (2013)Structure of carbon monoxide time variations in the atmospheric thickness
over central Eurasia (Issyk Kul monitoring station). Izv Atmos Ocean Phys49:148–153. doi:10.1134/S0001433813020047
Arimoto R, Duce RA, Ray BJ, Ellis WG Jr, Cullen JD, Merrill JT (1995) Traceelements in the atmosphere over the North Atlantic. J Geophys Res100:1199–1213. doi:10.1029/94JD02618
Armerding W, Comes FJ, Crawack HJ, Forberich O, Gold G, Ruger C, Spiekermann M,Walter J, Cuevas E, Redondas A, Schmitt R, Matuska P (1997) Testing the daytimeoxidizing capacity of the troposphere: 1994 OH field campaign at the Izañaobservatory, Tenerife. J Geophys Res 102:10603–10611. doi:10.1029/96JD03714
Assonov SS, Brenninkmeijer CAM, Schuck TJ, Taylor P (2010) Analysis of 13C and18O isotope data of CO2 in CARIBIC aircraft samples as tracers of uppertroposphere/lower stratosphere mixing and the global carbon cycle. AtmosChem Phys 10:8575–8599. doi:10.5194/acp-10-8575-2010
Atkinson R (2000) Atmospheric chemistry of VOCs and NOx. Atmos Environ34:2063–2101. doi:10.1016/s1352-2310(99)00460-4
Atkinson R, Arey J (2003) Atmospheric degradation of volatile organic compounds.Chem Rev 103:4605–4638. doi:10.1021/cr0206420
Atlas E, Ridley B, Walega J, Greenberg J, Kok G, Staffelbach T, Schauffler S, Lind J,Hübler G, Norton R, PEM-West Science Team GTE, Dlugokeneky E, Elkins J,Oltmans S, Mackay G, Karecki D (1996) A comparison of aircraft and ground-based measurements at Mauna Loa Observatory, Hawaii, during GTE PEM-Westand MLOPEX 2. J Geophys Res 101:14599–14612. doi:10.1029/96JD00213
Balkanski Y, Bauer SE, Van Dingenen R, Bonasoni P, Schultz M, Fischer H, GobbiGP, Hanke M, Hauglustaine D, Putaud JP, Stohl A, Raes F (2003) The MtCimone, Italy, free tropospheric campaign: principal characteristics of thegaseous and aerosol composition from European pollution, Mediterraneaninfluences and during African dust events. Atmos Chem Phys Discuss3:1753–1776. doi:10.5194/acpd-3-1753-2003
Baltensperger U, Gäggeler HW, Jost DT, Lugauer M, Schwikowski M, WeingartnerE, Seibert P (1997) Aerosol climatology at the high-alpine site Jungfraujoch,Switzerland. J Geophys Res 102:19707–19715. doi:10.1029/97JD00928
Balzani Lööv JM, Henne S, Legreid G, Staehelin J, Reimann S, Prévôt ASH,Steinbacher M, Vollmer MK (2008) Estimation of background concentrationsof trace gases at the Swiss Alpine site Jungfraujoch (3580 m asl). J GeophysRes 113:D22305. doi:10.1029/2007JD009751
Bândă N, Krol M, van Noije T, van Weele M, Williams JE, Le Sager P, Niemeier U,Thomason L, Röckmann T (2015) The effect of stratospheric sulfur fromMount Pinatubo on tropospheric oxidizing capacity and methane. J GeophysRes 120:1202–1220. doi:10.1002/2014JD022137
Baray J-L, Courcoux Y, Keckhut P, Portafaix T, Tulet P, Cammas J-P, HauchecorneA, Godin Beekmann S, De Mazière M, Hermans C, Desmet F, Sellegri K,Colomb A, Ramonet M, Sciare J, Vuillemin C, Hoareau C, Dionisi D, Duflot V,Vérèmes H, Porteneuve J, Gabarrot F, Gaudo T, Metzger J-M, Payen G, Leclairde Bellevue J, Barthe C, Posny F, Ricaud P, Abchiche A et al (2013) Maïdoobservatory: a new high-altitude station facility at Reunion Island (21°S, 55°E)for long-term atmospheric remote sensing and in situ measurements. AtmosMeas Tech 6:2865–2877. doi:10.5194/amt-6-2865-2013
Barret B, De Mazière M, Demoulin P (2002) Retrieval and characterization ofozone profiles from solar infrared spectra at the Jungfraujoch. J Geophys Res107:4788. doi:10.1029/2001JD001298
Barret B, De Mazière M, Demoulin P (2003a) Correction to “Retrieval andcharacterization of ozone profiles from solar infrared spectra at theJungfraujoch.” J Geophys Res 108:4372. doi:10.1029/2003JD003809
Barret B, De Mazière M, Mahieu E (2003b) Ground-based FTIR measurements of COfrom the Jungfraujoch: characterisation and comparison with in situ surface andMOPITT data. Atmos Chem Phys 3:2217-2223. doi:10.5194/acp-3-2217-2003
Bauer SE, Balkanski Y, Schulz M, Hauglustaine DA, Dentener F (2004) Globalmodeling of heterogeneous chemistry on mineral aerosol surfaces: influenceon tropospheric ozone chemistry and comparison to observations.J Geophys Res 109:D02304. doi:10.1029/2003JD003868
Beeston M, Grgić I, van Elteren JT, Iskra I, Kapun G, Močnik G (2012) Chemical andmorphological characterization of aerosol particles at Mt. Krvavec, Slovenia,during the Eyjafjallajökull Icelandic volcanic eruption. Environ Sci Pollut Res19:235–243. doi:10.1007/s11356-011-0563-8
Bey I, Jacob DJ, Logan JA, Yantosca RM (2001) Asian chemical outflow to the Pacificin spring: Origins, pathways, and budgets. J Geophys Res 106:23097–23113.doi:10.1029/2001JD000806
Bianchi F, Tröstl J, Junninen H, Frege C, Henne S, Hoyle CR, Molteni U, Herrmann E,Adamov A, Bukowiecki N, Chen X, Duplissy J, Gysel M, Hutterli M, KangasluomaJ, Kontkanen J, Kürten A, Manninen HE, Münch S, Peräkylä O, Petäjä T, Rondo L,Williamson C, Weingartner E, Curtius J, Worsnop DR, Kulmala M, Dommen J,
Okamoto and Tanimoto Progress in Earth and Planetary Science (2016) 3:34 Page 40 of 52

Baltensperger U (2016) New particle formation in the free troposphere: aquestion of chemistry and timing. Science 26. doi:10.1126/science.aad5456.
Bodhaine BA (1995) Aerosol absorption measurements at Barrow, Mauna Loa andthe south pole. J Geophys Res 100:8967–8975. doi:10.1029/95JD00513
Bollasina M, Bertolani L, Tartari G (2002) Meteorological observations at high altitudein the Khumbu Valley, Nepal Himalayas, 1994-1999. Bull Glaciol Res 19:1–11
Bonasoni P, Calzolari F, Colombo T, Corazza E, Santaguida R, Tesi G (1997)Continuous CO and H2 measurements at Mt. Cimone (Italy): preliminaryresults. Atmos Environ 31:959–967. doi:10.1016/S1352-2310(96)00259-2
Bonasoni P, Evangelisti F, Bonafe U, Ravegnani F, Calzolari F, Stohl A, Tositti L,Tubertini O, Colombo T (2000a) Stratospheric ozone intrusion episodesrecorded at Mt. Cimone during the VOTALP project: case studies. AtmosEnviron 34:1355-1365. doi:10.1016/S1352-2310(99)00280-0
Bonasoni P, Stohl A, Cristofanelli P, Calzolari F, Colombo T, Evangelisti F (2000b)Background ozone variations at Mt. Cimone Station. Atmos Environ34:5183-5189. doi:10.1016/S1352-2310(00)00268-5
Bonasoni P, Cristofanelli P, Calzolari F, Bonafè U, Evangelisti F, Stohl A, Zauli Sajani S, vanDingenen R, Colombo T, Balkanski Y (2004) Aerosol-ozone correlations during dusttransport episodes. Atmos Chem Phys 4:1201–1215. doi:10.5194/acp-4-1201-2004
Bonasoni P, Laj P, Angelini F, Arduini J, Bonafè U, Calzolari F, Cristofanelli P,Decesari S, Facchini MC, Fuzzi S, Gobbi GP, Maione M, Marinoni A, Petzold A,Roccato F, Roger JC, Sellegri K, Sprenger M, Venzac H, Verza GP, Villani P,Vuillermoz E (2008) The ABC-Pyramid Atmospheric Research Observatory inHimalaya for aerosol, ozone and halocarbon measurements. Sci Total Environ391:252–261. doi:10.1016/j.scitotenv.2007.10.024
Bonasoni P, Laj P, Marinoni A, Sprenger M, Angelini F, Arduini J, Bonafè U,Calzolari F, Colombo T, Decesari S, Di Biagio C, di Sarra AG, Evangelisti F,Duchi R, Facchini MC, Fuzzi S, Gobbi GP, Maione M, Panday A, Roccato F,Sellegri K, Venzac H, Verza GP, Villani P, Vuillermoz E, Cristofanelli P (2010)Atmospheric Brown Clouds in the Himalayas: first two years of continuousobservations at the Nepal Climate Observatory-Pyramid (5079 m). AtmosChem Phys 10:7515–7531. doi:10.5194/acp-10-7515-2010
Bond TC, Bhardwaj E, Dong R, Jogani R, Jung S, Roden C, Streets DG, TrautmannNM (2007) Historical emissions of black and organic carbon aerosol fromenergy-related combustion, 1850-2000. Glob Biogeochem Cycles 21:GB2018.doi:10.1029/2006GB002840
Bowman KW, Shindell DT, Worden HM, Lamarque JF, Young PJ, Stevenson DS, Qu Z, dela Torre M, Bergmann D, Cameron-Smith PJ, Collins WJ, Doherty R, Dalsøren SB,Faluvegi G, Folberth G, Horowitz LW, Josse BM, Lee YH, MacKenzie IA, Myhre G,Nagashima T, Naik V, Plummer DA, Rumbold ST, Skeie RB, Strode SA, Sudo K, SzopaS, Voulgarakis A, Zeng G et al (2013) Evaluation of ACCMIP outgoing longwaveradiation from tropospheric ozone using TES satellite observations. Atmos ChemPhys 13:4057–4072. doi:10.5194/acp-13-4057-2013
Bracci A, Cristofanelli P, Sprenger M, Bonafé U, Calzolari F, Duchi R, Laj P,Marinoni A, Roccato F, Vuillermoz E, Bonasoni P (2012) Transport ofstratospheric air masses to the Nepal Climate Observatory-Pyramid (Himalaya;5079 m MSL): a synoptic-scale investigation. J Appl Meteorol 51:1489–1507.doi:10.1175/jamc-d-11-0154.1
Brasseur GP, Hauglustaine DA, Walters S (1996) Chemical compounds in theremote Pacific troposphere: comparison between MLOPEX measurementsand chemical transport model calculations. J Geophys Res 101:14795–14813.doi:10.1029/95JD03520
Brönnimann S, Buchmann B, Wanner H (2002) Trends in near-surface ozoneconcentrations in Switzerland: the 1990s. Atmos Environ 36:2841–2852.doi:10.1016/S1352-2310(02)00145-0
Brönnimann S, Cain JC, Staehelin J, Farmer SFG (2003) Total ozone observationsprior to the IGY. II: data and quality. Q J R Meteorol Soc 129:2819–2843.doi:10.1256/qj.02.145
Bukowiecki N, Zieger P, Weingartner E, Jurányi Z, Gysel M, Neininger B, SchneiderB, Hueglin C, Ulrich A, Wichser A, Henne S, Brunner D, Kaegi R, SchwikowskiM, Tobler L, Wienhold FG, Engel I, Buchmann B, Peter T, Baltensperger U(2011) Ground-based and airborne in-situ measurements of theEyjafjallajökull volcanic aerosol plume in Switzerland in spring 2010. AtmosChem Phys 11:10011–10030. doi:10.5194/acp-11-10011-2011
Bukowiecki N, Weingartner E, Gysel M, Collaud Coen M, Zieger P, Herrmann E,Steinbacher M, Gäggeler HW, Baltensperger U (2016) A review of more than20 years of aerosol observation at the High Altitude Research StationJungfraujoch, Switzerland (3580 m asl). Aerosol Air Qual Res 16:764–788.doi:10.4209/aaqr.2015.05.0305
Calvert JG (1990) Glossary of atmospheric chemistry terms. Pure Appl Chem62:2167–2219. doi:10.1351/pac199062112167
Campana M, Li Y, Staehelin J, Prevot ASH, Bonasoni P, Loetscher H, Peter T (2005)The influence of south foehn on the ozone mixing ratios at the high alpinesite Arosa. Atmos Environ 39:2945–2955. doi:10.1016/j.atmosenv.2005.01.037
Carslaw N, Plane JMC, Coe H, Cuevas E (1997) Observations of the nitrate radicalin the free troposphere at Izaña de Tenerife. J Geophys Res 102:10613–10622.doi:10.1029/96JD03512
Chalbot M-C, Kavouras IG, Dubois DW (2013) Assessment of the contribution ofwildfires to ozone concentrations in the central US-Mexico border region.Aerosol Air Qual Res 13:1–11. doi:10.4209/aaqr.2012.08.0232
Chameides W, Walker JCG (1973) A photochemical theory of tropospheric ozone.J Geophys Res 78:8751–8760. doi:10.1029/JC078i036p08751
Chang YS, Carmichael GR, Kurita H, Ueda H (1989) The transport and formationof photochemical oxidants in central Japan. Atmos Environ 23:363–393.doi:10.1016/0004-6981(89)90584-2
Chang S-S, Lee W-J, Wang L-C, Lin N-H, Chang-Chien G-P (2013) Influence of theSoutheast Asian biomass burnings on the atmospheric persistent organicpollutants observed at near sources and receptor site. Atmos Environ78:184–194. doi:10.1016/j.atmosenv.2012.07.074
Chehade W, Weber M, Burrows JP (2014) Total ozone trends and variabilityduring 1979-2012 from merged data sets of various satellites. Atmos ChemPhys 14:7059–7074. doi:10.5194/acp-14-7059-2014
Chen S-C, Hsu S-C, Tsai C-J, Chou CC-K, Lin N-H, Lee C-T, Roam G-D, Pui DYH (2013)Dynamic variations of ultrafine, fine and coarse particles at the Lu-Lin backgroundsite in East Asia. Atmos Environ 78:154–162. doi:10.1016/j.atmosenv.2012.05.029
Cheng H, Zhang G, Jiang JX, Li X, Liu X, Li J, Zhao Y (2007) Organochlorinepesticides, polybrominated biphenyl ethers and lead isotopes during thespring time at the Waliguan Baseline Observatory, northwest China:implication for long-range atmospheric transport. Atmos Environ 41:4734–4747.doi:10.1016/j.atmosenv.2007.03.023
Cheng F-Y, Yang Z-M, Ou-Yang C-F, Ngan F (2013) A numerical study of thedependence of long-range transport of CO to a mountain station in Taiwanon synoptic weather patterns during the Southeast Asia biomass-burningseason. Atmos Environ 78:277–290. doi:10.1016/j.atmosenv.2013.03.020
Chevalier A, Gheusi F, Delmas R, Ordóñez C, Sarrat C, Zbinden R, Thouret V,Athier G, Cousin J-M (2007) Influence of altitude on ozone levels andvariability in the lower troposphere: a ground-based study for westernEurope over the period 2001–2004. Atmos Chem Phys 7:4311–4326.doi:10.5194/acp-7-4311-2007
Chi KH, Lin C-Y, Ou Yang C-F, Wang J-L, Lin N-H, Sheu G-R, Lee C-T (2010) PCDD/F measurement at a high-altitude station in central Taiwan: evaluation oflong-range transport of PCDD/Fs during the Southeast Asia biomass burningevent. Environ Sci Technol 44:2954–2960. doi:10.1021/es1000984
Chiapello I, Prospero JM, Herman JR, Hsu NC (1999) Detection of mineral dustover the North Atlantic Ocean and Africa with the Nimbus 7 TOMS. JGeophys Res 104:9277–9291. doi:10.1029/1998JD200083
Chou C, Stetzer O, Weingartner E, Jurányi Z, Kanji ZA, Lohmann U (2011) Icenuclei properties within a Saharan dust event at the Jungfraujoch in theSwiss Alps. Atmos Chem Phys 11:4725–4738. doi:10.5194/acp-11-4725-2011
Clarke AD, Charlson RJ (1985) Radiative properties of the background aerosol: absorptioncomponent of extinction. Science 229:263–265. doi:10.1126/science.229.4710.263
Collaud Coen M, Weingartner E, Schaub D, Hueglin C, Corrigan C, Schwikowski M,Baltensperger U (2004) Saharan dust events at the Jungfraujoch: detection bywavelength dependence of the single scattering albedo and first climatologyanalysis. Atmos Chem Phys 4:2465–2480. doi:10.5194/acp-4-2465-2004
Collaud Coen M, Weingartner E, Nyeki S, Cozic J, Henning S, Verheggen B, Gehrig R,Baltensperger U (2007) Long-term trend analysis of aerosol variables at the high-alpine site Jungfraujoch. J Geophys Res 112:D13213. doi:10.1029/2006JD007995
Collaud Coen M, Weingartner E, Furger M, Nyeki S, Prévôt ASH, Steinbacher M,Baltensperger U (2011) Aerosol climatology and planetary boundaryinfluence at the Jungfraujoch analyzed by synoptic weather types. AtmosChem Phys 11:5931–5944. doi:10.5194/acp-11-5931-2011
Collaud Coen M, Andrews E, Asmi A, Baltensperger U, Bukowiecki N, Day D,Fiebig M, Fjaeraa AM, Flentje H, Hyvärinen A, Jefferson A, Jennings SG,Kouvarakis G, Lihavainen H, Lund Myhre C, Malm WC, Mihapopoulos N,Molenar JV, O’Dowd C, Ogren JA, Schichtel BA, Sheridan P, Virkkula A,Weingartner E, Weller R, Laj P (2013) Aerosol decadal trends-Part 1: in-situoptical measurements at GAW and IMPROVE stations. Atmos Chem Phys13:869–894. doi:10.5194/acp-13-869-2013
Comes FJ, Armerding W, Spiekermann M, Walter J, Rüger C (1995) Pointmeasurements of tropospheric trace gases at Tenerife by a laser absorptiontechnique. Atmos Environ 29:169–174. doi:10.1016/1352-2310(94)00254-I
Okamoto and Tanimoto Progress in Earth and Planetary Science (2016) 3:34 Page 41 of 52

Comes FJ, Forberich O, Walter J (1997) OH field measurements: a critical inputinto model calculations on atmospheric chemistry. J Atmos Sci 54:1886–1894.doi:10.1175/1520-0469(1997)054<1886:OFMACI>2.0.CO;2
Cooper OR, Forster C, Parrish D, Trainer M, Dunlea E, Ryerson T, Hüber G,Fehsenfeld F, Nicks D, Holloway J, de Gouw J, Warneke C, Roberts JM, FlockeF, Moody J (2004) A case study transpacific warm conveyor belt transport:Influence of merging airstreams on trace gas import to North America. JGeophys Res 109:D23S08. doi:10.1029/2003JD003624
Cooper OR, Parrish DD, Ziemke J, Balashov NV, Cupeiro M, Galbally IE, Gilge S,Horowitz L, Jensen NR, Lamarque J-F, Naik V, Oltmans SJ, Schwab J, ShindellDT, Thompson AM, Thouret V, Wang Y, Zbinden RM (2014) Globaldistribution and trends of tropospheric ozone: an observation-based review.Elem Sci Anth 2:000029–28. doi:10.12952/journal.elementa.000029
Cozic J, Verheggen B, Weingartner E, Crosier J, Bower KN, Flynn M, Coe H,Henning S, Steinbacher M, Henne S, Collaud Coen M, Petzold A,Baltensperger U (2008) Chemical composition of free tropospheric aerosolfor PM1 and coarse mode at the high alpine site Jungfraujoch. Atmos ChemPhys 8:407–423. doi:10.5194/acp-8-407-2008
Cristofanelli P, Bonasoni P (2009) Background ozone in the southern Europe andMediterranean area: influence of the transport processes. Environ Pollut157:1399–1406. doi:10.1016/j.envpol.2008.09.017
Cristofanelli P, Bonasoni P, Tositti L, Bonafè U, Calzolari F, Evangelisti F, Sandrini S,Stohl A (2006) A 6-year analysis of stratospheric intrusions and their influenceon ozone at Mt. Cimone (2165 m above sea level). J Geophys Res 111:D03306.doi:10.1029/2005JD006553
Cristofanelli P, Bonasoni P, Bonafé U, Calzolari F, Duchi R, Marinoni A, Roccato F,Vuillermoz E, Sprenger M (2009a) Influence of lower stratosphere/uppertroposphere transport events on surface ozone at the Everest-PyramidGAW Station (Nepal): first year of analysis. Int J Remote Sens 30:4083-4097.doi:10.1080/01431160902821940
Cristofanelli P, Marinoni A, Arduini J, Bonafè U, Calzolari F, Colombo T, Decesari S,Duchi R, Facchini MC, Fierli F, Finessi E, Maione M, Chiari M, Calzolari F,Messina P, Orlandi E, Roccato F, Bonasoni P (2009b) Significant variations oftrace gas composition and aerosol properties at Mt. Cimone during air masstransport from North Africa—contributions from wildfire emissions andmineral dust. Atmos Chem Phys 9:4603-4619. doi:10.5194/acp-9-4603-2009
Cristofanelli P, Fierli F, Marinoni A, Calzolari F, Duchi R, Burkhart J, Stohl A, Maione M,Arduini J, Bonasoni P (2013) Influence of biomass burning and anthropogenicemissions on ozone, carbon monoxide and black carbon at the Mt. CimoneGAW-WMO global station (Italy, 2165 m a.s.l.). Atmos Chem Phys 13:15–30.doi:10.5194/acp-13-15-2013
Cristofanelli P, Scheel H-E, Steinbacher M, Saliba M, Azzopardi F, Ellul R, Fröhlich M,Tositti L, Brattich E, Maione M, Calzolari F, Duchi R, Landi TC, Marinoni A,Bonasoni P (2015) Long-term surface ozone variability at Mt. Cimone WMO/GAW global station (2165 m a.s.l., Italy). Atmos Environ 101:23–33. doi:10.1016/j.atmosenv.2014.11.012
Crutzen P (1974) A review of upper atmospheric photochemistry. Can J Chem52:1569–1581. doi:10.1016/S0140-6736(00)88507-4
Cuevas E, González Y, Rodríguez S, Guerra JC, Gómez-Peláez AJ, Alonso-Pérez S,Bustos J, Milford C (2013) Assessment of atmospheric processes drivingozone variations in the subtropical North Atlantic free troposphere. AtmosChem Phys 13:1973–1998. doi:10.5194/acp-13-1973-2013
Cui J, Sprenger M, Staehelin J, Siegrist A, Kunz M, Henne S, Steinbacher M (2009)Impact of stratospheric intrusions and intercontinental transport on ozone atJungfraujoch in 2005: comparison and validation of two Lagrangianapproaches. Atmos Chem Phys 9:3371–3383. doi:10.5194/acp-9-3371-2009
Cui J, Pandey Deolal S, Sprenger M, Henne S, Staehelin J, Steinbacher M, NédélecP (2011) Free tropospheric ozone changes over Europe as observed atJungfraujoch (1990-2008): an analysis based on backward trajectories. JGeophys Res 116:D10304. doi:10.1029/2010JD015154
Danielsen EF (1968) Stratospheric-tropospheric exchange based on radioactivity,ozone and potential vorticity. J Atmos Sci 25:502–518. doi:10.1175/1520-0469(1968)025<0502:STEBOR>2.0.CO;2
Darzi M, Winchester JW (1982) Aerosol characteristics at Mauna Loa Observatory,Hawaii, after East Asian dust storm episodes. J Geophys Res 87:1251–1258.doi:10.1029/JC087iC02p01251
De Mazière M, Van Roozendael M, Hermans C, Simon PC, Demoulin P, Roland G,Zander R (1998) Quantitative evaluation of the post-Mount Pinatubo NO2
reduction and recovery, based on 10 years of Fourier transform infraredand UV-visible spectroscopic measurements at Jungfraujoch. J Geophys Res103:10849–10858. doi:10.1029/97JD03362
De Mazière M, Hennen O, Van Roozendael M, Demoulin P, De Backer H (1999)Daily ozone vertical profile model built on geophysical grounds, for columnretrieval from atmospheric high-resolution infrared spectra. J Geophys Res104:23855–23869. doi:10.1029/1999JD900347
de Reus M, Fischer H, Sander R, Gros V, Kormann R, Salisbury G, Van Dingenen R,Williams J, Zöllner M, Lelieveld J (2005) Observations and model calculationsof trace gas scavenging in a dense Saharan dust plume during MINATROC.Atmos Chem Phys 5:1787–1803. doi:10.5194/acp-5-1787-2005
Decesari S, Facchini MC, Carbone C, Giulianelli L, Rinaldi M, Finessi E, Fuzzi S,Marinoni A, Cristofanelli P, Duchi R, Bonasoni P, Vuillermoz E, Cozic J, JaffrezoJL, Laj P (2010) Chemical composition of PM10 and PM1 at the high-altitudeHimalayan station Nepal Climate Observatory-Pyramid (NCO-P) (5079 m a.s.l.).Atmos Chem Phys 10:4583–4596. doi:10.5194/acp-10-4583-2010
Deshler T (2008) A review of global stratospheric aerosol: measurements,importance, life cycle, and local stratospheric aerosol. Atmos Res 90:223–232.doi:10.1016/j.atmosres.2008.03.016
Díaz AM, Díaz JP, Expósito FJ, Hernández-Leal PA, Savoie D, Querol X (2006) Air massesand aerosols chemical components in the free troposphere at the subtropicalNortheast Atlantic region. J Atmos Chem 53:63–90. doi:10.1007/s10874-006-2644-5
Dils B, Cui J, Henne S, Mahieu E, Steinbacher M, De Mazière M (2011) 1997-2007CO trend at the high Alpine site Jungfraujoch: a comparison between NDIRsurface in situ and FTIR remote sensing observations. Atmos Chem Phys11:6735–6748. doi:10.5194/acp-11-6735-2011
Ding A, Wang T (2006) Influence of stratosphere-to-troposphere exchange on theseasonal cycle of surface ozone at Mount Waliguan in western China.Geophys Res Lett 33:L03803. doi:10.1029/2005GL024760
Duchatelet P, Mahieu E, Ruhnke R, Feng W, Chipperfield M, Demoulin P, BernathP, Boone CD, Walker KA, Servais C, Flock O (2009) An approach to retrieveinformation on the carbonyl fluoride (COF2) vertical distributions aboveJungfraujoch by FTIR multi-spectrum multi-window fitting. Atmos ChemPhys 9:9027–9042. doi:10.5194/acp-9-9027-2009
Duchatelet P, Demoulin P, Hase F, Ruhnke R, Feng W, Chipperfield MP, BernathPF, Boone CD, Walker KA, Mahieu E (2010) Hydrogen fluoride total andpartial column time series above the Jungfraujoch from long-term FTIRmeasurements: impact of the line-shape model, characterization of the errorbudget and seasonal cycle, and comparison with satellite and model data.J Geophys Res 115:D22306. doi:10.1029/2010JD014677
Duncan BN, Martin RV, Staudt AC, Yevich R, Logan JA (2003) Interannual andseasonal variability of biomass burning emissions constrained by satelliteobservations. J Geophys Res 108:4100. doi:10.1029/2002JD002378
Duncan BN, Logan JA, Bey I, Megretskaia IA, Yantosca RM, Novelli PC, Jones NB, RinslandCP (2007) Global budget of CO, 1988-1997: source estimates and validation with aglobal model. J Geophys Res 112:D22301. doi:10.1029/2007JD008459
Duncan BN, West JJ, Yoshida Y, Fiore AM, Ziemke JR (2008) The influence ofEuropean pollution on ozone in the Near East and northern Africa. AtmosChem Phys 8:2267–2283. doi:10.5194/acp-8-2267-2008
EBAS. http://ebas.nilu.no. Accessed 9 Feb 2016Elansky NF, Arabov AY, Elokhov AS, Makarov OV, Savastyuk VV, Senik IA (1995)
Observations of minor species and UV radiation in atmosphere at high-mountain scientific station Kislovodsk. Izv Atmos Ocean Phys 31:5–14
Fahey DW, Hübler G, Parrsich DD, Williams EJ, Norton RB, Ridley BA, Singh HB,Liu SC, Fehsenfeld FC (1986) Reactive nitrogen species in the troposphere:measurements of NO, NO2, HNO3, particulate nitrate, peroxyacetyl nitrate(PAN), O3, and total reactive odd nitrogen (NOy) at Niwot Ridge, Colorado.J Geophys Res 91:9781–9793. doi:10.1029/JD091iD09p09781
Fehsenfeld FC, Dickerson RR, Hübler G, Luke WT, Nunnermacker LJ, Williams EJ,Roberts JM, Calvert JG, Curran CM, Delany AC, Eubank CS, Fahey DW, Fried A,Gandrud BW, Langford AO, Murphy PC, Norton RB, Pickering KE, Ridley BA(1987) A ground-based intercomparison of NO, NOx, and NOy measurementtechniques. J Geophys Res 92:14710–14722. doi:10.1029/jd092id12p14710
Fenneteaux I, Colin P, Etienne A, Boudries H, Dutot AL, Perros PE, Toupance G(1999) Influence of continental sources on oceanic air composition at theeastern edge of the North Atlantic Ocean, TOR 1992-1995. J Atmos Chem32:233–280. doi:10.1023/A:1006140223711Fierz-Schmidhauser R, Zieger P,Gysel M, Kammermann L, DeCarlo PF, Baltensperger U, Weingartner E (2010)Measured and predicted aerosol light scattering enhancement factors at thehigh alpine site Jungfraujoch. Atmos Chem Phys 10:2319–2333. doi:10.5194/acp-10-2319-2010
Finley BD, Swartzendruber PC, Jaffe DA (2009) Particulate mercury emissions inregional wildfire plumes observed at the Mount Bachelor Observatory.Atmos Environ 43:6074–6083. doi:10.1016/j.atmosenv.2009.08.046
Okamoto and Tanimoto Progress in Earth and Planetary Science (2016) 3:34 Page 42 of 52

Fiore AM, Dentener FJ, Wild O, Cuvelier C, Schultz MG, Hess P, Textor C, SchulzM, Doherty RM, Horowitz LW, MacKenzie IA, Sanderson MG, Shindell DT,Stevenson DS, Szopa S, Van Dingenen R, Zeng G, Atherton C, Bergmann D,Bey I, Carmichael G, Collins WJ, Duncan BN, Faluvegi G, Folberth G, Gauss M,Gong S, Hauglustaine D, Holloway T, Isaksen ISA et al (2009) Multimodelestimates of intercontinental source-receptor relationships for ozonepollution. J Geophys Res 114:D04301–21. doi:10.1029/2008JD010816
Fiore AM, Oberman JT, Lin MY, Zhang L, Clifton OE, Jacob DJ, Naik V, Horowitz LW, PintoJP, Milly GP (2014) Estimating North American background ozone in U.S. surface airwith two independent global models: variability, uncertainties, andrecommendations. Atmos Environ 96:284–300. doi:10.1016/j.atmosenv.2014.07.045
Fischer H, Kormann R, Klüpfel T, Gurk C, Königstedt R, Parchatka U, Mühle J, Rhee TS,Brenninkmeijer CAM, Bonasoni P, Stohl A (2003) Ozone production and trace gascorrelations during the June 2000 MINATROC intensive measurement campaign atMt. Cimone. Atmos Chem Phys 3:725–738. doi:10.5194/acp-3-725-2003
Fischer EV, Jaffe DA, Marley NA, Gaffney JS, Marchany-Rivera A (2010a) Opticalproperties of aged Asian aerosols observed over the U.S. Pacific Northwest.J Geophys Res 115:D20209. doi:10.1029/2010JD013943
Fischer EV, Jaffe DA, Reidmiller DR, Jaeglé L (2010b) Meteorological controls onobserved peroxyacetyl nitrate at Mount Bachelor during the spring of 2008.J Geophys Res 115:D03302. doi:10.1029/2009JD012776
Flentje H, Claude H, Elste T, Gilge S, Köhler U, Plass-Dülmer C, Steinbrecht W,Thomas W, Werner A, Fricke W (2010) The Eyjafjallajökull eruption in April2010—detection of volcanic plume using in-situ measurements, ozonesondes and lidar-ceilometer profiles. Atmos Chem Phys 10:10085–10092.doi:10.5194/acp-10-10085-2010
Folini D, Kaufmann P, Ubl S, Henne S (2009) Region of influence of 13 remoteEuropean measurement sites based on modeled carbon monoxide mixingratios. J Geophys Res 114:D08307. doi:10.1029/2008JD011125
Forrer J, Rüttimann R, Schneiter D, Fischer A, Buchmann B, Hofer P (2000) Variability oftrace gases at the high-Alpine site Jungfraujoch caused by meteorological transportprocesses. J Geophys Res 105:12241–12251. doi:10.1029/1999JD901178
Francis T (2012) Temporal trends in ambient SO2 at a high altitude site insemi-arid western India: observations versus chemical transport modeling. JEnviron Prot 03:657–680. doi:10.4236/jep.2012.37079
Fu XW, Feng X, Liang P, Deliger ZH, Ji J, Liu P (2012) Temporal trend and sourcesof speciated atmospheric mercury at Waliguan GAW station, NorthwesternChina. Atmos Chem Phys 12:1951–1964. doi:10.5194/acp-12-1951-2012
Furger M, Dommen J, Graber WK, Poggio L, Prévôt ASH, Emeis S, Grell G, Trickl T,Gomiscek B, Neininger B, Wotawa G (2000) The VOTALP Mesolcina ValleyCampaign 1996-concept, background and some highlights. Atmos Environ34:1395–1412. doi:10.1016/S1352-2310(99)00377-5
Gaiero DM, Simonella L, Gassó S, Gili S, Stein AF, Sosa P, Becchio R, Arce J, MarelliH (2013) Ground/satellite observations and atmospheric modeling of duststorms originating in the high Puna-Altiplano deserts (South America):implications for the interpretation of paleo-climatic archives. J Geophys Res118:3817–3831. doi:10.1002/jgrd.50036
Gallagher JP, McKendry IG, Macdonald AM, Leaitch WR (2011) Seasonal anddiurnal variations in aerosol concentration on Whistler Mountain: boundarylayer influence and synoptic-scale controls. J Appl Meteorol Climatol50:2210–2222. doi:10.1175/JAMC-D-11-028.1
Gallagher JP, McKendry IG, Strawbridge K, Macdonald AM, Leaitch WR, Cottle PW(2012) Application of lidar data to assist airmass discrimination at theWhistler Mountaintop Observatory. J Appl Meteorol Climatol 51:1733–1739.doi:10.1175/JAMC-D-12-067.1
García OE, Schneider M, Redondas A, González Y, Hase F, Blumenstock T,Sepúlveda E (2012) Investigating the long-term evolution of subtropicalozone profiles applying ground-based FTIR spectrometry. Atmos Meas Tech5:2917–2931. doi:10.5194/amt-5-2917-2012
Garreaud R, Vuille M, Clement AC (2003) The climate of the Altiplano: observedcurrent conditions and mechanisms of past changes. PalaeogeogrPalaeoclimatol Palaeoecol 194:5–22. doi:10.1016/S0031-0182(03)00269-4
Genualdi SA, Massey Simonich SL, Primbs TK, Bidleman TF, Jantunen LM, RyooK-S, Zhu T (2009) Enantiomeric signatures of organochlorine pesticides inAsian, trans-Pacific, and western U.S. air masses. Environ Sci Technol43:2806–2811. doi:10.1021/es803402q
Gil M, Puentedura O, Yela M, Cuevas E (2000) Behavior of NO2 and O3 columnsduring the eclipse of February 26, 1998, as measured by visible spectroscopy.J Geophys Res 105:3583–3593. doi:10.1029/1999JD900973
Gil M, Yela M, Gunn LN, Richter A, Alonso I, Chipperfield MP, Cuevas E, Iglesias J,Navarro M, Puentedura O, Rodríguez S (2008) NO2 climatology in the
northern subtropical region: diurnal, seasonal and interannual variability.Atmos Chem Phys 8:1635–1648. doi:10.5194/acp-8-1635-2008
Gilge S, Plass-Duelmer C, Fricke W, Kaiser A, Ries L, Buchmann B, Steinbacher M(2010) Ozone, carbon monoxide and nitrogen oxides time series at fouralpine GAW mountain stations in central Europe. Atmos Chem Phys10:12295–12316. doi:10.5194/acp-10-12295-2010
Ginoux P, Prospero JM, Torres O, Chin M (2004) Long-term simulation of global dustdistribution with the GOCART model: correlation with North Atlantic Oscillation.Environ Model Softw 19:113–128. doi:10.1016/S1364-8152(03)00114-2
Gobbi GP, Barnaba F, Van Dingenen R, Putaud JP, Mircea M, Facchini MC (2003)Lidar and in situ observations of continental and Saharan aerosol: closureanalysis of particles optical and physical properties. Atmos Chem Phys3:2161–2172. doi:10.5194/acp-3-2161-2003
Gobbi GP, Angelini F, Bonasoni P, Verza GP, Marinoni A, Barnaba F (2010)Sunphotometry of the 2006–2007 aerosol optical/radiative properties at theHimalayan Nepal Climate Observatory-Pyramid (5079 m a.s.l.). Atmos ChemPhys 10:11209–11221. doi:10.5194/acp-10-11209-2010
Gomez-Pelaez AJ, Ramos R, Gomez-Trueba V, Novelli PC, Campo-Hernandez R(2013) A statistical approach to quantify uncertainty in carbon monoxidemeasurements at the Izaña global GAW station: 2008–2011. Atmos MeasTech 6:787–799. doi:10.5194/amt-6-787-2013
Gratz LE, Jaffe DA, Hee JR (2015) Causes of increasing ozone and decreasingcarbon monoxide in springtime at the Mt. Bachelor Observatory from 2004to 2013. Atmos Environ 109:323–330. doi:10.1016/j.atmosenv.2014.05.076
Graustein WC, Turekian KK (1996) 7Be and 210Pb indicate an upper troposphere sourcefor elevated ozone in the summertime subtropical free troposphere of the easternNorth Atlantic. Geophys Res Lett 23:539–542. doi:10.1029/96GL00304
Greally BR, Manning AJ, Reimann S, McCulloch A, Huang J, Dunse BL, Simmonds PG,Prinn RG, Fraser PJ, Cunnold DM, O’Doherty S, Porter LW, Stemmler K, VollmerMK, Lunder CR, Schmidbauer N, Hermansen O, Arduini J, Salameh PK, KrummelPB, Wang RHJ, Folini D, Weiss RF, Maione M, Nickless G, Stordal F, Derwent RG(2007) Observations of 1,1-difluoroethane (HFC-152a) at AGAGE and SOGEmonitoring stations in 1994-2004 and derived global and regional emissionestimates. J Geophys Res 112:D06308. doi:10.1029/2006JD007527
Greenberg JP, Helmig D, Zimmerman PR (1996) Seasonal measurements ofnonmethane hydrocarbons and carbon monoxide at the Mauna LoaObservatory during the Mauna Loa Observatory Photochemistry Experiment2. J Geophys Res 101:14581–14598. doi:10.1029/95JD01543
Gros V, Bräunlich M, Röckmann T, Jöckel P, Bergamaschi P, Brenninkmeijer CAM,Rom W, Kutschera W, Kaiser A, Scheel HE, Mandl M, van der Plicht J, PossnertG (2001) Detailed analysis of the isotopic composition of CO andcharacterization of the air masses arriving at Mount Sonnblick (Austrian Alps).J Geophys Res 106:3179–3193. doi:10.1029/2000JD900509
Guerova G, Bey I, Attié J-L, Martin RV, Cui J, Sprenger M (2006) Impact oftransatlantic transport episodes on summertime ozone in Europe. AtmosChem Phys 6:2057–2072. doi:10.5194/acp-6-2057-2006
Haagen-Smit AJ (1952) Chemistry and physiology of Los Angeles smog. Ind EngChem 44:1342–1346. doi:10.1021/ie50510a045
Haagenson PL (1979) Meteorological and climatological factors affecting Denverair quality. Atmos Environ 13:79–85. doi:10.1016/0004-6981(79)90247-6
Hahn CJ (1981) A study of the diurnal behavior of boundary-layer winds at theBoulder Atmospheric Observatory. Boundary-Layer Meteorol 21:231–245.doi:10.1007/BF02033941
Hahn CJ, Merrill JT, Mendonca BG (1992) Meteorological influences duringMLOPEX. J Geophys Res 97:10291–10309. doi:10.1029/91JD02299
Hanisch F, Crowley JN (2003) Ozone decomposition on Saharan dust: an experimentalinvestigation. Atmos Chem Phys 11:119–130. doi:10.5194/acp-3-119-2003
Hanke M, Umann B, Uecker J, Arnold F, Bunz H (2003) Atmosphericmeasurements of gas-phase HNO3 and SO2 using chemical ionization massspectrometry during the MINATROC field campaign 2000 on Monte Cimone.Atmos Chem Phys 3:417–436. doi:10.5194/acp-3-417-2003
Hauglustaine DA, Madronich S, Ridley BA, Flocke SJ, Cantrell CA, Eisele FL, ShetterRE, Tanner DJ, Ginoux P, Atlas EL (1999) Photochemistry and budget ofozone during the Mauna Loa Observatory Photochemistry Experiment(MLOPEX 2). J Geophys Res 104:30275–30307. doi:10.1029/91JD02298
Heikkilä U, Beer J, Alfimov V (2008) Beryllium-10 and beryllium-7 in precipitationin Dübendorf (440 m) and at Jungfraujoch (3580 m), Switzerland (1998–2005).J Geophys Res 113:D11104. doi:10.1029/2007JD009160
Helmig D, Tanner DM, Honrath RE, Owen RC, Parrish DD (2008) Nonmethanehydrocarbons at Pico Mountain, Azores: 1. Oxidation chemistry in the NorthAtlantic region. J Geophys Res 113:D20S91. doi:10.1029/2007JD008930
Okamoto and Tanimoto Progress in Earth and Planetary Science (2016) 3:34 Page 43 of 52

Helmig D, Muñoz M, Hueber J, Mazzoleni C, Mazzoleni L, Owen RC, Val-Martin M,Fialho P, Plass-Duelmer C, Palmer PI Lewis AC, Pfister G (2015) Climatologyand atmospheric chemistry of the non-methane hydrocarbons ethane andpropane over the North Atlantic. Elem Sci Anth 3:000054. doi:10.12952/journal.elementa.000054
Hemispheric Transport of Air Pollution (2007) Hemispheric Transport of Air Pollution2007, Air Pollution Studies No. 16. United Nations, New York and Geneva
Henne S, Furger M, Nyeki S, Steinbacher M, Neininger B, de Wekker SFJ,Dommen J, Spichtinger N, Stohl A, Prévôt ASH (2004) Quantification oftopographic venting of boundary layer air to the free troposphere. AtmosChem Phys 4:497–509. doi:10.5194/acp-4-497-2004
Henne S, Furger M, Prévôt ASH (2005) Climatology of mountain venting-inducedelevated moisture layers in the lee of the Alps. J Appl Meteorol 44:620–633.doi:10.1175/JAM2217.1
Henne S, Klausen J, Junkermann W, Kariuki JM, Aseyo JO, Buchmann B (2008)Representativeness and climatology of carbon monoxide and ozone at theglobal GAW station Mt. Kenya in equatorial Africa. Atmos Chem Phys8:3119–3139. doi:10.5194/acp-8-3119-2008
Henne S, Brunner D, Folini D, Solberg S, Klausen J, Buchmann B (2010) Assessmentof parameters describing representativeness of air quality in-situ measurementsites. Atmos Chem Phys 10:3561–3581. doi:10.5194/acp-10-3561-2010
Henning S, Weingartner E, Schwikowski M, Gäggeler HW, Gehrig R, Hinz K-P,Trimborn A, Spengler B, Baltensperger U (2003) Seasonal variation of water-soluble ions of the aerosol at the high-alpine site Jungfraujoch (3580 m asl).J Geophys Res 108:4030. doi:10.1029/2002JD002439
Hoegger B, Levrat G, Staehelin J, Schill H, Ribordy P (1992) Recent developmentsof the Light Climatic Observatory-ozone measuring station of the SwissMeteorological Institute (LKO) at Arosa. J Atmos Terr Phys 54:497–505.doi:10.1016/0021-9169(92)90093-Z
Hoerling MP, Schaack TK, Lenzen AJ (1991) Global objective tropopause analysis. MonWeather Rev 119:1816–1831. doi:10.1175/1520-0493(1991)119<1816:GOTA>2.0.CO;2
Holmes J, Zoller W (1996) The elemental signature of transported Asian dust atMauna Loa observatory. Tellus B 48:83–92. doi:10.3402/tellusb.v48i1.15669
Holzinger R, Kasper-Giebl A, Staudinger M, Schauer G, Röckmann T (2010)Analysis of the chemical composition of organic aerosol at the Mt. Sonnblickobservatory using a novel high mass resolution thermal-desorptionproton-transfer-reaction mass-spectrometer (hr-TD-PTR-MS). Atmos ChemPhys 10:10111–10128. doi:10.5194/acp-10-10111-2010
Honrath RE, Owen RC, Val Martín M, Reid JS, Lapina K, Fialho P, Dziobak MP,Kleissl J, Westphal DL (2004) Regional and hemispheric impacts ofanthropogenic and biomass burning emissions on summertime CO and O3
in the North Atlantic lower free troposphere. J Geophys Res 109:D24310.doi:10.1029/2004JD005147
Honrath RE, Helmig D, Owen RC, Parrish DD, Tanner DM (2008) Nonmethanehydrocarbons at Pico Mountain, Azores: 2. Event-specific analyses of theimpacts of mixing and photochemistry on hydrocarbon ratios. J Geophys Res113:D20S92. doi:10.1029/2008JD009832
Hoyle CR, Webster CS, Rieder HE, Nenes A, Hammer E, Herrmann E, Gysel M,Bukowiecki N, Weingartner E, Steinbacher M, Baltensperger U (2016)Chemical and physical influences on aerosol activation in liquid clouds: astudy based on observations from the Jungfraujoch, Switzerland. AtmosChem Phys 16:4043–4061. doi:10.5194/acp-16-4043-2016
Huebert BJ, Phillips CA, Zhuang L, Kjellström E, Rodhe H, Feichter J, Land C (2001)Long-term measurements of free-tropospheric sulfate at Mauna Loa:comparison with global model simulations. J Geophys Res 106:5479–5492.doi:10.1029/2000JD900627
Huntrieser H, Heland J, Schlager H, Forster C, Stohl A, Aufmhoff H, Arnold F,Scheel HE, Campana M, Gilge S, Eixmann R, Cooper O (2005) Intercontinentalair pollution transport from North America to Europe: experimental evidencefrom airborne measurements and surface observations. J Geophys Res110:D01305. doi:10.1029/2004JD005045
Hyslop NP, Trzepla K, Wallis CD, Matzoll AK, White WH (2013) Technical note: a23-year record of twice-weekly aerosol composition measurements at MaunaLoa Observatory. Atmos Environ 80:259–263. doi:10.1016/j.atmosenv.2013.07.038
Igarashi Y, Sawa Y, Yoshida K, Matsueda H, Fujii K, Dokiya Y (2004) Monitoring theSO2 concentration at the summit of Mt. Fuji and a comparison with other tracegases during winter. J Geophys Res 109:D17304. doi:10.1029/2003JD004428
Igarashi Y, Sawa Y, Yoshioka K, Takahashi H, Matsueda H, Dokiya Y (2006)Seasonal variations in SO2 plume transport over Japan: observations at thesummit of Mt. Fuji from winter to summer. Atmos Environ 40:7018–7033.doi:10.1016/j.atmosenv.2006.06.017
Interagency Monitoring of Protected Visual Environments (IMPROVE). http://vista.cira.colostate.edu/improve/. Accessed 8 Feb 2016
Intergovermental Panel on Climate Change (2013) Climate Change 2013: ThePhysical Science Basis, Working Group I Contribution to the Fifth AssesmentReport of the Intergovermental Panel on Climate Change. CambridgeUniversity Press, Cambridge
Ionov DV, Timofeyev YM, Sinyakov VP, Semenov VK, Goutail F, Pommereau J-P, BucselaEJ, Celarier EA, Kroon M (2008) Ground-based validation of EOS-Aura OMI NO2
vertical column data in the midlatitude mountain ranges of Tien Shan (Kyrgyzstan)and Alps (France). J Geophys Res 113:D15S08. doi:10.1029/2007JD008659
Iwasaka Y, Minoura H, Nagaya K (1983) The transport and spacial scale of Asiandust-storm clouds: a case study of the dust-storm event of April 1979. TellusB 35:189–196. doi:10.1111/j.1600-0889.1983.tb00023.x
Jabbar T, Steier P, Wallner G, Priller A, Kandler N, Kaiser A (2012) Iodine isotopes(127I and 129I) in aerosols at high altitude Alp stations. Environ Sci Technol46:8637–8644. doi:10.1021/es300948t
Jaffe D (2011) Relationship between surface and free tropospheric ozone in thewestern U.S. Environ Sci Technol 45:432–438. doi:10.1021/es1028102
Jaffe D, Ray J (2007) Increase in surface ozone at rural sites in the western US.Atmos Environ 41:5452–5463. doi:10.1016/j.atmosenv.2007.02.034
Jaffe D, Mahura A, Kelley J, Atkins J, Novelli PC, Merrill J (1997) Impact of Asianemissions on the remote North Pacific atmosphere: Interpretation of CO datafrom Shemya, Guam, Midway and Mauna Loa. J Geophys Res 102:28627–28635.doi:10.1029/96JD02750
Jaffe D, McKendry I, Anderson T, Price H (2003a) Six “new” episodes of trans-Pacific transport of air pollutants. Atmospheric Environment 37:391-404.doi:10.1016/s1352-2310(02)00862-2
Jaffe D, Price H, Parrish D, Goldstein A, Harris J (2003b) Increasing backgroundozone during spring on the west coast of North America. Geophys Res Lett30:1613. doi:10.1029/2003gl017024
Jaffe D, Prestbo E, Swartzendruber P, Weiss-Penzias P, Kato S, Takami A,Hatakeyama S, Kajii Y (2005) Export of atmospheric mercury from Asia.Atmos Environ 39:3029–3038. doi:10.1016/j.atmosenv.2005.01.030
Jaffe D, Chand D, Hafner W, Westerling A, Spracklen D (2008) Influence of fireson O3 concentrations in the western U.S. Environ Sci Technol 42:5885–5891.doi:10.1021/es800084k
Joly M, Peuch V-H (2012) Objective classification of air quality monitoring sitesover Europe. Atmos Environ 47:111–123. doi:10.1016/j.atmosenv.2011.11.025
Jonson JE, Stohl A, Fiore AM, Hess P, Szopa S, Wild O, Zeng G, Dentener FJ, LupuA, Schultz MG, Duncan BN, Sudo K, Wind P, Schulz M, Marmer E, Cuvelier C,Keating T, Zuber A, Valdebenito A, Dorokhov V, De Backer H, Davies J, ChenGH, Johnson B, Tarasick DW, Stübi R, Newchurch MJ, von der Gathen P,Steinbrecht W, Claude H (2010) A multi-model analysis of vertical ozoneprofiles. Atmos Chem Phys 10:5759–5783. doi:10.5194/acp-10-5759-2010
Junge CE (1962) Global ozone budget and exchange between stratosphere andtroposphere. Tellus 14:363–377. doi:10.3402/tellusa.v14i4.9563
Kaiser A (2009) Origin of polluted air masses in the Alps. An overview and first results forMONARPOP. Environ Pollut 157:3232–3237. doi:10.1016/j.envpol.2009.05.042
Kaiser A, Scheifinger H, Spangl W, Weiss A, Gilge S, Fricke W, Ries L, Cemas D,Jesenovec B (2007) Transport of nitrogen oxides, carbon monoxide andozone to the Alpine Global Atmosphere Watch stations Jungfraujoch(Switzerland), Zugspitze and Hohenpeissenberg (Germany), Sonnblick(Austria) and Mt. Krvavec (Slovenia). Atmos Environ 41:9273–9287.doi:10.1016/j.atmosenv.2007.09.027
Kajii Y, Someno K, Tanimoto H, Hirokawa J, Akimoto H, Katsuno T, Kawara J(1998) Evidence for the seasonal variation of photochemical activity oftropospheric ozone: continuous observation of ozone and CO at Happo,Japan. Geophys Res Lett 25:3505–3508. doi:10.1029/98GL02602
Kajino M, Ueda H, Satsumabayashi H, An J (2004) Impacts of the eruption ofMiyakejima Volcano on air quality over far east Asia. J Geophys Res 109:D21204. doi:10.1029/2004JD004762
Kajino M, Ueda H, Satsumabayashi H, Han Z (2005) Increase in nitrate andchloride deposition in east Asia due to increased sulfate associated with theeruption of Miyakejima Volcano. J Geophys Res 110:D18203. doi:10.1029/2005JD005879
Kanakidou M, Crutzen PJ (1999) The photochemical source of carbon monoxide:importance, uncertainties and feedbacks. Chemosphere 1:91–109. doi:10.1016/S1465-9972(99)00022-7
Kanakidou M, Mihalopoulos N, Kindap T, Im U, Vrekoussis M, Gerasopoulos E,Dermitzaki E, Unal A, Koçak M, Markakis K, Melas D, Kouvarakis G, Youssef AF,Richter A, Hatzianastassiou N, Hilboll A, Ebojie F, Wittrock F, von Savigny C,
Okamoto and Tanimoto Progress in Earth and Planetary Science (2016) 3:34 Page 44 of 52

Burrows JP, Ladstaetter-Weissenmayer A, Moubasher H (2011) Megacities ashot spots of air pollution in the East Mediterranean. Atmos Environ45:1223–1235. doi:10.1016/j.atmosenv.2010.11.048
Kandler K, Benker N, Bundke U, Cuevas E, Ebert M, Knippertz P, Rodríguez S,Schütz L, Weinbruch S (2007) Chemical composition and complexrefractive index of Saharan Mineral Dust at Izaña, Tenerife (Spain)derived by electron microscopy. Atmos Environ 41:8058–8074.doi:10.1016/j.atmosenv.2007.06.047
Kaneyasu N, Igarashi Y, Sawa Y, Takahashi H, Takada H, Kumata H, Höller R (2007)Chemical and optical properties of 2003 Siberian forest fire smoke observedat the summit of Mt. Fuji, Japan. J Geophys Res Atmos 112:D13214.doi:10.1029/2007JD008544
Karl T, Crutzen PJ, Mandl M, Staudinger M, Guenther A, Jordan A, Fall R, LindingerW (2001a) Variability-lifetime relationship of VOCs observed at the SonnblickObservatory 1999—estimation of HO-densities. Atmos Environ 35:5287-5300.doi:10.1016/S1352-2310(01)00341-7
Karl T, Fall R, Crutzen PJ, Jordan A, Lindinger W (2001b) High concentrations ofreactive biogenic VOCs at a high altitude site in late autumn. Geophys ResLett 28:507-510. doi:10.1029/2000GL012255
Karl T, Hansel A, Märk T, Lindinger W, Hoffmann D (2003) Trace gas monitoringat the Mauna Loa Baseline Observatory using Proton-Transfer Reaction MassSpectrometry. Int J Mass Spectrom 223–224:527–538. doi:10.1016/S1387-3806(02)00874-6
Kashin FV, Aref’ev VN, Kamenogradskii NE, Semenov VK, Sinyakov VP (2007)Carbon dioxide content in the atmospheric thickness over central Eurasia(Issyk Kul Monitoring Station). Izv Atmos Ocean Phys 43:480–489.doi:10.1134/S0001433807040093
Kashin FV, Aref’ev VN, Semenov VK, Sinyakov VP, Upenek LB (2008) Structure oftime variations in carbon dioxide in the atmospheric thickness over centralEurasia (Issyk Kul Monitoring Station). Izv Atmos Ocean Phys 44:94–103.doi:10.1134/S0001433808010106
Kasper A, Puxbaum H (1998) Seasonal variation of SO2, HNO3, NH3 and selectedaerosol components at Sonnblick (3106 m a.s.l.). Atmos Environ 32:3925–3939.doi:10.1016/S1352-2310(97)00031-9
Kato S, Kajii Y, Akimoto H, Bräunlich M, Röckmann T, Brenninkmeijer CAM (2000)Observed and modeled seasonal variations of 13C, 18O, and 14C ofatmospheric CO at Happo, a remote site in Japan, and a comparison withother records. J Geophys Res 105:8891–8900. doi:10.1029/1999JD901144
Kato S, Pochanart P, Hirokawa J, Kajii Y, Akimoto H, Ozaki Y, Obi K, Katsuno T,Streets DG, Minko NP (2002) The influence of Siberian forest fires on carbonmonoxide concentrations at Happo, Japan. Atmos Environ 36:385–390.doi:10.1016/S1352-2310(01)00158-3
Keeling CD, Whorf TP, Wahlen M, van der Plicht J (1995) Interannual extremes inthe rate of rise of atmospheric carbon dioxide since 1980. Nature 375:666–670.doi:10.1038/375666a0
Kentarchos AS, Roelofs GJ, Lelieveld J, Cuevas E (2000) On the origin ofelevated surface ozone concentrations at Izana Observatory, Tenerifeduring late March 1996. Geophys Res Lett 27:3699–3702. doi:10.1029/2000GL011518
Khalil MAK, Rasmussen RA (1994) Global decrease in atmospheric carbonmonoxide concentration. Nature 370:639–641. doi:10.1038/370639a0
Kivekäs N, Sun J, Zhan M, Kerminen V-M, Hyvärinen A, Komppula M, Viisanen Y,Hong N, Zhang Y, Kulmala M, Zhang X-C, Deli-Geer, Lihavainen H (2009)Long term particle size distribution measurements at Mount Waliguan,a high-altitude site in inland China. Atmos Chem Phys 9:5461–5474.doi:10.5194/acp-9-5461-2009
Kleissl J, Honrath RE, Dziobak MP, Tanner D, Val Martín M, Owen RC, Helmig D(2007) Occurrence of upslope flows at the Pico mountaintop observatory:a case study of orographic flows on a small, volcanic island. J Geophys Res112:D10S35. doi:10.1029/2006JD007565
Klock R, Mullock J (2001) The weather of British Columbia: graphic area forecast31. NAV Canada, Ottawa
Koch D, Rind D (1998) Beryllium 10/beryllium 7 as a tracer of stratospherictransport. J Geophys Res 103:3907–3917. doi:10.1029/97JD03117
Kovač-Andrić E, Šorgo G, Kezele N, Cvitaš T, Klasinc L (2010) Photochemicalpollution indicators—an analysis of 12 European monitoring stations. EnvironMonit Assess 165:577–583. doi:10.1007/s10661-009-0969-7
Krieg J, Nothholt J, Mahieu E, Rinsland CP, Zander R (2005) Sulphur hexafluoride(SF6): comparison of FTIR-measurements at three sites and determination ofits trend in the northern hemisphere. J Quant Spectrosc Radiat Transf92:383–392. doi:10.1016/j.jqsrt.2004.08.005
Krzyścin JW (2000) Total ozone influence on the surface UV-B radiation in the latespring-summer 1963-1997: an analysis of multiple timescales. J Geophys Res105:4993–5000. doi:10.1029/1999JD900265
Kuebler J, van den Bergh H, Russell AG (2001) Long-term trends of primary andsecondary pollutant concentrations in Switzerland and their response toemission controls and economic changes. Atmos Environ 35:1351–1363.doi:10.1016/S1352-2310(00)00401-5
Kumar A, Sarin MM (2009) Mineral aerosols from western India: temporalvariability of coarse and fine atmospheric dust and elemental characteristics.Atmos Environ 43:4005–4013. doi:10.1016/j.atmosenv.2009.05.014
Kumar A, Sarin MM (2010) Atmospheric water-soluble constituents in fine andcoarse mode aerosols from high-altitude site in western India: long-rangetransport and seasonal variability. Atmos Environ 44:1245–1254. doi:10.1016/j.atmosenv.2009.12.035
Kumar A, Wu S, Weise MF, Honrath R, Owen RC, Helmig D, Kramer L, Val Martin M, Li Q(2013) Free-troposphere ozone and carbon monoxide over the North Atlantic for2001-2011. Atmos Chem Phys 13:12537–12547. doi:10.5194/acp-13-12537-2013
Kurokawa J, Ohara T, Morikawa T, Hanayama S, Janssens-Maenhout G, Fukui T,Kawashima K, Akimoto H (2013) Emissions of air pollutants and greenhouse gasesover Asian regions during 2000-2008: regional Emission inventory in ASia (REAS)version 2. Atmos Chem Phys 13:11019–11058. doi:10.5194/acp-13-11019-2013
Lal D, Peters B (1967) Cosmic ray produced radioactivity on the Earth. In: Sitte K(ed) Kosmische Strahlung II / Cosmic Rays II. Springer, Berlin Heidelberg
Lamarque J-F, Bond TC, Eyring V, Granier C, Heil A, Klimont Z, Lee D, Liousse C,Mieville A, Owen B, Schultz MG, Shindell D, Smith SJ, Stehfest E, Van Aardenne J,Cooper OR, Kainuma M, Mahowald N, McConnell JR, Naik V, Riahi K, van VuurenDP (2010) Historical (1850-2000) gridded anthropogenic and biomass burningemissions of reactive gases and aerosols: methodology and application. AtmosChem Phys 10:7017–7039. doi:10.5194/acp-10-7017-2010
Lanz VA, Henne S, Staehelin J, Hueglin C, Vollmer MK, Steinbacher M, BuchmannB, Reimann S (2009) Statistical analysis of anthropogenic non-methane VOCvariability at a European background location (Jungfraujoch, Switzerland).Atmos Chem Phys 9:3445–3459. doi:10.5194/acp-9-3445-2009
Lanz VA, Prévôt ASH, Alfarra MR, Weimer S, Mohr C, DeCarlo PF, Gianini MFD,Hueglin C, Schneider J, Favez O, D’Anna B, George C, Baltensperger U (2010)Characterization of aerosol chemical composition with aerosol massspectrometry in Central Europe: an overview. Atmos Chem Phys10:10453–10471. doi:10.5194/acp-10-10453-2010
Lapina K, Honrath RE, Owen RC, Val Martín M, Hyer EJ, Fialho P (2008) Latesummer changes in burning conditions in the boreal regions and theirimplications for NOx and CO emissions from boreal fires. J Geophys Res113:D11304. doi:10.1029/2007JD009421
Leaitch WR, Macdonald AM, Anlauf KG, Liu PSK, Toom-Sauntry D, Li S-M, Liggio J,Hayden K, Wasey MA, Russell LM, Takahama S, Liu S, van Donkelaar A, Duck T,Martin RV, Zhang Q, Sun Y, McKendry I, Shantz NC, Cubison M (2009) Evidencefor Asian dust effects from aerosol plume measurements during INTEX-B 2006near Whistler, BC. Atmos Chem Phys 9:3523–3546. doi:10.5194/acp-9-3523-2009
Leclair De Bellevue J, Réchou A, Baray JL, Ancellet G, Diab RD (2006) Signaturesof stratosphere to troposphere transport near deep convective events in thesouthern subtropics. J Geophys Res 111:D24107. doi:10.1029/2005JD006947
Lee HN, Tositti L, Zheng X, Bonasoni P (2007) Analyses and comparisons ofvariations of 7Be, 210Pb, and 7Be/210Pb with ozone observations at two GlobalAtmosphere Watch stations from high mountains. J Geophys Res 112:D05303.doi:10.1029/2006JD007421
Lee C-T, Chuang M-T, Lin N-H, Wang J-L, Sheu G-R, Chang S-C, Wang S-H, HuangH, Chen H-W, Liu Y-L, Weng G-H, Lai H-Y, Hsu S-P (2011) The enhancementof PM2.5 mass and water-soluble ions of biosmoke transported fromSoutheast Asia over the Mountain Lulin site in Taiwan. Atmos Environ45:5784–5794. doi:10.1016/j.atmosenv.2011.07.020
Lee AKY, Hayden KL, Herckes P, Leaitch WR, Liggio J, Macdonald AM, Abbatt JPD(2012) Characterization of aerosol and cloud water at a mountain site duringWACS 2010: secondary organic aerosol formation through oxidative cloudprocessing. Atmos Chem Phys 12:7103–7116. doi:10.5194/acp-12-7103-2012
Legreid G, Folini D, Staehelin J, Balzani Lööv J, Steinbacher M, Reimann S (2008)Measurements of organic trace gases including oxygenated volatile organiccompounds at the high alpine site Jungfraujoch (Switzerland): seasonal variationand source allocations. J Geophys Res 113:D05307. doi:10.1029/2007JD008653
Lelieveld J, Berresheim H, Borrmann S, Crutzen PJ, Dentener FJ, Fischer H,Feichter J, Flatau PJ, Heland J, Holzinger R, Korrmann R, Lawrence MG, LevinZ, Markowicz KM, Mihalopoulos N, Minikin A, Ramanathan V, de Reus M,Roelofs GJ, Scheeren HA, Sciare J, Schlager H, Schultz M, Siegmund P, Steil B,
Okamoto and Tanimoto Progress in Earth and Planetary Science (2016) 3:34 Page 45 of 52

Stephanou EG, Stier P, Traub M, Warneke C, Williams J et al (2002) Global airpollution crossroads over the Mediterranean. Science 298:794–799.doi:10.1126/science.1075457
Levy II H (1971) Normal atmosphere: large radical and formaldehyde concentrationspredicted. Science 173:141–143. doi:10.1126/science.173.3992.141
Levy II H, Moxim WJ (1989) Influence of long-range transport of combustionemissions on the chemical variability of the background atmosphere. Nature338:326–328. doi:10.1038/338326a0
Li Y, Campana M, Reimann S, Schaub D, Stemmler K, Staehelin J, Peter T (2005)Hydrocarbon concentrations at the Alpine mountain sites Jungfraujoch andArosa. Atmos Environ 39:1113–1127. doi:10.1016/j.atmosenv.2004.09.084
Li J, Wang Z, Akimoto H, Tang J, Uno I (2009) Modeling of the impacts of China’santhropogenic pollutants on the surface ozone summer maximum on thenorthern Tibetan Plateau. Geophys Res Lett 36:L24802. doi:10.1029/2009GL041123
Liang Q, Jaeglé L, Jaffe DA, Weiss-Penzias P, Heckman A, Snow JA (2004)Long-range transport of Asian pollution to the northeast Pacific: seasonalvariations and transport pathways of carbon monoxide. J Geophys Res109:D23S07. doi:10.1029/2003JD004402
Liang M-C, Tang J, Chan C-Y, Zheng XD, Yung YL (2008) Signature ofstratospheric air at the Tibetan Plateau. Geophys Res Lett 35:L20816.doi:10.1029/2008GL035246
Lin YC, Lin CY, Hsu WT (2010) Observations of carbon monoxide mixing ratios ata mountain site in central Taiwan during the Asian biomass burning season.Atmos Res 95:270–278. doi:10.1016/j.atmosres.2009.10.006
Liu SC, Trainer M, Fehsenfeld FC, Parrish DD, Williams EJ, Fahey DW, Hübler G,Murphy PC (1987) Ozone production in the rural troposphere and theimplications for regional and global ozone distributions. J Geophys Res92:4191–4207. doi:10.1029/JD092iD04p04191
Liu H, Jacob DJ, Bey I, Yantosca RM, Duncan BN, Sachse GW (2003a) Transportpathways for Asian pollution outflow over the Pacific: interannual andseasonal variations. J Geophys Res 108:D20. doi:10.1029/2002JD003102
Liu W, Hopke PK, VanCuren RA (2003a) Origins of fine aerosol mass in the westernUnited States using positive matrix factorization. J Geophys Res 108:D23.doi:10.1029/2003JD003678
Liu X, Kondo Y, Ram K, Matsui H, Nakagomi K, Ikeda T, Oshima N, Verma RL,Takegawa N, Koike M, Kajino M (2013) Seasonal variations of black carbonobserved at the remote mountain site Happo in Japan. J Geophys Res118:3709–3722. doi:10.1002/jgrd.50317
Lobert JM, Scharffe DH, Hao WM, Kuhlbusch TA, Seuwan R, Warneck P, CrutzenPJ (1991) Experimental evaluation of biomass burning emissions: nitrogenand carbon containing compounds. In: Levine JS (ed) Global BiomassBurning: Atmospheric, Climatic and Biospheric Implications. MIT Press,Cambridge, pp 289–304
Logan JA (1983) Nitrogen oxides in the troposphere: global and regionalbudgets. J Geophys Res 88:10785–10807. doi:10.1029/JC088iC15p10785
Logan JA, Staehelin J, Megretskaia IA, Cammas J-P, Thouret V, Claude H, DeBacker H, Steinbacher M, Scheel H-E, Stübi R, Fröhlich M, Derwent R (2012)Changes in ozone over Europe: analysis of ozone measurements fromsondes, regular aircraft (MOZAIC) and alpine surface sites. J Geophys Res117:D09301. doi:10.1029/2011JD016952
Lugauer M, Baltensperger U, Furger M, Gäggeler HW, Jost DT, Schwikowski M,Wanner H (1998) Aerosol transport to the high Alpine sites Jungfraujoch(3454 m asl) and Colle Gnifetti (4452 m asl). Tellus B 50:76–92. doi:10.3402/tellusb.v50i1.16026
Luria M, Boatman JF, Harris J, Ray J, Straube T, Chin J, Gunter RL, Herbert G,Gerlach TM, Van Valin CC (1992) Atmospheric sulfur dioxide at Mauna Loa,Hawaii. J Geophys Res 97:6011–6022. doi:10.1029/91JD03126
Ma J, Tang J, Zhou X, Zhang X (2002) Estimates of the chemical budget for ozone atWaliguan Observatory. J Atmos Chem 41:21–48. doi:10.1023/A:1013892308983
Ma J, Zheng X, Xu X (2005) Comment on “Why does surface ozone peak insummertime at Waliguan?” by Bin Zhu et al. Geophys Res Lett 32:L01805.doi:10.1029/2004GL021683
Macdonald AM, Anlauf KG, Leaitch WR, Chan E, Tarasick DW (2011) Interannualvariability of ozone and carbon monoxide at the Whistler high elevation site:2002–2006. Atmos Chem Phys 11:11431–11446. doi:10.5194/acp-11-11431-2011
Mahieu E, Zander R, Delbouille L, Demoulin P, Roland G, Servais C (1997)Observed trends in total vertical column abundances of atmospheric gasesfrom IR solar spectra recorded at the Jungfraujoch. J Atmos Chem 28:227–243.doi:10.1023/A:1005854926740
Marcq S, Laj P, Roger JC, Villani P, Sellegri K, Bonasoni P, Marinoni A, Cristofanelli P,Verza GP, Bergin M (2010) Aerosol optical properties and radiative forcing in
the high Himalaya based on measurements at the Nepal Climate Observatory-Pyramid site (5079 m a.s.l.). Atmos Chem Phys 10:5859–5872. doi:10.5194/acp-10-5859-2010
Marenco A, Gouget H, Nédélec P, Pagés JP, Karcher F (1994) Evidence of a long-termincrease in tropospheric ozone from Pic du Midi data series: consequences: positiveradiative forcing. J Geophys Res 20:16617–16632. doi:10.1029/94JD00021
Marenco F, Bonasoni P, Calzolari F, Ceriani M, Chiari M, Cristofanelli P,D’Alessandro A, Fermo P, Lucarelli F, Mazzei F, Nava S, Piazzalunga A, Prati P,Valli G, Vecchi R (2006) Characterization of atmospheric aerosols at MonteCimone, Italy, during summer 2004: source apportionment and transportmechanisms. J Geophys Res 111:D24202. doi:10.1029/2006JD007145
Maring H, Savoie DL, Izaguirre MA, McCormick C, Arimoto R, Prospero JM, Pilinis C(2000) Aerosol physical and optical properties and their relationship to aerosolcomposition in the free troposphere at Izaña, Tenetire, Canary Islands, duringJuly 1995. J Geophys Res 105:14677–14700. doi:10.1029/2000JD900106
Marinoni A, Cristofanelli P, Laj P, Duchi R, Calzolari F, Decesari S, Sellegri K,Vuillermoz E, Verza GP, Villani P, Bonasoni P (2010) Aerosol mass and blackcarbon concentrations, a two year record at NCO-P (5079 m, SouthernHimalayas). Atmos Chem Phys 10:8551–8562. doi:10.5194/acp-10-8551-2010
McKendry IG, Strawbridge KB, O'Neill NT, Macdonald AM, Liu PSK, Leaitch WR,Anlauf KG, Jaegle L, Fairlie TD, Westphal DL (2007) Trans-Pacific transport ofSaharan dust to western North America: a case study. J Geophys Res112:D01103. doi:10.1029/2006JD007129
McKendry IG, Macdonald AM, Leaitch WR, van Donkelaar A, Zhang Q, Duck T, MartinRV (2008) Trans-Pacific dust events observed at Whistler, British Columbia duringINTEX-B. Atmos Chem Phys 8:6297–6307. doi:10.5194/acp-8-6297-2008
McKendry IG, Gallagher J, Campuzano Jost P, Bertram A, Strawbridge K, Leaitch R,Macdonald AM (2010) Ground-based remote sensing of an elevated forest fireaerosol layer at Whistler, BC: implications for interpretation of mountaintopchemistry. Atmos Chem Phys 10:11921–11930. doi:10.5194/acp-10-11921-2010
McKendry I, Strawbridge K, Karumudi ML, O'Neill N, Macdonald AM, Leaitch R,Jaffe D, Cottle P, Sharma S, Sheridan P, Ogren J (2011) Californian forest fireplumes over Southwestern British Columbia: lidar, sunphotometry, andmountaintop chemistry observations. Atmos Chem Phys 11:465–477.doi:10.5194/acp-11-465-2011
Melen F, Mahieu E, Zander R, Rinsland CP, Demoulin P, Roland G, Delbouille L,Servais C (1998) Vertical column abundances of COF2 above theJungfraujoch station, derived from ground-based infrared solar observations.J Atmos Chem 29:119–134. doi:10.1023/A:1005847829686
Meng Z-Y, Xu X-B, Wang T, Zhang X-Y, Yu X-L, Wang S-F, Lin W-L, Chen Y-Z,Jiang Y-A, An X-Q (2010) Ambient sulfur dioxide, nitrogen dioxide, andammonia at ten background and rural sites in China during 2007-2008.Atmos Environ 44:2625–2631. doi:10.1016/j.atmosenv.2010.04.008
Middleton NJ, Goudie AS (2001) Saharan dust: sources and trajectories. Trans InstBr Geogr 26:165–181. doi:10.1111/1475-5661.00013
Monks PS (2000) A review of the observations and origins of the spring ozonemaximum. Atmos Environ 34:3545–3561. doi:10.1016/S1352-2310(00)00129-1
Monks PS, Granier C, Fuzzi S, Stohl A, Williams ML, Akimoto H, Amann M, Baklanov A,Baltensperger U, Bey I, Blake N, Blake RS, Carslaw K, Cooper OR, Dentener F, FowlerD, Fragkou E, Frost GJ, Generoso S, Ginoux P, Grewe V, Guenther A, Hansson HC,Henne S, Hjorth J, Hofzumahaus A, Huntrieser H, Isaksen ISA, Jenkin ME, Kaiser Jet al (2009) Atmospheric composition change—global and regional air quality.Atmos Environ 43:5268–5350. doi:10.1016/j.atmosenv.2009.08.021
Mu Y, Pang X, Quan J, Zhang X (2007) Atmospheric carbonyl compounds inChinese background area: a remote mountain of the Qinghai-TibetanPlateau. J Geophys Res 112:D22302. doi:10.1029/2006JD008211
Nagashima T, Ohara T, Sudo K, Akimoto H (2010) The relative importance ofvarious source regions on East Asian surface ozone. Atmos Chem Phys10:11305–11322. doi:10.5194/acp-10-11305-2010
Naja M, Lal S, Chand D (2003) Diurnal and seasonal variabilities in surface ozoneat a high altitude site Mt Abu (24.6°N, 72.7°E, 1680m asl) in India. AtmosEnviron 37:4205–4215. doi:10.1016/s1352-2310(03)00565-x
Nakazawa T, Aoki S, Fukabori M, Tanaka M (1984) The concentration ofatmospheric carbon dioxide on the summit of Mt. Fuji (3776m), Japan.J Meteorol Soc Japan 62:688–695
Naoe H, Heintzenberg J, Okada K, Zaizen Y, Hayashi K, Tateishi T, Igarashi Y,Dokiya Y, Kinoshita K (2003) Composition and size distribution of submicrometeraerosol particles observed on Mt. Fuji in the volcanic plumes from Miyakejima.Atmos Environ 37:3047–3055. doi:10.1016/S1352-2310(03)00295-4
Nappo CJ, Caneill JY, Furman RW, Gifford FA, Kaimal JC, Kramer ML, Lockhart TJ,Pendergast MM, Pielke RA, Randerson D, Shreffler JH, Wyngaard JC (1982)
Okamoto and Tanimoto Progress in Earth and Planetary Science (2016) 3:34 Page 46 of 52

The Workshop on the respresentativeness of meteorological observations,June 1981, Boulder, Colo. Bull Am Meteorol Soc 63:761–764
Narita D, Pochanart P, Matsumoto J, Someno K, Tanimoto H, Hirokawa J, Kajii Y, AkimotoH, Nakao M, Katsuno T, Kinjo Y (1999) Seasonal variation of carbon monoxide atremote sites in Japan. Chemospher 1:137–144. doi:10.1016/S1465-9972(99)00023-9
Novelli PC, Masarie KA, Lang PM (1998) Distributions and recent changes ofcarbon monoxide in the lower troposphere. J Geophys Res 103:19015–19033.doi:10.1029/98JD01366
Novelli PC, Masarie KA, Lang PM, Hall BD, Myers RC, Elkins JW (2003) Reanalysis oftropospheric CO trends: effects of the 1997-1998 wildfires. J Geophys Res108:4464. doi:10.1029/2002JD003031
Nyeki S, Baltensperger U, Colbeck I, Jost DT, Weingartner E, Gäggeler HW (1998a)The Jungfraujoch high-alpine research station (3454 m) as a backgroundclean continental site for the measurement of aerosol parameters. J GeophysRes 103:6097-6107. doi:10.1029/97JD03123
Nyeki S, Li F, Weingartner E, Streit N, Colbeck I, Gäggeler HW, Baltensperger U(1998b) The background aerosol size distribution in the free troposphere: ananalysis of the annual cycle at a high-alpine site. J Geophys Res 103:31749-31761.doi:10.1029/1998JD200029
Nyeki S, Halios CH, Baum W, Eleftheriadis K, Flentje H, Gröbner J, Vuilleumier L,Wehrli C (2012) Ground-based aerosol optical depth trends at threehigh-altitude sites in Switzerland and southern Germany from 1995 to 2010.J Geophys Res 117:D18202. doi:10.1029/2012JD017493
Oliveira TS, Pio CA, Alves CA, Silvestre AJD, Evtyugina M, Afonso JV, Fialho P,Legrand M, Puxbaum H, Gelencsér A (2007) Seasonal variation of particulatelipophilic organic compounds at nonurban sites in Europe. J Geophys Res112:D23S09. doi:10.1029/2007JD008504
Oltmans SJ, Levy II H (1994) Surface ozone measurements from a global network.Atmos Environ 28:9–24. doi:10.1016/1352-2310(94)90019-1
Oltmans SJ, Hofmann DJ, Lathrop JA, Harris JM, Komhyr WD, Kuniyuki D (1996a)Tropospheric ozone during Mauna Loa Observatory PhotochemistryExperiment 2 compared to long-term measurements from surfaceand ozonesonde observations. J Geophys Res 101:14569-14580.doi:10.1029/95JD03004
Oltmans SJ, Levy II H, Harris JM, Merrill JT, Moody JL, Lathrop JA, Cuevas E,Trainer M, O′Neill MS, Prospero JM, Vömel H, Johnson BJ (1996b) Summerand spring ozone profiles over the North Atlantic from ozonesondemeasurements. J Geophys Res 101:29179-29200. doi:10.1029/96JD01713
Oltmans SJ, Johnson BJ, Harris JM, Thompson AM, Liu HY, Chan CY, VömelH, Fujimoto T, Brackett VG, Chang WL, Chen J-P, Kim JH, Chan LY,Chang H-W (2004) Tropospheric ozone over the North Pacific fromozonesonde observations. J Geophys Res 109:D15S01. doi:10.1029/2003JD003466
Oltmans SJ, Lefohn AS, Harris JM, Galbally I, Scheel HE, Bodeker G, Brunke E,Claude H, Tarasick D, Johnson BJ, Simmonds P, Shadwick D, Anlauf K,Hayden K, Schmidlin F, Fujimoto T, Akagi K, Meyer C, Nichol S, Davies J,Redondas A, Cuevas E (2006) Long-term changes in tropospheric ozone.Atmos Environ 40:3156–3173. doi:10.1016/j.atmosenv.2006.01.029
Oltmans SJ, Lefohn AS, Shadwick D, Harris JM, Scheel HE, Galbally I, Tarasick DW,Johnson BJ, Brunke EG, Claude H, Zeng G, Nichol S, Schmidlin F, Davies J,Cuevas E, Redondas A, Naoe H, Nakano T, Kawasato T (2013) Recenttropospheric ozone changes—a pattern dominated by slow or no growth.Atmos Environ 67:331–351. doi:10.1016/j.atmosenv.2012.10.057
Ou Yang C-F, Lin N-H, Sheu G-R, Lee C-T, Wang J-L (2012) Seasonal and diurnalvariations of ozone at a high-altitude mountain baseline station in East Asia.Atmos Environ 46:279–288. doi:10.1016/j.atmosenv.2011.09.060
Ou-Yang C-F, Lin N-H, Lin C-C, Wang S-H, Sheu G-R, Lee C-T, Schnell RC, LangPM, Kawasato T, Wang J-L (2014) Characteristics of atmospheric carbonmonoxide at a high-mountain background station in East Asia. AtmosEnviron 89:613–622. doi:10.1016/j.atmosenv.2014.02.060
Owen RC, Cooper OR, Stohl A, Honrath RE (2006) An analysis of the mechanismsof North American pollutant transport to the central North Atlantic lowerfree troposphere. J Geophys Res 111:D23S58. doi:10.1029/2006JD007062
Pandey Deolal S, Brunner D, Steinbacher M, Weers U, Staehelin J (2012)Long-term in situ measurements of NOx and NOy at Jungfraujoch 1998-2009:time series analysis and evaluation. Atmos Chem Phys 12:2551–2566.doi:10.5194/acp-12-2551-2012
Pandey Deolal S, Staehelin J, Brunner D, Cui J, Steinbacher M, Zellweger C,Henne S, Vollmer MK (2013) Transport of PAN and NOy from different sourceregions to the Swiss high alpine site Jungfraujoch. Atmos Environ 64:103–115.doi:10.1016/j.atmosenv.2012.08.021
Parrington JR, Zoller WH (1984) Diurnal and longer-term temporal changes in thecomposition of atmospheric particles at Mauna Loa, Hawaii. J Geophys Res89:2522–2534. doi:10.1029/JD089iD02p02522
Parrington JR, Zoller WH, Aras NK (1983) Asian dust: seasonal transport to theHawaiian islands. Science 220:195–197. doi:10.1126/science.220.4593.195
Parrish DD, Stohl A, Forster C, Atlas EL, Blake DR, Goldan PD, Kuster WC, de GouwJA (2007) Effects of mixing on evolution of hydrocarbon ratios in thetroposphere. J Geophys Res 112:D10S34. doi:10.1029/2006JD007583
Parrish DD, Law KS, Staehelin J, Derwent R, Cooper OR, Tanimoto H, Volz-ThomasA, Gilge S, Scheel H-E, Steinbacher M, Chan E (2012) Long-term changes inlower tropospheric baseline ozone concentrations at northern mid-latitudes.Atmos Chem Phys 12:11485–11504. doi:10.5194/acp-12-11485-2012
Parrish DD, Law KS, Staehelin J, Derwent R, Cooper OR, Tanimoto H, Volz-ThomasA, Gilge S, Scheel H-E, Steinbacher M, Chan E (2013) Lower troposphericozone at northern midlatitudes: changing seasonal cycle. Geophys Res Lett40:1631–1636. doi:10.1002/grl.50303
Parrish DD, Lamarque J-F, Naik V, Horowitz L, Shindell DT, Staehelin J, Derwent R, CooperOR, Tanimoto H, Voltz-Thomas A, Glige S, Scheel H-E, Steinbacher M, Fröhlich M(2014) Long-term changes in lower tropospheric baseline ozone concentrations:comparing chemistry-climate models and observations at northern midlatitudes.J Geophys Res 119:5719–5736. doi:10.1002/2013JD021435
Penkett SA, Brice KA (1986) The spring maximum in photo-oxidants in the NorthernHemisphere troposphere. Nature 319:655–657. doi:10.1038/319655a0
Perry KD, Cahill TA, Schnell RC, Harris JM (1999) Long-range transport ofanthropogenic aerosols to the National Oceanic and AtmosphericAdministration baseline station at Mauna Loa Observatory, Hawaii. J GeophysRes 104:18521–18533. doi:10.1029/1998JD100083
Peterson MC, Honrath RE, Parrish DD, Oltmans SJ (1998) Measurements of nitrogenoxides and a simple model of NOy fate in the remote North Atlantic marineatmosphere. J Geophys Res 103:13489–13503. doi:10.1029/97JD02307
Pfister G, Hess PG, Emmons LK, Lamarque J-F, Wiedinmyer C, Edwards DP, PétronG, Gille JC, Sachse GW (2005) Quantifying CO emissions from the 2004Alaskan wildfires using MOPITT CO data. Geophys Res Lett 32:L11809.doi:10.1029/2005GL022995
Pfister GG, Emmons LK, Hess PG, Honrath R, Lamarque J-F, Val Martin M, OwenRC, Avery MA, Browell EV, Holloway JS, Nedelec P, Purvis R, Ryerson TB,Sachse GW, Schlager H (2006) Ozone production from the 2004 NorthAmerican boreal fires. J Geophys Res 111:D24S07. doi:10.1029/2006JD007695
Pierce JR, Leaitch WR, Liggio J, Westervelt DM, Wainwright CD, Abbatt JPD, AhlmL, Al-Basheer W, Cziczo DJ, Hayden KL, Lee AKY, Li S-M, Russell LM, SjostedtSJ, Strawbridge KB, Travis M, Vlasenko A, Wentzell JJB, Wiebe HA, Wong JPS,Macdonald AM (2012) Nucleation and condensational growth to CCN sizesduring a sustained pristine biogenic SOA event in a forested mountainvalley. Atmos Chem Phys 12:3147–3163. doi:10.5194/acp-12-3147-2012
Pochanart P, Hirokawa J, Kajii Y, Akimoto H, Nakao M (1999) Influence ofregional-scale anthropogenic activity in northeast Asia on seasonal variationsof surface ozone and carbon monoxide observed at Oki, Japan. J GeophysRes 104:3621–3631. doi:10.1029/1998JD100071
Pochanart P, Akimoto H, Maksyutov S, Staehelin J (2001) Surface ozone at theSwiss Alpine site Arosa: the hemispheric background and the influence oflarge-scale anthropogenic emissions. Atmos Environ 35:5553–5566. doi:10.1016/S1352-2310(01)00236-9
Pochanart P, Akimoto H, Kajii Y, Potemkin VM, Khodzher TV (2003) Regionalbackground ozone and carbon monoxide variations in remote Siberia/EastAsia. J Geophys Res 108:4028. doi:10.1029/2001jd001412
Pochanart P, Kato S, Katsuno T, Akimoto H (2004) Eurasian continental backgroundand regionally polluted levels of ozone and CO observed in northeast Asia.Atmos Environ 38:1325–1336. doi:10.1016/j.atmosenv.2003.11.014
Prather MJ (1996) Time scales in atmospheric chemistry: theory, GWPs for CH4 and CO,and runaway growth. Geophys Res Lett 23:2597–2600. doi:10.1029/96GL02371
Primbs T, Piekarz A, Wilson G, Schmedding D, Higginbotham C, Field J, SimonichSM (2008a) Influence of Asian and western United States urban areas andfires on the atmospheric transport of polycyclic aromatic hydrocarbons,polychlorinated biphenyls, and fluorotelomer alcohols in the western UnitedStates. Environ Sci Technol 42:6385-6391. doi:10.1021/es702160d
Primbs T, Wilson G, Schmedding D, Higginbotham C, Simonich SM (2008b)Influence of Asian and western United States agricultural areas and fires onthe atmospheric transport of pesticides in the western United States. EnvironSci Technol 42:6519-6525. doi:10.1021/es800511x
Prinn RG, Huang J, Weiss RF, Cunnold DM, Fraser PJ, Simmonds PG, McCulloch A,Harth C, Salameh P, O’Doherty S, Wang RHJ, Porter L, Miller BR (2001)
Okamoto and Tanimoto Progress in Earth and Planetary Science (2016) 3:34 Page 47 of 52

Evidence for substantial variations of atmospheric hydroxyl radicalsin the past two decades. Science 292:1882–1888. doi:10.1126/science.1058673
Prospero JM, Schmitt R, Cuevas E, Savoie DL, Graustein WC, Turekian KK,Volz-Thomas A, Díaz A, Oltmans SJ, Levy II H (1995) Temporal variability ofsummer-time ozone and aerosols in the free troposphere over the easternNorth Atlantic. Geophys Res Lett 22:2925–2928. doi:10.1029/95gl02791
Prospero JM, Ginoux P, Torres O, Nicholson S, Gill TE (2002) Environmentalcharacterization of global sources of atmospheric soil dust identified withthe Nimbus 7 Total Ozone Mapping Spectrometer (TOMS) absorbing aerosolproduct. Rev Geophys 40:1002. doi:10.1029/2000rg000095
Puentedura O, Gil M, Saiz-Lopez A, Hay T, Navarro-Comas M, Gómez-Pelaez A, Cuevas E,Iglesias J, Gomez L (2012) Iodine monoxide in the north subtropical freetroposphere. Atmos Chem Phys 12:4909–4921. doi:10.5194/acp-12-4909-2012
Putaud J-P, Van Dingenen R, Dell’Acqua A, Raes F, Matta E, Decesari S, FacchiniMC, Fuzzi S (2004) Size-segregated aerosol mass closure and chemicalcomposition in Monte Cimone (I) during MINATROC. Atmos Chem Phys 4:889–902. doi:10.5194/acp-4-889-2004
Ram K, Sarin MM (2009) Absorption coefficient and site-specific mass absorptionefficiency of elemental carbon in aerosols over urban, rural, and high-altitudesites in India. Environ Sci Technol 42:8233–8239. doi:10.1021/es9011542
Ram K, Sarin MM, Hegde P (2008) Atmospheric abundances of primary and secondarycarbonaceous species at two high-altitude sites in India: Sources and temporalvariability. Atmos Environ 42:6785–6796. doi:10.1016/j.atmosenv.2008.05.031
Ramanathan V, Crutzen PJ (2003) New directions: atmospheric brown “clouds”.Atmos Environ 37:4033–4035. doi:10.1016/S1352-2310(03)00536-3
Rastogi N, Sarin MM (2005) Long-term characterization of ionic species inaerosols from urban and high-altitude sites in western India: role of mineraldust and anthropogenic sources. Atmos Environ 39:5541–5554. doi:10.1016/j.atmosenv.2005.06.011
Rastogi N, Sarin MM (2008) Atmospheric 210Pb and 7Be in ambient aerosols overlow- and high-altitude sites in semiarid region: temporal variability andtransport processes. J Geophys Res 113:D11103. doi:10.1029/2007jd009298
Reidmiller DR, Jaffe DA, Chand D, Strode S, Swartzendruber P, Wolfe GM, ThorntonJA (2009) Interannual variability of long-range transport as seen at the Mt.Bachelor observatory. Atmos Chem Phys 9:557–572. doi:10.5194/acp-9-557-2009
Reidmiller DR, Jaffe DA, Fischer EV, Finley B (2010) Nitrogen oxides in theboundary layer and free troposphere at the Mt. Bachelor Observatory. AtmosChem Phys 10:6043–6062. doi:10.5194/acp-10-6043-2010
Ridley BA, Robinson E (1992) The Mauna Loa Observatory photochemistryexperiment. J Geophys Res 97:10285–10290. doi:10.1029/91jd00945
Ridley B, Walega J, Hübler G, Montzka D, Atlas E, Hauglustaine D, Grahek F, Lind J,Campos T, Norton R, Greenberg J, Schauffler S, Oltmans S, Whittlestone S(1998) Measurements of NOx and PAN and estimates of O3 production overthe seasons during Mauna Loa Observatory Photochemistry Experiment 2. JGeophys Res 103:8323–8339. doi:10.1029/98JD00075
Rieder HE, Staehelin J, Maeder JA, Peter T, Ribatet M, Davison AC, Stübi R, WeihsP, Holawe F (2010a) Extreme events in total ozone over Arosa—part 1:application of extreme value theory. Atmos Chem Phys 10:10021-10031.doi:10.5194/acp-10-10021-2010
Rieder HE, Staehelin J, Maeder JA, Peter T, Ribatet M, Davison AC, Stübi R, WeihsP, Holawe F (2010b) Extreme events in total ozone over Arosa—part 2:fingerprints of atmospheric dynamics and chemistry and effects on meanvalues and long-term changes. Atmos Chem Phys 10:10033-10045.doi:10.5194/acp-10-10033-2010
Rinsland CP, Zander R, Demoulin P (1991) Ground-based infrared measurementsof HNO3 total column abundances: long-term trend and variability. JGeophys Res 96:9379–9389. doi:10.1029/91JD00609
Rinsland CP, Zander R, Mahieu E, Demoulin P, Goldman A, Ehhalt DH, Rudolph J(1992) Ground-based infrared measurements of carbonyl sulfide total columnabundances: long-term trends and variability. J Geophys Res 97:5995–6002.doi:10.1029/92JD00040
Rinsland CP, Zander R, Demoulin P, Mahieu E (1996) CLONO2 total verticalcolumn abundances above the Jungfraujoch Station, 1986-1994: long-termtrend and winter-spring enhancements. J Geophys Res 101:3891–3899.doi:10.1029/95JD03349
Rinsland CP, Mahieu E, Zander R, Demoulin P, Forrer J, Buchmann B (2000)Free tropospheric CO, C2H6, and HCN above central Europe: recentmeasurements from the Jungfraujoch station including the detection ofelevated columns during 1998. J Geophys Res 105:24235–24249. doi:10.1029/2000JD900371
Rinsland CP, Mahieu E, Zander R, Jones NB, Chipperfield MP, Goldman A,Anderson J, Russell JM III, Demoulin P, Notholt J, Toon GC, Blavier J-F, Sen B,Sussmann R, Wood SW, Meier A, Griffith DWT, Chiou LS, Murcray FJ, StephenTM, Hase F, Mikuteit S, Schulz A, Blumenstock T (2003) Long-term trends ofinorganic chlorine from ground-based infrared solar spectra: past increasesand evidence for stabilization. J Geophys Res 108:4252. doi:10.1029/2002JD003001
Rinsland CP, Chiou L, Mahieu E, Zander R, Boone CD, Bernath PF (2008)Measurements of long-term changes in atmospheric OCS (carbonyl sulfide)from infrared solar observations. J Quant Spectrosc Radiat Transf 109:2679–2686.doi:10.1016/j.jqsrt.2008.07.008
Rodríguez S, González Y, Cuevas E, Ramos R, Romero PM, Abreu-Afonso J,Redondas A (2009) Atmospheric nanoparticle observations in the low freetroposphere during upward orographic flows at Izaña Mountain Observatory.Atmos Chem Phys 9:6319–6335. doi:10.5194/acp-9-6319-2009
Rodríguez S, Alastuey A, Alonso-Pérez S, Querol X, Cuevas E, Abreu-Afonso J,Viana M, Pérez N, Pandolfi M, de la Rosa J (2011) Transport of desert dustmixed with North African industrial pollutants in the subtropical Saharan AirLayer. Atmos Chem Phys 11:6663–6685. doi:10.5194/acp-11-6663-2011
Rodrı́guez S, Torres C, Guerra J-C, Cuevas E (2004) Transport pathways of ozoneto marine and free-troposphere sites in Tenerife, Canary Islands. AtmosEnviron 38:4733–4747. doi:10.1016/j.atmosenv.2004.05.021
Rose C, Sellegri K, Velarde F, Moreno I, Ramonet M, Weinhold K, Krejci R, Ginot P,Andrade M, Wiedensohler A, Laj P (2015) Frequent nucleation events at thehigh altitude station of Chacaltaya (5240 m a.s.l.), Bolivia. Atmos Environ102:18–29. doi:10.1016/j.atmosenv.2014.11.015
Ruckstuhl AF, Henne S, Reimann S, Steinbacher M, Vollmer MK, O’Doherty S,Buchmann B, Hueglin C (2012) Robust extraction of baseline signal ofatmospheric trace species using local regression. Atmos Meas Tech 5:2613–2624.doi:10.5194/amt-5-2613-2012
Salisbury G, Williams J, Gros V, Bartenbach S, Xu X, Fischer H, Kormann R, de ReusM, Zöllner M (2006) Assessing the effect of a Saharan dust storm onoxygenated organic compounds at Izaña, Tenerife (July-August 2002). JGeophys Res 111:D22303. doi:10.1029/2005JD006840
Sandrini S, Giulianelli L, Decesari S, Fuzzi S, Cristofanelli P, Marinori A, Bonasoni P, ChiariM, Calzolai G, Canepari S, Perrino C, Facchini MC (2014) In situ physical and chemicalcharacterisation of the Eyjafjallajökull aerosol plume in the free troposphere overItaly. Atmos Chem Phys 14:1075–1092. doi:10.5194/acp-14-1075-2014
Satsumabayashi H, Kawamura M, Katsuno T, Futaki K, Murano K, Carmichael GR,Kajino M, Horiguchi M, Ueda H (2004) Effects of Miyake volcanic effluents onairborne particles and precipitation in central Japan. J Geophys Res 109:D19202. doi:10.1029/2003JD004204
Scarnato B, Staehelin J, Stübi R, Schill H (2010) Long-term total ozoneobservations at Arosa (Switzerland) with Dobson and Brewer instruments(1988-2007). J Geophys Res 115:D13306. doi:10.1029/2009JD011908
Schäfer K, Thomas W, Peters A, Ries L, Obleitner F, Schnelle-Kreis J, Birmili W,Diemer J, Fricke W, Junkermann W, Pitz M, Emeis S, Forkel R, Suppan P,Flentje H, Gilge S, Wichmann HE, Meinhardt F, Zimmermann R, WeinholdK, Soentgen J, Münkel C, Freuer C, Cyrys J (2011) Influences of the 2010Eyjafjallajökull volcanic plume on air quality in the northern Alpineregion. Atmos Chem Phys 11:8555–8575. doi:10.5194/acp-11-8555-2011
Schaub D, Brunner D, Boersma KF, Keller J, Folini D, Buchmann B,Berresheim H, Staehelin J (2007) SCIAMACHY tropospheric NO2 overSwitzerland: estimates of NOx lifetimes and impact of the complexAlpine topography on the retrieval. Atmos Chem Phys 7:5971–5987.doi:10.5194/acp-7-5971-2007
Scheel HE, Areskoug H, Geiß H, Gomiscek B, Granby K, Haszpra L, Klasinc L,Kley D, Laurila T, Lindskog A, Roemer M, Schmitt R, Simmonds P, Solberg S,Toupance G (1997) On the spatial distribution and seasonal variation oflower-troposphere ozone over Europe. J Atmos Chem 28:11–28. doi:10.1023/A:1005882922435
Schmitt R, Volz-Thomas A (1997) Climatology of ozone, PAN, CO, and NMHC inthe free troposphere over the southern North Atlantic. J Atmos Chem28:245–262. doi:10.1023/A:1005801515531
Schneider M, Blumenstock T, Chipperfield MP, Hase F, Kouker W, Reddmann T,Ruhnke R, Cuevas E, Fischer H (2005a) Subtropical trace gas profilesdetermined by ground-based FTIR spectroscopy at Izaña (28°N, 16°W):five-year record, error analysis, and comparison with 3-D CTMs. Atmos ChemPhys 5:153-167. doi:10.5194/acp-5-153-2005
Schneider M, Blumenstock T, Hase F, Höpfner M, Cuevas E, Redondas A, SanchoJM (2005b) Ozone profiles and total column amounts derived at Izaña,
Okamoto and Tanimoto Progress in Earth and Planetary Science (2016) 3:34 Page 48 of 52

Tenerife Island, from FTIR solar absorption spectra, and its validation by anintercomparison to ECC-sonde and Brewer spectrometer measurements. JQuant Spectrosc Radiat Transf 91:245-274. doi:10.1016/j.jqsrt.2004.05.067
Schneider M, Redondas A, Hase F, Guirado C, Blumenstock T, Cuevas E (2008)Comparison of ground-based Brewer and FTIR total O3 monitoringtechniques. Atmos Chem Phys 8:5535–5550. doi:10.5194/acp-8-5535-2008
Schöner W, Böhm R, Auer I (2012) 125 years of high-mountain research at SonnblickObservatory (Austrian Alps)—from “the house above the clouds” to a uniqueresearch platform. Theor Appl Climatol 110:491–498. doi:10.1007/s00704-012-0689-8
Schuepbach E, Davies TD, Massacand AC (1999) An unusual springtime ozoneepisode at high elevation in the Swiss Alps: contributions both fromcross-tropopause exchange and from the boundary layer. Atmos Environ33:1735–1744. doi:10.1016/S1352-2310(98)00232-5
Schuepbach E, Friedli TK, Zanis P, Monks PS, Penkett SA (2001) State space analysis ofchanging seasonal ozone cycles (1988–1997) at Jungfraujoch (3580 m above sealevel) in Switzerland. J Geophys Res 106:20413–20427. doi:10.1029/2000JD900591
Schultz M, Schmitt R, Thomas K, Volz-Thomas A (1998) Photochemical boxmodeling of long-range transport from North America to Tenerife during theNorth Atlantic Regional Experiment (NARE) 1993. J Geophys Res 103:13477–13488.doi:10.1029/97JD01481
Schwikowski M, Seibert P, Baltensperger U, Gäggeler HW (1995) A study of anoutstanding Saharan dust event at the high-alpine site Jungfraujoch,Switzerland. Atmos Environ 29:1829–1842. doi:10.1016/1352-2310(95)00060-C
Seibert P (1990) South foehn studies since the ALPEX experiment. MeteorolAtmos Phys 43:91–103. doi:10.1007/BF01028112
Seibert P, Kromp-Kolb H, Kasper A, Kalina M, Puxbaum H, Jost DT, Schwikowski M,Baltensperger U (1998) Transport of polluted boundary layer air from the PoValley to high-alpine sites. Atmos Environ 32:3953–3965. doi:10.1016/S1352-2310(97)00174-X
Seinfeld JH, Pandis SN (2006) Atmospheric chemistry and physics: from airpollution to climate change, 2nd edn. Wiley, Hoboken
Sellegri K, Laj P, Venzac H, Boulon J, Picard D, Villani P, Bonasoni P, Marinoni A,Cristofanelli P, Vuillermoz E (2010) Seasonal variations of aerosol sizedistributions based on long-term measurements at the high altitudeHimalayan site of Nepal Climate Observatory-Pyramid (5079 m), Nepal.Atmos Chem Phys 10:10679–10690. doi:10.5194/acp-10-10679-2010
Semenov VK, Smirnov A, Aref’ev VN, Sinyakov VP, Sorokina LI, Ignatova NI (2005)Aerosol optical depth over the mountainous region in central Asia (Issyk-KulLake, Kyrgyzstan). Geophys Res Lett 32:L05807. doi:10.1029/2004GL021746
Senik IA, Elansky NF (2001) Surface ozone concentration measurements at theKislovodsk high-altitude scientific station: temporal variations and trends. IzvAtmos Ocean Phys 37:110–119
Senik IA, Elansky NF, Belikov IB, Lisitsyna LV, Galaktionov VV, Kortunova ZV (2005) Mainpatterns of the temporal variability of surface ozone in the region of the town ofKislovodsk at 870 and 2070 m above sea level. Izv Atmos Ocean Phys 41:67–79
Sepúlveda E, Schneider M, Hase F, García OE, Gomez-Pelaez A, Dohe S, BlumenstockT, Guerra JC (2012) Long-term validation of tropospheric column-averaged CH4
mole fractions obtained by mid-infrared ground-based FTIR spectrometry.Atmos Meas Tech 5:1425–1441. doi:10.5194/amt-5-1425-2012
Sharma UK, Kajii Y, Akimoto H (2000) Seasonal variation of C2–C6 NMHCs atHappo, a remote site in Japan. Atmos Environ 34:4447–4458. doi:10.1016/S1352-2310(00)00162-X
Sheu G-R, Lin N-H, Wang J-L, Lee C-T, Ou Yang C-F, Wang S-H (2010) Temporaldistribution and potential sources of atmospheric mercury measured at ahigh-elevation background station in Taiwan. Atmos Environ 44:2393–2400.doi:10.1016/j.atmosenv.2010.04.009
Sholkovitz ER, Sedwick PN, Church TM (2009) Influence of anthropogeniccombustion emissions on the deposition of soluble aerosol iron to theocean: empirical estimates for island sites in the North Atlantic. GeochimCosmochim Acta 73:3981–4003. doi:10.1016/j.gca.2009.04.029
Škerlak B, Sprenger M, Wernli H (2014) A global climatology of stratosphere-troposphere exchange using the ERA-Interim data set from 1979 to 2011.Atmos Chem Phys 14:913–937. doi:10.5194/acp-14-913-2014
Smirnov A, Holben BN, Slutsker I, Welton EJ, Formenti P (1998) Optical propertiesof Saharan dust during ACE 2. J Geophys Res 103:28079–28092. doi:10.1029/98JD01930
Sofen ED, Bowdalo D, Evans MJ (2016) How to most effectively expand theglobal surface ozone observing network. Atmos Chem Phys 16:1445–1457.doi:10.5194/acp-16-1445-2016
Solomon S (1999) Stratospheric ozone depletion: a review of concepts andhistory. Rev Geophys 37:275–316. doi:10.1029/1999RG900008
Solomon S, Daniel JS, Neely RR III, Vernier J-P, Dutton EG, Thomason LW (2011)The persistently variable “background” stratospheric aerosol layer and globalclimate change. Science 333:866–870. doi:10.1126/science.1206027
Spangl W, Schneider J, Moosmann L, Nagl C (2007) Representativeness and classificationof air quality monitoring stations. Final report. Umweltbundesamt, Vienna
Spivakovsky CM, Yevich R, Logan JA, Wofsy SC, McElroy MB (1990) TroposphericOH in a three‐dimensional chemical tracer model: An assessment based onobservations of CH3CCl3. J Geophys Res Atmos 95:18441–18471. doi:10.1029/JD095iD11p18441
Staehelin J, Thudium J, Buehler R, Volz-Thomas A, Graber W (1994) Trends insurface ozone concentrations at Arosa (Switzerland). Atmos Environ 28:75–87.doi:10.1016/1352-2310(94)90024-8
Staehelin J, Kegel R, Harris NRP (1998a) Trend analysis of the homogenized totalozone series of Arosa (Switzerland), 1926–1996. J Geophys Res 103:8389-8399. doi:10.1029/97JD03650
Staehelin J, Renaud A, Bader J, McPeters R, Viatte P, Hoegger B, Bugnion V, GiroudM, Schill H (1998b) Total ozone series at Arosa (Switzerland): homogenizationand data comparison. J Geophys Res 103:5827-5841. doi:10.1029/97JD02402
Stevenson DS, Dentener FJ, Schultz MG, Ellingsen K, van Noije TPC, Wild O, ZengG, Amann M, Atherton CS, Bell N, Bergmann DJ, Bey I, Butler T, Cofala J,Collins WJ, Derwent RG, Doherty RM, Drevet J, Eskes HJ, Fiore AM, Gauss M,Hauglustaine DA, Horowitz LW, Isaksen ISA, Krol MC, Lamarque J-F, LawrenceMG, Montanaro V, Müller J-F, Pitari G et al (2006) Multimodel ensemblesimulations of present-day and near-future tropospheric ozone. J GeophysRes 111:D08301. doi:10.1029/2005JD006338
Stohl A, Eckhardt S, Forster C, James P, Spichtinger N, Seibert P (2002) Areplacement for simple back trajectory calculations in the interpretation ofatmospheric trace substance measurements. Atmos Environ 36:4635–4648.doi:10.1016/S1352-2310(02)00416-8
Streets DG, Bond TC, Carmichael GR, Fernandes SD, Fu Q, He D, Klimont Z,Nelson SM, Tsai NY, Wang MQ, Woo J-H, Yarber KF (2003) An inventory ofgaseous and primary aerosol emissions in Asia in the year 2000. J GeophysRes 108:8809. doi:10.1029/2002JD003093
Streets DG, Canty T, Carmichael GR, de Foy B, Dickerson RR, Duncan BN, EdwardsDP, Haynes JA, Henze DK, Houyoux MR, Jacob DJ, Krotkov NA, Lamsal LN, LiuY, Lu Z, Martin RV, Pfister GC, Pinder RW, Salawitch RJ, Wecht KJ (2013)Emissions estimation from satellite retrievals: a review of current capability.Atmos Environ 77:1011–1042. doi:10.1016/j.atmosenv.2013.05.051
Strode SA, Jaeglé L, Jaffe DA, Swartzendruber PC, Selin NE, Holmes C, YantoscaRM (2008) Trans-Pacific transport of mercury. J Geophys Res 113:D15305.doi:10.1029/2007JD009428
Sudo K, Akimoto H (2007) Global source attribution of tropospheric ozone:long-range transport from various source regions. J Geophys Res 112:D12302.doi:10.1029/2006JD007992
Suzuki I, Hayashi K, Igarashi Y, Takahashi H, Sawa Y, Ogura N, Akagi T, Dokiya Y(2008) Seasonal variation of water-soluble ion species in the atmosphericaerosols at the summit of Mt. Fuji. Atmos Environ 42:8027–8035. doi:10.1016/j.atmosenv.2008.06.014
Suzuki I, Igarashi Y, Dokiya Y, Akagi T (2010) Two extreme types of mixing of dustwith urban aerosols observed in Kosa particles: “after” mixing and “on-the-way”mixing. Atmos Environ 44:858–866. doi:10.1016/j.atmosenv.2009.11.030
Swartzendruber PC, Jaffe DA, Prestbo EM, Weiss-Penzias P, Selin NE, Park R, JacobDJ, Strode S, Jaeglé L (2006) Observations of reactive gaseous mercury in thefree troposphere at the Mount Bachelor Observatory. J Geophys Res111:D24301. doi:10.1029/2006JD007415
Takahama S, Schwartz RE, Russell LM, Macdonald AM, Sharma S, Leaitch WR(2011) Organic functional groups in aerosol particles from burning andnon-burning forest emissions at a high-elevation mountain site. AtmosChem Phys 11:6367–6386. doi:10.5194/acp-11-6367-2011
Tanimoto H (2009) Increase in springtime tropospheric ozone at a mountainoussite in Japan for the period 1998–2006. Atmos Environ 43:1358–1363.doi:10.1016/j.atmosenv.2008.12.006
Tanimoto H, Sawa Y, Matsueda H, Uno I, Ohara T, Yamaji K, Kurokawa J, Yonemura S(2005) Significant latitudinal gradient in the surface ozone spring maximumover East Asia. Geophys Res Lett 32:L21805. doi:10.1029/2005GL023514
Tanimoto H, Mukai H, Sawa Y, Matsueda H, Yonemura S, Wang T, Poon S, WongA, Lee G, Jung JY, Kim KR, Lee MH, Lin NH, Wang JL, Ou-Yang CF, Wu CF,Akimoto H, Pochanart P, Tsuboi K, Doi H, Zellweger C, Klausen J (2007) Directassessment of international consistency of standards for ground-level ozone:strategy and implementation toward metrological traceability network inAsia. J Environ Monit 9:1183–1193. doi:10.1039/b701230f
Okamoto and Tanimoto Progress in Earth and Planetary Science (2016) 3:34 Page 49 of 52

Tanimoto H, Ohara T, Uno I (2009) Asian anthropogenic emissions and decadaltrends in springtime tropospheric ozone over Japan: 1998–2007. GeophysRes Lett 36:L23802. doi:10.1029/2009GL041382
Tanimoto H, Zbinden RM, Thouret V, Nédélec P (2015) Consistency of troposphericozone observations made by different platforms and techniques in the globaldatabases. Tellus B 67:27073. doi:10.3402/tellusb.v67.27073
Tarasova OA, Elansky NF, Kuznetsov GI, Kuznetsova IN, Senik IA (2003)Impact of air transport on seasonal variations and trends of surfaceozone at Kislovodsk high mountain station. J Atmos Chem 45:245–249.doi:10.5194/acp-9-4157-2009
Tarasova OA, Brenninkmeijer CAM, Jöckel P, Zvyagintsev AM, Kuznetsov GI (2007) Aclimatology of surface ozone in the extra tropics: cluster analysis of observationsand model results. Atmos Chem Phys 7:6099–6117. doi:10.5194/acp-7-6099-2007
Tarasova OA, Senik IA, Sosonkin MG, Cui J, Staehelin J, Prévôt ASH (2009) Surfaceozone at the Caucasian site Kislovodsk High Mountain Station and the SwissAlpine site Jungfraujoch: data analysis and trends (1990–2006). Atmos ChemPhys 9:4157–4175. doi:10.5194/acp-9-4157-2009
Thompson AM, Cicerone RJ (1986) Possible perturbations to atmospheric CO,CH4, and OH. J Geophys Res 91:10853–10864. doi:10.1029/JD091iD10p10853
Thoning KW, Tans PP, Komhyr WD (1989) Atmospheric carbon dioxide at MaunaLoa Observatory 2. Analysis of the NOAA GMCC data, 1974–1985. J GeophysRes 94:8549–8565. doi:10.1029/JD094iD06p08549
Timonen H, Ambrose JL, Jaffe DA (2013) Oxidation of elemental Hg inanthropogenic and marine airmasses. Atmos Chem Phys 13:2827–2836.doi:10.5194/acp-13-2827-2013
Toh YY, Lim SF, von Glasow R (2013) The influence of meteorological factors andbiomass burning on surface ozone concentrations at Tanah Rata, Malaysia.Atmos Environ 70:435–446. doi:10.1016/j.atmosenv.2013.01.018
Tressol M, Ordonez C, Zbinden R, Brioude J, Thouret V, Mari C, Nedelec P,Cammas J-P, Smit H, Patz H-W, Volz-Thomas A (2008) Air pollution duringthe 2003 European heat wave as seen by MOZAIC airliners. Atmos ChemPhys 8:2133–2150. doi:10.5194/acp-8-2133-2008
Trickl T, Cooper OR, Eisele H, James P, Mücke R, Stohl A (2003) Intercontinentaltransport and its influence on the ozone concentrations over central Europe:three case studies. J Geophys Res 108:8530. doi:10.1029/2002JD002735
Tsutsumi Y, Zaizen Y, Makino Y (1994) Tropospheric ozone measurement at thetop of Mt. Fuji. Geophys Res Lett 21:1727–1730. doi:10.1029/94GL01107
Tsutsumi Y, Igarashi Y, Zaizen Y, Makino Y (1998) Case studies of troposphericozone events observed at the summit of Mount Fuji. J Geophys Res103:16935–16951. doi:10.1029/98JD01152
Turekian KK, Nozaki Y, Benninger LK (1977) Geochemistry of atmospheric radonand radon products. Annu Rev Earth Planet Sci 5:227–255. doi:10.1146/annurev.ea.05.050177.001303
Turnbull JC, Lehman SJ, Miller JB, Sparks RJ, Southon JR, Tans PP (2007) A newhigh precision 14CO2 time series for North American continental air. JGeophys Res 112:D11310. doi:10.1029/2006JD008184
Turquety S, Logan JA, Jacob DJ, Hudman RC, Leung FY, Heald CL, Yantosca RM, WuS, Emmons LK, Edwards DP, Sachse GW (2007) Inventory of boreal fire emissionsfor North America in 2004: importance of peat burning and pyroconvectiveinjection. J Geophys Res 112:D12S03. doi:10.1029/2006JD007281
Tuzson B, Henne S, Brunner D, Steinbacher M, Mohn J, Buchmann B, Emmenegger L(2011) Continuous isotopic composition measurements of tropospheric CO2 atJungfraujoch (3580 m a.s.l.), Switzerland: real-time observation of regional pollutionevents. Atmos Chem Phys 11:1685–1696. doi:10.5194/acp-11-1685-2011
U.S. Environmental Protection Agency (2006) Air quality criteria for ozone andrelated photochemical oxidants (2006 Final). U.S. Environmental ProtectionAgency, Washington, DC
U.S. Environmental Protection Agency Clean Air Markets Division Clean Air Statusand Trends Network (CASTNET) [Ozone - Hourly, Filter Pack Concentration-Weekly]. http://www.epa.gov/castnet. Accessed 14 Jan 2016
Umann B, Arnold F, Schaal C, Hanke M, Uecker J, Aufmhoff H, Balkanski Y, VanDingenen R (2005) Interaction of mineral dust with gas phase nitric acid andsulfur dioxide during the MINATROC II field campaign: first estimate of theuptake coefficient γHNO3 from atmospheric data. J Geophys Res 110:D22306.doi:10.1029/2005JD005906
Usher CR, Michel AE, Grassian VH (2003) Reactions on mineral dust. Chem Rev103:4883–4940. doi:10.1021/cr020657y
Val Martín M, Honrath RE, Owen RC, Pfister G, Fialho P, Barata F (2006)Significant enhancements of nitrogen oxides, black carbon, and ozone inthe North Atlantic lower free troposphere resulting from North Americanboreal wildfires. J Geophys Res 111:D23S60. doi:10.1029/2006JD007530
Val Martin M, Honrath RE, Owen RC, Lapina K (2008a) Large-scale impacts ofanthropogenic pollution and boreal wildfires on the nitrogen oxides overthe central North Atlantic region. J Geophys Res 113:D17308. doi:10.1029/2007JD009689
Val Martin M, Honrath RE, Owen RC, Li QB (2008b) Seasonal variation of nitrogenoxides in the central North Atlantic lower free troposphere. J Geophys Res113:D17307. doi:10.1029/2007JD009688
Van der A RJ, Eskes HJ, Boersma KF, van Noije TPC, Van Roozendae M, De SmedtI, Peters DHMU, Meijer EW (2008) Trends, seasonal variability and dominantNOx source derived from a ten year record of NO2 measured from space.J Geophys Res 113:D04302. doi:10.1029/2007JD009021
Van Dingenen R, Putaud J-P, Martins-Dos Santos S, Raes F (2005) Physical aerosolproperties and their relation to air mass origin at Monte Cimone (Italy)during the first MINATROC campaign. Atmos Chem Phys 5:2203–2226.doi:10.5194/acp-5-2203-2005
VanCuren RA (2003) Asian aerosols in North America: extracting the chemicalcomposition and mass concentration of the Asian continental aerosol plumefrom long‐term aerosol records in the western United States. J Geophys Res108:D20. doi:10.1029/2003JD003459
VanCuren RA, Cahill TA (2002) Asian aerosols in North America: frequency andconcentration of fine dust. J Geophys Res 107:D24. doi:10.1029/2002JD002204
VanCuren RA, Cliff SS, Perry KD, Jimenez-Cruz M (2005) Asian continental aerosolpersistence above the marine boundary layer over the eastern North Pacific:continuous aerosol measurements from Intercontinental Transport andChemical Transformation 2002 (ITCT 2K2). J Geophys Res 110:D09S90.doi:10.1029/2004JD004973
Verheggen B, Cozic J, Weingartner E, Bower K, Mertes S, Connolly P, Gallagher M,Flynn M, Choularton T, Baltensperger U (2007) Aerosol partitioning betweenthe interstitial and the condensed phase in mixed-phase clouds. J GeophysRes 112:D23202. doi:10.1029/2007JD008714
Verver G, Raes F, Vogelezang D, Johnson D (2000) The 2nd AerosolCharacterization Experiment (ACE-2): meteorological and chemical context.Tellus B 52:126–140. doi:10.1034/j.1600-0889.2000.00090.x
Viatte C, Schneider M, Redondas A, Hase F, Eremenko M, Chelin P, Flaud J-M,Blumenstock T, Orphal J (2011) Comparison of ground-based FTIR andBrewer O3 total column with data from two different IASI algorithms andfrom OMI and GOME-2 satellite instruments. Atmos Meas Tech 4:535–546.doi:10.5194/amt-4-535-2011
Vigouroux C, De Mazière M, Errera Q, Mahieu E, Duchatelet P, Wood S, Smale D, MikuteitS, Blumenstock T, Hase F, Jones N (2007) Comparisons between ground-based FTIRand MIPAS N2O and HNO3 profiles before and after assimilation in BASCOE. AtmosChem Phys 7:377–396. doi:10.5194/acp-7-377-2007
Vigouroux C, De Mazière M, Demoulin P, Servais C, Hase F, Blumenstock T,Kramer I, Schneider M, Mellqvist J, Strandberg A, Velazco V, Notholt J,Sussmann R, Stremme W, Rockmann A, Gardiner T, Coleman M, Woods P(2008) Evaluation of tropospheric and stratospheric ozone trends overWestern Europe from ground-based FTIR network observations. Atmos ChemPhys 8:6865–6886. doi:10.5194/acp-8-6865-2008
Vingarzan R (2004) A review of surface ozone background levels and trends.Atmos Environ 38:3431–3442. doi:10.1016/j.atmosenv.2004.03.030
Visheratin KN, Kamenogradskii NE, Kashin FV, Semenov VK, Sinyakov VP, Sorokina LI(2006) Spectral-temporal structure of variations in the atmospheric total ozone incentral Eurasia. Izv Atmos Ocean Phys 42:184–202. doi:10.1134/S000143380602006X
Volz A, Kley D (1988) Evaluation of the Montsouris series of ozone measurementsmade in the nineteenth century. Nature 332:240–242. doi:10.1038/332240a0
Wai KM, Lin N-H, Wang S-H, Dokiya Y (2008) Rainwater chemistry at a high-altitude station, Mt. Lulin, Taiwan: comparison with a background station, Mt.Fuji. J Geophys Res 113:D06305. doi:10.1029/2006JD008248
Wainwright CD, Pierce JR, Liggio J, Strawbridge KB, Macdonald AM, Leaith RW(2012) The effect of model spatial resolution on Secondary Organic Aerosolpredictions: a case study at Whistler, BC, Canada. Atmos Chem Phys12:10911–10923. doi:10.5194/acp-12-10911-2012
Wang T, Wong HLA, Tang J, Ding A, Wu WS, Zhang XC (2006) On the origin ofsurface ozone and reactive nitrogen observed at a remote mountain site inthe northeastern Qinghai-Tibetan Plateau, western China. J Geophys Res111:D08303. doi:10.1029/2005JD006527
Weiss-Penzias P, Jaffe DA, Swartzendruber P, Dennison JB, Chand D, Hafner W,Prestbo E (2006) Observations of Asian air pollution in the free troposphereat Mount Bachelor Observatory during the spring of 2004. J Geophys Res111:D10304. doi:10.1029/2005JD006522
Okamoto and Tanimoto Progress in Earth and Planetary Science (2016) 3:34 Page 50 of 52

Weiss-Penzias P, Jaffe D, Swartzendruber P, Hafner W, Chand D, Prestbo E (2007)Quantifying Asian and biomass burning sources of mercury using the Hg/COratio in pollution plumes observed at the Mount Bachelor observatory.Atmos Environ 41:4366–4379. doi:10.1016/j.atmosenv.2007.01.058
Welton EJ, Voss KJ, Gordon HR, Maring H, Smirnov A, Holben B, Schmid B,Livingston JM, Russell PB, Durkee PA, Formenti P, Andreae MO (2000)Ground-based lidar measurements of aerosols during ACE-2: instrumentdescription, results, and comparisons with other ground-based and airbornemeasurements. Tellus B 52:636–651. doi:10.1034/j.1600-0889.2000.00025.x
Wild O, Pochanart P, Akimoto H (2004) Trans-Eurasian transport of ozone and itsprecursors. J Geophys Res 109:D11302. doi:10.1029/2003JD004501
Winkler P (1988) Surface ozone over the Atlantic ocean. J Atmos Chem 7:73–91.doi:10.1007/BF00048255
Wolfe GM, Thornton JA, McNeill VF, Jaffe DA, Reidmiller D, Chand D, Smith J,Swartzendruber P, Flocke F, Zheng W (2007) Influence of trans-Pacificpollution transport on acyl peroxy nitrate abundances and speciation atMount Bachelor Observatory during INTEX-B. Atmos Chem Phys 7:5309–5325.doi:10.5194/acp-7-5309-2007
Wong JPS, Lee AKY, Slowik JG, Cziczo DJ, Leaitch WR, Macdonald A, Abbatt JPD(2011) Oxidation of ambient biogenic secondary organic aerosol by hydroxylradicals: effects on cloud condensation nuclei activity. Geophys Res Lett38:L22805. doi:10.1029/2011GL049351
Worden HM, Bowman KW, Worden JR, Eldering A, Beer R (2008) Satellitemeasurements of the clear-sky greenhouse effect from tropospheric ozone.Nat Geosci 1:305–308. doi:10.1038/ngeo182
Worden HM, Bowman KW, Kulawik SS, Aghedo AM (2011) Sensitivity of outgoinglongwave radiative flux to the global vertical distribution of ozonecharacterized by instantaneous radiative kernels from Aura-TES. J GeophysRes 116:D14115. doi:10.1029/2010JD015101
Worden HM, Deeter MN, Frankenberg C, George M, Nichitiu F, Worden J, Aben I,Bowman KW, Clerbaux C, Coheur PF, de Laat ATJ, Detweiler R, DrummondJR, Edwards DP, Gille JC, Hurtmans D, Luo M, Martínez-Alonso S, Massie S,Pfister G, Warner JX (2013) Decadal record of satellite carbon monoxideobservations. Atmos Chem Phys 13:837–850. doi:10.5194/acp-13-837-2013
World Data Centre for Greenhouse Gases, Tokyo. http://ds.data.jma.go.jp/gmd/wdcgg/.Accessed 15 Dec 2015
World Health Organization (2006) WHO Air quality guidelines for particulate matter,ozone, nitrogen dioxide and sulfur dioxide: global update 2005: summary of riskassessment. WHO Press, Geneva
World Meteorological Organization (2010) Guidelines for the measurement ofatmospheric carbon monoxide, GAW Report No. 192. World MeteorologicalOrganization, Geneva
World Meteorological Organization (2013) Guidelines for continuous measurementsof ozone in the troposphere, GAW Report No. 209. World MeteorologicalOrganization, Geneva
Wunch D, Toon GC, Blavier J-FL, Washenfelder RA, Notholt J, Connor BJ, Griffith DWT,Sherlock V, Wennberg PO (2011) The total carbon column observing network.Philos Trans R Soc A Math Phys Eng Sci 369:2087–2112. doi:10.1098/rsta.2010.0240
Xu WY, Lin WL, Xu XB, Tang J, Huang JQ, Wu H, Zhang XC (2015) Long-termtrends of surface ozone and its influencing factors at the Mt. Waliguan GAWstation, China—part 1: overall trends and characteristics. Atmos Chem PhysDiscuss 15:30987–31024. doi:10.5194/acpd-15-30987-2015
Xue LK, Wang T, Zhang JM, Zhang XC, Poon CN, Ding AJ, Zhou XH, Wu WS,Tang J, Zhang QZ, Wang WX (2011) Source of surface ozone andreactive nitrogen speciation at Mount Waliguan in western China:new insights from the 2006 summer study. J Geophys Res 116:D07306.doi:10.1029/2010JD014735
Xue LK, Wang T, Guo H, Blake DR, Tang J, Zhang XC, Saunders SM, Wang WX(2013) Sources and photochemistry of volatile organic compounds in theremote atmosphere of western China: results from the Mt. WaliguanObservatory. Atmos Chem Phys 13:8551–8567. doi:10.5194/acp-13-8551-2013
Yienger J, Galanter M, Holloway TA, Phadnis MJ, Guttikunda SK, Carmichael GR, MoximWJ, Levy II H (2000) The episodic nature of air pollution transport from Asia to NorthAmerica. J Geophys Res 105:26931–26945. doi:10.1029/2000JD900309
Yonemura S, Tsuruta H, Kawashima S, Sudo S, Peng LC, Fook LS, Johar Z, HayashiM (2002) Tropospheric ozone climatology over Peninsular Malaysia from1992 to 1999. J Geophys Res 107:4229. doi:10.1023/A:1016152929037
Yurganov LN, Blumenstock T, Grechko EI, Hase F, Hyer EJ, Kasischke ES, Koike M,Kondo Y, Kramer I, Leung F-Y, Mahieu E, Mellqvist J, Notholt J, Novelli PC,Rinsland CP, Scheel HE, Schulz A, Strandberg A, Sussman R, Tanimoto H,Velazco V, Zander R, Zhao Y (2004) A quantitative assessment of the 1998
carbon monoxide emission anomaly in the Northern Hemisphere based ontotal column and surface concentration measurements. J Geophys Res109:D15305. doi:10.1029/2004JD004559
Yurganov LN, Duchatelet P, Dzhola AV, Edwards DP, Hase F, Kramer I, Mahieu E,Mellqvist J, Notholt J, Novelli PC, Rockmann A, Scheel HE, Schneider M,Schulz A, Strandberg A, Sussmann R, Tanimoto H, Velazco V, Drummond JR,Gille JC (2005) Increased Northern Hemispheric carbon monoxide burden inthe troposphere in 2002 and 2003 detected from the ground and from space.Atmos Chem Phys 5:563–573. doi:10.5194/acp-5-563-2005
Zander R, Demoulin P, Ehhalt DH, Schmidt U, Rinsland CP (1989) Secular increase ofthe total vertical column abundance of carbon monoxide above central Europesince 1950. J Geophys Res 94:11021–11028. doi:10.1029/JD094iD08p11021
Zander R, Mahieu E, Demoulin P, Duchatelet P, Roland G, Servais C, De MazièreM, Reimann S, Rinsland CP (2008) Our changing atmosphere: evidence basedon long-term infrared solar observations at the Jungfraujoch since 1950. SciTotal Environ 391:184–195. doi:10.1016/j.scitotenv.2007.10.018
Zander R, Duchatelet P, Mahieu E, Demoulin P, Roland G, Servais C, Auwera JV, Perrin A,Rinsland CP, Crutzen PJ (2010) Formic acid above the Jungfraujoch during 1985-2007: observed variability, seasonality, but no long-term background evolution.Atmos Chem Phys 10:10047–10065. doi:10.5194/acp-10-10047-2010
Zanis P, Schuepbach E, Gäggeler HW, Hübener S, Tobler L (1999) Factorscontrolling beryllium-7 at Jungfraujoch in Switzerland. Tellus B 51:789–805.doi:10.1034/j.1600-0889.1999.t01-3-00004.x
Zanis P, Gerasopoulos E, Priller A, Schnabel C, Stohl A, Zerefos C, Gäggeler HW,Tobler L, Kubik PW, Kanter HJ, Scheel HE, Luterbacher J, Berger M (2003a) Anestimate of the impact of stratosphere-to-troposphere transport (STT) on thelower free tropospheric ozone over the Alps using 10Be and 7Bemeasurements. J Geophys Res 108:8520. doi:10.1029/2002JD002604
Zanis P, Monks PS, Green TJ, Schuepbach E, Carpenter LJ, Mills GP, Rickard AR, Brough N,Penkett SA (2003b) Seasonal variation of peroxy radicals in the lower freetroposphere based on observations from the FREE Tropospheric EXperiments in theSwiss Alps. Geophys Res Lett 30:1497. doi:10.1029/2003GL017122
Zanis P, Ganser A, Zellweger C, Henne S, Steinbacher M, Staehelin J (2007)Seasonal variability of measured ozone production efficiencies in the lowerfree troposphere of Central Europe. Atmos Chem Phys 7:223–236. doi:10.5194/acp-7-223-2007
Zellweger C, Ammann M, Buchmann B, Hofer P, Lugauer M, Rüttimann R, StreitN, Weingartner E, Baltensperger U (2000) Summertime NOy speciation at theJungfraujoch, 3580m above sea level, Switzerland. J Geophys Res 105:6655–6667.doi:10.1029/1999JD901126
Zellweger C, Forrer J, Hofer P, Nyeki S, Schwarzenbach B, Weingartner E,Ammann M, Baltensperger U (2003) Partitioning of reactive nitrogen (NOy)and dependence on meteorological conditions in the lower freetroposphere. Atmos Chem Phys 3:779–796. doi:10.5194/acp-3-779-2003
Zellweger C, Klausen J, Buchmann B (2007) System and performance audit forsurface ozone and carbon monoxide at the Global GAW station Assekrem,Algeria, May 2007, WCC-Empa Report 07/2. Empa, Dübendorf
Zellweger C, Hüglin C, Klausen J, Steinbacher M, Vollmer M, Buchmann B (2009)Inter-comparison of four different carbon monoxide measurementtechniques and evaluation of the long-term carbon monoxide time series ofJungfraujoch. Atmos Chem Phys 9:3491–3503. doi:10.5194/acp-9-3491-2009
Zenker T, Fischer H, Nikitas C, Parchatka U, Harris GW, Mihelcic D, Müsgen P, PätzHW, Schultz M, Voltz-Thomas A, Schmitt R, Behmann T, Weiβenmayer M,Burrows JP (1998) Intercomparison of NO, NO2, NOy, O3, and ROx
measurements during the Oxidizing Capacity of the TroposphericAtmosphere (OCTA) campaign 1993 at Izaña. J Geophys Res 103:13615–13634. doi:10.1029/97JD03739
Zhang L, Jacob DJ, Boersma KF, Jaffe DA, Olson JR, Bowman KW, Worden JR,Thompson AM, Avery MA, Cohen RC, Dibb JE, Flocke FM, Fuelberg HE,Huey LG, McMillan WW, Singh HB, Weinheimer AJ (2008) Transpacifictransport of ozone pollution and the effect of recent Asian emissionincreases on air quality in North America: an integrated analysis usingsatellite, aircraft, ozonesonde, and surface observations. Atmos Chem Phys8:6117–6136. doi:10.5194/acp-8-6117-2008
Zhang JM, Wang T, Ding AJ, Zhou XH, Xue LK, Poon CN, Wu WS, Gao J, Zuo HC,Chen JM, Zhang XC, Fan SJ (2009a) Continuous measurement ofperoxyacetyl nitrate (PAN) in suburban and remote areas of western China.Atmos Environ 43:228-237. doi:10.1016/j.atmosenv.2008.09.070
Zhang L, Jacob DJ, Kopacz M, Henze DK, Singh K, Jaffe DA (2009b) Intercontinentalsource attribution of ozone pollution at western U.S. sites using an adjointmethod. Geophys Res Lett 36:L11810. doi:10.1029/2009GL037950
Okamoto and Tanimoto Progress in Earth and Planetary Science (2016) 3:34 Page 51 of 52

Zhang F, Zhou LX, Novelli PC, Worthy DEJ, Zellweger C, Klausen J, Ernst M,Steinbacher M, Cai YX, Xu L, Fang SX, Yao B (2011) Evaluation of in situmeasurements of atmospheric carbon monoxide at Mount Waliguan, China.Atmos Chem Phys 11:5195–5206. doi:10.5194/acp-11-5195-2011
Zhang B, Owen RC, Perlinger JA, Kumar A, Wu S, Val Martin M, Kramer L, HelmigD, Honrath RE (2014) A semi-Lagrangian view of ozone production tendencyin North American outflow in the summers of 2009 and 2010. Atmos ChemPhys 14:2267–2287. doi:10.5194/acp-14-2267-2014
Zhu B, Akimoto H, Wang Z, Sudo K, Tang J, Uno I (2004) Why does surface ozonepeak in summertime at Waliguan? Geophys Res Lett 31:L17104. doi:10.1029/2004GL020609
Zieger P, Kienast-Sjögren E, Starace M, Von Bismarck J, Bukowiecki N,Baltensperger U, Wienhold FG, Peter T, Ruhtz T, Collaud Coen M, VuilleumierL, Maier O, Emili E, Popp C, Weingartner E (2012) Spatial variation of aerosoloptical properties around the high-alpine site Jungfraujoch (3580 m a.s.l.).Atmos Chem Phys 12:7231–7249. doi:10.5194/acp-12-7231-2012
Zieman JJ, Holmes JL, Connor D, Jensen CR, Zoller WH, Hermann DM, ParringtonJR, Gordon GE (1995) Atmospheric aerosol trace element chemistry at MaunaLoa Observatory 1. 1979–1985. J Geophys Res 100:25979–25994. doi:10.1029/93JD03316
Submit your manuscript to a journal and benefi t from:
7 Convenient online submission
7 Rigorous peer review
7 Immediate publication on acceptance
7 Open access: articles freely available online
7 High visibility within the fi eld
7 Retaining the copyright to your article
Submit your next manuscript at 7 springeropen.com
Okamoto and Tanimoto Progress in Earth and Planetary Science (2016) 3:34 Page 52 of 52