a review of efa expenditure projections made by...
TRANSCRIPT
2010/ED/EFA/MRT/PI/38
Background paper prepared for the Education for All Global Monitoring Report 2010
Reaching the marginalized
A Review of EFA Expenditure Projections made by National Education Plans in Sub-Saharan Africa
Paul Bennell2009
This paper was commissioned by the Education for All Global Monitoring Report as background information to assist in drafting the 2010 report. It has not been edited by the team. The views and opinions expressed in this paper are those of the author(s) and should not be attributed to the EFA Global Monitoring Report or to UNESCO. The papers can be cited with the following reference: “Paper commissioned for the EFA Global Monitoring Report 2010, Reaching the marginalized” For further information, please contact [email protected]
Background paper prepared for the Education For All Monitoring Report 2009
A REVIEW OF EFA EXPENDITURE PROJECTIONS MADE BY NATIONAL EDUCATION PLANS IN SUB-SAHARAN AFRICA
PAUL BENNELL Knowledge and Skills for Development, Brighton
April 2009
Final draft: Confidential, not for citation or quotation
TABLE OF CONTENTS 1 INTRODUCTION 1
2 PLAN GOALS 1
3 COST PARAMETERS 3
4 PROJECTED FUNDING 9
5 PROJECTED EXPENDITURE 14
PART 2: COUNTRY CASE STUDIES 20
6 BURKINA FASO 20
7 ETHIOPIA 22
8 RWANDA 25
9 RECOMMENDATIONS 29
REFERENCES 29
Tables
Table 1 Pre-primary gross enrolment rates, actual 2006 and targets 2
Table 2 Target repetition rates for primary schooling 4
Table 3 Target learner-teacher ratios for primary education in SSA countries 4
Table 4 Projected pay by employment status for primary school teachers (GDP/per capita) 7
Table 5 Projected classroom unit costs for primary schooling (US$) 8
Table 6 Private sector share of primary school enrolments, 2006 9
Table 7 Projected GDP growth in SSA countries 10
Table 8 Projected government revenue as a share of GDP 10
Table 9 Share of projected recurrent education budget in total government recurrent budget 12
Table 10 Primary education expenditure as a share of total education expenditure 13
Table 11 Projected expenditure for primary education in SSA countries 15
Table 12 Average annual rate of growth in primary education expenditure in early-mid 2000s
and projected required expenditure (constant prices) 16
Table 13 Projected recurrent expenditure per primary school learner 17
Table 14 Funding gap for primary education (billions local currency units) 18
Table 15 National education plan and World Bank estimates of average annual funding gap
for primary education (US$ million) 19
Table 16 Enrolment and completion rates for primary schooling in Burkina Faso, 2007
(rounded percentages) 21
i

ii
Table 17 ESDP3 projected expenditure and actual budget shares by education sub-sector,
2005/06 and 2006/07 24
Table18 Sub-sector recurrent expenditure shares, original and revised ESSP 28
Annex tables 32
Table A1 Time in class in primary schools (hours/year) 32
Table A2 Projected share of salaries in total recurrent expenditure for primary schooling 32
Table A3 Projected expenditure for primary education, 2004/05-2015 33
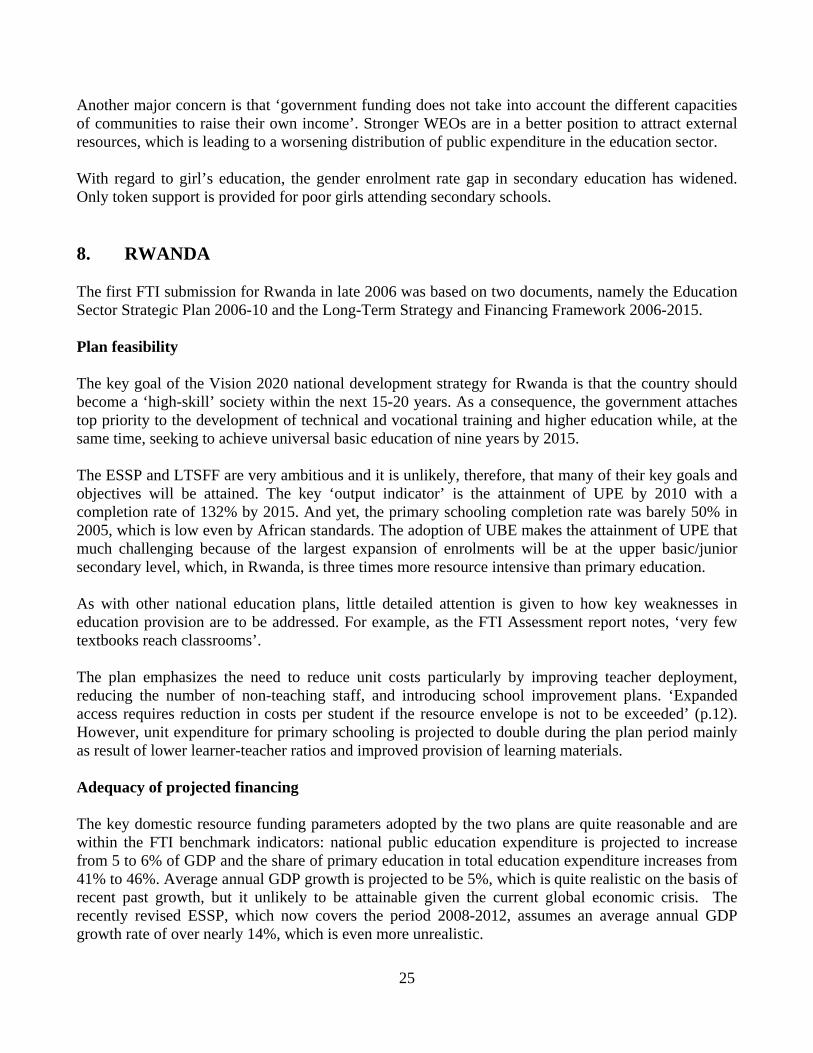
Table A4 Total primary education expenditure in SSA countries (current prices) 34
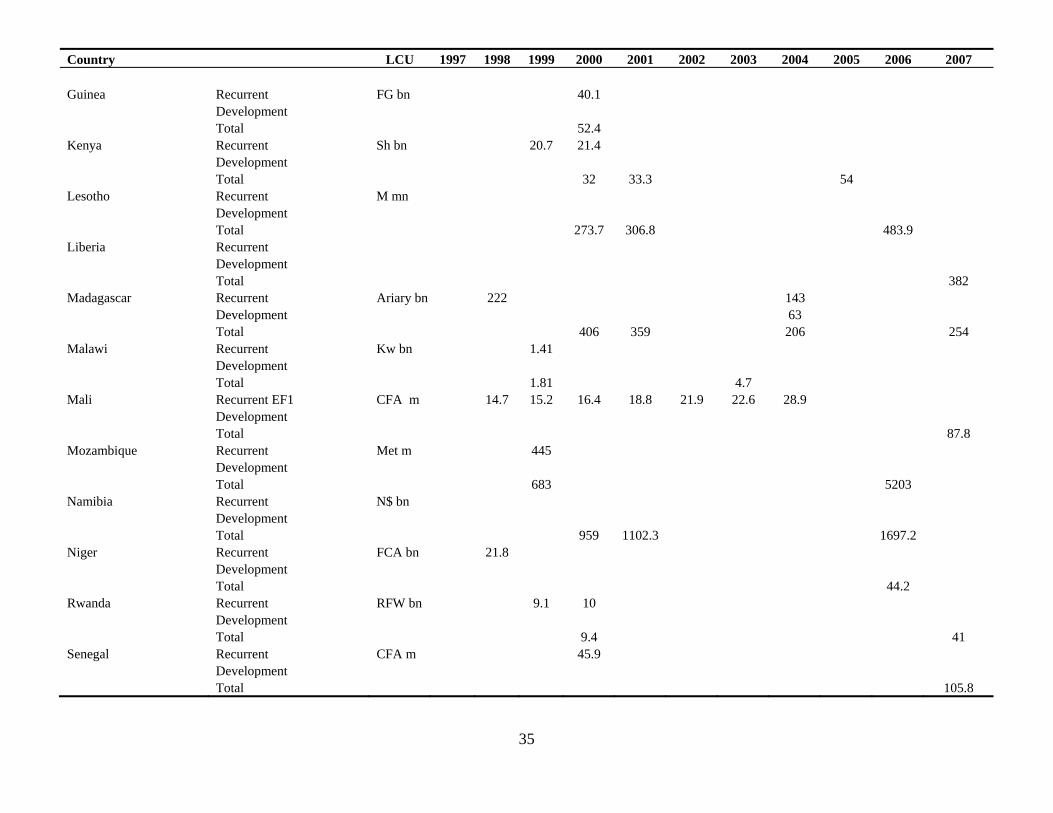
Table A5 Total education expenditure in SSA countries (current prices) 37
Table A6 Projected annual funding gaps for primary education (LCU billions) 42

1. INTRODUCTION The three main objectives of this paper are as follows:
• Review the costs and estimated external funding gaps associated with national education plans in Africa. Evaluate the feasibility of the assumptions used to generate the estimated costs of the national plans.
• Highlight strategies to address the education disadvantages of marginalized groups and
their associated costs.
• Provide a detailed review of three national plans that have been endorsed as part of the Fast Track Initiative (FTI).
As requested, the report covers 30 countries in SSA that had primary school age populations of over 0.5 million in 2005 (see annex 1). The national education plans of all these countries were reviewed except for Burundi, DRC, Somalia, and Zimbabwe where none could be located. Primary reliance was placed on the UNESCO national education plan and FTI websites in order to retrieve this documentation. In additional, Ministries of Education (MoEs) and/or donors in eight countries were directly requested to provide further documentation. The list of NEPs that were relied upon for this study is listed in Annex 2. Only around half of the national education plans (NEPs) in the 30 countries under review contain comprehensive education funding and expenditure projections up to 2015. Most have NEPs of one sort or another, but a sizeable proportion of these only present expenditure projections for three-five years (see below). However, it appears that MoE Planning Departments in many countries have generated 2015 projections using standard simulation methodologies, but these are not in the public domain. Efforts were made to obtain these projections for some of the missing countries (in particular, larger ones such as Ethiopia, Mozambique, and Nigeria), but it is important that a concerted effort is made to obtain them for all countries. Most conflict-affected countries do not have 2015 enrolment and expenditure projections and yet a high proportion of out-of-school children live in these countries, especially in the larger ones such as DRC and Sudan. Some post-conflict countries such as Cote d’Ivoire and Liberia have developed short-term post recovery/relief plans with expenditure projections for three-five years. The GMR team made very extensive comments on the first draft of this paper. A number of these relate to implementation issues, which are beyond the terms of reference of this paper. Others require additional information, which is not readily available. However, every attempt has been made to respond to the comments in the limited time available. 2. PLAN GOALS The key education goal of almost all the NEPs is the attainment of primary education for all (EFA) by 2015. This is usually interpreted in the NEPs as a net or gross enrolment rate target for
1
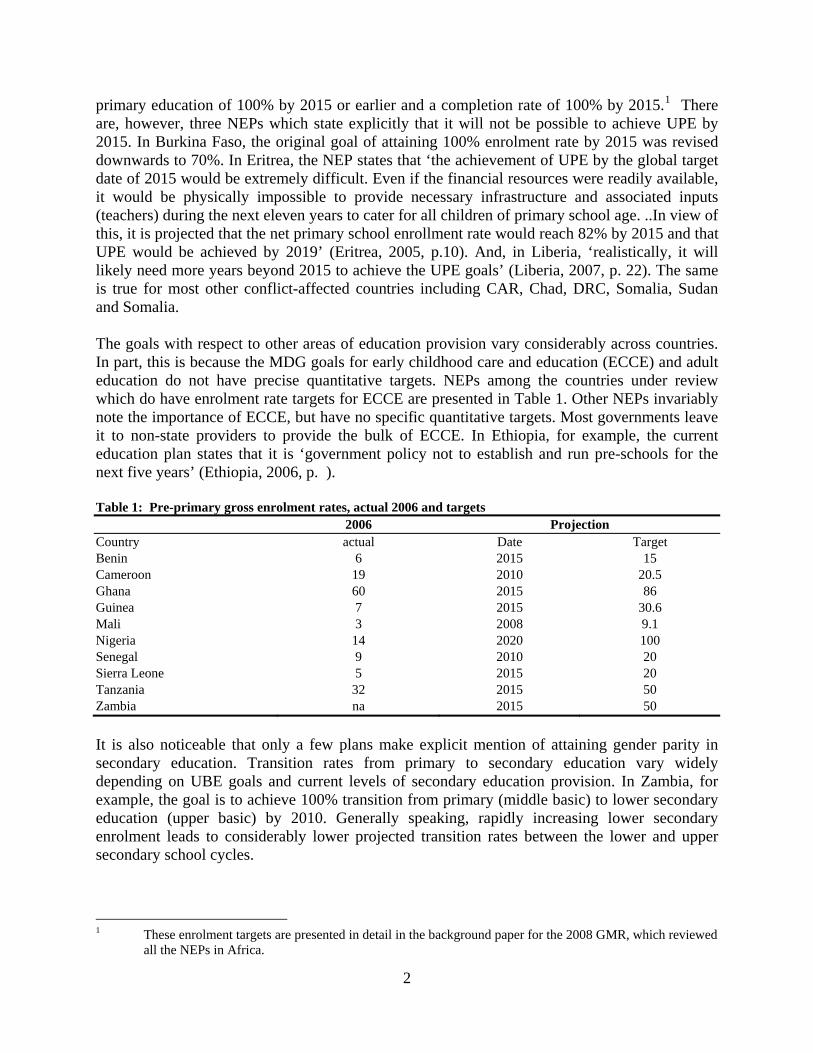
primary education of 100% by 2015 or earlier and a completion rate of 100% by 2015.1 There are, however, three NEPs which state explicitly that it will not be possible to achieve UPE by 2015. In Burkina Faso, the original goal of attaining 100% enrolment rate by 2015 was revised downwards to 70%. In Eritrea, the NEP states that ‘the achievement of UPE by the global target date of 2015 would be extremely difficult. Even if the financial resources were readily available, it would be physically impossible to provide necessary infrastructure and associated inputs (teachers) during the next eleven years to cater for all children of primary school age. ..In view of this, it is projected that the net primary school enrollment rate would reach 82% by 2015 and that UPE would be achieved by 2019’ (Eritrea, 2005, p.10). And, in Liberia, ‘realistically, it will likely need more years beyond 2015 to achieve the UPE goals’ (Liberia, 2007, p. 22). The same is true for most other conflict-affected countries including CAR, Chad, DRC, Somalia, Sudan and Somalia. The goals with respect to other areas of education provision vary considerably across countries. In part, this is because the MDG goals for early childhood care and education (ECCE) and adult education do not have precise quantitative targets. NEPs among the countries under review which do have enrolment rate targets for ECCE are presented in Table 1. Other NEPs invariably note the importance of ECCE, but have no specific quantitative targets. Most governments leave it to non-state providers to provide the bulk of ECCE. In Ethiopia, for example, the current education plan states that it is ‘government policy not to establish and run pre-schools for the next five years’ (Ethiopia, 2006, p. ). Table 1: Pre-primary gross enrolment rates, actual 2006 and targets
2006 Projection Country actual Date Target Benin 6 2015 15 Cameroon 19 2010 20.5 Ghana 60 2015 86 Guinea 7 2015 30.6 Mali 3 2008 9.1 Nigeria 14 2020 100 Senegal 9 2010 20 Sierra Leone 5 2015 20 Tanzania 32 2015 50 Zambia na 2015 50 It is also noticeable that only a few plans make explicit mention of attaining gender parity in secondary education. Transition rates from primary to secondary education vary widely depending on UBE goals and current levels of secondary education provision. In Zambia, for example, the goal is to achieve 100% transition from primary (middle basic) to lower secondary education (upper basic) by 2010. Generally speaking, rapidly increasing lower secondary enrolment leads to considerably lower projected transition rates between the lower and upper secondary school cycles.
1 These enrolment targets are presented in detail in the background paper for the 2008 GMR, which reviewed
all the NEPs in Africa.
2

3
Educational planning of any kind is very difficult in most post-conflict countries. In particular, reliable data on enrolments and enrolment rates is not available. Without this information, it is not possible to make robust enrolment, expenditure and funding projections. Completion rates EFA by 2015 requires 100% completion rates for primary education by 2015 with, therefore, all children enrolling in grade 1 by 2008-2010 (depending on the length of the primary school cycle) and with zero drop out thereafter. According to the GMR, in 2005, survival rates for primary schooling were less than 75% in 22 out of the 26 countries in Africa (excluding the small/micro states) for which information is available. Survival rates were less than 50% in seven of these countries (CAR, Chad, Madagascar, Malawi, Mozambique, Rwanda, and Uganda). It seems very unlikely, therefore, that these intake and completion targets can be attained over the next seven years. Repetition rates The FTI benchmark norm for primary schooling is 10% by 2015, which is quite high. The majority of countries with repetition rates above this level have adopted this target (see table 2). Among the mainly francophone countries, which continue to have very high repetition rates, meeting this target will be a major challenge, especially given the widespread acceptance of learner repetition among both teachers and parents. However, the elimination of learner repetition in the lower primary cycle is a key policy goal in Guinea, Niger, and Senegal, which is being fully implemented. 3. COST PARAMETERS Learner-teacher ratios The FTI benchmark indicator for the primary school learner-teacher ratio is 40. Around one-half of the NEPs, which have 2015 projected LTRs, have this figure as their target (see table 3).2 Ethiopia and Mali have a target LTR of 50 and Guinea, Rwanda and Sierra Leone 45. Only one country, Ghana has a lower target LTR of 35. Only four out of these 13 countries face a major challenge in attaining the target LTR. The recent trend in LTRs is generally downward. According to the GMR, LTRs for primary schooling only increased appreciably (by five or more) in five countries between 1999 and 2006 (Ghana, Kenya, Mozambique, Rwanda, and Tanzania). There is no FTI benchmark indicator for class size. Where the teacher-stream ratio is significantly greater than one, as is the case in a relatively large number of countries (especially those that have subject teaching in primary such as Tanzania, Nigeria and Namibia), then a target LTR of 40 translates in learner-class ratios of well above 50. A few countries have targets for the total number of hours of learning time (see annex table 1).
2 Only countries that have explicit targets with respect to each of the key FTI benchmark indicators are
included in the tables.

Table 2: Target repetition rates for primary schooling Country 2001 2002 2003 2004 2005 2006 2007 2008 2009 2010 2011 2012 2013 2014 2015 Benin 17 12.8 10 10 Burkina 18 12 11.4 11.2 11 10 Cameroon
AR 26* 21.1 18.9 16.7 14.4 12.2 10 10 10 10 10
C 30 10nea 8.7 9ya 5
nda 19 8 3
Gui
n
Ke Madagascar 30* 19 15 12 8 Mali 24* 18.7 17.4 16.1 14.9 13.7 12.4 11.2 9.9 8.7 7.5 6.2 5 Rwa Sierra Leone 10 9 9 8 8 7 6 6 5 Zambia 7.1 5.8 5.2 4.6 1.5 Note: * actual figure. Table 3: Target learner-teacher ratios for primary education in SSA countries Country 2001 2002 2003 2004 2005 2006 2007 2008 2009 2010 2011 2012 2013 2014 2015 Benin 50 44* 47 44 40 Burkina 47.8 47.2 46.7 46.1 45.6 46* 43.9 42.2 40 Cameroon 57.1* 45* 53 51.6 50.3 48.9 47.5 46.1 44.8 43.4 42 CAR 92* 75 DRC 39* 40 40 Ethiopia** 65 62 59 56 53 50 50 50 50 50 50 Ghana 31.9 32.3 32.7 33.1 35* 35 35 Guinea 51.3 44* 45 Liberia 19* 33 Madagascar 57* 56 52(48*) 47 42 Mali 63* 56* 58.6 50 Mozambique** 47.7 47.5 47.1(67*) 46.4 Niger 41* 40* 40 Rwanda 67 66* 45 Sierra Leone 61 44* 57 55 54 52 51 49 48 46 45 Uganda 52 49* 40 Zambia 67(51*) 61 58 55 40 Notes: *=actuals. ** lower primary only.
4

5
Teacher pay The FTI benchmark norm for primary school teacher pay is 3.5 times GDP/per capita. Most NEPs, especially in what are regarded as ‘high salary’ cost francophone countries, have teacher salary targets for 2015 in the 3.5-4.5 GDP/per capital region. The attainment of these targets is to be achieved not so much by reducing the relative pay of permanent teachers, but rather increasing the proportion of lower cost contract and community teachers (see table 4). In most francophone countries, in particular, these teachers account for all or almost all the increase in teaching positions up to 2015. In Guinea, for example, the number of contract teachers is projected to increase from 10,700 in 2005 to 37,200 in 2015 while permanent teachers in post is expected to decline from 7,600 to 5,600. The average salary of the contract teacher is 45% of that of the permanent teacher. In Benin, the number of permanent teachers nearly doubles and contract teachers are projected to increase nearly four fold increase. Projected increases in teacher workloads are also being planned in some countries (for example, Kenya and Mozambique). Communities themselves frequently employ ‘parent teachers’. In Central African Republic, they account for around 40% of the total teaching force and are paid a pittance (normally around FCA 15,000 per month). In Cameroon, parent teachers (maitres des parents) account for nearly one-third of all teachers and are paid only FCA 20,000 per month. In Chad, PTAs pay for over 60% of the salaries of community teachers and meet 30-70% of operating costs of community schools. As the NEP points out, ‘with turmoil, communities took their children’s future into their own hands’. Increasing teacher salaries is a major goal for most governments in post-conflict countries, given the very low levels of teacher pay that prevail in most of these countries.3 In other countries, there is an explicit goal to restrain the growth in teacher employment. In Kenya, for example, the number of primary and secondary school teachers is expected to remain constant over the medium term. Teacher salaries are 5.4 GDP per capita, which is ‘very high’. A ‘redistribution exercise’ is also intended to ensure a more equitable distribution of teachers and higher contact hours. The high proportion of the education budget that is allocated to non-teaching staff is a serious issue in some countries. This is as high as 27% in Central African Republic and is often symptomatic of poor management and high levels of corruption. A reduced salary burden (relative to GDP per capita) also enables the FTI benchmark of salaries accounting for no more than two-thirds of total recurrent costs to be adopted as a 2015 target in the majority of countries (see annex table 2). The feasibility of the NEPs that rely heavily on contract teachers needs to be carefully scrutinised. In particular, there are serious concerns about the extent to which contract teachers can be relied upon as a long term measure. The evidence, to date, on the effectiveness of contract teachers is quite mixed. In Niger, the NEP notes that serious problems have arisen since contract teachers were first employed in 1998, including he refusal of many of them to work in harder to staff schools in remoter locations. The government in Guinea recently announced that contract
3 Comprehensive information on teacher pay is not available in these or other low income African countries.
It is important, therefore, that concerted efforts are made to collect this data on a regular basis.

6
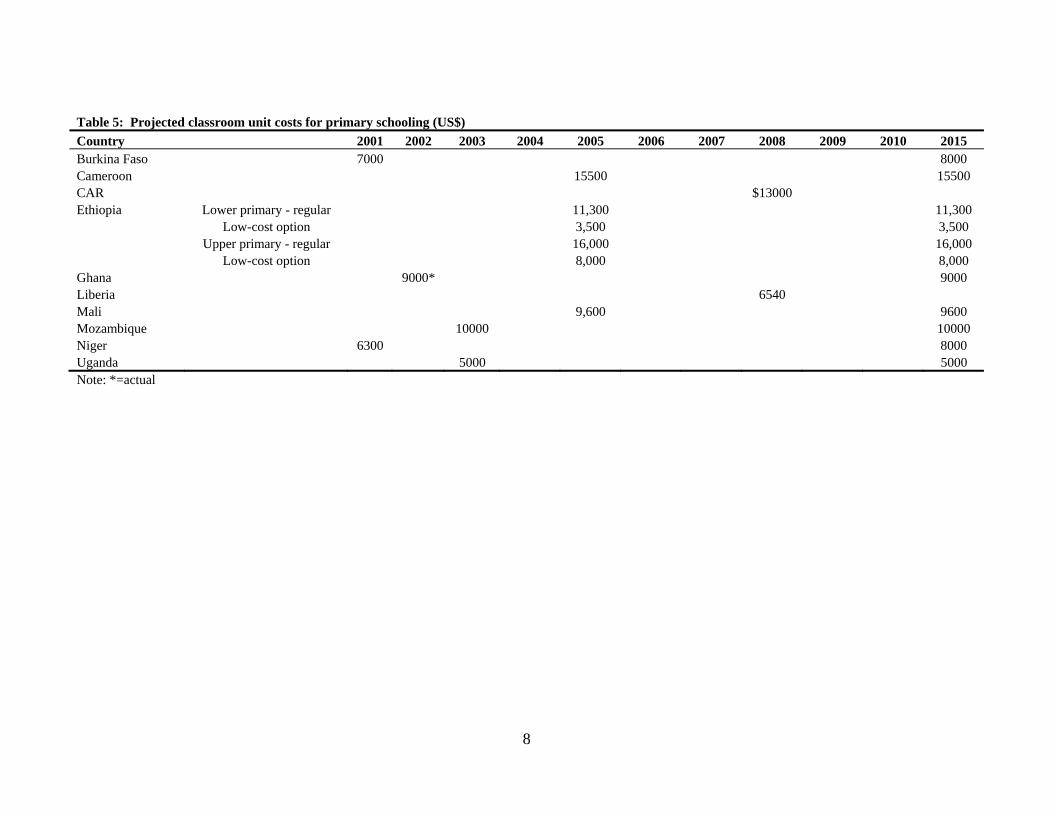
teachers are to be phased out and that existing contract teachers will become permanent civil servants.4 Classroom construction The FTI benchmark indicator for classroom construction is a unit cost of US$8,000. Most countries, particularly in Francophone countries, struggle to adhere to this norm (see table 5). Some NEPs place considerable emphasis on the construction of low cost schools and classrooms making substantial use of local materials and labour. In Ethiopia, for example, the cost of low-cost, community constructed classrooms is three times lower than contractor constructed classrooms. The mass destruction of schools in conflict-affected countries is a massive challenge. In Liberia, for example, 80% of classrooms were destroyed during the decade-long civil war. The policy on double shifting has major implications for classroom construction and other infrastructure needs. Some countries, such as Liberia, plan to move as quickly as possible towards universal double shifting, but the majority of countries are seeking to phase it out as part of efforts to improve learning outcomes. Reaching the marginalised It is widely recognised that the unit costs of educating ‘harder to reach children’ especially in remoter areas may be appreciably higher due to smaller class size, additional incentives to attract teachers to these locations and demand side financing measures (conditional cash transfer schemes). It is surprising, therefore, that none of the reviewed plans present any separate estimates of the additional costs of reaching the marginalized. It is not possible, therefore, to calculate differences in unit expenditures between marginalized and ‘average’ students. Household contributions to meeting the costs of primary schooling remain large in most countries. They are particularly high in conflict and post-conflict situations. For example, in Sierra Leone, half of all primary school expenditure is met by households. And in DRC, recurrent public expenditure on primary and secondary education in 2002 was, in real terms, a mere 4% of the 1980 level. The ‘frais de motivation’ for teachers is a major burden in DRC. It averaged $60 in 2003 with annual per capita income less than $100. Even in a stable country such as Cameroon, households contribute 44% of the total costs of primary education. Plans recognize the need to reduce these costs, but rarely explicitly factor this into their funding and expenditure projections.
4 The October 2008 project document for a World Bank ‘additional financing grant for the education sector
in Guinea notes that ‘’recently the government has reversed its cost-saving policy by abolishing the system of contract teachers and transferring contractual employees into the public sector as fully fledged civil servants. This policy also provides for higher salaries and the introduction of new, higher incentive measures. From 2008 to 2009, wages at the primary and secondary level are estimated to increase by 60%’ (World Bank, 2008, p.39). The increased costs of incorporating contract teachers in to the civil service will, therefore, be very sizeable and the projected UPE expenditure projections will need to be adjusted to take this into account.
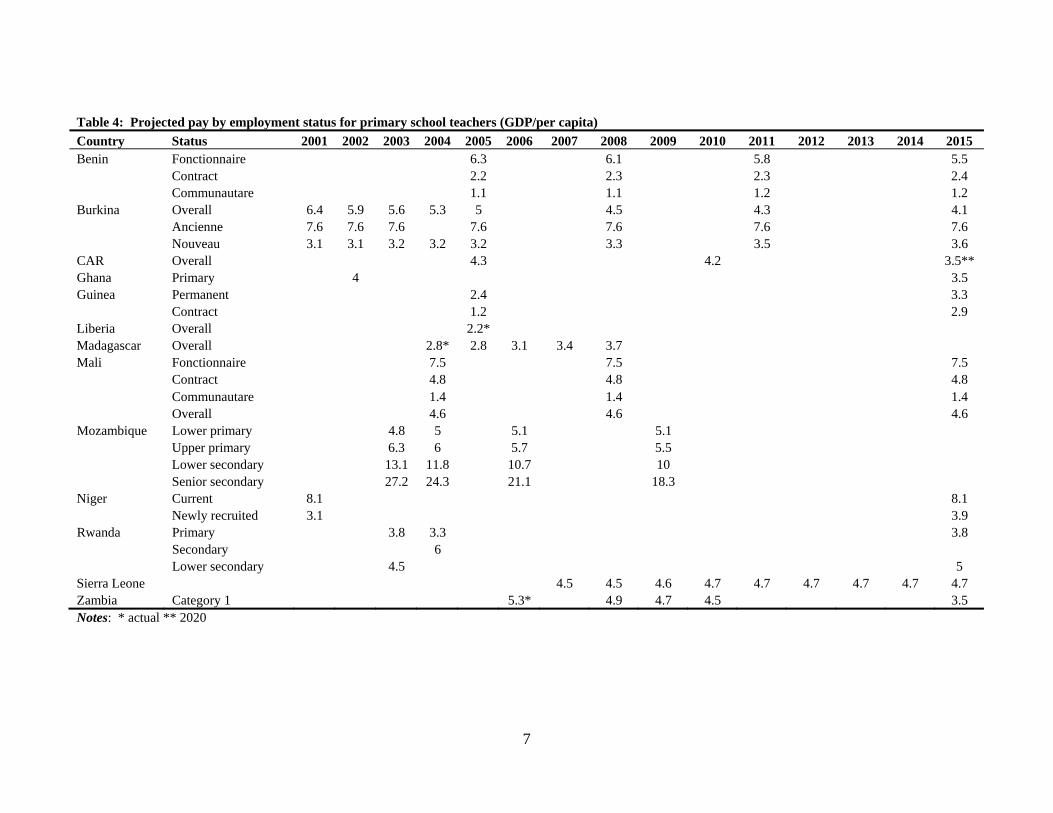
Table 4: Projected pay by employment status for primary school teachers (GDP/per capita) Country Status 2001 2002 2003 2004 2005 2006 2007 2008 2009 2010 2011 2012 2013 2014 2015 Benin Fonctionnaire 6.3 6.1 5.8 5.5 Contract 2.2 2.3 2.3 2.4 Communautare 1.1 1.1 1.2 1.2 Burkina Overall 6.4 5.9 5.6 5.3 5 4.5 4.3 4.1 Ancienne 7.6 7.6 7.6 7.6 7.6 7.6 7.6 Nouveau 3.1 3.1 3.2 3.2 3.2 3.3 3.5 3.6 CAR Overall 4.3 4.2 3.5** Ghana Primary 4 3.5 Guinea Permanent 2.4 3.3 Contract 1.2 2.9 Liberia Overall 2.2* Madagascar Overall 2.8* 2.8 3.1 3.4 3.7 Mali Fonctionnaire 7.5 7.5 7.5 Contract 4.8 4.8 4.8 Communautare 1.4 1.4 1.4 Overall 4.6 4.6 4.6 Mozambique Lower primary 4.8 5 5.1 5.1 Upper primary 6.3 6 5.7 5.5 Lower secondary 13.1 11.8 10.7 10 Senior secondary 27.2 24.3 21.1 18.3 Niger Current 8.1 8.1 Newly recruited 3.1 3.9 Rwanda Primary 3.8 3.3 3.8 Secondary 6 Lower secondary 4.5 5 Sierra Leone 4.5 4.5 4.6 4.7 4.7 4.7 4.7 4.7 4.7 Zambia Category 1 5.3* 4.9 4.7 4.5 3.5 Notes: * actual ** 2020
7
8
Table 5: Projected classroom unit costs for primary schooling (US$) Country 2001 2002 2003 2004 2005 2006 2007 2008 2009 2010 2015 Burkina Faso 7000 8000 Cameroon 15500 15500 CAR $13000 Ethiopia Lower primary - regular 11,300 11,300 Low-cost option 3,500 3,500 Upper primary - regular 16,000 16,000 Low-cost option 8,000 8,000 Ghana 9000* 9000 Liberia 6540 Mali 9,600 9600 Mozambique 10000 10000 Niger 6300 8000 Uganda 5000 5000 Note: *=actual

Private education The FTI benchmark indicator is that private sector enrolments should comprise 10% of primary school enrolments. As can be observed in table 6, the relative size of the private sector varies very considerably among countries in SSA although there is quite a high degree of adherence to this norm. Given this variability, the FTI indicator for private education appears rather arbitrary. Most countries are seeking to increase the share of private enrolments by ‘liberalising’ policy with respect to private sector providers, which increase competition among schools and free-up public resources. The degree of public subsidisation of not-for-profit ‘community’ schools is also another important issue with major financial implications in many countries. Table 6: Private sector share of primary school enrolments, 2006
<5 5.1-10 10.1-15 16.1-20 20.1-30 30> Botswana CAR Benin Ghana Cameroon Chad Burundi Eritrea Burkina Faso Madagascar Gabon Congo Gambia Uganda DRC Guinea Mali Kenya Senegal Togo Lesotho Malawi Mozambique Namibia Niger Nigeria Sierra Leone South Africa Tanzania Zambia Source: 2009 GMR 4. PROJECTED FUNDING Economic growth Projected national economic growth rates in the NEPs are generally quite high (see table 7). In relation to recent economic performance, most of these growth targets appear to be realistic (except for a few countries such as Ethiopia), but, given the likely severity of the rapidly deepening global economic crisis, they are unlikely to be attainable, at least over the next two-three years (with the possible exception of mineral-rich exporting countries such as Angola and Nigeria). A high proportion of conflict-affected countries are mineral-rich and these countries have the potential, therefore, to achieve very high rates of economic growth (although from a very low base).
9

Table 7: Projected GDP growth in SSA countries Country Actual 2000-05 2002 2003 2004 2005 2006 2007 2008 2009 2010 2011 2012 2013 2014 2015 Benin 4 5.5 7 7 Burkina 5.1 5 5 5 5 5 5 5 5 5 5 5 5 5 5 Ethiopia 4.2 14.5* 9.3* 9.6 9.6 9.6 9.6 9.6 Ghana 5.1 5 5 5 5 5 5 5 5 5 5 5 5 5 5 Kenya 3.4 3.5 3.5 3.5 3.5 3.5 3.5 3.5 3.5 Liberia -6.8 8 8.2 9.4 10.5 Madagascar 2 5.3* 4.6* 4.9* Mali 5.9 6.7 6.7 6.7 6.7 6.7 6 6 6 6 6 6 6 6 6 Mozambique 8.6 7.5 7.5 7.5 7.5 7.5 Nigeria 5.9 4.8 5 5.2 5.4 5.6 5.9 6.9 Senegal 4.7 5 5 5 5 5 5 Zambia 4.7 6 6 6 6 6 6 6 6 6 Notes: * actual Table 8: Projected government revenue as a share of GDP Country 2001 2002 2003 2004 2005 2006 2007 2008 2009 2010 2011 2012 2013 2014 2015 Benin 16.7 16.3 17 18 Burkina Faso 13.3 13.4 13.5 13.6 13.8 14.1 14.5 15 Cameroon 17.9* CAR 8.1* 8.4 Ghana 20.7 21 21.3 21.6 23 24.5 Guinea 12.1* 16 Liberia 19 19 19 19 19 Mali 14.7 14.8 15 15.1 15.3 15.4 15.6 15.7 15.9 16 Mozambique 7 7 7 7 7 Niger 9.2* Nigeria 40 40 40 40 40 40 40 Sierra Leone 12.3 12.8 12.9 13.1 13.2 13.4 13.5 13.7 13.8 14 Note: * actual
10

11
Government budget The FTI benchmark indicator is that government revenue should be between 14-18% of GDP. The projected shares in 2015 (as presented in the NEPs) are generally higher than current shares, although these increases are relatively modest (see table 8). As expected, the shares are particularly low in conflict affected countries (less than 10%) and it is questionable, therefore, whether this can be increased appreciably in the short-term. Government revenue is relatively high in mineral-rich countries (Botswana, Congo, Nigeria and probably Angola), middle income countries (Namibia, South Africa, Swaziland) but also Ghana (24%), which tend to have more efficient tax systems. Education sector allocation The FTI benchmark indicator is that the education sector should receive 20% of the total government (discretionary) recurrent budget. The NEP targets for 2015 are appreciably higher than this in the majority of countries and very sizeable increases in this share are projected in conflict-affected countries (Central African Republic, DRC and Liberia), some francophone countries (Cameroon and Guinea), and Nigeria (see table 9). Primary education sub-sector allocation The FTI benchmark indicator is that the share of primary education in total education expenditure should be 50% by 2015. As can be observed in Table 10, the majority of NEPs adopt this benchmark goal, but there is a group of countries where this share is appreciably lower (Ghana 37%, Mozambique 41%, and Nigeria 39%). Generally speaking, in countries which have already attained or are well on the way to achieving EFA, the share of primary education can be expected to decline as a result of projected rapid expansion in secondary school enrolments. It is surprising that only a minority of NEPs project sizeable increases in the share of primary education expenditure by 2015, most notably in Cameroon and Guinea (from 37-38% to 50%), Ethiopia (from 42% to 52% in 2010), and Zambia (from 59% to 67% in 2010). In three countries, the primary education expenditure share is projected to remain roughly the same (Benin, Ghana and Nigeria), but it is projected to decline in six countries (Burkina Faso, Central African Republic, Mali, Mozambique, Niger and Rwanda). All this latter group of countries has a long way to go before attaining UPE. Thus, reliance on the FTI benchmark indicator of 50% in this type of situation seems questionable since adhering to the FTI norm leads to slower progress in attaining EFA than might otherwise have been the case. It should be pointed, however, that actual shares in 2006 in most of these countries are significantly higher than the NEP target shares. With the recent increased focus on post-primary education in many countries, attaining the 50% share of primary education in total education expenditure will be that much difficult. In some countries, such as Ethiopia and Rwanda, which have very ambitious plans for the expansion of TVET and tertiary education, the current share of primary education is already well under the planned projected share. Similarly, in Burkina Faso, the original expenditure share goal of 55% for primary education was subsequently reduced to 50% given concerns that the needs of other key areas of education provision would not be adequately catered for.

Table 9: Share of projected recurrent education budget in total government recurrent budget Country 2001 2002 2003 2004 2005 2006 2007 2008 2009 2010 2011 2012 2013 2014 2015 Benin 22.5 24.2 24.3 24.5 Burkina Faso 20.3 20.6 21 21.3 21.6 22.6 23.7 25 Cameroon 15* 17.4 17.9 18.4 18.9 19.4 19.9 20.5 21 21.5 22 CAR 14 21.6 Chad 13.3* 7.8* 13.9* 14.5* DRC 5* 6* 20 25 Ethiopia 18.7* 19 19.3 19.6 19.9 20.2 Ghana 25.4 25.2 24.9 24.5 23.1 21.4 Guinea 14* 18.1 19.6 22 Kenya 33 33 33 33 33 33 33 33 33 33 33 33 33 Liberia 10 12 14 16 18 Madagascar 20.8* Mali 22.5 23 23.5 23.5 24 24.5 25 25.5 26 26.5 27 Mozambique 21 21.4 Niger 28* 20 Nigeria 11.9 12.5 13 13.5 14.1 14.6 17.3 Rwanda 19.3* 16.3* Senegal 39.5* 39.5 39.5 39.5 39.5 39.5 Sierra Leone 18.4* 18.8 19 19.1 19.3 19.4 19.6 19.7 19.9 20 South Sudan 30 Note: * actual
12

13
Table 10: Primary education expenditure as a share of total education expenditure Country 2001 2002 2003 2004 2005 2006 2007 2008 2009 2010 2011 2012 2013 2014 2015 Benin 49.6 50* 52.8 51.3 50 Burkina Faso 57 56.5 56 55.5 55 66* 53.5 52 50 Cameroon 37* 35* 38 (34*) 39 41 42 43 45 46 47 49 50 CAR 49 52* 53.5 52.9 47.3 46 Ghana 37.1 37.2 36.5 33.6 34* 37.1 37.2 Guinea 37 43.7 45 50 Ethiopia 42.4 48 (51*) 49.3 53.4 48 51.7 48 47.8 47.8 48.1 48.4 Madagascar Mali
63* 60* 50
Mozambique 46.7 (70*) 26.7 38.2 40.4 40.2 40.4 40.6 41.8 37.2 40.8 Niger 49* 64* 50 Nigeria 36.9 37.1 37.3(45*) 37.5 37.7 37.9 39 Rwanda 51* 47.4(46*) 46.7 46.1 45.4 45.8 46.3 46.8 47.1 47.7 Senegal 38.4 42 48.1 46* South Sudan 58 Zambia 59* 63.1 65.8 67.4 Notes: *actual share Source: 2005-2007 actual shares have been extracted from the 2009 GMR.

5. PROJECTED EXPENDITURE Table 11 presents the most recent recurrent and development expenditure projections for primary education in SSA countries. These have been extracted from national education plans, with the exception of Ethiopia and Mozambique, which are unpublished MoE projections. Complete sets of expenditure projections for the period 2004/05 to 2015 are only available for 10 countries. Another seven countries have projections which cover only part of this period, which typically have been made for the current three-five year phase of a longer-term national education plan. A top priority should be, therefore, to obtain up to date expenditure projections for all the missing countries. Where these are not available, they should be generated as soon as possible. Table 12 compares the actual annual average rates of expenditure growth for primary education for the period 2000-2005 (or nearest dates for which data is available) with the corresponding projected rates of expenditure growth for the period 2005-2015. The main sources for expenditure data are the UNESCO Institute of Statistics (2000, 2001 and latest year available), IMF government financial statistics (which are very patchy), RESEN country reports for francophone African countries, and a few NEPs. A lot more work is required to obtain complete and accurate time series education expenditure data. Eighteen out of the 30 countries for which past expenditure data is available have had annual rates of education expenditure growth exceeding 5%. A key issue is, therefore, is the extent to which such high rates of expenditure growth can be sustained. There are only a few countries where projected expenditure growth rates exceed recent historic rates by more than five percentage points (although this number would almost certainly be considerably larger if past and/or projected expenditure data was available for all countries, in particular those that are or have recently been affected by serious conflict). Unit recurrent expenditure Table 13 shows projected recurrent expenditure per primary school learner for 2005 (or nearest year to this) and 2015 for 16 countries for which data is available. The variation in projected unit costs among these countries is striking. At one extreme, projected unit costs in 2015 are less than US$50 in seven countries (Burkina Faso, Central African Republic, Ethiopia, Guinea, Rwanda, Sierra Leone, and Uganda) while, at the other extreme, they are over US$150 (i.e. at least three times higher) in three countries (Cameroon, Nigeria, Tanzania). Unit costs are projected to be five times higher in Nigeria than in Ethiopia. Similarly, marked variations exist in the percentage increase in unit costs from 2004/2005 to 2015. Unit costs over double in size in some countries whereas this increase is less than one-third in others.
14

15
Table 11: Projected expenditure for primary education in SSA countries Country LCU 2001 2002 2003 2004 2005 2006 2007 2008 2009 2010 2011 2012 2013 2014 2015 Benin Recurrent CFA bn 42.9 61.6 78.7 108 Development 3.6 8.1 26.8 24.3 Total 46.5 69.7 105.5 132.3 Burkina Faso Recurrent CFA bn 26.8 28.8 31.1 33.7 36.5 47.5 62.8 92.6 Development 11 11.7 11 12.5 11.8 15.1 18.2 22.6 Total 37.8 40.5 42.1 46.2 48.3 62.6 81 115.2 Cameroon Total CFA bn 75 260 Central African Republic Recurrent CFA bn 10.5 12.1 13 Development 6.1 6.4 7.5 Total 16.6 18.5 20.5 Ethiopia Recurrent Birr m 2227 2570 2868 3393 3977 4351 4589 4686 4766 4788 4786 Development** 1500 1751 2328 2942 1294 1160 676 459 196 129 162 Total 3727 4321 5196 6335 5271 5511 5265 5145 4962 4917 4948 Ghana Recurrent Cedi bn 1788 2087 2254 2372 2815 3394 Development 296 414 513 512 366 420 Total 2084 2501 2767 2884 3181 3814 Guinea Recurrent FG bn 76.3 85.4 106.3 128 146.2 167.7 191.5 218.9 250.5 286.4 327.3 Development 49 105.8 139.7 153.1 162.9 153 164.9 160.6 173.9 188.2 Total 134.4 212.1 267.7 299.3 330.6 344.5 383.8 411.1 460.3 515.5 Kenya Total Sh m 8702 9512 9390 9132 9055 9372 9699 10039 10390 10753 Madagascar Recurrent Ariary bn 162.6 205.3 228.1 251.8 Development 67 82.1 86.4 90.9 Total 229.6 287.4 314.5 342.7 Mali Recurrent CFA m 42659 45848 55327 60602 67394 74787 82840 89866 97458 105668 114557 124190 Development 14978 14978 14978 14978 14978 14978 14978 14978 14978 14978 14978 14978 Total 57637 60826 70305 75580 82372 89765 97818 104844 112436 120646 129535 139168 Mozambique Recurrent Met m 4163 4925 6438 7358 7818 8300 8555 8852 8067 9366 Development 0 3539 1509 1608 1606 1656 1717 2272 2319 2841 Total 4163 8464 7947 8966 9424 9956 10272 11124 10386 12207 Nigeria Recurrent Naira bn 237.2 236.7 318.6 341.7 366.5 393.2 560.5 Development 26.2 58.7 64 69.2 74.4 79.6 18.8 Total 263.4 295.4 382.6 410.9 440.9 472.8 579.3 Rwanda Recurrent RFW bn 34.1 42.6 50 56.6 61 67.1 72.3 80.2 85.9 Development 8 8.3 8.6 9 9.3 9.7 5.9 6.1 6.3 Total 42.1 50.9 58.6 65.6 70.3 76.8 78.2 86.3 92.2 Senegal Recurrent CFA m 91588 100114 113218 128006 147055 171506 Development 34012 35713 37262 31479 26921 27600 Total 125600 135827 150480 159485 173976 199106 Sierra Leone Recurrent Leone m 68928 72957 77084 81306 89438 98368 108197 119043 131042 Development 17032 17106 17182 16923 15736 15772 15811 15851 15891 Total 85960 90063 94266 98229 105174 114140 124008 134894 146933 Uganda Recurrent Sh bn 294.6 309.7 405.5 408.8 414.9 427.5 447.1 468.1 499.9 528.4 570 Development 105.8 97.7 80.7 41.1 46.2 60 111 145.3 187.9 248.8 321 Total 400.4 407.5 486.2 449.9 461.1 487.5 558.1 613.4 687.9 777 891 Tanzania Recurrent Sh bn 813 1116 1150 1265 1328 1395 1465 1538 1614 Development 215 295 304 288 346 300 319 336 353 Total 1028 1411 1454 1553 1674 1695 1784 1874 1967 Zambia Recurrent US$ m 74.4 75.1 76.6 77.4 77.7 77.4 79.7 83.3 Development 42.3 58.8 117.6 198.7 240.4 273.4 338 493.2 Total 116.7 133.9 194.2 276.1 318.1 350.8 417.7 576.5 Notes: ** includes secondary

Table 12: Average annual rates of growth in primary education expenditure in early-mid 2000s and projected required expenditure (constant prices) Country Previous Projected Difference Madagascar -15.5 14.3 29.8 Eritrea -11.1 na na Congo -8.9 na na Zambia -4.1 25.6 29.7 Togo -3.8 na na Ethiopia -0.7 2.9 3.6 Kenya 2.9 2.4 -0.5 Lesotho 2.9 na na Uganda 2.9 8.3 5.4 Namibia 3.3 na na Cote d'Ivoire* 3.6 na na South Africa 3.7 na na Malawi 5.2 na na Burkina Faso 5.5 8.3 2.8 Senegal* 6.7 6.7 0 Niger* 7.2 9.7 2.5 Benin 7.8 11 3.2 Cameroon* 8.4 13.2 4.8 Chad* 9.3 na na Guinea* 9.8 na na Central African Republic 11.2 11.1 -0.1 Angola* 11.5 na na Swaziland 12.5 na na Mali 13.4 8.3 -5.1 Rwanda 15 10.3 -4.7 Ghana 15.2 4.7 -10.5 Sierra Leone 19.2 6.7 -12.5 Mozambique 19.3 12.7 -6.6 Burundi 19.7 na na Tanzania 31.5 8.4 -23.1 Notes: * Total education expenditure during previous period For reference periods, see annex tables 3, 4, and 5
16

Table 13: Projected recurrent expenditure per primary school learner Country Currency Year Value 2015 $ Base $ 2015 % change Benin CFA 2005 36983 60335 70.8 115.6 63.2 Burkina Faso CFA 2005 26659 31964 51 61.2 20 Cameroon CFA 2005 29551 78675 58.3 155.2 166.2 CAR CFA 2008 20192 22034 46 50.2 9.1 Ethiopia Birr 2005 183 246 21.4 28.8 34.6 Ghana Cedi (000) 2005 771 983 85.7 109.2 27.4 Guinea GF 2005 81343 170114 23.2 48.5 109.1 Liberia US$ 2007 19.5 Na 19.5 na Na Madagascar Aviary 2004 59648 Na 30.1 na Na Mali CFA 2005 33602 50120 64.4 96 49.1 Mozambique Metical 2005 1330 2350 49.4 87.4 76.9 Nigeria Naira 2005 956 1593 95.5 159 66.5 Rwanda RWF 2007 15860 47962 15.9 48 201.9 Sierra Leone Leone (000) 2007 67 117 24.2 42.6 76 Tanzania TSh (000) 2008 136 178 115.3 150.8 30.8 Uganda Ush 2004 39197 80965 21.7 44.8 51.6 Zambia Kwacha (000) 2007 151 396 34.3 89.9 162.1 Note: The US dollar exchange rate in the base year has been used to convert base year and 2015 projected unit costs. Funding gaps Only four countries (Guinea, Mali, Sierra Leone and Tanzania) have projections of their annual funding gaps5 for primary education for the entire period 2004/05 to 20015. Another three countries have partial information on funding gaps for primary education including an estimate for 2015 (see table 14). Other countries have estimates of the funding gap for the education sector as a whole, but these are not broken down by education sub-sector. Not surprisingly, the relative size of the funding gap (i.e. in relation to total projected expenditure) is largest in post-conflict countries and francophone countries with low enrolment rates. Table 15 compares the average annual funding gaps derived from the national plans and those generated by Bruns et al for the 2003 World Bank study for seven countries in SSA. Three of these countries have missing data for some years, but it has been assumed that the size of the annual funding gaps increases/decreases linearly during these periods. What is most noticeable is that the annual funding gaps based on national estimations are over 50% higher than the World Bank estimates in four out of the seven countries. The divergence is particularly marked for the two largest countries, namely Nigeria and Tanzania. Grossing up these estimates for all low income countries, it is, therefore, conceivable, that the Bruns et al global estimate of an annual US$3.5 billion shortfall in funding for primary EFA by 2015 may need to be at least doubled. For these seven countries alone, the annual funding gap is more than one billion dollars more than the World Bank estimates.
5 The funding gap is the difference between total projected resource requirements for primary education and
projected total domestic resources availability for primary education.
17

Table 14: Funding gap for primary education (billions local currency units) Country 2003 2004 2005 2006 2007 2008 2009 2010 2011 2012 2013 2014 2015 Benin Gap 3.6 14.4 21.9 35.2 Total 46.5 69.7 105.5 132.3 % 7.7 20.7 20.8 26.6 CAR Gap 11.1 11.5 12.6 15.3 Total 19.5 21 23.1 % 56.9 54.8 54.5 Ethiopia Gap 2.4 2 2.3 1.2 -0.2 Total 8.2 9.4 11.6 1.3 11.9 % 29.3 21.3 19.8 92.3 -1.7 Ghana Gap 156 395 396 201 203 Total 2501 2767 2884 3181 3814 % 13.7 14.3 13.7 6.3 5.3 Guinea Gap 47 107.1 148.9 165.2 179.8 174.3 193.1 197.8 222.2 250.3 Total 134.4 212.1 267.7 299.3 330.6 344.5 383.8 411.1 460.3 515.5 % 35.0 50.5 55.6 55.2 54.4 50.6 50.3 48.1 48.3 48.6 Madagascar Gap 23.7 117.9 127.4 138.2 Total 229.6 287.4 314.5 342.7 % 10.3 41.0 40.5 40.3 Mali Gap (F1) 6.2 8.9 12.6 17 23.3 26.1 30.6 35.7 41.5 48.1 Total 31.9 40.6 46.3 53.2 61.2 70.3 78.1 86.8 96.5 107.2 % 19.4 21.9 27.2 32.0 38.1 37.1 39.2 41.1 43.0 44.9 Mozambique Gap 1364 2002 3093 Total 5114 6584 9250 % 26.7 30.4 33.4 Nigeria Gap 73.3 84.5 149 152.6 155.8 158.8 163.9 Total 263.4 295.4 382.6 410.9 440.9 472.8 579.3 % 27.8 28.6 38.9 37.1 35.2 33.6 24.6 Senegal Gap 9.6 10.2 14.4 12.1 14.3 26.2 Total 129 139.6 154.7 164.2 178.5 204.4 % 7.4 7.3 9.3 7.4 8.0 12.8 Sierra Leone Gap 45540 45824 47424 48237 52623 57209 63210 68683 77052 Total 85960 90063 94266 98229 105174 114140 124008 134894 146933 % 53.0 50.9 50.3 49.1 50.0 50.1 51.0 50.9 52.4 Tanzania Gap 220 480 385 323 260 186 170 148 118 Total 1028 1411 1454 1553 1674 1695 1784 1874 1967 % 21.4 34.0 26.5 20.8 15.5 11.0 9.5 7.9 6.0
18

Table 15: National education plan and World Bank estimates of average annual funding gap for primary education (US$ million) Country Plan World Bank Average aid 2005-06 Benin 36 20 35 Ghana 28 21 121 Guinea 35 35 17 Mali 49 51 148 Nigeria 1108 214 13 Sierra Leone 21 8 13 Tanzania 210 80 133 Notes: World Bank figures have been taken directly from Bruns et al. The Plan annual funding gaps for the relevant projection periods have been summed. The mean annual LCU value has then been converted into US dollars using the exchange rate at the beginning of the projection period in each country (see annex table 6).
19
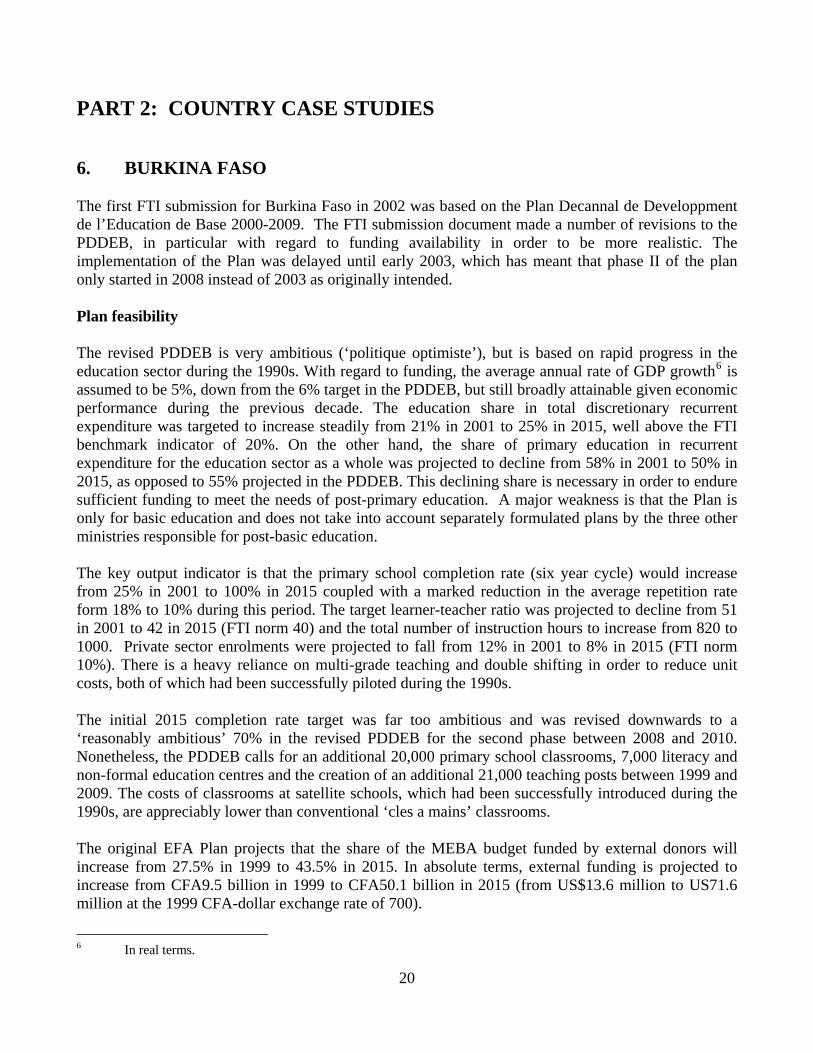
PART 2: COUNTRY CASE STUDIES 6. BURKINA FASO The first FTI submission for Burkina Faso in 2002 was based on the Plan Decannal de Developpment de l’Education de Base 2000-2009. The FTI submission document made a number of revisions to the PDDEB, in particular with regard to funding availability in order to be more realistic. The implementation of the Plan was delayed until early 2003, which has meant that phase II of the plan only started in 2008 instead of 2003 as originally intended. Plan feasibility The revised PDDEB is very ambitious (‘politique optimiste’), but is based on rapid progress in the education sector during the 1990s. With regard to funding, the average annual rate of GDP growth6 is assumed to be 5%, down from the 6% target in the PDDEB, but still broadly attainable given economic performance during the previous decade. The education share in total discretionary recurrent expenditure was targeted to increase steadily from 21% in 2001 to 25% in 2015, well above the FTI benchmark indicator of 20%. On the other hand, the share of primary education in recurrent expenditure for the education sector as a whole was projected to decline from 58% in 2001 to 50% in 2015, as opposed to 55% projected in the PDDEB. This declining share is necessary in order to endure sufficient funding to meet the needs of post-primary education. A major weakness is that the Plan is only for basic education and does not take into account separately formulated plans by the three other ministries responsible for post-basic education. The key output indicator is that the primary school completion rate (six year cycle) would increase from 25% in 2001 to 100% in 2015 coupled with a marked reduction in the average repetition rate form 18% to 10% during this period. The target learner-teacher ratio was projected to decline from 51 in 2001 to 42 in 2015 (FTI norm 40) and the total number of instruction hours to increase from 820 to 1000. Private sector enrolments were projected to fall from 12% in 2001 to 8% in 2015 (FTI norm 10%). There is a heavy reliance on multi-grade teaching and double shifting in order to reduce unit costs, both of which had been successfully piloted during the 1990s. The initial 2015 completion rate target was far too ambitious and was revised downwards to a ‘reasonably ambitious’ 70% in the revised PDDEB for the second phase between 2008 and 2010. Nonetheless, the PDDEB calls for an additional 20,000 primary school classrooms, 7,000 literacy and non-formal education centres and the creation of an additional 21,000 teaching posts between 1999 and 2009. The costs of classrooms at satellite schools, which had been successfully introduced during the 1990s, are appreciably lower than conventional ‘cles a mains’ classrooms. The original EFA Plan projects that the share of the MEBA budget funded by external donors will increase from 27.5% in 1999 to 43.5% in 2015. In absolute terms, external funding is projected to increase from CFA9.5 billion in 1999 to CFA50.1 billion in 2015 (from US$13.6 million to US71.6 million at the 1999 CFA-dollar exchange rate of 700).
6 In real terms.
20
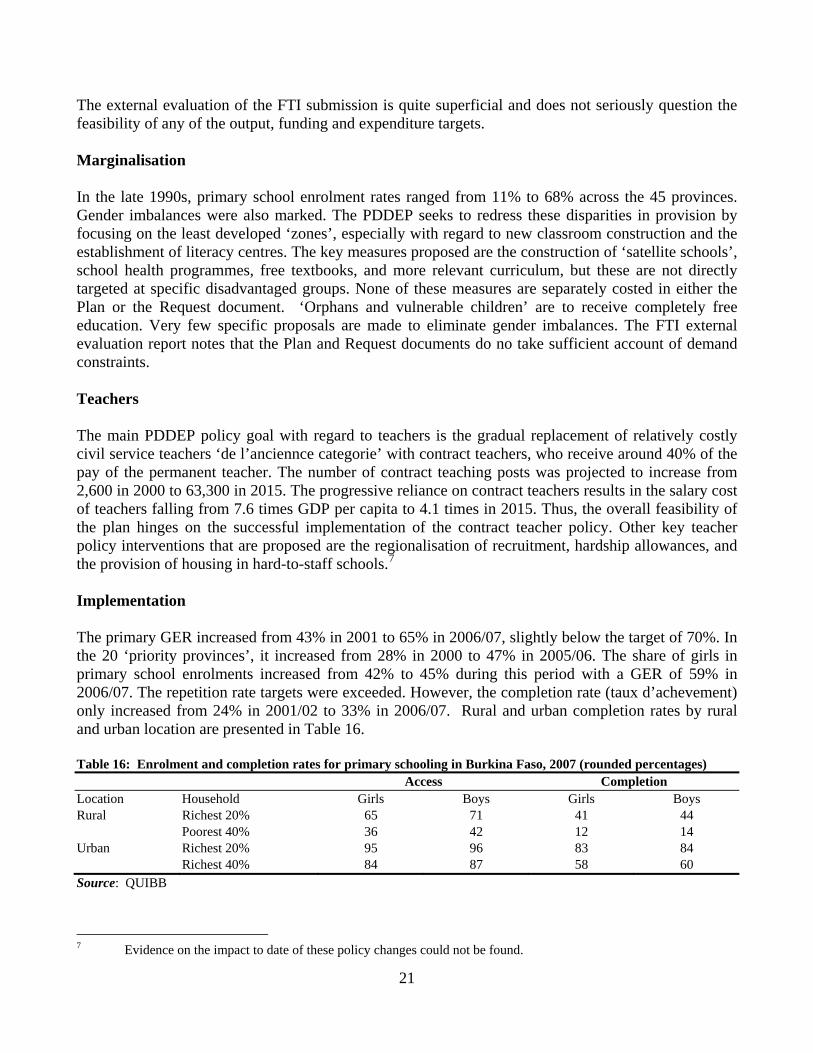
The external evaluation of the FTI submission is quite superficial and does not seriously question the feasibility of any of the output, funding and expenditure targets. Marginalisation In the late 1990s, primary school enrolment rates ranged from 11% to 68% across the 45 provinces. Gender imbalances were also marked. The PDDEP seeks to redress these disparities in provision by focusing on the least developed ‘zones’, especially with regard to new classroom construction and the establishment of literacy centres. The key measures proposed are the construction of ‘satellite schools’, school health programmes, free textbooks, and more relevant curriculum, but these are not directly targeted at specific disadvantaged groups. None of these measures are separately costed in either the Plan or the Request document. ‘Orphans and vulnerable children’ are to receive completely free education. Very few specific proposals are made to eliminate gender imbalances. The FTI external evaluation report notes that the Plan and Request documents do no take sufficient account of demand constraints. Teachers The main PDDEP policy goal with regard to teachers is the gradual replacement of relatively costly civil service teachers ‘de l’anciennce categorie’ with contract teachers, who receive around 40% of the pay of the permanent teacher. The number of contract teaching posts was projected to increase from 2,600 in 2000 to 63,300 in 2015. The progressive reliance on contract teachers results in the salary cost of teachers falling from 7.6 times GDP per capita to 4.1 times in 2015. Thus, the overall feasibility of the plan hinges on the successful implementation of the contract teacher policy. Other key teacher policy interventions that are proposed are the regionalisation of recruitment, hardship allowances, and the provision of housing in hard-to-staff schools.7 Implementation The primary GER increased from 43% in 2001 to 65% in 2006/07, slightly below the target of 70%. In the 20 ‘priority provinces’, it increased from 28% in 2000 to 47% in 2005/06. The share of girls in primary school enrolments increased from 42% to 45% during this period with a GER of 59% in 2006/07. The repetition rate targets were exceeded. However, the completion rate (taux d’achevement) only increased from 24% in 2001/02 to 33% in 2006/07. Rural and urban completion rates by rural and urban location are presented in Table 16. Table 16: Enrolment and completion rates for primary schooling in Burkina Faso, 2007 (rounded percentages)
Access Completion Location Household Girls Boys Girls Boys Rural Richest 20% 65 71 41 44
Poorest 40% 36 42 12 14 Urban Richest 20% 95 96 83 84
Richest 40% 84 87 58 60 Source: QUIBB
7 Evidence on the impact to date of these policy changes could not be found.
21

Nearly 2,500 new schools were constructed between 200and 2005, a remarkable 50% increase. The recruitment targets for teachers were also broadly met. However, the second phase PDDEP notes that various shortcomings including classroom construction and limited progress in some ‘priority’ provinces. It is important to note that the PDDEP has been implemented at the same time as wide ranging decentralization/deconcentration strategies. Limited planning and management capacity at the provincial level have posed major challenges. The share of basic education in domestically-generated public revenue increased only slightly from 9.6% in 2000 to 12.2% in 2005. However, if external funding is included, then the basic education share increased from 10% to 20% during this period. This was possible because the share of external funding of basic education increased markedly from 24% in 2001 to 40% in 2005. The overall recurrent expenditure of primary education was 71% in 2005, well above the target of 55%. The learner-teacher ratio for primary education was 47 in 2005, which is only slightly above the target for that year of 45.6. However, the number of out of school children was still estimated to be 1.2 million in 2006, 35% of the school age population. Burkina Faso has still not received anything from the FTI Catalytic Fund or any projected disbursements expected until the end of 2009. 7. ETHIOPIA The first FTI submission for Ethiopia in 2004 was based on the third Education Sector Development Plan, which covers the period 2005/06-2009/10. This is part of a twenty-year ‘indicative plan’ for the education sector. Plan feasibility The ESDP notes that ‘faster progress’ is needed in order to attain UPE and the other education MDG goals. High drop out rates, low internal efficiency, and limited relevance of the curriculum continue to hamper progress. The share of education in GDP is projected to increase from 3.1% in 2003/04 to 7.1% in 2009/10 with the result that the education budget will double. The financing gap is projected at 14.5%, which is lower than ESDP 1 and 2.8 Projected GDP growth is 9.6%. The eight-year primary cycle makes it that more challenging to achieve UPE in Ethiopia. The GER target for primary education is 113% by 2009/10 with a decline in the learner-class ratio from 70 to 50. For primary schooling, the plan targets are to build 200,000 new classrooms, create 300,000 new teaching posts, and distribute nearly 150 million textbooks. For secondary education, despite a lower transition rate from primary to secondary, the targets remain ambitious: 15,500 additional teachers and a learner-teacher ratio of 40. The number of universities is to increase from 8 to 21.
8 Total financial requirement for ESDP III is Birr53.7 billion. Total domestic resources available for education
(government, ‘community contributions’ and ‘cost shared by students’) is projected to be Birr 46 billion leaving a funding gap of Birr7.7 billion.
22

During ESDP3, ‘greater emphasis will be placed on quality enhancement by introducing a more relevant curriculum, better quality assurance, and continuous professional development’. To this end, non-salary unit expenditure is to increase threefold and the share of salaries in total recurrent expenditure is to fall from 90% to 61%. While ‘community contributions are to increase significantly’, the plan does do not specify how this is to be achieved. The ESDP notes that ‘the targets are quite high and may seem unachievable.’ However, ‘the government is confident that the targets will be met mainly for its two main strategies (sic). Firstly, expanding primary education is the responsibility of the woredas. Hence the activities will be undertaken by over 600 woredas, which will reduce the operations to a manageable size. Secondly, the program will make use of different modalities for the provision and improvement of quality of primary education. The modalities cover low-cost formal schools, alternative basic education, multi-grade classrooms etc’ (p.43). As noted earlier, considerable emphasis is placed on the widespread adoption of low-cost methods of classroom construction. Marginalised The ESDP states that ‘special emphasis will be given to primary education in rural and other under-served areas as well as the promotion of education for girls’ Despite enrolment targets for primary education being exceeded by the first two ESDPs, very large enrolment disparities persist. The GER for the main pastoralist regions (Afar and Somali) are barely 20%. Between 10-20% of children in Ethiopia are estimated to have ‘special needs’ and around four million children aged 8-14 are not in school. The ESDP focuses on the establishment of ‘alternative basic education centres’ and ‘village schools’ in order to attract and retain out of school children. There is, however, a heavy reliance on CBOs and NGOs to build these.9 The plan also recognises the urgent need for promoting ‘greater gender-awareness and making schools more girl-friendly’ (especially through the provision of separate toilets, female teachers and guidance and counseling). More schools will be built nearer communities in order to minimize distance to school for girls and every girl finishing junior secondary schooling is ‘guaranteed’ one year of technical and vocational training. Teachers The ESDP notes that ‘non-civil servant teachers’ will be recruited as a ‘stop-gap measure’. Poor teacher utilisation is a critical problem in Ethiopia, but this is not addressed by the ESDP. There is still no system for addressing teacher deployment imbalances. With the projected threefold expansion of TVET enrolments, it is planned to increase the number of expatriate instructors from 69 to 2,000. However, by late 2008, only around 150 German master craftsmen were employed at an average annual unit cost of US$80,000, which was met by the government.
9 No separate budget is presented for alternative basic education. It is subsumed under ‘primary education’.
23

Implementation The annual joint review meeting between government and donors is the main opportunity to monitor progress. The report of the 2006 meeting notes that the main failing of the ESDP is that it is ‘target driven planning disconnected from resource-constrained budgeting. At both federal and regional levels, projection costs are not systematically reconciled with actual budgets and spending on education (p.20). Furthermore, ‘too much is expected from largely impoverished communities’. The 2005/06 and 2006/07 budget allocations bear little relation to the ESDP target expenditure projections (see table 17). More recent national education expenditure data (covering both federal and regional levels) could not be obtained, but it would appear that the very rapid expansion of higher education provision is seriously reducing the expenditure shares of both primary and secondary education. Table 17: ESDP3 projected expenditure and actual budget shares by education sub-sector, 2005/06 and 2006/07
2005/06 2006/07 ESDP Budget ESDP Budget
Primary 55 27 46 26 Secondary 9 5 13 8 TVET 6 3 10 2 Tertiary 25 41 23 53 Notes: Recurrent and development expenditure Source: Report of 2007 Joint Review Meeting The primary learner-teacher ratio has increased appreciably from 42 in 1996 to 72 in 2004. The corresponding figures for secondary schooling are 35 and 54. Government budgets for school operating costs are tiny and declining and teacher salaries continue to crowd out other inputs. Very low learning achievement continues to be a major challenge. The 2007 Joint Review report notes that ‘there is an almost total lack of basic management practices’ at all levels in the education sector (p.53), which is exacerbated by very high staff turnover in many of the woreda education offices. Given very weak information flows, ‘policymaking processes are not sufficiently based on evidence’. It is also the case that ‘the growth in secondary education enrolments is putting considerably pressure on budgets and systems’ (p.54). The school system has been largely decentralised to the regional and district (woreda) levels without strong central ministerial control and oversight… Schools themselves have little autonomy and control of resources. The limited management capacity in the regions means that that there is significant under-spending of donor-funded capital budgets since ‘the complexity of donor procedures defeats the capacities in the first place’ (JRM, 2006 p. 19). The WEOs themselves are absorbing a lot of resources. Despite the importance attached to educating marginalized children, ‘demand side initiatives are relatively small scale’ (JRM, 2006, 34). Only around half a million school children were fed at school in 2005 (around 3% of total primary and secondary enrolments). As in other countries, the relatively high unit costs of the WFP schooling feeding programme is a major issue.
24
Another major concern is that ‘government funding does not take into account the different capacities of communities to raise their own income’. Stronger WEOs are in a better position to attract external resources, which is leading to a worsening distribution of public expenditure in the education sector. With regard to girl’s education, the gender enrolment rate gap in secondary education has widened. Only token support is provided for poor girls attending secondary schools. 8. RWANDA The first FTI submission for Rwanda in late 2006 was based on two documents, namely the Education Sector Strategic Plan 2006-10 and the Long-Term Strategy and Financing Framework 2006-2015. Plan feasibility The key goal of the Vision 2020 national development strategy for Rwanda is that the country should become a ‘high-skill’ society within the next 15-20 years. As a consequence, the government attaches top priority to the development of technical and vocational training and higher education while, at the same time, seeking to achieve universal basic education of nine years by 2015. The ESSP and LTSFF are very ambitious and it is unlikely, therefore, that many of their key goals and objectives will be attained. The key ‘output indicator’ is the attainment of UPE by 2010 with a completion rate of 132% by 2015. And yet, the primary schooling completion rate was barely 50% in 2005, which is low even by African standards. The adoption of UBE makes the attainment of UPE that much challenging because of the largest expansion of enrolments will be at the upper basic/junior secondary level, which, in Rwanda, is three times more resource intensive than primary education. As with other national education plans, little detailed attention is given to how key weaknesses in education provision are to be addressed. For example, as the FTI Assessment report notes, ‘very few textbooks reach classrooms’. The plan emphasizes the need to reduce unit costs particularly by improving teacher deployment, reducing the number of non-teaching staff, and introducing school improvement plans. ‘Expanded access requires reduction in costs per student if the resource envelope is not to be exceeded’ (p.12). However, unit expenditure for primary schooling is projected to double during the plan period mainly as result of lower learner-teacher ratios and improved provision of learning materials. Adequacy of projected financing The key domestic resource funding parameters adopted by the two plans are quite reasonable and are within the FTI benchmark indicators: national public education expenditure is projected to increase from 5 to 6% of GDP and the share of primary education in total education expenditure increases from 41% to 46%. Average annual GDP growth is projected to be 5%, which is quite realistic on the basis of recent past growth, but it unlikely to be attainable given the current global economic crisis. The recently revised ESSP, which now covers the period 2008-2012, assumes an average annual GDP growth rate of over nearly 14%, which is even more unrealistic.
25

More than anything else, the overall feasibility of the ESSP hinges on the availability of external resources. In 2006, external grants amounted to 42% of total public resources. The overall ‘financing gap’ (projected expenditure-expected ‘resources’) for the ESSP increases from 22% to 30% of total projected expenditure during the five-year plan period. However, this does not include external funding (‘budget support’), which is expected to amount to 52% of the total government budget in 2006, falling to 22% in 2015. What this means, therefore, is that only 32.7% of total projected education expenditure requirement for the period 2006-2010 comes from domestically generated resources. The LTSFF assumes that, despite the already very high levels of aid dependency, this additional external funding will be forthcoming. Furthermore, it is further assumed that nearly one-third of all additional classroom construction will be met by the ‘off-budget’ support of faith-based organizations, NGOs and local communities. Marginalised groups As the FTI Assessment report points out ‘there is no holistic strategy for addressing the educational constraints of the poorest’. This is despite the fact that both plans call for ‘dramatically reducing drop out and repetition’. The ESSP proposals for ‘hard to reach children’ amount to little more than the introduction of ‘flexible complementary or catch up programmes’.10 Nor are there specific policies and costings for ‘disabled’ children even though the ESSP states that around 10% of students suffer from some form of disability. No clear distinction is made between providing ‘alternative’ (non-formal) education opportunities for hard-to-reach children and initiatives that seek to get these children to enroll and remain in the conventional schools. Teacher policies The ESSP recognizes that ‘teacher motivation at all levels is an important consideration’ and also seeks to improve the qualification profile of teachers, especially with respect o secondary schooling where only half of teachers are fully qualified. The MoE has since formulated a Teacher Development and Management policy, which covers most key areas concerning the competence, commitment and deployment of teachers. However, the ESSP itself contains very little information on teacher employment issues. Teacher salaries are very low in Rwanda, especially for primary school teachers who earn little more than $70 per month. The ESSP proposes, therefore, that the average salary for a primary school teacher should be increased from 3.7 times GDP per capita to 4.4 times by 2010, which is well above the FTI salary benchmark norm of 3.5. The corresponding figures for junior secondary (tronc commun) are 3.7 to 4.5 and, for upper secondary, 3.9 to 5.7.
10 A special national fund (FARG) continues to support orphans and other children directly affected by the genocide.
This includes payment of school fees. However, this is not explicitly mentioned in the ESSP apart from noting that ‘contributions from FARG’ have not been included in the projected education expenditure figures ‘as FARG funds are ‘categorized under social protection rather than under the education sector’.
26

Not only are salaries low, but teachers in Rwanda have high workloads, especially those teaching in the lower primary phase who have to teach two separate classes each day. Reducing double shifting is correctly seen as an essential step in improving quality, but the cost implications of the proposed increase are so large that this target has been effectively scrapped (see below). The Assessment report notes that it is ‘unlikely that enough civil service teachers can be recruited to fill teacher deficits’ due to financial and training capacity constraints. The government has agreed with the IMF that the annual growth in the teaching force should be capped at 3% per annum11. As in other countries, government is seeking to circumvent this by employing contract teachers particularly in districts where learner-teacher ratios are especially high. These teachers are being paid out of the recently introduced school per capitation grant. Their pay is only slightly less than qualified, certificate-level teachers. A key ESSP goal is to reduce the relatively large number of expatriate lecturers who have been employed in the burgeoning higher education sector. The expatriate salary bill is projected, therefore, to decline from RFW 2.1 billion in 2006 to RFW 0.26 billion in 2010. However, retention of national staff at the main higher education institutions remains low, mainly because of relatively poor salaries, with the result that the overall number of expatiates has increased rather than declined. Implementation progress The annual Joint Review of the Educational Sector by the MoE and its external partners has been the main mechanism for the monitoring and evaluation of the ESSP/LTSFF. The effectiveness of this process has been limited in a number of respects. In particular, donor capacity to undertake the necessary analytical work has been quite limited. Implementation of the ESSP has been profoundly affected by the introduction of new national and education policies since 2006. In particular, the elaboration by the MoE of new ‘fast track strategies for the implementation of nine years of basic education’, which will be introduced in 2009, constitutes a major revision of the ESSP. The formulation of these strategies has been undertaken by a team of World Bank-financed consultants with little consultation with the donor partners. The three main components of the these ‘strategies’ are the introduction of double shifting for all primary school grades, a shift from class to subject teaching in both lower and upper primary school phases, and the rationalisation of an overloaded curriculum’. Universal double shifting amounts to a reversal of the ESSP goal of virtually eliminating double shift classes by 2015 and subject specialisation for primary education, especially in lower primary, is a major departure from global norms. The decision in late 2008 to phase out French in favour of English as the medium of instruction in upper primary and secondary school phases also has major implications for educational quality and funding. The failure to recruit the projected required number of teachers has resulted in the continued deterioration in the learner-teacher ratio for primary schooling – from 69:1 in 2005 to 74:1, but there has been some limited improvement in the primary school completion rate (from 47% in 2005 to 52% 11 The IMF has recently stated that this cap is not binding and that new teachers can be recruited on the government
payroll.
27

in 2007). By contrast, the learner-teacher ratio in public lower secondary schools has declined from 30 to 22 during this period. Transition rates from primary to junior secondary and from junior secondary to senior secondary have also declined sharply. Low teacher motivation remains a critical issue. Salaries for graduate secondary school teachers were more than doubled in 2007 in an effort to improve teacher retention, which has deteriorated markedly in recently years. Fiscal constraints has meant that only relatively small increases in primary school teacher pay have been possible, resulting in sizeable pay differentials between the groups. With regard to funding, the education sector’s share of the national budget increased from 19.4% to 24% in 2007, having declined in the three years prior to the start of ESSP. While the number of external partners supporting the education sector has increased in recent years, the revised financing gap remains largely unchanged up to 2012. This has increased the importance of accessing additional FTI Catalytic Funds in 2009 and beyond. The ESSP has recently been revised and extended to 2012. It is noticeable that the projected share of primary education in total recurrent education expenditure by 2010 has increased appreciably from 46% in the original ESSP to 51% in the revised and the updated plan whereas the share of higher education falls from 24% to just 20%. By contrast, the actual share of primary education increased two percentage points in 2007 while the shares of secondary and higher education fell by one and four percentage points respectively (see table 18). The 2008 budget breakdown is a follows: primary 42%, secondary 25%, and higher 29%. Containing the costs of rapidly expanding secondary education, even with significant user charges, is therefore a critical issue. Table18: Sub-sector recurrent expenditure shares, original and revised ESSP
2006 2007 Original Revised Target Sub-sector baseline actual 2010 projection 2010 projection 2012 Primary 45 47 46 51 50 Secondary 20 19 22 18 22 Higher 29 25 20 24 22 Source: ESSP 2006-2010 and ESSP 2008-2012 The limited capacity of the MoE to implement the ESSP remains a key constraint. As the FTI points out ‘the number of officials in central government have been reduced dramatically in the past two years’ (p.12) as a result of comprehensive, donor-driven civil service reform. Decentralisation of most key functions has placed major additional responsibilities on district education offices, most of which do not have the personnel with the appropriate skills and experience in post. Contribution of FTI to the planning process and overall funding The 32-page FTI Assessment for Rwanda is considerably more detailed and analytically robust than for most other countries. It sets out clearly the major ‘challenges’ that confront the education system in Rwanda over the next decade. Even so, the Assessment concludes that the ESSP and LTSFF are ‘sound and credible’ plans based on ‘thorough costing’, as discussed above, this is not the case. A possible limitation of the assessment process is that it was undertaken by ‘the local donor group’ that supports education in Rwanda. While this group have in-depth knowledge of the education system, their role as partners of the Ministry may affect their analysis and overall judgments with respect to the
28

application for FTI funding. A truly external group is likely to provide more critical and objective analysis. A total of US$223 million was requested from the FTI for the period 2007-10. US$ mmm was granted, which is relatively high in per capita terms. 9. RECOMMENDATIONS This review of expenditure projections made by national education plans reveals major gaps and other shortcomings in the scope and quality of data. It is important, therefore, that the GMR team and its donor partners make concerted efforts to improve this situation so that robust expenditure projections can be made for every country, especially those that are seriously off track with respect to the attainment of EFA. All MoEs should be requested to generate and update robust estimates of education expenditure by sub-sector for at least the next 10 years on a rolling basis. This is especially urgent for countries that are currently ‘off track’ with respect to the attainment of EFA by 2015. Funding and expenditures from all sources should be included in these projections. At present, major capital expenditures (for example, from World Bank financed community-based social funds) are not captured. It is also particularly important to collect detailed expenditure on national and sub-national public expenditure on education, especially in large federal countries, most notably Ethiopia and Nigeria. Robust national estimates for total public expenditure for these countries are either not available or are not in the public domain. Finally, some of the FTI benchmark indicators are of questionable value. For example, the duration of primary education varies from four to eight years among countries in SSA so there is little point in specifying a benchmark indicator for the share of primary education in total expenditure. Similarly, this share tends to decrease appreciably as countries approach the attainment of EFA. Similarly, no across the board limits should be set on the relative size of the private sector. MoEs should develop their own target indicators based on prevailing realities and national priorities. REFERENCES Angola: Quality Education for All. Luanda April 2004. Benin: Plan Decennal de l’Developpement du Secteur de l’Education. 2005-2015. October 2006. Burkina Faso: Programme Decennal de Developpement de l’Education de Base. Phase I 2000-2009. PDDEB Phase II 2008-2010. Burundi: Poverty Reduction Strategy Paper 2006. Central African Republic: Strategie Nationale du Secteur de l’Education 2008-2020. Bangui. Chad: Plan d’action national de l’education pour tous a l’an 2015. 2004. Congo: : Plan d’action national de l’education pour tous . 2005 Cote d’Ivoire: Plan National de Developpement du secteur education/formation 1998-2010. Eritrea: Millenium Development Goals Report, Asmara, July 2005. Ethiopia: Education Sector Programmes II and III (2005/06-2010/11)
29

Joint Review Meeting October/November 2006. Ghana: Education for All National Action Plan, 2002 Education Strategic Plan 2003-2015. Guinea: Kenya: Kenya Education Sector Support Plan 2005/06-2009/10. Millennium Development Goals in Kenya: needs and costs. Ministry of Planning and National Development. 2005 World Bank, Education Sector Support Project. Economic and Financial Appraisal. Liberia: Primary Education Recovery Plan 2007/08-2009/10. Monrovia, March 2007. Madagascar: Plan Education Pour Tous. Situation en 2005. Actualisation des objectifs et strategies. Antananrivo, 4 May 2005 Mali: Proposition de Plan d’action pour mise en oeuvre acceleree du PISE 2 pour la scolarisation primaire universealle, Bamako October 2006. Mozambique: Education Sector Strategic Plan 2005-2009. Niger: Plan Decennal de l‘Education Nigeria: Ten-Year Plan for the Ministry of Education 2005-2015 Rwanda: Rwanda Education Sector: Long-term Strategy and Funding Framework 2007-2015 Education Sector Strategic Plan 2008-2012 Assesssment of the Government’s Education Strategy and Financial Framework 2006-2015 for the Fast Track Initiative. Joint Review of the Education Sector, 2008. Nine Years Basic Education Implementation: Fast track Strategies, November 2008. Senegal: Programme Decennal de l’Education et de la Formation, 2003 Sierra Leone: Education sector plan: a road map to a better future 2007-2015. 2007. Sudan: Education Sector Plan of the New Sudan. For the interim period of January 2005 to December 2010, Tanzania: Education Sector Development Plan 2008-2017. Revised edition2. November 2007. Togo: Plan d’Action National: Education Pour Tous, 2005. Uganda: Education Sector Strategic Plan 2004-2015 Zambia: Educating the Nation: strategic framework for the implementation of Education For All, 2005.
30

ANNEX TABLES Table A1: Target time in class in primary schools (hours/year) 2001 2002 2003 2004 2005 2006 2007 2008 2009 2010 2015 FTI 950 Burkina 820 1000 850-1000 Ghana 945 1000 Mali 821 901 Niger 960 960 Sierra Leone 886* 892 898 904 910 933 Note: *=actual figures Table A2: Projected share of salaries in total recurrent expenditure for primary schooling Counry 2001 2002 2003 2004 2005 2006 2007 2008 2009 2010 2011 2012 2013 2014 2015 Burkina Faso Primary 55.6 55.6 55.6 55.2 55 Camer oon All 86
a All .6* 67
Ethiopia
anAll 90* 62 61 61 60 60 61
Gh 73 Mozambique Primary 67 Niger Primary 72* 67 Rwanda Primary 72 67 67 67 67 Senegal Primary 98 98* 98* Sierra Leone Primary 68 68 67 67 67 66 66 65 65 Zambia Basic 90* 75 75 75 75 Note: *=actual figures
32

33
Table A3: Projected expenditure for primary education, 2004/05-2015 Country Type expenditure LCU 2004 2005 2006 2007 2008 2009 2010 2011 2012 2013 2014 2015 Ethiopia Recurrent Birr m 2227 2570 2868 3393 3977 4351 4589 4686 4766 4788 4786 Development 1500 1751 2328 2942 1294 1160 676 459 196 129 162 Total 3727 4321 5196 6335 5271 5511 5265 5145 4962 4917 4948 Guinea Recurrent FG bn 76.3 85.4 106.3 128 146.2 167.7 191.5 218.9 250.5 286.4 327.3 Development 49 105.8 139.7 153.1 162.9 153 164.9 160.6 173.9 188.2 Total 134.4 212.1 267.7 299.3 330.6 344.5 383.8 411.1 460.3 515.5 Kenya Total Sh m 8702 9512 9390 9132 9055 9372 9699 10039 10390 10753 Mali Recurrent FCA m 42659 45848 55327 60602 67394 74787 82840 89866 97458 105668 114557 124190 Development 14978 14978 14978 14978 14978 14978 14978 14978 14978 14978 14978 14978 Total 57637 60826 70305 75580 82372 89765 97818 104844 112436 120646 129535 139168 Mozambique Recurrent Met m 4163 4925 6438 7358 7818 8300 8555 8852 8067 9366 Development 0 3539 1509 1608 1606 1656 1717 2272 2319 2841 Total 4163 8464 7947 8966 9424 9956 10272 11124 10386 12207 Rwanda Recurrent RFW bn 34.1 42.6 50 56.6 61 67.1 72.3 80.2 85.9 Development 8 8.3 8.6 9 9.3 9.7 5.9 6.1 6.3 Total 42.1 50.9 58.6 65.6 70.3 76.8 78.2 86.3 92.2 Sierra Leone Recurrent L bn 68928 72957 77084 81306 89438 98368 108197 119043 131042 Development 17032 17106 17182 16923 15736 15772 15811 15851 15891 Total 85960 90063 94266 98229 105174 114140 124008 134894 146933 Tanzania Recurrent Sh bn 813 1116 1150 1265 1328 1395 1465 1538 1614 Development 215 295 304 288 346 300 319 336 353 Total 1028 1411 1454 1553 1674 1695 1784 1874 1967 Uganda Recurrent Sh bn 294.6 309.7 405.5 408.8 414.9 427.5 447.1 468.1 499.9 528.4 570 Development 105.8 97.7 80.7 41.1 46.2 60 111 145.3 187.9 248.8 321 Total 400.4 407.5 486.2 449.9 461.1 487.5 558.1 613.4 687.9 777 891 Zambia Total US$ m 74.4 75.1 76.6 77.4 77.7 77.4 79.7 83.3

34
Table A4: Total primary education expenditure in SSA countries (current prices) Country LCU 1997 1998 1999 2000 2001 2002 2003 2004 2005 2006 2007 Angola Recurrent 833 Development Total 30190 Benin Recurrent CFA bn 21.8 Development Total 26.7 31.8 50.1 Burkina Faso Recurrent CFA bn 27.9 30.1 32.5 36.9 42.2 48.1 57.4 Development (inc external) 16 8.7 18.7 13.3 21.3 18.9 Development 2 3 4.6 2.2 4 2.1 6.3 Total 29.9 33.1 50.2 123.5 Burundi Recurrent FBU bn 14.1 27.6 Development Total 6.3 8.5 22.6 Cameroon Recurrent CFA bn Development
otal
T 12 7.3Central African Republic Recurrent CFA bn 7 7.1 7.1 7.9 9.4 12.3 13 13.5 15 Development Total 5.7 Chad Recurrent CFA bn 11 Development Total 27.2 Congo Recurrent CFA bn Development Total 21 16.1 Cote d'Ivoire Recurrent CFA bn 113.2 117.9 129.4 130.7 Development Total 148.8 145.8 151.4 11.9 Eritrea Recurrent Development Total 91.4 124.8 Ethiopia Recurrent Birr m 0.52 0.57 0.6 Development Total 1.7 2.2? 2.6 Ghana Recurrent Cedi bn 273 893 1492 1688 1988 2922 Development Total 303
35
Country LCU 1997 1998 1999 2000 2001 2002 2003 2004 2005 2006 2007 Guinea Recurrent FG bn 40.1 Development Total 52.4 Kenya Recurrent Sh bn 20.7 21.4 Development Total 32 33.3 54 Lesotho Recurrent M mn Development Total 273.7 306.8 483.9 Liberia Recurrent Development Total 382 Madagascar Recurrent Ariary bn 222 143 Development 63 Total 406 359 206 254 Malawi Recurrent Kw bn 1.41 Development Total 1.81 4.7 Mali Recurrent EF1 CFA m 14.7 15.2 16.4 18.8 21.9 22.6 28.9 Development Total 87.8 Mozambique Recurrent Met m 445 Development Total 683 5203 Namibia Recurrent N$ bn Development Total 959 1102.3 1697.2 Niger Recurrent FCA bn 21.8 Development Total 44.2 Rwanda Recurrent RFW bn 9.1 10 Development Total 9.4 41 Senegal Recurrent CFA m 45.9 Development
otal
T 10 5.8

36
TableA 4 (cont.): Total primary education expenditure in SSA countries (current prices) Country LCU 1997 1998 1999 2000 2001 2002 2003 2004 2005 2006 2007 Sierra Leone Recurrent Leone m 23742 58135 Development Total 31056 South Africa Recurrent R bn Development Total 20.87 21.61 38.69 Swaziland Recurrent U mn Development Total 184.2 195.8 462.5 Uganda Recurrent Sh bn 99 113 135 162 Development Total 103 146 191 226 441.5 (08) Tanzania Recurrent Sh bn Development Total 146 386 391 491 544 Togo Recurrent FCA bn 16.1 Development Total 20.2 20.2 18.1 (08) Zambia Recurrent US$ m 60 Development Total 64 109.8 250 Notes: ** includes secondary
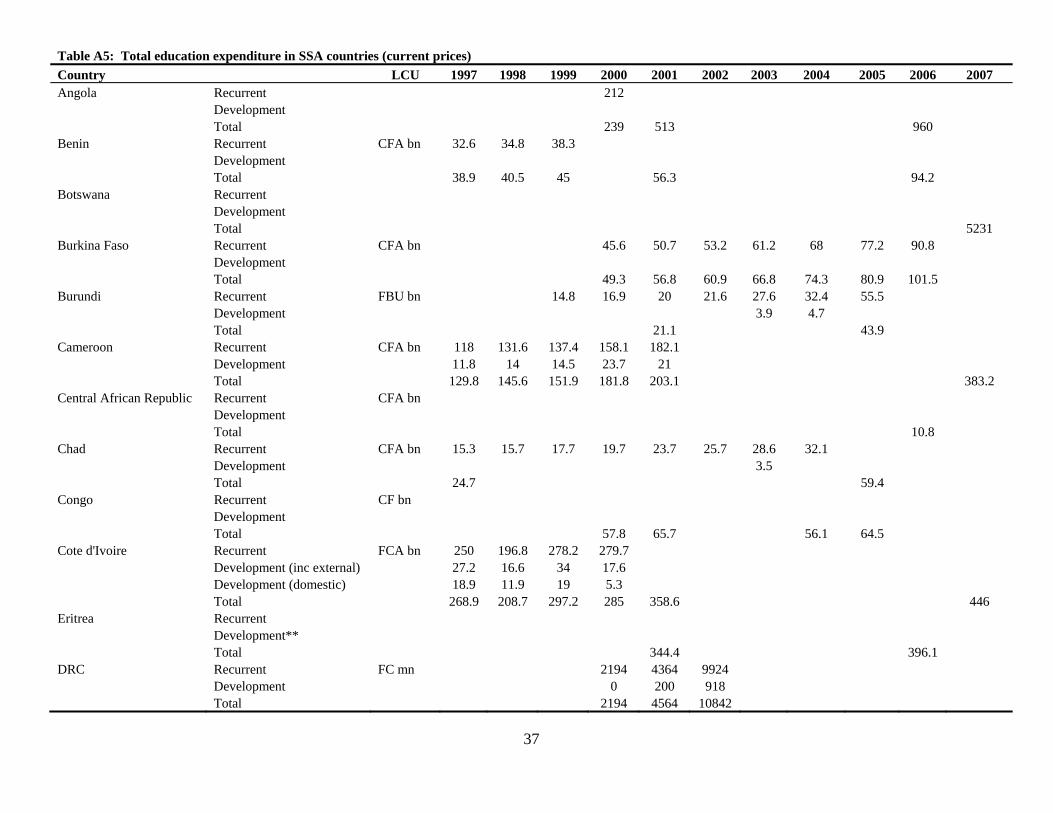
Table A5: Total education expenditure in SSA countries (current prices) Country LCU 1997 1998 1999 2000 2001 2002 2003 2004 2005 2006 2007 Angola Recurrent 212 Development Total 239 513 960 Benin Recurrent CFA bn 32.6 34.8 38.3 Development Total 38.9 40.5 45 56.3 94.2 Botswana Recurrent Development Total 5231 Burkina Faso Recurrent CFA bn 45.6 50.7 53.2 61.2 68 77.2 90.8 Development Total 49.3 56.8 60.9 66.8 74.3 80.9 101.5 Burundi Recurrent FBU bn 14.8 16.9 20 21.6 27.6 32.4 55.5 Development 3.9 4.7 Total 21.1 43.9 Cameroon Recurrent CFA bn 118 131.6 137.4 158.1 182.1 Development 11.8 14 14.5 23.7 21 Total 129.8 145.6 151.9 181.8 203.1 383.2 Central African Republic Recurrent CFA bn Development Total 10.8 Chad Recurrent CFA bn 15.3 15.7 17.7 19.7 23.7 25.7 28.6 32.1 Development 3.5 Total 24.7 59.4 Congo Recurrent CF bn Development Total 57.8 65.7 56.1 64.5 Cote d'Ivoire Recurrent FCA bn 250 196.8 278.2 279.7 Development (inc external) 27.2 16.6 34 17.6 Development (domestic) 18.9 11.9 19 5.3 Total 268.9 208.7 297.2 285 358.6 446 Eritrea Recurrent Development** Total 344.4 396.1 DRC Recurrent FC mn 2194 4364 9924 Development 0 200 918 Total 2194 4564 10842
37
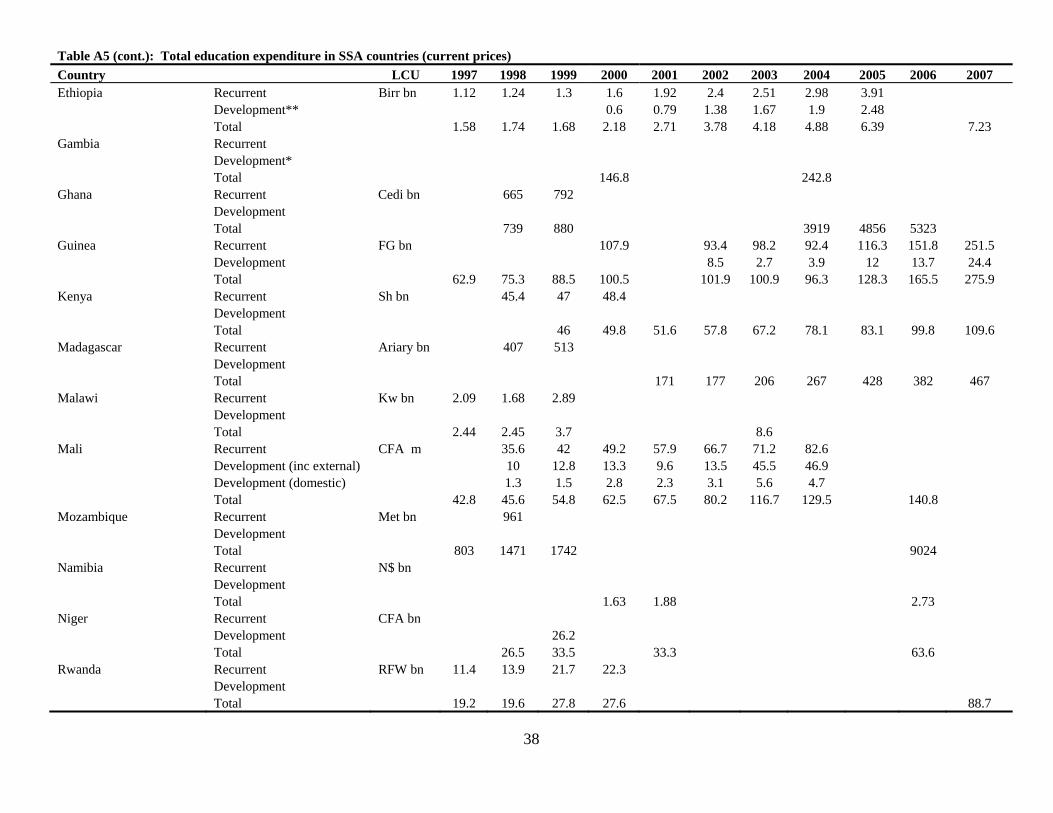
Table A5 (cont.): Total education expenditure in SSA countries (current prices) Country LCU 1997 1998 1999 2000 2001 2002 2003 2004 2005 2006 2007 Ethiopia Recurrent Birr bn 1.12 1.24 1.3 1.6 1.92 2.4 2.51 2.98 3.91 Development** 0.6 0.79 1.38 1.67 1.9 2.48 Total 1.58 1.74 1.68 2.18 2.71 3.78 4.18 4.88 6.39 7.23 Gambia Recurrent Development* Total 146.8 242.8 Ghana Recurrent Cedi bn 665 792 Development Total 739 880 3919 4856 5323 Guinea Recurrent FG bn 107.9 93.4 98.2 92.4 116.3 151.8 251.5 Development 8.5 2.7 3.9 12 13.7 24.4 Total 62.9 75.3 88.5 100.5 101.9 100.9 96.3 128.3 165.5 275.9 Kenya Recurrent Sh bn 45.4 47 48.4 Development Total 46 49.8 51.6 57.8 67.2 78.1 83.1 99.8 109.6 Madagascar Recurrent Ariary bn 407 513 Development Total 171 177 206 267 428 382 467 Malawi Recurrent Kw bn 2.09 1.68 2.89 Development Total 2.44 2.45 3.7 8.6 Mali Recurrent CFA m 35.6 42 49.2 57.9 66.7 71.2 82.6 Development (inc external) 10 12.8 13.3 9.6 13.5 45.5 46.9 Development (domestic) 1.3 1.5 2.8 2.3 3.1 5.6 4.7 Total 42.8 45.6 54.8 62.5 67.5 80.2 116.7 129.5 140.8 Mozambique Recurrent Met bn 961 Development Total 803 1471 1742 9024 Namibia Recurrent N$ bn Development Total 1.63 1.88 2.73 Niger Recurrent CFA bn Development 26.2 Total 26.5 33.5 33.3 63.6 Rwanda Recurrent RFW bn 11.4 13.9 21.7 22.3 Development Total 19.2 19.6 27.8 27.6 88.7
38

Table A5 (cont.): Total education expenditure in SSA countries (current prices) Country LCU 1997 1998 1999 2000 2001 2002 2003 2004 2005 2006 2007 Senegal Recurrent CFA bn 90.4 95.1 104.5 Development Total 96.2 109.4 118.8 117.8 233.5 Sierra Leone Recurrent Leone m 31128 44130 46325 113964 Development Total 46380 48041 60895 74347 South Africa Recurrent Rand bn Development Total 45.44 48.82 93.19 Swaziland Recurrent E mn Development Total 520.9 842.4 1160.3 Uganda Recurrent Sh bn 242 257 304 Development Total 318 371 355 437 544 561 586 616 651 765 (08) Tanzania Recurrent Sh mn Development Total 2516 3258 4035 4851 6067 Togo Recurrent CFA bn Development Total 38.4 33.4 40.9 48.6 (08) Zambia Recurrent US$ m 139 Development Total 139 149 138 261 698 Notes: ** includes secondary
39
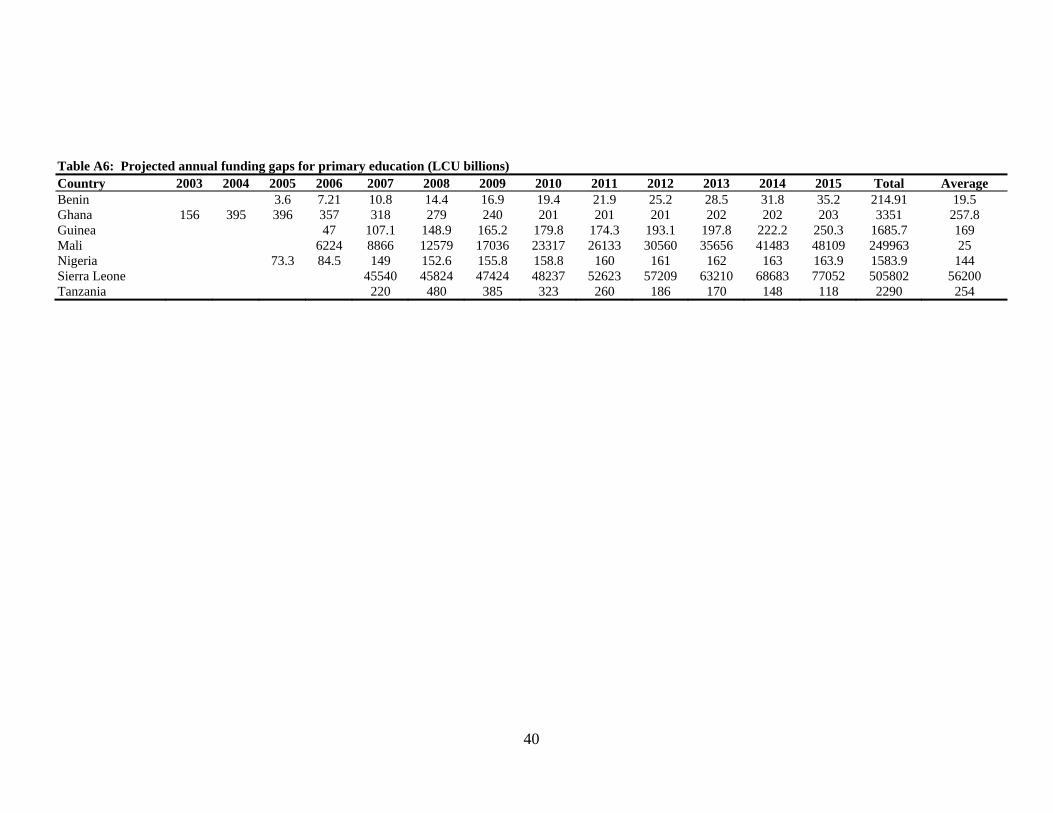
40
Table A6: Projected annual funding gaps for primary education (LCU billions) Country 2003 2004 2005 2006 2007 2008 2009 2010 2011 2012 2013 2014 2015 Total Average Benin 3.6 7.21 10.8 14.4 16.9 19.4 21.9 25.2 28.5 31.8 35.2 214.91 19.5 Ghana 156 395 396 357 318 279 240 201 201 201 202 202 203 3351 257.8 Guinea 47 107.1 148.9 165.2 179.8 174.3 193.1 197.8 222.2 250.3 1685.7 169 Mali 6224 8866 12579 17036 23317 26133 30560 35656 41483 48109 249963 25 Nigeria 73.3 84.5 149 152.6 155.8 158.8 160 161 162 163 163.9 1583.9 144 Sierra Leone 45540 45824 47424 48237 52623 57209 63210 68683 77052 505802 56200 Tanzania 220 480 385 323 260 186 170 148 118 2290 254