a review of the1980s - john wiley & sons€¦ · 2 intermarket analysis commodities peak in...
TRANSCRIPT

1
To fully understand the dramatic turns in the financial markets thatstarted in 1980, it’s necessary to know something about the 1970s.That decade witnessed a virtual explosion in commodity markets,
which led to spiraling inflation and rising interest rates. From 1971 to 1980,the Commodity Research Bureau (CRB) Index—which is a basket of com-modity prices—appreciated in value by 250 percent. Bond yields rose by150 percent during the same period and, as a result, bond prices declined.Figure 1.1 shows the close correlation between the CRB Index and theyield on 10-year Treasuries between 1973 and 1987. Long-term rates rosewith commodities during the inflationary 1970s and fell with them duringthe disinflationary 1980s.
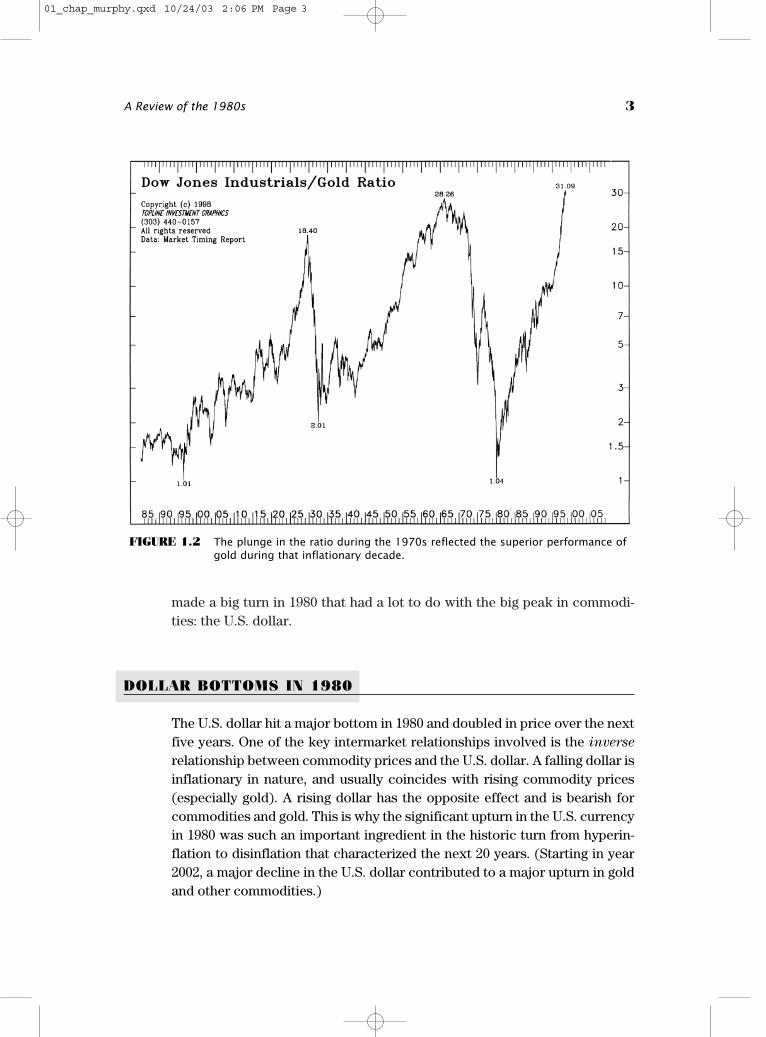
The 1970s were not good for stocks, either. The Dow Jones IndustrialAverage started the decade near 1,000 and ended the decade at about thesame level. In the middle of that 10-year period of stock market stagnation,the Dow lost almost half its value. The 1970s were a decade for tangibleassets; paper assets were out of favor. By the end of the decade, gold priceshad soared to over $700 per ounce. A weak dollar during that period alsocontributed to the upward spiral in gold and other commodity prices—aswell as the relative weakness in bonds and stocks. All this started to changein 1980, when the bubble burst in the commodity markets. Figure 1.2 is aratio of the Dow Industrials divided by the gold market. The plunge in thisratio during the 1970s reflected the superior performance by gold and otherhard assets in that inflationary decade. The ratio bottomed in 1980 after goldpeaked. The Dow then bottomed in 1982.
CHAPTER 1
A Review of the1980s
01_chap_murphy.qxd 10/24/03 2:06 PM Page 1

2 INTERMARKET ANALYSIS
COMMODITIES PEAK IN 1980
In late 1980, the bubble in commodity prices suddenly burst. The CRB Indexstarted to fall from a record level of 330 points—and began a 20-year declineduring which it lost half of its value. During these same 20 years, gold pricesfell from $700 to $250, losing over 60 percent of their value. (It was not untilafter the stock market peak in 2000 that gold prices started to show signsthat their twenty-year bear hibernation had ended.) The 1980 peak in com-modity markets ended the inflationary spiral of the 1970s and ushered in anera of falling inflation (or disinflation) that lasted until the end of the twen-tieth century. Figure 1.3 shows the dramatic rally in a number of commod-ity indexes during the 1970s and the major peak that occurred in 1980.Commodity prices declined for the next 20 years. Another financial market
FIGURE 1.1 A demonstration of the positive correlation between the CRB indexand 10-year Treasury yields from 1973 to 1987.
01_chap_murphy.qxd 10/24/03 2:06 PM Page 2
made a big turn in 1980 that had a lot to do with the big peak in commodi-ties: the U.S. dollar.
DOLLAR BOTTOMS IN 1980
The U.S. dollar hit a major bottom in 1980 and doubled in price over the nextfive years. One of the key intermarket relationships involved is the inverse
relationship between commodity prices and the U.S. dollar. A falling dollar isinflationary in nature, and usually coincides with rising commodity prices(especially gold). A rising dollar has the opposite effect and is bearish forcommodities and gold. This is why the significant upturn in the U.S. currencyin 1980 was such an important ingredient in the historic turn from hyperin-flation to disinflation that characterized the next 20 years. (Starting in year2002, a major decline in the U.S. dollar contributed to a major upturn in goldand other commodities.)
A Review of the 1980s 3
FIGURE 1.2 The plunge in the ratio during the 1970s reflected the superior performance ofgold during that inflationary decade.
01_chap_murphy.qxd 10/24/03 2:06 PM Page 3

4 INTERMARKET ANALYSIS
FIGURE 1.3 A number of commodities indexes show the dramatic rally during the 1970sand the major commodity peak during 1980.
01_chap_murphy.qxd 10/24/03 2:06 PM Page 4

BONDS BOTTOM IN 1981
Another key intermarket relationship has to do with bond and commodityprices. They trend in opposite directions. Rising commodity prices (like thoseseen in the 1970s) signal rising inflation pressure, which puts upward pres-sure on interest rates and downward pressure on bond prices. (Bond pricesand bond yields trend in opposite directions.) Commodity prices oftenchange direction ahead of bonds, which also makes them leading indicatorsof bonds at important turning points. At the start of the 1980s, it took a yearfor the drop in commodities to push the bond market higher.
During the second half of 1981, bond yields peaked near 15 percent. Theyfell to half that level (7 percent) within five years, which caused a majorupturn in bond prices. The tide had turned. The stock market, which hadbeen held back for a decade by rising interest rates, soon got an enormousboost from falling bond yields (and rising bond prices).
STOCKS BOTTOM IN 1982
During the summer of 1982, within a year of the bond market bottom, thebiggest bull run in stock market history started—and lasted for almost twodecades. The fact that the bond market bottomed ahead of stocks is alsopart of the normal pattern. The bond market has a history of turning ahead ofstocks and is therefore viewed as a leading indicator of the stock market. Theintermarket scenario had completely reversed itself at the start of the 1980s.Hard assets (like commodities) were in decline, while paper assets (bondsand stocks) were back in favor.
This turning point was one of the clearest examples of how intermarketrelationships play out. Notice that four different market groups were in-volved: currencies, commodities, bonds, and stocks. All four played a majorrole as the inflationary 1970s ended and the disinflationary 1980s began. Let’sreview the groundrules for how the financial markets normally interact witheach other, which form the basis for our intermarket work.
HOW THE FOUR MARKET GROUPS INTERRELATE
Intermarket analysis involves the simultaneous analysis of the four financialmarkets—currencies, commodities, bonds, and stocks. It is how these four
A Review of the 1980s 5
01_chap_murphy.qxd 10/24/03 2:06 PM Page 5
markets interact with each other that gives them their predictive value. Hereis how they interrelate:
• The U.S. dollar trends in the opposite direction of commodities• A falling dollar is bullish for commodities; a rising dollar is bearish• Commodities trend in the opposite direction of bond prices• Therefore, commodities trend in the same direction as interest rates• Rising commodities coincide with rising interest rates and falling bond
prices• Falling commodities coincide with falling interest rates and rising bond
prices• Bond prices normally trend in the same direction as stock prices • Rising bond prices are normally good for stocks; falling bond prices are bad • Therefore, falling interest rates are normally good for stocks; rising rates
are bad• The bond market, however, normally changes direction ahead of stocks• A rising dollar is good for U.S. stocks and bonds; a falling dollar can be bad • A falling dollar is bad for bonds and stocks when commodities are rising• During a deflation (which is relatively rare), bond prices rise while
stocks fall
The list sums up the key intermarket relationships between the four mar-ket groups—at least as they are in a normal inflationary or disinflationaryenvironment, the likes of which existed during the second half of the last cen-tury. This held up especially well during the 1970s, the 1980s, and most of the1990s. (The last item in the preceding list which refers to deflation was notnormal in the postwar era. Later in the book I explain how deflationary pres-sures starting in 1997 and 1998 changed the normal relationship that hadexisted between bonds and stocks.) With a basic understanding of intermar-ket relationships, it is easier to see how well the markets followed that scriptat the start of the 1980s. A rising dollar led to falling commodities, which ledto rising bond prices, which led to rising stock prices. Things stayed prettymuch this way until 1987.
1987 STOCK MARKET CRASH REVISITED
The stock market crash during the second half of 1987 was an even moredramatic example of the necessity for intermarket awareness. It happenedswiftly and the results were dramatic and painful. Those who ignored the
6 INTERMARKET ANALYSIS
01_chap_murphy.qxd 10/24/03 2:06 PM Page 6

action in related markets during the first half of that year were blindsided bythe market collapse during the second half. As a result, they sought outscapegoats like program trading and portfolio insurance (futures-relatedstrategies that can exaggerate stock market declines) to explain the carnage.While these two factors no doubt added to the steepness of the stock mar-ket decline, they did not cause it. The real explanation for the stock marketcrash that year is much easier to explain, but only if viewed from an inter-market perspective. It started in the bond and commodity pits in the springof that year.
COMMODITIES RISE, BONDS FALLDURING SPRING OF 1987
During the four years after 1982, two of the main supporting factors behindthe stock market advance were falling commodity prices (low inflation) andrising bond prices (falling interest rates). In 1986, both of those marketsstarted to level off; commodities stopped going down and bond pricesstopped going up. The intermarket picture did not really turn dangerous,however, until the spring of 1987. In April of that year, the CRB Index ofcommodity prices turned sharply higher and “broke out” to the highest levelin a year. At the same time, bond prices went into a virtual freefall. (Risingcommodity prices usually produce lower bond prices.) These intermarkettrend changes removed two of the bullish props under the stock marketadvance and gave an early warning that the market rally was on weak foot-ing. Figure 1.4 shows the inverse relationship between bond and commodityprices from 1985 to 1987. It shows the CRB Index rising above a neckline (atrendline drawn over previous peaks) in the spring of 1987 (which com-pleted a bullish head and shoulders bottom) just as bond prices were fallingunder the lower trendline in a yearlong triangular pattern—a bad combina-tion for stocks since it suggested that rising inflation was pushing interestrates higher.
STOCK MARKET PEAKS IN AUGUST
The stock market rally continued for another four months into August 1987before finally peaking. The fact that bond prices peaked four months ahead ofstocks demonstrates the tendency for bonds to turn ahead of stocks. Again,
A Review of the 1980s 7
01_chap_murphy.qxd 10/24/03 2:06 PM Page 7

bonds are considered to be leading indicators of stocks. Figure 1.5 shows thedivergence between bond and stock prices from the spring of 1987 (whenbonds peaked) until August (when stocks peaked). Bonds fulfilled their roleas a leading indicator of stocks. By October, bond yields had climbed above 10percent. Probably more than any other factor, this jump in interest rates todouble-digit levels caused the October stock market crash. Figure 1.6 showsthat the October 1987 plunge in stocks followed closely after bond yieldsclimbed over 10 percent. In addition, the U.S. dollar played a role.
DOLLAR FALLS WITH STOCKS
The dollar, which had been declining earlier in the year, started a rebound inMay that lasted into the summer. This rebound ended in August as the stock
8 INTERMARKET ANALYSIS
FIGURE 1.4 The inverse relationship between bond prices and commodities canbe seen from 1985 through 1987. The bond market collapse in thespring of 1987 coincided with a bullish breakout in commodities.
01_chap_murphy.qxd 10/24/03 2:07 PM Page 8

market peaked. Both markets then fell together. A second rally attempt bythe dollar during October also failed, and its subsequent plunge coincidedalmost exactly with the stock market crash. Figure 1.7 shows the closecorrelation between the peaks in the dollar and stocks during August andOctober 1987. Consider the sequence of events going into the fall of 1987.Commodity prices had turned sharply higher, fueling fears of renewed infla-tion. At the same time, interest rates soared to double digits. The U.S. dollarsuddenly went into freefall (fueling even more inflation fears). Is it any won-der that the stock market finally ran into trouble? Given all of the bearishactivity in the surrounding markets, it is surprising that the stock marketheld up as well as it did for as long as it did. There were plenty of reasons whythe stock market should have sold off in late 1987. Most of those reasonswere visible in the action of surrounding financial markets—like commodi-
A Review of the 1980s 9
FIGURE 1.5 Bonds versus stocks during 1986 and 1987. Bonds collapsed in Aprilof 1987 and preceded the August peak in stocks by four months.
01_chap_murphy.qxd 10/24/03 2:07 PM Page 9

ties and bonds—but not necessarily in the stock market itself. The events of1987 provide a textbook example of how intermarket linkages work. Thattraumatic market year also makes a compelling argument as to why stockmarket participants need to monitor the other three financial markets.
THE 1987 MARKET CRASH WAS GLOBAL
Another important lesson of 1987 is the fact that the market crash was globalin scope—world markets fell together. This is important for two reasons.First, it is a dramatic demonstration of how global stock markets are linked.
10 INTERMARKET ANALYSIS
FIGURE 1.6 The surge in bond yields in the summer and fall of 1987 had abearish influence on stocks. From July to October of that year,Treasury bond yields surged from 8.50 percent to over 10.00percent. The surge in bond yields was tied to the collapsing bond market and rising commodities.
01_chap_murphy.qxd 10/24/03 2:07 PM Page 10

Second, it shows that world stock markets become even more closely linkedduring serious downturns than they are normally. At such times, global diver-sification becomes a myth. (The same phenomenon of a global bear market instocks is apparent starting in 2000.) Global linkages are not limited to stockmarkets, either. Foreign currencies are linked to the U.S. dollar. Trends ininflation and deflation (which are reflected in commodity prices) are global.
There is another lesson having to do with the global nature of the 1987stock market crash. Many market observers at the time took the narrowview that various futures-related strategies—like program trading and port-folio insurance—actually caused the selling panic. They reasoned that theredid not seem to be any economic or technical justification for the stock
A Review of the 1980s 11
FIGURE 1.7 The falling U.S. dollar during the second half of 1987 also weighedon stock prices. The twin peaks in the U.S. currency in August andOctober of that year coincided with similar peaks in the stockmarket. The collapse in the U.S. dollar in October also paralleled the drop in equities.
01_chap_murphy.qxd 10/24/03 2:07 PM Page 11

market collapse. The fact that the equity crash was global in nature, and notlimited to the U.S. market, argued against such a narrow view, especiallysince most foreign markets at the time were not affected by program tradingor portfolio insurance.
LATER EXAMPLES OF GLOBAL LINKAGES
During the Iraq crisis of 1990 and again in 2003, rising energy prices slowedglobal economic growth and contributed to weakness in all of the world’smajor stock markets. The rise in oil prices during 1990 also pushed interestrates higher all over the world and once again showed how global interest ratesrise and fall together. After 1998, a close correlation developed between fall-ing global interest rates—including those in the United States—and a fallingJapanese stock market, which was caught in the grip of deflation. Figure 1.8shows interest rates moving higher around the globe during the inflationary1970s and then falling together during the disinflationary 1980s and the defla-tionary 1990s.
THE DOLLAR’S IMPACT CAN BE DELAYED
Of the four financial markets used in intermarket work, the dollar is proba-bly the most difficult to fit into a consistent intermarket model. Long delaysbetween trend changes in the dollar and other markets are part of the reasonfor that. The events leading up to 1987 provide a good example of why this isso. After rallying for five years, the dollar started to drop in 1985, largely dueto the Plaza Accord, a five-nation agreement designed to drive down the priceof the dollar. Normally, a falling dollar would give a boost to commodityprices. But this boost did not come—at least not right away. It was not untila year later—in 1986—that the commodity decline that started in 1980 startedto level off and bond prices stopped going up. When commodities started torally during the spring of 1987, the real problems started. It took almost twoyears for the falling dollar to stimulate a serious rally in commodities—andcause problems for bonds and stocks. Figure 1.9 shows the lag time betweentwo events (the 1985 dollar peak and the 1986 bottom in commodity prices)and the upturn that took place during the spring of 1987. The falling dollareventually had an impact, but it took a year or two for it to take effect.
Intermarket trends during the 1980s also show why the impact of thedollar’s direction on bonds and stocks needs to be filtered through the com-
12 INTERMARKET ANALYSIS
01_chap_murphy.qxd 10/24/03 2:07 PM Page 12

A Review of the 1980s 13
FIGURE 1.8 Global bond yields rose during the inflationary 1970s and fell during thedisinflationary 1980s and 90s. Global rates usually rise and fall together.
01_chap_murphy.qxd 10/24/03 2:07 PM Page 13

14 INTERMARKET ANALYSIS
FIGURE 1.9 The U.S. dollar versus the CRB index from 1985 through the fourthquarter of 1989. A falling dollar will eventually push the CRB indexhigher. The 1986 bottom in the CRB index occurred a year after the1985 peak in the dollar.
modity markets. A falling dollar can be bearish for bonds and stocks, but onlyif it coincides with rising commodity prices. (It can also be said that a fallingdollar is not a serious problem until it starts to push interest rates higher,which is usually the result of rising commodity prices.) A falling dollar cancoexist with rising bond and stock prices, as long as commodity prices do notrise. The decline of the dollar that started in 1985 did not have much of animpact on either bonds or stocks—until commodity prices (and interestrates) turned up during April 1987. Figure 1.10 shows the delayed effect of afalling dollar on interest rates. The dollar peaked in 1985. Bonds peaked oneyear later, but did not really start tumbling until the spring of 1987. A falling
01_chap_murphy.qxd 10/24/03 2:07 PM Page 14

dollar became a problem for stocks when its inflationary impact pushed bondprices lower and interest rates higher.
Some have argued that the generally weak dollar in the years between1985 and 1995 did not have much of a negative impact on bonds and stocks.There is some validity to this argument, since bonds and stocks continued toenjoy major advances during those 10 years. However, it is also true thatdollar peaks in 1985 and 1989 preceded the 1987 and 1990 bear markets (inbonds and stocks) by two years and one year, respectively. In addition, com-modities rallied during both bear markets as a result of that dollar weakness.It is also true that the 1994 bear trend in bonds and stocks followed anotherpeak in the dollar and an upturn in commodity prices.
A Review of the 1980s 15
FIGURE 1.10 The U.S. dollar versus Treasury bond prices from 1985 through1989. A falling dollar is eventually bearish for bonds. During allof 1985 and most of 1986, bonds were strong while the dollarwas weak.
01_chap_murphy.qxd 10/24/03 2:07 PM Page 15

ONWARD AND UPWARD TO 1990
Bond and stock prices stabilized during the fourth quarter of 1987 and begana two-year advance that lasted from the start of 1988 to the end of 1989. Theintermarket picture during those two years had reverted to a more benignalignment: a strong dollar, weak commodities, and rising bond and stockprices. At the start of 1990, however, things took a turn for the worse. Itstarted with a drop in bond prices, a selloff in the dollar, and a rally in com-modities, all of which are negative signs for the stock market. Then came theIraqi invasion of Kuwait in early August of that year. Oil prices spiked to $40per barrel. The result was a bear market in stocks and a recession. Becauseof the lessons that can be learned from studying the intermarket relation-ships of 1990 and their relevance to geopolitical events 13 years later, we willexamine that landmark year in more depth in the next chapter.
16 INTERMARKET ANALYSIS
01_chap_murphy.qxd 10/24/03 2:07 PM Page 16