a review on polymer, gas, surfactant and nanoparticle
TRANSCRIPT

A review on polymer, gas, surfactant and nanoparticleadsorption modeling in porous mediaIsah Mohammed, Clement C. Afagwu, Stephen Adjei, Ibrahim B. Kadafur, Mohammad S. Jamal,and Abeeb A. Awotunde*
College of Petroleum Engineering & Geosciences, King Fahd University of Petroleum & Minerals, Dhahran 31261, KSA
Received: 2 May 2020 / Accepted: 7 August 2020
Abstract. Adsorption is a rock surface phenomenon and has increasingly become popular, especially inparticle-transport applications across many fields. This has drawn a remarkable number of publications fromthe industry and academia in the last decade, with many review articles focused on adsorption of polymers,surfactants, gas, and nanoparticles in porous media with main applications in Enhanced Oil Recovery(EOR). The discussions involved both experimental and modeling approaches to understanding and efficientlymimicking the particle transport in a bid to solve pertinent problems associated with particle retention onsurfaces. The governing mechanisms of adsorption and desorption constitute an area under active researchas many models have been proposed but the physics has not been fully honored. Thus, there is a need forEsXMLcontinuous research effort in this field. Although adsorption/desorption process is a physical phe-nomenon and a reversible process resulting from inter-molecular and the intramolecular association betweenmolecules and surfaces, modeling these phenomena requires molecular level understanding. For this reason,there is a wide acceptance of molecular simulation as a viable modeling tool among scientists in this area. Thisreview focuses on existing knowledge of adsorption modeling as it relates to the petroleum industry cuttingacross flow through porous media and EOR mostly involving polymer and surfactant retention on reservoirrocks with the associated problems. The review also analyzes existing models to identify gaps in researchand suggest some research directions to readers.
1 Introduction
Adsorption is a surface phenomenon that involves theretention of molecules on surfaces and has been a subjectof discussion for decades. In addition, this mechanism isas a result of surface interaction between flowing fluidand the porous media at various scales ranging frommicrometer to nanoscale transport in shale formations(An et al., 2017). Several researchers (Joekar-Niasar et al.,2019; Liu et al., 2006; Ogunberu and Asghari, 2005; Yinet al., 2009; Yu et al., 2012; Zhang et al., 2015) have inves-tigated the mechanism of adsorption and have identifiedthe dominant influences on fluid storage in porous media.Rocks due to their mineralogy are pervasive and the model-ing of such a system is difficult as a result of the ionic,hydrodynamic, and electrochemical interactions (Joekar-Niasar et al., 2019). Furthermore, different from the popu-lar flow assurance adsorption is the surface storage capacityof gases in shale reservoirs which is natural and can bequantified using the simplified and isothermal local densitymethod (Zhang et al., 2019).
The mechanism of adsorption does not involve theexplicit “site” on a grain surface at which a particle canattach but an area phenomenon that covers the entire porespace in time and space. Hence, the specific surface area of aporous medium is expected to have an order of influence.Deem and Ali (1968) studied the effect of the radioactivityof tracers in porous media with the conclusion that prefer-ential adsorption is observed for tracers of similar propertieswhich is due to mineralogy, surface activeness, and concen-tration. Some experimental and numerical modeling of thephenomena has been carried out by researchers to establishthe governing mechanism for particle adsorption at micro,nano and pore scale.
This review article explores the mechanisms, models andapplications that have been achieved thus far in the field ofadsorption as it concerns the petroleum industry. With theincreasing use of nanoparticles in the oil/gas industryspecifically in areas such as drilling, exploration andEnhanced Oil Recovery (EOR), it is important to under-stand the phenomena of adsorption in the porous media.Section 2 of this review attempts to provide insights intothe mathematical modeling and experimental studies con-ducted on nanoparticle adsorption. Section 3, studies the* Corresponding author: [email protected]
This is an Open Access article distributed under the terms of the Creative Commons Attribution License (https://creativecommons.org/licenses/by/4.0),which permits unrestricted use, distribution, and reproduction in any medium, provided the original work is properly cited.
Oil & Gas Science and Technology – Rev. IFP Energies nouvelles 75, 77 (2020) Available online at:� I. Mohammed et al., published by IFP Energies nouvelles, 2020 ogst.ifpenergiesnouvelles.fr
https://doi.org/10.2516/ogst/2020063
REGULAR ARTICLEREGULAR ARTICLE
adsorption of polymer on rock surfaces. Polymer floodinguses polymer solutions to increase oil recovery by increasingthe viscosity of injected water. The increased viscositydecreases the water-oil mobility ratio and provides bettersweep efficiency. The injected polymer gets adsorbed onthe surface of the rocks and swells leading to pore throatreduction therefore decreasing the permeability of the reser-voir rocks. Langmuir adsorption isotherm is the most com-monly used method to model adsorption of polymers onrock surfaces. In Section 4 we have reviewed the differentadsorption isotherms used to model adsorption of gases inporous media. It is important to accurately model gasadsorption as 20–80% of shale gas is stored under adsorbedcondition (Xiao-Chun et al., 1995). The gas adsorptionisotherms can be classified under two broad subheadings:(1) monolayered and multilayered isotherms (Sect. 4.1),and (2) single component and multicomponent isotherms(Sect. 4.2). Finally, in Section 5 we have reviewed theadsorption of surfactants in porous media. Surfactant flood-ing reduces the interfacial tension and assists in oil recovery.However the adsorption of surfactant on the rock surfacesproduces a challenge as the reduced concentration leadsto a decrease in the EOR efficiency (Curbelo et al., 2020).Since surfactants account for a large part of the total costof surfactant injection, their losses also lead to substantialeconomic losses (Belhaj et al., 2020).
2 Nanoparticle adsorption
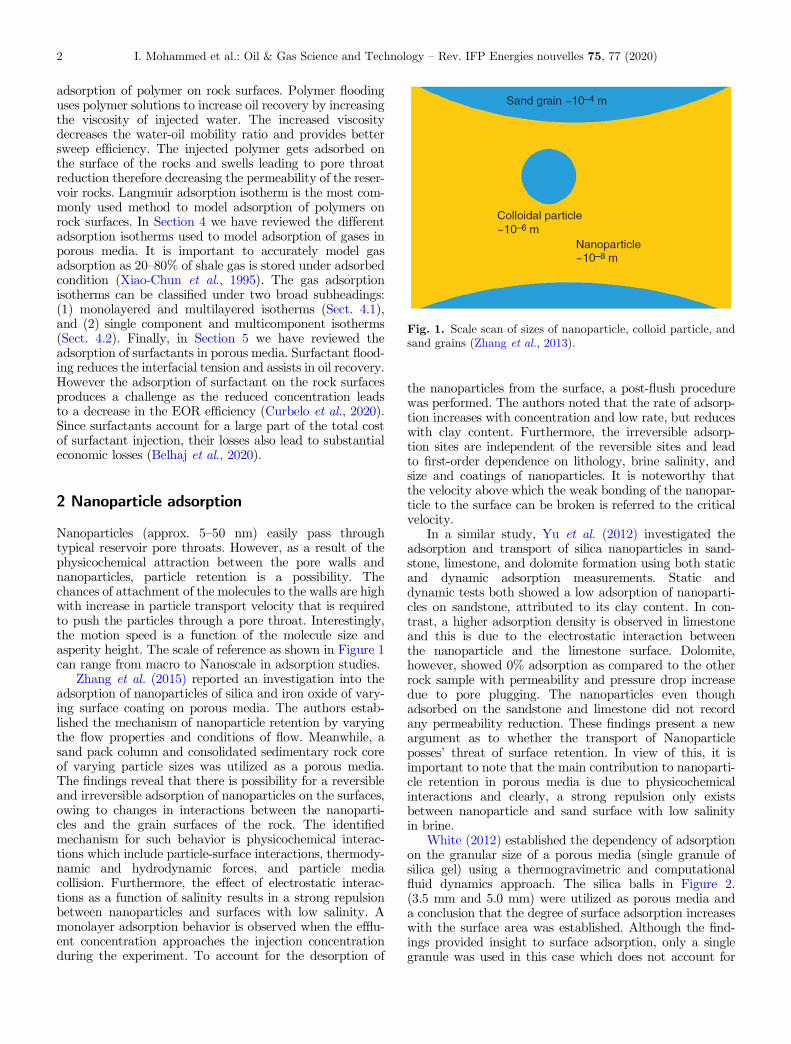
Nanoparticles (approx. 5–50 nm) easily pass throughtypical reservoir pore throats. However, as a result of thephysicochemical attraction between the pore walls andnanoparticles, particle retention is a possibility. Thechances of attachment of the molecules to the walls are highwith increase in particle transport velocity that is requiredto push the particles through a pore throat. Interestingly,the motion speed is a function of the molecule size andasperity height. The scale of reference as shown in Figure 1can range from macro to Nanoscale in adsorption studies.
Zhang et al. (2015) reported an investigation into theadsorption of nanoparticles of silica and iron oxide of vary-ing surface coating on porous media. The authors estab-lished the mechanism of nanoparticle retention by varyingthe flow properties and conditions of flow. Meanwhile, asand pack column and consolidated sedimentary rock coreof varying particle sizes was utilized as a porous media.The findings reveal that there is possibility for a reversibleand irreversible adsorption of nanoparticles on the surfaces,owing to changes in interactions between the nanoparti-cles and the grain surfaces of the rock. The identifiedmechanism for such behavior is physicochemical interac-tions which include particle-surface interactions, thermody-namic and hydrodynamic forces, and particle mediacollision. Furthermore, the effect of electrostatic interac-tions as a function of salinity results in a strong repulsionbetween nanoparticles and surfaces with low salinity. Amonolayer adsorption behavior is observed when the efflu-ent concentration approaches the injection concentrationduring the experiment. To account for the desorption of
the nanoparticles from the surface, a post-flush procedurewas performed. The authors noted that the rate of adsorp-tion increases with concentration and low rate, but reduceswith clay content. Furthermore, the irreversible adsorp-tion sites are independent of the reversible sites and leadto first-order dependence on lithology, brine salinity, andsize and coatings of nanoparticles. It is noteworthy thatthe velocity above which the weak bonding of the nanopar-ticle to the surface can be broken is referred to the criticalvelocity.
In a similar study, Yu et al. (2012) investigated theadsorption and transport of silica nanoparticles in sand-stone, limestone, and dolomite formation using both staticand dynamic adsorption measurements. Static anddynamic tests both showed a low adsorption of nanoparti-cles on sandstone, attributed to its clay content. In con-trast, a higher adsorption density is observed in limestoneand this is due to the electrostatic interaction betweenthe nanoparticle and the limestone surface. Dolomite,however, showed 0% adsorption as compared to the otherrock sample with permeability and pressure drop increasedue to pore plugging. The nanoparticles even thoughadsorbed on the sandstone and limestone did not recordany permeability reduction. These findings present a newargument as to whether the transport of Nanoparticleposses’ threat of surface retention. In view of this, it isimportant to note that the main contribution to nanoparti-cle retention in porous media is due to physicochemicalinteractions and clearly, a strong repulsion only existsbetween nanoparticle and sand surface with low salinityin brine.
White (2012) established the dependency of adsorptionon the granular size of a porous media (single granule ofsilica gel) using a thermogravimetric and computationalfluid dynamics approach. The silica balls in Figure 2.(3.5 mm and 5.0 mm) were utilized as porous media anda conclusion that the degree of surface adsorption increaseswith the surface area was established. Although the find-ings provided insight to surface adsorption, only a singlegranule was used in this case which does not account for
Fig. 1. Scale scan of sizes of nanoparticle, colloid particle, andsand grains (Zhang et al., 2013).
I. Mohammed et al.: Oil & Gas Science and Technology – Rev. IFP Energies nouvelles 75, 77 (2020)2

interactions between multiple granules and fluid selectivityon the surface area available.
In modeling Nanoparticle adsorption, the pore structureand geometry, the particle size and surface properties needto be accounted for. One of the most used models is that ofGuzman et al. (2006) who described the electrostaticdouble-layer interaction energy for nanoparticle adsorptionbased on van der Waals interaction. Guzman model(Eq. (1)) accounts for the pitfalls of the empirical correla-tions which rather well predict pressure loss for flows butprovide nothing more about local flow fields of our adsorp-tion/desorption on porous media:
see equation (1) bottom of the page
where,
k�1 ¼ e0erkBT2e2I cNA
� �; ð2Þ
e0 is the vacuum permittivity, er the relative dielectric con-stant of water, k is inverse of Debye length, e are elemen-tary charges, Ic is suspension ionic strength, /EDL iselectric double layer interaction energy, a is the radius ofa sphere, r is any distance radius, D is the distance of clos-est approach between the two surfaces, kB is Boltzmann,T is temperature, constant, NA Avogadro number, Wsand Wp are particle and surface potentials.
Nanoparticles are generally small that they easily movewithin the pores of rock materials without plugging it,
but sometimes due to affinity for one another, the nanopar-ticles are retained on the rock surface. On the bases ofDerjaguin, Landau, Verwey, and Overbeek (DLVO) the-ory, Abdelfatah et al. (2017) came up with theoretical equa-tions that calculated the deposition and release rate underdifferent ionic strengths, pH and temperature conditions.The authors developed a model to determine Zeta potentialof rock and nanoparticles at different conditions andvalidated it with an experiment that determines the rateat which silica nanoparticles are deposited and released onsandstone formation. It has been observed that an increasein ionic strength and temperature leads to a decrease in theenergy barrier height (zeta potential). Consequently, therate of deposition increases, whereas a change in pHdepends on the isoelectric point of the nanoparticle andpore surface. There is a direct correlation between thetwo properties, at a higher pH and zeta potential value,the rate of deposition of matter decreases. The rate ofdispersion of nanoparticles on the rock is governed by thezeta potential in addition to the electrostatic interac-tion. In the same vein, surface potential depends on pH,see equation (3):
ws ¼b
bþ 12:3kBT
epHIEP � pHð Þ ¼ m1
2:3kBTe
pHIEP � pHð Þ;
ð3Þwhere ws is the surface potential, pHIEB is the isoelectricpoint of the surface, e is elementary charge, m1 is the slopeof the fast region of zeta potential calculation, b is surfacesensitivity property. Ohshima (1994) came up with asimple approximation that determines Henry’s function;f(kap), which determines the ionic strength usually in therange of 1–1.5:
f kapð Þ ¼ 1þ 0:5 1þ 2:5kap 1þ e�kapð Þ
� ��1
; ð4Þ
k�1 ¼ffiffiffiffiffiffiffiffiffiffiffiffiffiffiffiffiffiffiffiffiffiffiffi2 kBT2000e2NAI
r; ð5Þ
where f ðkapÞ is Henry’s function, k1 is Debye length, ap theradius of the nanoparticle, I ionic strength, NA is Avogadronumber, e is elementary charge, 2 is dielectric constant,kB is Boltzmann constant, and T temperature in Kelvin.Revil et al. (1999) came up with a relationship for silicananoparticle’s zeta potential (f) and temperature and isgiven by,
f Tð Þ ¼ f T 0ð Þ � 1þ vf T � T 0ð Þ½ �; ð6Þ
Fig. 2. Single silica gel in a tube geometry used for thevalidation of CFD and experimental work (White, 2012).
/EDL ¼ p202r W2s þW2
p
� �Z a
0
� coth kðD þ a � affiffiffiffiffiffiffiffiffiffiffiffiffiffiffiffiffiffiffiffiffiffi1� ðr=aÞ2
qÞ
� �þ coth kðD þ a þ a
ffiffiffiffiffiffiffiffiffiffiffiffiffiffiffiffiffiffiffiffiffiffi1� ðr=aÞ2
qÞ
� �
þ ð2WsWpÞðWs
2þWp2Þ csch kðD þ a � a
ffiffiffiffiffiffiffiffiffiffiffiffiffiffiffiffiffiffiffiffiffiffi1� ðr=aÞ2
qÞ
� �� csch kðD þ a þ a
ffiffiffiffiffiffiffiffiffiffiffiffiffiffiffiffiffiffiffiffiffiffi1� ðr=aÞ2
qÞ
� � 0BBB@
1CCCArdr; ð1Þ
I. Mohammed et al.: Oil & Gas Science and Technology – Rev. IFP Energies nouvelles 75, 77 (2020) 3

where symbol vf as temperature sensitivity coefficient, it isan experimented property for different particles, T0 roomtemperature. Ding et al. (2015) express the zeta potentialwhen x_s � k1 in equation (7):
f ¼ ws exp �kxsð Þ ¼ ws exp �1ð Þ; ð7Þcombining the equations that describes its’ relationshipwith temperature, ionic strength and pH, an expressionfor zeta potential can be derived in equation (8),
f ¼ m10:85kBTf kapð Þe pHIEP � pHð Þ 1þ vf T � T 0ð Þ½ �; ð8Þ
for a fast change region, and in equation (9),
f ¼ fcut�off þm2
f kapð Þ pHcut�off � pHð Þ 1þ vf T � T 0ð Þ½ �; ð9Þ
for a slow change region, where m2 is the slope of a slowregion of zeta potential calculation, pHcut-off is fittedcut-off point, other definitions of terms are as statedearlier.
Zhang (2012) integrated the effects of energy bar-rier and pore surface area in the modeling of the nanoparti-cle build-up and liberation speed, with the convection-diffusion equation. The reaction is first-order and therate of deposition varies as a function of time, describedin equation (10):
Kdep tð Þ ¼ Kdep t0ð Þ � B hð Þ; ð10Þwhere B(h) is the fraction of surface covered already usingmonolayer coverage. Kdep and Krel are generally expressedin equations (11) and (12) respectively:
Kdep ¼ D ðymaxÞ �cmax
2pkBT
� �12
� exp� /maxj jkBT
� �; ð11Þ
K rel ¼ D ðymaxÞ �cmaxcminð Þ122pkBT
� exp�j/max � /minj
kBT
� �; ð12Þ
where ymax is maximum distance of separation betweenboundaries.
Validating the values of Kdep and Krel of the nanoparti-cles on the rock surface, a numerical simulator was createdto compare experimental data from literature with themodel results at the same conditions. The model was gener-ated based on certain conditions, such as,
(a) assuming one-dimensional advection-dispersionprocess
(b) one sink/source term(c) piston like displacement(d) with C x; 0ð Þ ¼ 0; C 0; tð Þ ¼ C inj;
@C L;tð Þ@x ¼ 0 as the
boundary conditions.
Using the Forward Time-Central Space (FTCS)method, Zhang (2012) presented equation (13) to solvethe depositional problem in the simulator earlier described:
see equation (13) bottom of the page
where i = 2, 3, . . . N – 1.The physical properties of materials and nature of
the rock affect the rate at which silica nanoparticles aredeposited on the sandstone surfaces. The main conditionsthat determine the rate of deposition are, (1) larger the sizeof the nanoparticles greater is the rate of deposition, (2) hightemperature, and pH decreases the rate of deposition,(3) lower the ionic strengthen lower the rate of deposition.
Wang et al. (2016a) applied the method of characteris-tics to derive an analytical model for quantifying thenanoparticle adsorption/detachment, straining behavior,and other associated effects of fluid flow.
Yu et al. (2012) studied the behavior of nanoparticleadsorption and transportation in three different coresnamely limestone, Berea sandstone, and dolomite. Theresults show that convection, diffusion, and hydrodynamicsgovern the flow of nanoparticles in the medium. In addition,the authors showed that for the three-rock samples, when-ever equilibrium is reached, nanoparticles tend to flow freelywithin the medium without further retention or adsorption.
Fig. 3. A distance-time diagram showing the division of zones(Wang et al., 2016a).
cnþ1i � cni�t
þ u;3cnN � 4cnN�1 þ cnN�2
�x¼ D
2cnN � 5cnN�1 þ 4cnN�2 þ cnN�3
�xþ Rn þ o �t; �xð Þ2� �
; ð13Þ
I. Mohammed et al.: Oil & Gas Science and Technology – Rev. IFP Energies nouvelles 75, 77 (2020)4
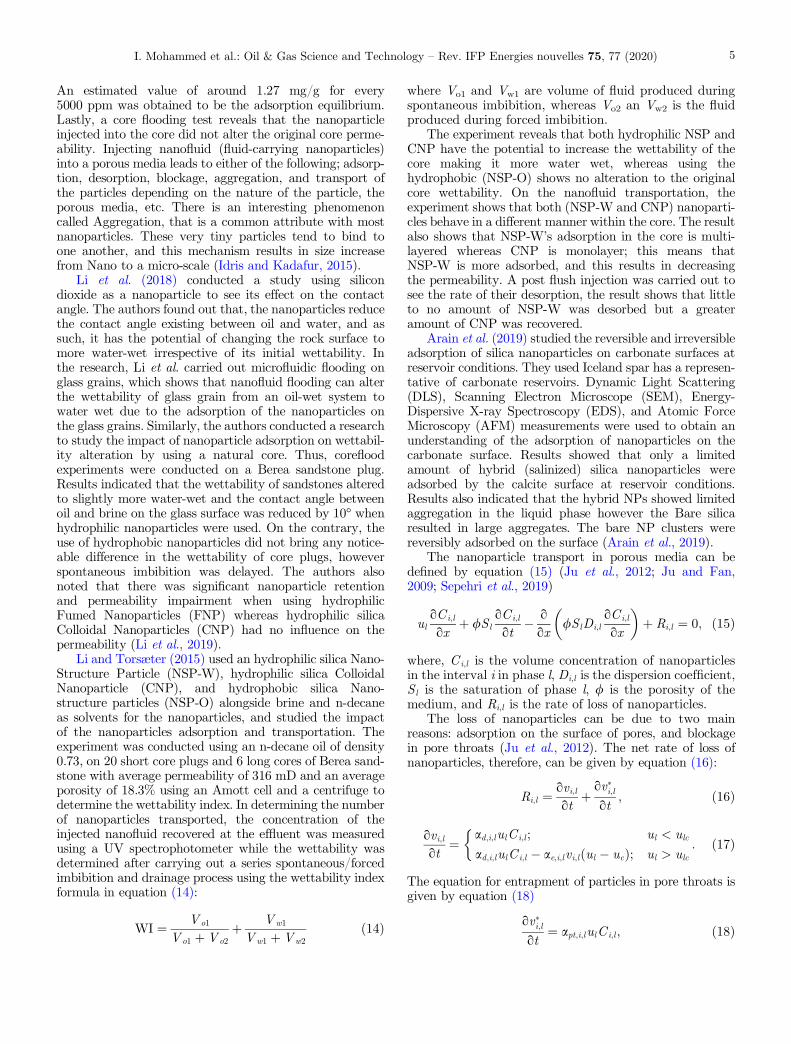
An estimated value of around 1.27 mg/g for every5000 ppm was obtained to be the adsorption equilibrium.Lastly, a core flooding test reveals that the nanoparticleinjected into the core did not alter the original core perme-ability. Injecting nanofluid (fluid-carrying nanoparticles)into a porous media leads to either of the following; adsorp-tion, desorption, blockage, aggregation, and transport ofthe particles depending on the nature of the particle, theporous media, etc. There is an interesting phenomenoncalled Aggregation, that is a common attribute with mostnanoparticles. These very tiny particles tend to bind toone another, and this mechanism results in size increasefrom Nano to a micro-scale (Idris and Kadafur, 2015).
Li et al. (2018) conducted a study using silicondioxide as a nanoparticle to see its effect on the contactangle. The authors found out that, the nanoparticles reducethe contact angle existing between oil and water, and assuch, it has the potential of changing the rock surface tomore water-wet irrespective of its initial wettability. Inthe research, Li et al. carried out microfluidic flooding onglass grains, which shows that nanofluid flooding can alterthe wettability of glass grain from an oil-wet system towater wet due to the adsorption of the nanoparticles onthe glass grains. Similarly, the authors conducted a researchto study the impact of nanoparticle adsorption on wettabil-ity alteration by using a natural core. Thus, corefloodexperiments were conducted on a Berea sandstone plug.Results indicated that the wettability of sandstones alteredto slightly more water-wet and the contact angle betweenoil and brine on the glass surface was reduced by 10� whenhydrophilic nanoparticles were used. On the contrary, theuse of hydrophobic nanoparticles did not bring any notice-able difference in the wettability of core plugs, howeverspontaneous imbibition was delayed. The authors alsonoted that there was significant nanoparticle retentionand permeability impairment when using hydrophilicFumed Nanoparticles (FNP) whereas hydrophilic silicaColloidal Nanoparticles (CNP) had no influence on thepermeability (Li et al., 2019).
Li and Torsæter (2015) used an hydrophilic silica Nano-Structure Particle (NSP-W), hydrophilic silica ColloidalNanoparticle (CNP), and hydrophobic silica Nano-structure particles (NSP-O) alongside brine and n-decaneas solvents for the nanoparticles, and studied the impactof the nanoparticles adsorption and transportation. Theexperiment was conducted using an n-decane oil of density0.73, on 20 short core plugs and 6 long cores of Berea sand-stone with average permeability of 316 mD and an averageporosity of 18.3% using an Amott cell and a centrifuge todetermine the wettability index. In determining the numberof nanoparticles transported, the concentration of theinjected nanofluid recovered at the effluent was measuredusing a UV spectrophotometer while the wettability wasdetermined after carrying out a series spontaneous/forcedimbibition and drainage process using the wettability indexformula in equation (14):
WI ¼ Vo1
Vo1 þVo2þ Vw1
Vw1 þ Vw2ð14Þ
where Vo1 and Vw1 are volume of fluid produced duringspontaneous imbibition, whereas Vo2 an Vw2 is the fluidproduced during forced imbibition.
The experiment reveals that both hydrophilic NSP andCNP have the potential to increase the wettability of thecore making it more water wet, whereas using thehydrophobic (NSP-O) shows no alteration to the originalcore wettability. On the nanofluid transportation, theexperiment shows that both (NSP-W and CNP) nanoparti-cles behave in a different manner within the core. The resultalso shows that NSP-W’s adsorption in the core is multi-layered whereas CNP is monolayer; this means thatNSP-W is more adsorbed, and this results in decreasingthe permeability. A post flush injection was carried out tosee the rate of their desorption, the result shows that littleto no amount of NSP-W was desorbed but a greateramount of CNP was recovered.
Arain et al. (2019) studied the reversible and irreversibleadsorption of silica nanoparticles on carbonate surfaces atreservoir conditions. They used Iceland spar has a represen-tative of carbonate reservoirs. Dynamic Light Scattering(DLS), Scanning Electron Microscope (SEM), Energy-Dispersive X-ray Spectroscopy (EDS), and Atomic ForceMicroscopy (AFM) measurements were used to obtain anunderstanding of the adsorption of nanoparticles on thecarbonate surface. Results showed that only a limitedamount of hybrid (salinized) silica nanoparticles wereadsorbed by the calcite surface at reservoir conditions.Results also indicated that the hybrid NPs showed limitedaggregation in the liquid phase however the Bare silicaresulted in large aggregates. The bare NP clusters werereversibly adsorbed on the surface (Arain et al., 2019).
The nanoparticle transport in porous media can bedefined by equation (15) (Ju et al., 2012; Ju and Fan,2009; Sepehri et al., 2019)
uloCi;l
oxþ /Sl
oCi;l
ot� oox
/SlDi;loCi;l
ox
� �þ Ri;l ¼ 0; ð15Þ
where, Ci;l is the volume concentration of nanoparticlesin the interval i in phase l, Di;l is the dispersion coefficient,Sl is the saturation of phase l, / is the porosity of themedium, and Ri;l is the rate of loss of nanoparticles.
The loss of nanoparticles can be due to two mainreasons: adsorption on the surface of pores, and blockagein pore throats (Ju et al., 2012). The net rate of loss ofnanoparticles, therefore, can be given by equation (16):
Ri;l ¼ ovi;lot
þ ov�i;lot
; ð16Þ
ovi;lot
¼ ad;i;lulCi;l ; ul < ulc
ad;i;lulC i;l � ae;i;lvi;l ul � ucð Þ; ul > ulc
: ð17Þ
The equation for entrapment of particles in pore throats isgiven by equation (18)
ov�i;lot
¼ apt;i;lulC i;l ; ð18Þ
I. Mohammed et al.: Oil & Gas Science and Technology – Rev. IFP Energies nouvelles 75, 77 (2020) 5

Table 1. Summary of the analytical solution obtained for suspended, attached, and strained nanoparticle concentration (Wang et al., 2016a).
Zone Domain Suspended particulatesconcentration (CNP)
Attached particulatesconcentration (rNP)
Strained particulatesconcentration (SNP)
I 0 < xD < 1; 0 < tD < xD 0 0 0
II 0 < xD < 1;xD < tD < xD þ tDc
C 0 exp � kad þ ksð ÞLxDð Þ kaCo/L tD � xDð Þ exp � kad þ ksð ÞLxD½ � ksCo/L tD � xDð Þexp � kad þ ksð ÞLxD½ �
III 0 < xD < 1;xD þ tD < tD þ tr
Co exp
"� kad þ ksð ÞL
xD � tD � xDð Þ
� kad/Co
kad þ ksð ÞrNP;max 1þ 1
kad þ ksð ÞL
!# rNP;max 1 exp
"� kad þ ksð ÞL
xD � tD � xDð Þ
� kad/Co
kad þ ksð ÞrNP;max 1þ 1
kad þ ksð ÞL
!# ksCo/L tD � xDð Þexp � kad þ ksð ÞLxD½ �
IV 0 < xD < 1;tcr < tD < mxD þ tD1
Co exp �ksLxDð Þ rNP;max 1 ksCo/L tD � xDð Þ exp �ksLxD½ �
V 0 < xD < 1; tD > mxD þ tD1 0 rNP;max 2 ksCo/L tD � xDð Þ exp �ksLxD½ �Here, xD is the dimensionless distance, tD is the dimensionless time, tDc is the dimensionless time or injected pore volume at maximum nanoparticlesconcentration, tD1 is the dimensionless time or injected pore volume start post-flush without nanoparticles, Co is the volumetric concentration of injectednanoparticles, ks is the straining filtration coefficient, kad is the adsorption filtration coefficient, / is the porosity of sand pack, L is the length of the sandpack, rNP;max 1 is the maximum retention concentration of nanoparticles with maximum nanoparticle adsorption, rNP;max 2 is the maximum retentionconcentration of nanoparticles at the phase of post-flush. Figure 3 shows the division of the different zones on the distance-time diagram.
I.Moham
med
etal.:
Oil&
Gas
Scienceand
Technology
–Rev.
IFP
Energies
nouvelles75,
77(2020)
6

where, vi;l is the volume of nanoparticles of interval i inphase l adsorbed on pore surfaces per unit bulk volumeof carbonate rock. The rate of adsorption on the surfacedepends on the critical velocity. Above the criticalvelocity, only particle retention can occur below this bothretention and entrainment can occur (Gruesbeck andCollins, 1982) according to equation (17).
Conclusively, the summary of models for suspendedattached and strained nanoparticles is provided in Table 1.
3 Polymer particle adsorption
Polymer solutions have become popular in the oil industryowing to the advantage of mobility control they possess.Several fields have implemented this with remarkablesuccess. However, the implementation comes with thechallenge of polymer retention on the rock surfaces whichimpairs the permeability of the formation. The damage onpore throat could be due to poor design of the polymer orinability to consider the effect of reservoir mineralogy onthe interaction between fluid and rock surface. Despitethe flow assurance issues caused due to polymer adsorptionon rock surfaces, it has been proved to be advantageous incontrolling water production in high water producing wells(Ogunberu and Asghari, 2005). This was reported in astudy of polymer retention to modify the water relativepermeability from a porous media.
The adsorption of polymer onto a porous media hasbeen established to be due to polymer concentration, rockmineralogy, reservoir temperature, pore structure, andpolymer particle sizes, etc. This factor contributes to theadsorption mechanisms of polymer which are adhesion torock surface, trapping and particle entrainment (Danget al., 2014; Khormali et al., 2018; Landes, 1961; Liuet al., 2006; Mungan, 1969; Ogunberu and Asghari, 2005).
Cheraghian et al. (2014) reported the adsorption ofpolymers on reservoir rocks using Nanoparticles of clayand SiO2. The findings depicted a lower adsorption of poly-mers on the surface and a higher adsorption on carbonaterock as compared to sandstone. This disparity in the tworocks is attributed to the different porosities, mineralogy,and cracks. Polymer adsorption has been most modeledby Langmuir adsorption isotherm with relatively goodagreement. Khormali et al. (2018) used the Langmuir andFreundlich isotherm models for polymer adsorption model-ing on carbonate and sandstone reservoir rocks. Dang et al.(2014) highlighted the effect of polymer concentration,molecular weight, pH, salinity and reservoir heterogeneityon adsorption. They noted that at low concentration,adsorption is proportional to the polymer concentrationhowever at high concentration the rate of adsorptiondecreases and possesses a different threat of pore pluggingdue to mechanical entrapment. An increase in pH resultsin a decrease in adsorption due to a repulsive effect betweenthe polymer and the rock surfaces. On the other hand, anincrease is observed in the case of increasing salinity.
Hematfar et al. (2013) reported the effect of highsalinity water film in asphaltene adsorption in porous
media. As the salt content increases, the water film gainsmore strength that prevents asphaltene particle penetra-tion. Consequently, there is reduction in asphaltene adsorp-tion to a porous media. It is noteworthy that thisobservation is independent of asphaltene concentration.Mungan (1969) also reported the effect of temperature onthe rate of polymer adsorption. The author noted that,though high temperatures may lead to polymer degrada-tion, it can help reduce the surface adsorption. For thisreason, the optimal selection of polymer is critical tosuccessful implementations.
Darcy equation models the Newtonian behavior ofpolymers in the porous media at a low flow rate. However,it fails to represent the pseudo-plastic and dilatant natureat intermediate and high flow rate conditions respectively(Abraham, 1966; Burcik, 1965; Dauben and Menzie, 1967;Gogarty, 1967; Jennings et al., 1971; Rowland and Eirich,1966; Savins, 1969; Smith, 1970). Blake-Kozeny equationmodels have increasingly become popular in describingthe pseudo-plastic behavior of polymers, using bundles ofcapillary tubes in viscometric measurements, nevertheless,the rheological model neglects the effect of tortuosity inpore geometry.
Nonetheless, Christopher and Middleman, (1965)modified the Blake-Kozeny model by introducing a constanttortuosity factor of 25/12 to depict the effect of poregeometry in the flow of the power-law fluid. The authorsvalidated the equation by applying it to estimate theapparent viscosity of the Kelzan-M biopolymer solutionthrough cores with a residual oil saturation. Though theresult only deviated from the laboratory values by lessthan 10%, unfortunately, it will behave poorly whenadopted to high flow rate polymers because it did notconsider the relaxation time, which sets in due to thedeformation of the fluid.
Interestingly, Marshall and Metzner (1967) introduceda qualitative measure to describe a visco-elastic behaviorof polymers using Deborah number. The authors relatedthe dimensionless number to the relaxation time of thepolymer, polymer shear rate, polymer elastic modulus,and the rock porosity and permeability. Not only does thedeformation effect on the rheologic fluid greater for lowerpermeability system if the fluid is flowing at the samevelocity, but the relaxation time is also higher for largermolecular weight polymers (Abraham, 1966; Dauben andMenzie, 1967; Jennings et al., 1971; Smith, 1970). Sadly,the limiting factor is that the authors did not consider theelongation rate (shear-thickening and thinning rate) onthe qualitative index used. In addition, with partiallyhydrolyzed acrylamide, the permeability reduction due topolymer adsorption is significant and must be accountedfor. Meanwhile, earlier authors attributed all flow resistancein porous media non-Newtonian fluid flow to adsorption(Christopher and Middleman, 1965; Hirasaki and Pope,1974; Marshall and Metzner, 1967; Metzner, 1977; Savins,1969) but some others believed that no correlation existsto distinguish the two types of polymer retention whichare adsorption and mechanical entrapment or plugging(Jennings et al., 1971; Smith, 1970).
I. Mohammed et al.: Oil & Gas Science and Technology – Rev. IFP Energies nouvelles 75, 77 (2020) 7

Polymer transport in a dead oil model can be modeledusing the following equation (Braconnier et al., 2017):
see equation (19) top of the page
where, qw is the density of water, Sw is the saturation ofwater phase, Cw is polymer mass fraction, Cr is themass fraction of polymer adsorbed on the surface of therock, qr is the density of the rock and qw is the density ofwater, aP is the inaccessible pore volume, qw is the sourceterm per unit volume, and uw is a vector of water velocity.
The Inaccessible Pore Volume (IPV) is the volume of thepore than cannot be reached by the polymer. Thisphenomenon occurs when the size of the polymer moleculesbecomes larger than some pores in the porous media. It is animportant phenomenon and needs to be considered to designan effective EOR technique (Dawson and Lantz, 1972;Dominguez and Willhite, 1977; Sheng, 2011; Sorbie, 1991).
The mass fraction of polymer adsorbed (Cr ) can bemodeled using different techniques. Some of the major tech-niques are listed as follows (Braconnier et al., 2017).
Instantaneous adsorption: The adsorption is constant assoon as the minimum polymer mass fraction is attained.This method is not reversible and not a good choice formodeling:
Cr ¼ qmaxp ; /qwSwC
w þ 1� /ð ÞqrCr � 1� /ð Þqrq
maxp
o
;
ð20Þwhere qmax
p is the maximum adsorption capacity of therock.
Schematic adsorption: Composed of two regimes,grows linearly until a rock adsorption limit is achieved afterwhich there is no more polymer adsorption. This is alsoirreversible
Cr ¼ qmaxp min 1;
Cw
C �
� �; ð21Þ
where C � is the reference mass fraction determining theadsorption dynamic. Langmuir Isotherm: It is the most use-ful for mathematical modeling and is reversible. It is given by
Cr ¼ qmaxp
bCw
1þ bCw ; ð22Þ
where b is the Langmuir coefficient.
Factors affecting polymer adsorption
Rowland and Eirich (1966) conducted an experiment withpolyacrylamide type polymers of different molecular weight,accompanied solvent (brine) of a wide range of salinity anda variety of cores. This led to the introduction of twoqualitative indices to determine the adsorption thicknesson the matrix surface; referred to as the dimensionlesspore-radius reduction number, Nd; and the permeability
reduction factor Rk = Rf lw/lapp. The authors representedthese dimensionless parameters to be dependent on theproperties of the polymers, accompanied solvent, and therock. Similarly, in order to generally account for otherfactors such as pore plugging, error in laboratory measure-ments, clay content, pore size distribution, and rock miner-alogy that may cause permeability reduction; the authorsbenchmark a plot of the two dimensionless property withan idealized permeability reduction factor equation, Rk =(1 � bNd)
�4 and obtained a fitting parameter, b. If the betaparameter is between zero and one, to show the degree ofdeviation from one:
N d ¼ 3:9� 10�3M13½l�13
k/
� �12
; ð23Þ
where, M is the polymer molecular weight, g/mol; k is theabsolute permeability, lapp is obtained from the Blake-Kozeny power-law model; Rf is the resistant factor; lw isthe viscosity of the accompanied brine, and [l] is theintrinsic viscosity of the polymer.
Furthermore, the author presented a quantitativemeasure of the monolayer-adsorbed polymer thickness, inequation (24) as a function of polymer molecular weight,the segmented density of the ionized group of the polymer,the solvent (brine) pH and salinity, specific pore surfacearea of matrix, internal viscosity of the polymer, and therock porosity and permeability values and a constant tortu-osity parameter 5/12:
rad ¼ 118/3=2ffiffiffi
kp M 1=3
l½ �2=3rsgd
qb; ð24Þ
where, rsgd is the segmented density of the ionizable groupin the polymer, which depends on the affinity of themineral surface for the polymer molecules; qb is the bulk
Fig. 4. Monolayer vs. Multilayer Adsorption.
oot
/qwSwCw þ 1� /ð ÞqrC
rð Þ þ r � qwCw
1� aPð ÞRmuw
� �þ qwqwC
w ¼ 0; ð19Þ
I. Mohammed et al.: Oil & Gas Science and Technology – Rev. IFP Energies nouvelles 75, 77 (2020)8

density of the rock, / is porosity, M polymer molecularweight, and k is absolute permeability.
The authors pointed out that the salinity of theaccompanying brine can have a significant influence onthe theoretical polymer adsorption thickness; for instance,the reduction in solvent salinity from 5000 ppm to zerocan increase the intrinsic viscosity of the polymer by afactor of 100. Most important to note is that some of theseparameters such as solvent pH and polymer concentrationhave a critical point beyond which the effects on polymeradsorption will be little, for polymer concentration it isbeyond 0.05%wt. Similarly, for 10% NaCl solvent, adsorp-tion of partially hydrolyzed polyacrylamide in carbonaterock is six times more than in silicate rock. However, thepresented models will not be applicable for high flow ratepolymers and cannot differentiate the contribution ofresidual oil saturation, pore plugging, pore size distributionand clay effects from adsorbed polymer thickness, thusreferred to as a theoretical value (Gogarty, 1967; Willhiteand Dominguez, 1977).
Experimental techniques have been developed to distin-guish adsorptive from non-adsorptive polymer bed. Silanetreatment is applied to one of the packed silica sand-bedsamples, to change the functional group of the readilyadsorbed silica surface to methyl group, thereby renderingthe rock non-adsorptive to the developed HydrolyzedPolyacrylamide (HPAM) (Cohen and Christ, 1986;Dominguez and Willhite, 1977; Szabo, 1975). Further, theratio of the exit C, to the entry HPAM concentration Co,was recorded. Thereafter, the authors plotted the ratioagainst pore volume injected. If there is no retention,C/Co = 1, which means that the concentration remainsunchanged. Most importantly, the area between theadsorbing and non-adsorbing samples represents theadsorptive retention part of the total retention, while,(C/Co > 1) indicates that desorption took place. Theauthors compared the total concentration before and afterfor the two cases, and the results showed that while,
32.6 lg and 21 lg of polymer per 1 g of adsorbent wasretained in the adsorbed bed; 15.7 lg and 10 lg of polymerper 1 g of adsorbent was retained in the non-adsorbed bedas reported by Cohen and Christ, and Dominguez andWillhite, respectively. Generally, this accounted for only35.2% adsorbed polymer of the total retained and EffectiveHydrodynamic Thickness (EHT) of the adsorbed polymerlayer is 0.57 lm obtained at the lowest stress level of0.375 Pa. The authors observed that as the shear stresslevel increases, the mobility reduction effect of thepolymer reduces and consequently the EHT drops. Anequation for approximating the theoretical adsorbedpolymer thickness for low-velocity flow conditions wasintroduced and given as
rad ¼ /d3 1� /ð Þ 1� kadslapp
klapp;ads
� � n3nþ1
; ð25Þ
where lapp and lapp,ads are the apparent viscosity mea-sured in the non-absorbed and adsorbed silica sandrespectively; n and K are the fitting parameters of thepower-law model for the polymer rshear ¼ K _cn and _c isthe shear rate. However, for the adsorbed silica, theauthor did not account for the effect of the electrophilichead of the different types of polymer and their molecularweight on the EHT approximation model.
4 Gas adsorption
Over 20–80% of shale gases are stored in adsorbed phaseunder conditions that are affected by several factors suchas the total organic content, temperature, specific volumeratio, mineralogy, etc. leading to phase interactions (Bustinet al. 2008; Curtis et al. 2010; Huan-Zhi and Yan-qing, 2010;Lu et al., 1995). Gas molecular interactions with rocksurfaces result in gas adsorption onto the surface with the
Fig. 5. The five types of adsorption isotherms (Agarwal, 2012; Brunauer et al., 1940).
I. Mohammed et al.: Oil & Gas Science and Technology – Rev. IFP Energies nouvelles 75, 77 (2020) 9

effect being an increase in the density of the gas molecules atfluid/solid interface and a reduction in the gas phasedensity. The adsorption process can be physical orphysisorption which is controlled by van der Waalsforces or chemisorption which is governed by covalent bond-ing. The reversibility of this process as well as the adsorptioncapacities is controlled by several factors such as tempera-ture, nature of surfaces, pressure, amount and nature ofgas molecules and rock heterogeneity (Tan et al., 2014;Xiao-Chun et al., 1995; Zhang et al., 2012). Critical to theunderstanding of such systems is the knowledge of gasadsorption capacity, which is a key to reserve estima-tion in shale formation and the dynamics of production.The adsorption capacity measurement entails measuringthe volume of gas adsorbed on the rock surface at constanttemperature, pressure or amount of gas. Adsorptionisotherms, isobars and isosteres are then generated todetermine the relationship between temperature, pressureor amount of gas at equilibrium (Bertier et al., 2016).Various models have been developed to predict the adsorp-tion capacity based on different adsorption mechanisms, themajor classifications being: (1) Monolayered and multilay-ered models, (2) single component and multicomponentmodels.
4.1 Monolayered vs. multilayered models
In monolayered adsorption the adsorbed molecules occupyonly certain adsorption sites and are in direct contact withthe surface layer of the adsorbent, whereas under multilay-ered adsorption the molecules of gas phase can be adsorbedin more than one layer and therefore all the molecules arenot in direct contact with the surface layer of the adsorbent.The sketch presented in Figure 4 differentiates between thetwo forms of adsorption.
After conducting extensive literature review Brunaueret al. (1940) put forward five isotherm shapes (Fig. 5)which could incorporate all adsorption isotherm models(Brunauer, 1943; Brunauer et al., 1940). Type I isothermsare encountered when the adsorption is limited to a singlelayer and are generally encountered during chemisorptionon microporous powders (pore diameter < 2 nm). At highpressure the pores are saturated with the adsorbate andno additional adsorption occurs. In Type II isotherms theamount adsorbed increases with increasing pressure andthen reaches a plateau, this happens when monolayeradsorption is completed. On further increasing the pressuremultilayer adsorption occurs (Masel, 1996). Type IIIisotherms are characterized by very little initial adsorption.However, as adsorption proceeds additional adsorption isfacilitated because the adsorbate interaction with theadsorbed layer is greater than the interaction with theadsorbent surface (Lowell et al., 1991). Type IV isothermsoccur due to capillary condensation where gas condensesin the tiny capillary pores of the solid at pressures less thanthe saturation pressure of gas. At lower pressures a forma-tion of monolayer is observed followed by formation ofmultilayers. Type V is similar to Type III in that they showsmall adsorbate-adsorbant interaction however they occur
on similar adsorbants as a Type IV isotherm. The mostcommon monolayer models include Langmuir (Langmuir,1918; Zhang et al., 2012), Freundlich model (Ahmadi andShadizadeh, 2015; Freundlich, 1909), Langmuir-Freundlichmodel (Wang et al., 2016b,c), D-R model (Chen et al., 2017;Rani et al., 2019), and the Toth model (Rexer et al., 2013;and Bae and Bhatia 2006). While the most commonly usedmultilayer model is the BET model (Brunauer et al., 1938;Yu et al., 2016). Table 2 lists some of the most commonlyused monolayer and multilayer models.
Under this section, we discuss further in detail theLangmuir model, The DR and DA models, and the BETmodel for gas adsorption. Detailed discussions of all theother isotherms can be found in the exhaustive reviews onadsorption isotherms conducted by Saadi et al. (2015)and Ayawei et al. (2017).
4.1.1 Langmuir model
The Langmuir model has generally been the most imple-mented model for the prediction of gas adsorption in porousmedia (Fianu et al., 2019a). It is an equilibrium model thatcaptures the relationship between gas pressure and thequantity of gas adsorbed at a constant temperature. Themodel assumes a homogeneous surface with fixed adsorp-tion sites where monolayer adsorption occurs, with theadsorbed molecules assumed to be non-interacting(Swenson and Stadie, 2019).
The isotherm equation is given by
Gs ¼ V LPPL þ P
; ð26Þ
where Gs is adsorption capacity, P is pressure, VL and PLare Langmuir volume and pressure respectively.
Yan et al. (2016) modeled the flow behavior consideringmultiple mechanisms such as natural fractures, inorganicmatrix, organic matrix (micropores), and organic matrixnanopores. However, the model suitability is limited to sin-gle-phase fluid, single-components, and isothermal cases.The Klinkenberg gas slippage term is also neglected. Fur-thermore, the author provided a numerical simulation solu-tion to the Darcy flow flux and the Fickian diffusion fluxgiven below with no source/sink term:
oC free
otþ oC sorbed
ot¼ �r � q~uð Þ; ð27Þ
where,
~u ¼ ��kl
rP � q~gð Þ þ DgCgrP; ð28Þ
and, V is the bulk volume of the reservoir, Cfree = /q; isthe total mass concentration of free gas phase,Csorbed = qa (1 � /), is the total mass concentration of
sorbed phase, qa ¼ qsqg stdPVLPLþP
� �; ~u is the volumetric flow
rate in the reservoir normal to the surface of the rockbody, qs is the density of the shale, VL is the Langmuirvolume, �k is permeability, l is viscosity, P is pressure,qg is gravity term, Cg is gas compressibility, Dg is gas
I. Mohammed et al.: Oil & Gas Science and Technology – Rev. IFP Energies nouvelles 75, 77 (2020)10
diffusivity constant, PL is the Langmuir pressure and, q isthe cumulative flow rate (sink/source).
While the Darcy model describes the flow in naturalfractures and the inorganic matrix, some of these modelsalso use the Fickian diffusion flux model to describe thetotal diffusion flux of the shale rock. Nevertheless, becauseof hysteresis that occurs in shale, which is a function of ionicinteractions and reservoir conditions, the non-equilibriumsituation is experienced. In other words, the volume of gasdesorption is less than adsorption, similarly total dissolvedgas is not commensurate to total micropores and the nano-pores diffusion.
An et al. (2017) coupled geo-mechanics and gas flowmodel to study the effect of stress and matrix shrinkage ongas production performance of organic-rich fractured shalereservoirs. The authors described the governing flow equa-tion for an isothermal single-phase flow system like the
equations presented by Yan et al. (2016), they, however,introduced the sink/source term and accounted for Klinken-berg slip factor:
oC free
otþ oC sorbed
ot¼ �r � q~uð Þ þ qq
V; ð29Þ
where,
~u ¼ ��kl
1þ bp
� �rP � q~gð Þ þDgCgrP; ð30Þ
where qs is the density of the shale, V is volume, �k ispermeability, l is viscosity, P is pressure, b is Biot coeffi-cient, qg is gravity term, q is the flow rate, Cg is gascompressibility, Dg is gas diffusivity constant. The authorssolved the complex problem using a numerical simulationapproach and the investigation revealed that although
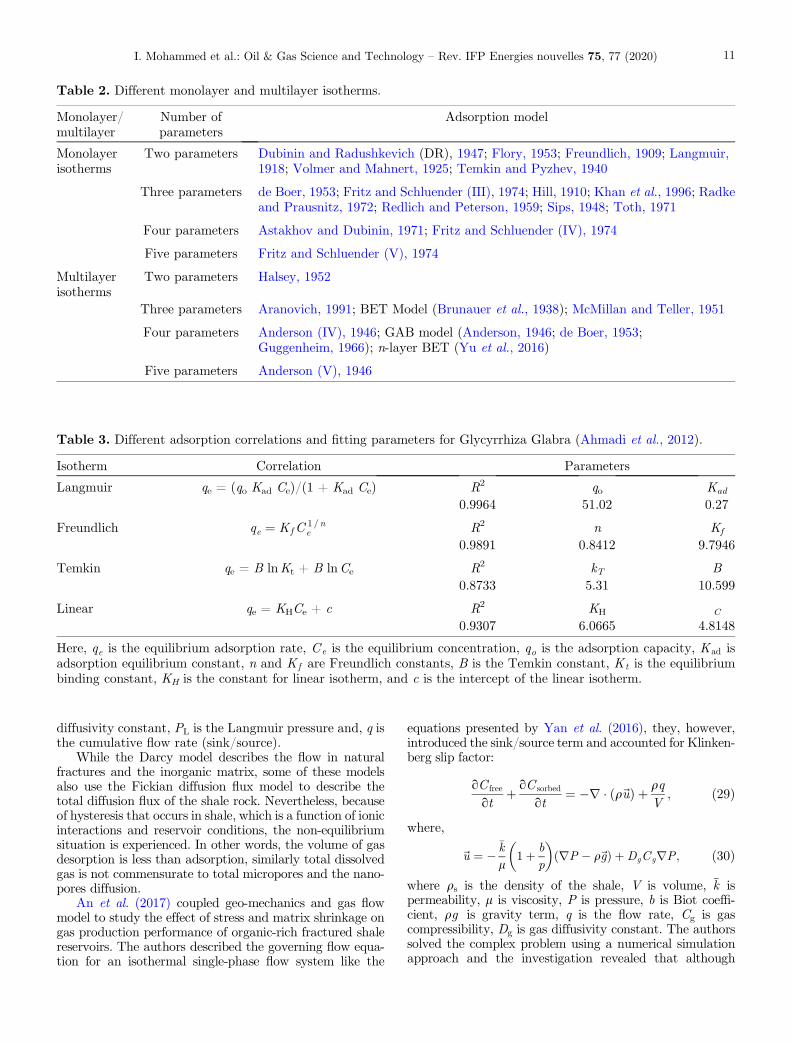
Table 2. Different monolayer and multilayer isotherms.
Monolayer/multilayer
Number ofparameters
Adsorption model
Monolayerisotherms
Two parameters Dubinin and Radushkevich (DR), 1947; Flory, 1953; Freundlich, 1909; Langmuir,1918; Volmer and Mahnert, 1925; Temkin and Pyzhev, 1940
Three parameters de Boer, 1953; Fritz and Schluender (III), 1974; Hill, 1910; Khan et al., 1996; Radkeand Prausnitz, 1972; Redlich and Peterson, 1959; Sips, 1948; Toth, 1971
Four parameters Astakhov and Dubinin, 1971; Fritz and Schluender (IV), 1974
Five parameters Fritz and Schluender (V), 1974
Multilayerisotherms
Two parameters Halsey, 1952
Three parameters Aranovich, 1991; BET Model (Brunauer et al., 1938); McMillan and Teller, 1951
Four parameters Anderson (IV), 1946; GAB model (Anderson, 1946; de Boer, 1953;Guggenheim, 1966); n-layer BET (Yu et al., 2016)
Five parameters Anderson (V), 1946
Table 3. Different adsorption correlations and fitting parameters for Glycyrrhiza Glabra (Ahmadi et al., 2012).
Isotherm Correlation Parameters
Langmuir qe = (qo Kad Ce)/(1 + Kad Ce) R2 qo Kad
0.9964 51.02 0.27
Freundlich qe ¼ KfC 1 = ne R2 n Kf
0.9891 0.8412 9.7946
Temkin qe = B lnKt + B lnCe R2 kT B0.8733 5.31 10.599
Linear qe = KHCe + c R2 KH C
0.9307 6.0665 4.8148
Here, qe is the equilibrium adsorption rate, Ce is the equilibrium concentration, qo is the adsorption capacity, K ad isadsorption equilibrium constant, n and Kf are Freundlich constants, B is the Temkin constant, Kt is the equilibriumbinding constant, KH is the constant for linear isotherm, and c is the intercept of the linear isotherm.
I. Mohammed et al.: Oil & Gas Science and Technology – Rev. IFP Energies nouvelles 75, 77 (2020) 11

stress reduces the overall gas production when comparedwith unstressed formation; however, the organic-rich rockhad a higher cumulative gas production compared to rockwith the absence of Total Organic Content (TOC). In addi-tion, the authors recognized the effect of the choice of cor-relation on the reservoir performance dependency onstress and TOC (Aybar, 2014; Cho et al., 2013; Ozkanet al., 2010; Raghavan and Chin, 2004; Sullivan et al.,2006). In general, effective permeability, �k in a fracturedreservoir is �k ¼ km þ kf ; where, km is the matrix permeabil-ity and kf is the fracture permeability. In addition to thedesorption and diffusion equation, the authors coupledthe geo-mechanical effects with the flow; given that thesummation of the forces acting in all direction of the rockbody in terms of overburden and effective stress of theorganic-rich rock is zero (i.e., the body is at equilibrium).
4.1.2 Pore filling models: The Dubinin-Radushkevich(DR) model and Dubinin-Astakhov (DA) model
Pore-filling models assume that the adsorption mechanismin nano and micropores is as a result of the volume fillingof pores and not the formation single or multi-layers(Astakhov and Dubinin, 1971). The Dubinin-Radushkevich(D-R) and Dubinin-Astakhov (D-A) equations were devel-oped based on the theory of characteristic curved proposedby Polanyi (Gil and Grange, 1996). The authors argue thatthough porous adsorbents may contain varieties of poresizes, the micropores are the key determinants of gas adsorp-tion. The D-R equation is given as (Kapoor et al., 1989)
h ¼ exp � AbE
� �2" #
¼ exp � RTbE
lnPo
P
� �2" #
; ð31Þ
where h is the relative adsorption, A is the adsorptionpotential, E is the characteristic energy of adsorption(cal/mol), b is the affinity coefficient, R is the gas con-stant and P is the pressure. The D-A model is given as(Kapoor et al., 1989)
h ¼ exp � AbE
� �n� �¼ exp � RT
bElnPo
P
� �n� �: ð32Þ
These equations can be used for modeling adsorption stud-ies at different temperatures (Fianu et al., 2019b). TheD-R and D-A models were developed for a homogenous porestructure (Hutson and Yang, 1997). Huber et al. (1978),extended the D-R model to account for non-homogeneousmicropores. Further extension by Kapoor et al. (1989)allows for the prediction of multicomponent equilibria(Kapoor and Yang, 1989).
4.1.3 Brunauer-Emmett-Teller (BET) model
The single-layer adsorption assumption by Langmuirresults in the failure to model secondary phase adsorptionwhich occurs when there are layers of adsorption. TheBET model was developed to account for subsequent layersof adsorption near saturation conditions. When there ismultilayer adsorption, each layer represents a differentadsorption site, having distinct energy. An advantage of
this model is that it allows for the computation of surfacearea (Brunauer et al., 1938). Unlike the Langmuir model,which is valid at low pressures, the BET model capturesbehavior at both low and high pressures.
The BET isotherm equation is given by
PV ðPo � PÞ ¼
1Vm
þ c � 1VmC
PPo
; ð33Þ
where Vm is the volume of gas adsorbed, Po is gas satura-tion pressure, P is pressure and c is constant.
4.2 Single component vs. multicomponent models
In single-component adsorption models, a single gas such asmethane is used for adsorption studies. Natural gas fromcoal and shale is made up of different components, thoughmethane may be abundant, with models assuming puremethane. The effect of the different gas components, regard-less of their mole ratio play significant roles in the adsorptionprocess and hence cannot be overlooked. Multicomponentadsorption models are the class of models that describeadsorption behavior of gas mixtures. Most of the adsorptionisotherms described above deal with a single component gasadsorption. Under this section we review some of the morepopular multicomponent models available.
4.2.1 Multicomponent Langmuir model
This model was developed as an extension of the Langmuirmodel for gas mixtures (Hall et al., 1994; Ruthven, 1984).The model accounts for the molar volume as well as the par-tial pressure of the components and is used in the predictionof adsorption equilibrium for mixtures based on their purecomponent isotherms.
The isotherm is defined as
Va ¼Xni¼1
VLiðpgyiÞPLi þ
Pj¼1
n1
PLiðyjpgÞ
; ð34Þ
where Va is the amount of adsorbed gas, pg are partialpressures, yi is mole fractions.
4.2.2 MultiSite Occupancy Model (MSOM)
The Langmuir model assumes no interaction betweenadsorbed molecules however, the MSOM model was devel-oped to account for adsorption on multiple sites andmulticomponent mixtures such as hydrocarbons (Nittaet al., 1984b). The MSOM model is derived for both singleand multiple component adsorptions from a localized modelin which the molecule occupies multiple site on a homoge-neous surface.
The single component expression for MSOM on a homo-geneous surface is given as
ln nKPð Þ ¼ ln h� n ln 1� hð Þ � nhu=kT : ð35ÞThe multicomponent expression on a homogeneous surfaceis given as
I. Mohammed et al.: Oil & Gas Science and Technology – Rev. IFP Energies nouvelles 75, 77 (2020)12

ln niKiPið Þ ¼ ln hi � ni ln 1�Xj
hj
!� ni
Xj
hjuij=kT :
ð36Þwhere n is the number of sites occupied by one molecule,K is the adsorption equilibrium constant, P is thepressure, p is the partial pressure, h is the surface cover-age, u is the molecular interaction parameter, k is theBoltzmann constant, and T is the temperature.
The MSOM model was further extended for adsorptionon heterogeneous surfaces (Nitta et al., 1984a).
There have been several modifications to the MSOMmodel in the literature. This includes extensions proposedby Bai et al. (2003), Azizian and Bashiri (2009), andRomanielo et al. 2014.
4.2.3 Ideal Adsorbed Solution Theory (IAST)
The IAST is regarded as one of the fundamental models inadsorption science and can be used to describe the adsorp-tion characteristics for ideal mixtures (Ahmadpour et al.,1998; Chen et al., 2011). The model was derived from ther-modynamic theory. It models the adsorption equilibria ofgas mixtures using pure component isotherms (Myers andPrausnitz, 1965). The IAST is the most commonly usedmethod because of its reliability and ease as it uses onlythe pure-component adsorption isotherms to model thegas mixture adsorption equilibrium. There are three majorassumptions to IAST model: (1) Adsorbate molecules in themixture have equal access to the entire surface area ofadsorbent; (2) Adsorbent is homogeneous; (3) Adsorbedphase is an ideal solution in which makes it analogous toRaoult’s law (Walton and Sholl, 2015). With such asassumption, the partial pressure of the adsorbed phasecan be computed using its mole fraction in the adsorbedphase and the pressure exerted as a pure component pres-sure at the same temperature and spreading pressure.Under IAST the spreading pressure for pure componentscan be calculated by
pART
¼Z pi
0
ni
PidPi; ð37Þ
where p is the spreading pressure. The spreading pressureis similar to the negative of surface tension and for adsorp-tion its value is positive. The partial pressure for aconstant temperature and spreading pressure can becalculated using an analog to Raoult’s law as
Pi ¼ xipi; ð38Þwhere pi is the partial pressure of pure component i. Thetotal adsorbed amount can then be calculated as
1nT
¼XNi¼1
xin0i; ð39Þ
where xi is mole fraction of component i, N is the totalnumber of species. n0
i is the amount of componenti adsorbed at constant temperature and spreading
pressure. Finally the adsorption of each pure species iscalculated by
ni ¼ xinT : ð40ÞThemajor shortcoming of IAST is that it provides erroneouspredictions for adsorbents with heterogeneous surfaces.
4.2.4 Vacancy Solution Model (VSM)
In the Vacancy Solution Model (VSM) proposed bySuwanayuen and Danner (1980a, 1980b), the adsorptionsurfaces are assumed to be occupied by an imaginarysolvent, termed vacancy, where the gas and adsorbedphases may fill. The gas and adsorbed phases are consideredas solutions of different adsorbate compositions in thevacancy. The adsorption of a gas mixture is then assumedto be an equilibrium between two vacancy solutions of dif-ferent compositions. The non-ideality of the adsorbed gas ispredicted using models of activity coefficient such as theWilson and Flory-Huggins equation.
5 Surfactant adsorption
Surfactants like polymer are introduced into the reservoir toenhance production. While, polymers are useful in fluidmobility control, surfactants are used to reduce the capil-lary effect and interfacial tensions between the rock andthe oil. A surfactant consists of both hydrophobic andhydrophilic parts which make the surfactant moleculesusceptible to adsorption onto rock surfaces. Suresh et al.(2018) reported the applicability of nanoparticle to reducesurfactant adsorption unto the rock surface. This is dueto the electrostatic repulsion induced by the nanoparticlewhich reduced the bridging polar heads of the surfactant.The presence of gases in the reservoir has also been reportedto cause the adsorption of surfactants onto the rock surfacesas well as cause foam instability in enhanced oil recovery(Yin et al., 2009). Liu et al. (2006) reported surfactantadsorption in a surfactant-gas co-flooding operation withthe aim of establishing a relationship between the criticalfoam concentration and the mobility improvement as wellas its effect on reservoir wettability. The authors using aCommercial Surfactant (CD-1045TM) and an Indiana lime-stone sample and ran several cores flooding experimentswith different flow conditions and concentration. Theirfindings revealed that the adsorption of the surfactant withor without the presence of gases remains the same andreduces the gas mobility. Furthermore, it improves thefoam stability, yielding a stable flooding front and improvedsweep efficiency. Adsorption and desorption test shows thatthe desorption was a much slower process that agrees withthe literature.
Glover et al. (1979) using two surfactants in the volumeratios of 63:37 and 90:10 investigated the behavior ofsurfactants and their retention potential on the Barea sand-stone sample using core flooding experiments. To obtain theretained surfactant, an arithmetic difference between theinjection stream concentration and effluent stream concen-tration was used with the findings revealing the dependence
I. Mohammed et al.: Oil & Gas Science and Technology – Rev. IFP Energies nouvelles 75, 77 (2020) 13

of the retention process on water salinity and surfactantconcentration. More so, a linear relationship is observedto exist between the retention and water salinity, thus, atrapping phenomenon at high concentration.
Surfactant is a chemical whose use and advantages havelong been established in literature to alter the wettability ofthe rock and reduce the interfacial tension between immisci-ble fluids (Zhou et al., 2012). This has led to recoveryincrease but with a drawback of adsorption unto the rocksurface which begs the question of its economic viability asan EOR option in the face of adsorption. Over the years,several surfactants have been tried on different reservoirsystems with different mineralogy to quantify the degreeof adsorption and suitability for enhanced oil recovery (Celikand Somasundaran, 1980; Cui et al., 2015; Meyers andSalter, 1980; Wang et al., 2015; Zhou et al., 2012). Debateshave been ongoing for decades over the effect of surfactant/CO2 co-injection for enhancing the oil recovery process andthe effect of gas fractional flow on recovery. Yin et al. (2009)in a recent work demonstrated the effect of fractional gasflow rate using Barea sandstone core samples with ChaserCD1045 obtained from Chaser International. Series ofexperiments were conducted with CO2/CD, CO2/brine,and water flooding experiments as well as varying CD con-centration, total gas, liquid flowrates and fractional gasratio. The findings revealed that there exists a three-flowregime which is the single-phase zone, pseudo-single-phasezone and the high fractional gas zone. Gas mobility wasobserved to increase with an increase in fractional gas ratioin the single-phase gas zone, decrease with increase in thefractional gas fraction in the pseudo-single-phase zone andincreases in the high fractional gas zone also revealingthe existence of a critical gas fractional ratio at whichthe increase in mobility is dependent on. These phenom-ena are asserted to be due to limiting capillary pressure.Furthermore, total flow rate and permeability are identifiedto be the most dominant factors in the determination of thecritical fractional gas rate to reduce foam mobility. More so,adsorption of surfactant is seen to be a fast process and thedesorption is partially reversible and a slow process. How-ever, its effect on recovery was not ascertained by theauthors. Oil recovery is reported to increase even afterCO2 and water flooding due to CO2/surfactant injec-tion and reverse showed no increase in recovery whichqualifies the CO2/surfactant injection as a good EORtechnique.
Surfactant adsorption has been reported to be due toelectrostatic interactions as well as influenced by thesurfactant structure and mineralogy (Zhong et al., 2019).Mannhardt et al. (1994) assert that one way to controlsurfactant adsorption would be to mix it with anionicsurfactants which has shown low adsorption tendencieswith low salinity to moderate salinity brine systems. Troguset al. (1977) studied the adsorption of anionic and nonionicsurfactants in a dynamic and static adsorption experimentand revealed that the adsorption of nonionic surfactantsincreases sharply with the increase in concentration andattains a constant value which corresponds to the adsor-bent maximum capacity which represents the criticalmicelle concentration, however, noted that the adsorption
decreases with increase in solubility of the surfactantin water which is achieved by the addition of alcohol.On the other hand, the adsorption measurement of theanionic surfactant was difficult due to precipitation andhigh salinity. Furthermore, in modeling the process ofadsorption, dispersion effect is observed to have negligibleinfluence and the anionic surfactant has preferential adsorp-tion on kaolin than on Barea sandstone, which is attributedto the electric nature of the rocks. Contrary to popularbelief on the use of cationic surfactants and their propensityto cause adsorption in sandstone reservoirs, the opposite isobserved in carbonates (Celik and Somasundaran, 1980).Tabatabal et al. (1993) reported a decrease in cationicsurfactant adsorption on carbonate core and alluded thatit is due to the lattice charge of the mineral surface.
Tumba et al. (2019) based on previous suggestions ofco-injecting surfactant with additives to prevent adsorptionutilized lignin as an additive to pervert adsorption onclay which is available in reservoirs. Sodium dodecyl sulfate(SDS) and 4-octylphenol polyethoxylated (TX-100) adsorp-tion were investigated with clay (kaolinite, montmoril-lonite, illite, and quartz) using lignin as an additive andthe results show interesting findings. Mineralogy isobserved to be a controlling factor as earlier reported inthe literature. Quartz was observed to have the leastadsorption compared to the other clay minerals due tothe hydrogen bond formation by the surface group of quartzsand and makes the adsorption by other mechanismsimpossible. Adsorption of SDS is seen to be higher com-pared to TX-100 due to hydrophobic interactions of thehydrocarbon in the nonionic surfactant. Adsorption onmontmorillonite and illite is dimmed impossible due tothe negative charge of the clay surface which repels theanionic surfactant. So conclusively, the anionic surfactantis more promising compared to the nonionic surfactant inoil recovery.
Bhuyan et al. (1990) modeled high pH surfactant flood-ing. They modeled adsorption using a Langmuir typeadsorption isotherm given as
Cts
� �abs ¼
aCts
1þ bCts
; ð41Þ
where, Cts
� �abs is the concentration of surfactant adsorbed,
Cts is the concentration of surfactant, and a and b are con-
stants of the isotherm. With reference to equation (38),
a ¼ a1 þ a2C se for pH pHð Þc; ð42Þ
a ¼ a1 þ a2C seð Þ 1� pH� pHð ÞcpHð Þt � pHð Þc
� �for pHð Þt � pH > pHð Þc;
ð43Þ
a ¼ 0 for pH > pHð Þt ; ð44Þwhere, a1 and a2 are constants of isotherm, pHð Þc is pHbelow which adsorption of surfactant is not a functionof pH, and pHð Þt is the pH above which adsorption ofsurfactant is negligibly small. All these terms are deter-mined experimentally, Cse is the effective salinity.
I. Mohammed et al.: Oil & Gas Science and Technology – Rev. IFP Energies nouvelles 75, 77 (2020)14
Grigg and Mikhalin (2007) studied the effect of flowconditions on the anionic surfactant adsorption to quantifythe effect of the test system on adsorption kinetics using thebatch test on crushed samples, flow test and non-flowdynamics experiments. Similar adsorption isotherm wasobserved for both the crushed sample and the dynamicexperiments with no flow and less adsorption in a flowdynamic experiment which is due to flow velocity. Eventhough the authors stated that equilibrium kinetics wasstudied, there was no justification for reports of values orkinetic models to show that. Thus, the question of surfac-tant adsorption kinetics remains a further area for research.
Ramirez et al. (1980) reported that in the conventionaladsorption kinetic models, the desorption rates are misrep-resented and assert that the adsorption kinetic rate is fivetimes faster than the equilibrium desorption kinetic rate.Bai et al. (2005) based on an earlier report about how fastthe adsorption kinetics was compared to the desorptionkinetic rate conducted series of experiments to establish arate dependent adsorption/desorption kinetic equationusing Barea sandstone and CD 1045 chaser surfactantsupplied by Chaser International. The authors reportedan early rapid adsorption trend followed by a slow periodof adsorption and the adsorption kinetics to follow pseudo-second-order kinetics given in equation (42):
dqtdt
¼ ka2ðqe � qtÞ2; ð45Þ
Upon integrating and rearranging, we have equation (43):tqt
¼ 1qtt þ 1
ka2 � q2e: ð46Þ
Thus, a plot of (t/qt) versus t gives a slope and intercepts of(1/qe) and 1=ðka2q2eÞ respectively. The desorption kinetics isalso seen to follow similar pseudo-second-order kinetics andis described in equation (44):
1qt � qr
¼ �kd2t þ 1qi � qr
: ð47Þ
Good agreement was achieved with the experimental dataand to further the kinetics, a relationship between thekinetic coefficients and initial concentration is reported asin equation. This is to enable the determination of adsorp-tion rate in a short time interval to avoid waiting for daysfor equilibration. However, the temperature dependence ofthe kinetics was not well established:
ka2 ¼ �8:93E � 04Ci þ 1:34 for Ci < 1200 ðmg=LÞka2 ¼ �1:04E � 04Ci þ 0:401 for Ci > 1200 ðmg=LÞ
;
ð48Þwhere qt is the adsorption density a time, t is time, ka2 isthe pseudo-second-order kinetic coefficient of adsorption,qe adsorption density at equilibrium, Ci initial concentra-tion, kd2 pseudo-second-order kinetic coefficient of desorp-tion, and qr is residual adsorption density.
In combating the problems of surfactant adsorption inthe reservoir, many researchers have proposed differenttechniques which include the injection of low concentrationof surfactant, pre-flushing with a sacrificial chemical or
co-injection of surfactant with a chemical with similar com-petitive attributes to site interactions. Polyacrylate is beenidentified as a good sacrificial agent hand that presents abetter performance in limestone and sandstone systems.It is also independent of the surfactant used and increasesin molecular weight results to reduce the surfactant adsorp-tion to rock surface until the critical molecular weightbeyond which no additional effect is derived (ShamsiJazeyiet al., 2013). This presents a solution to the drawback of theuse of sodium-based surfactants which react with anhy-drides in rocks. Krumrine et al. (1982) reported the signifi-cant reduction in surfactant adsorption by the addition ofsodium silicate, sodium carbonate and sodium tripolyphos-phate and stated that the alkaline surfactant is useful onlywhen the optimal pH and salinity can be determined fortheir implementation as well concentration range withinwhich increase in recovery can be ascertained.
Ahmadi et al. (2012) studied the adsorption kinetics andequilibrium of a novel surfactant (Glycyrrhiza Glabra).They compared the adsorption data using different adsorp-tion equilibrium and kinetics models and concluded that theLangmuir isotherm best suited the equilibrium data. Thedifferent isotherms they used were Langmuir, Freundlich,Temkin, and linear. Table 3 lists the correlations and thefitting parameters calculated by the authors.
Ahmadi and Shadizadeh (2015) performed a similarstudy on the adsorption of a surfactant extracted fromthe leaves of Zyziphus Spina Christi on Shale rocks andconcluded that Freundlich isotherm gave the best matchwith the results.
Cui et al. (2015) investigated the use of switchablecationic surfactant adsorption using zeta potential measure-ment on dolomite, calcite, and Kaoline at high and low CO2injection pressures. The anionic surfactant (tertiary amineEthomeen C12) upon equilibration in brine switches to acation at high CO2 pressure and a pH of 4. This uniquequality of the surfactant led to a reduction in adsorptionhowever, the presence of clay and silica presents a draw-back. More so, the presence of divalent and trivalent cationsreduces dissolution of calcite or dolomite at high pressurehowever presents a challenge of a rise in pH which increasesadsorption (Meyers and Salter, 1980). Contrary to theconventional method of adsorbed surfactant measuringtechnique which involves measuring concentration changes,Zhou et al. (2005) developed a novel technique called sand-washing technique which allows the determination ofadsorbed surfactant on the sand face and at an oil-waterinterface in the presence of oil. The technique involves theequilibration of the sand or oil/sand/surfactant system fora minimum of 30 days and extraction using the azeotropicmixture in the Soxhlet apparatus. Findings from the workrevealed the dependence of surfactant adsorption on brinesalinity as well as the surface charges of the rock whichleads to electrostatic interactions. Surfactant at low concen-tration and presence of alkali is observed to reduce theadsorption of surfactants and the presence of oil leads toemulsion formation which reduces the surfactant adsorp-tion to the sand face.
Wang et al. (2015) investigated the effect of polymer onsurfactant adsorption in an experiment to ascertain the
I. Mohammed et al.: Oil & Gas Science and Technology – Rev. IFP Energies nouvelles 75, 77 (2020) 15

degree of adsorption using the polymer as a pre-flush agent.An average of 0.163 mg/g-rock of surfactant was adsorbedwhen surfactant alone was injected into the sandstonesample, with a reduction of 51.3% in the amount ofadsorbed surfactant when the polymer was used as a pre-flush. This is to say that the polymer was used as a sacrifi-cial chemical to avoid the loss of surfactant. However, in aneconomic sense, a polymer is not cheap and as well adds tothe cost of operation and may as well impair the permeabil-ity of the rock. So even though the presented case seemsreasonable, it may lead to an uneconomically feasibleproject.
The economics of surfactant injection implementationdoes not only significantly depend on the amount of surfac-tant needed but also on the rate of loss of surfactant withinthe reservoir. Even though the potential for adsorptionreduction of surfactants has been shown in the literature(Tumba et al., 2019), its economic evaluation remains aquestion. Tsau et al. (2000) evaluated the economic impactof the use of lignosulfonate as a sacrificial chemical insurfactant flooding and based on a reduction of surfactantadsorption of 24–60% and 15–29% in Barea sandstoneand Indiana limestone, different implementation schemescan be designed. The authors concluded that the injectionof lignosulfonate as a pre-flush is more economical thanco-injection with the surfactant, however, no economicmodel or use of fiscal systems was shown to provide a basisfor such argument. For the effect evaluation of a chemical inview of economics, a fiscal system must be used in theevaluation and benchmarked against alternatives before aconclusive decision can be justified. Adsorption of surfac-tant is not peculiar to conventional reservoirs alone but alsooccurs in shales as well. Mirchi et al. (2016) studied surfac-tant adsorption in shale and concluded that surfactantadsorption phenomena exist in shales as well and theadsorption isotherm follows the Langmuir isotherm.
6 Conclusion
In this study, we discussed the adsorption of nanoparticles,polymers, gas, and surfactant in porous media. Specialattention was given to understanding the different model-ing techniques currently available to model adsorption.Firstly, for the adsorption of nanoparticles on porous media,it was concluded that the rate of adsorption increased withthe flowrate but decreased with the presence of clay (Yuet al., 2012; Zhang et al., 2015). It was also concluded thatadsorption of nanoparticles, and particle retention in poresof the porous media are the major contributors accountingfor the loss of nanoparticles. It is therefore important toconsider these factors when modeling flow and transportof nanoparticles in porous media (Ju et al., 2012).
Secondly, the main factors affecting the polymer adsorp-tion in porous media are the adhesion to the rock surface,trapping and particle entrainment. While modelingpolymer adsorption it is essential to account for the reduc-tion in permeability of the porous media. Langmuirisotherm is the most popular adsorption isotherm used to
model adsorption of polymers on the reservoir rock surfaces(Braconnier et al., 2017; Khormali et al., 2018).
Thirdly, it is essential to accurately model gas adsorp-tion in shales because 20–80% of shale gases are stored inadsorbed phases. Similar to polymer adsorption, Langmuirmodel is the most implemented model for the prediction ofgas adsorption. Langmuir model however fails when layersof adsorption are present, in this scenario it is essential toutilize a multilayer model such as the BET isotherm.In the presence of multicomponent gases, the adsorptionbehavior can be modeled by MSOM model or the IASTmodel.
Finally, surfactant adsorption can be modeled bydifferent isotherms such as Langmuir, Freundlich, Temkinand Linear models. A detailed study was performed onmatching the isotherms to the experimental results for twodifferent surfactants: Glycyrrhiza Glabra on carbonatecores (Ahmadi et al., 2012) and a surfactant obtainedfrom Zyziphus Spina Christi on Shale rocks (Ahmadiand Shadizadeh, 2015). It was concluded that theLangmuir model gave the best match for the former casewhereas the Freundlich model gave the best match for thelatter case.
Acknowledgments. The authors acknowledge the supportprovided by the College of Petroleum Engineering andGeosciences (CPG) at King Fahd University of Petroleum andMinerals, Saudi Arabia for access to its educational resourcesused in this study. The authors also express their sinceregratitude towards the editor and the anonymous reviewers fortheir comments and suggestions.
References
Abdelfatah E.R., Kang K., Pournik M., Shiau B., Harwell J.,Haroun M.R., Rahman M.M. (2017) Study of nanoparticleadsorption and release in porous media based on the DLVOtheory, in: SPE Latin America and Caribbean PetroleumEngineering Conference, 17–19 May, Buenos Aires, Argen-tina. https://doi.org/10.2118/185484-ms.
Abraham W.H. (1966) Transient polycondensation calculations-an analytical solution, Chem. Eng. Sci. 21, 327–336. https://doi.org/10.1016/0009-2509(66)85025-X.
Agarwal V.K. (2012) Stability study of important Metal OrganicFrameworks (MOFs) and a review on their gas adsorptionproperties.
Ahmadi M.A., Shadizadeh S.R. (2015) Experimental investiga-tion of a natural surfactant adsorption on shale-sandstonereservoir rocks: Static and dynamic conditions, Fuel 159,15–26. https://doi.org/10.1016/j.fuel.2015.06.035.
Ahmadi M.A., Zendehboudi S., Shafiei A., James L. (2012)Nonionic surfactant for enhanced oil recovery from carbon-ates: Adsorption kinetics and equilibrium, Ind. Eng. Chem.Res. 51, 9894–9905. https://doi.org/10.1021/ie300269c.
Ahmadpour A., Wang K., Do D.D. (1998) Comparison of modelson the prediction of binary equilibrium data of activatedcarbons, AIChE J. 44, 740–752. https://doi.org/10.1002/aic.690440322.
An C., Fang Y., Liu S., Alfi M., Yan B., Wang Y., Killough J.(2017) Impacts of matrix shrinkage and stress changes on
I. Mohammed et al.: Oil & Gas Science and Technology – Rev. IFP Energies nouvelles 75, 77 (2020)16

permeability and gas production of organic-rich shale reser-voirs, in: Soc. Pet. Eng. – SPE Reservoir Characterisation andSimulation Conference and Exhibition 2017, pp. 537–555.
An C., Killough J., Mi L. (2019) Stress-dependent permeabilityof organic-rich shale reservoirs: Impacts of stress changes andmatrix shrinkage, J. Pet. Sci. Eng. 172, 1034–1047. https://doi.org/10.1016/j.petrol.2018.09.011.
Anderson R.B. (1946) Modifications of the Brunauer, Emmettand Teller equation, J. Am. Chem. Soc. 68, 686–691. https://doi.org/10.1021/ja01208a049.
Arain Z.U.A., Al-Anssari S., Ali M., Memon S., Bhatti M.A.,Lagat C., Sarmadivaleh M. (2019) Reversible and irreversibleadsorption of bare and hybrid silica nanoparticles onto carbon-ate surface at reservoir condition, Petroleum. https://doi.org/10.1016/j.petlm.2019.09.001.
Aranovich G.L. (1991) New polymolecular adsorption isotherm,J. Colloid Interface Sci. 141, 30–43. https://doi.org/10.1016/0021-9797(91)90299-N.
Astakhov V.A., Dubinin M.M. (1971) Development of theconcept of volume filling of micropores in the adsorption ofgases and vapors by microporous adsorbents – Communica-tion 3. Zeolites with large cavities and a substantial number ofadsorption centers, Bull. Acad. Sci. USSR Div. Chem. Sci. 20,13–16. https://doi.org/10.1007/BF00849309.
Ayawei N., Ebelegi A., Wankasi D. (2017) Modelling andinterpretation of adsorption isotherms, J. Chem. 2017,3039817. https://doi.org/10.1155/2017/3039817.
Aybar U. (2014) Investigation of analytical models incorporatinggeomechanical effects on production performance of hydrauli-cally and naturally fractured unconventional reservoirs, Geology.
Azizian S., Bashiri H. (2009) A new isotherm for multisiteoccupancy adsorption of binary gaseous mixtures, Langmuir25, 2309–2312. https://doi.org/10.1021/la803675h.
Bae J.S., Bhatia S.K. (2006) High-pressure adsorption ofmethane and carbon dioxide on coal, Energy and Fuels 20,2599–2607. https://doi.org/10.1021/ef060318y.
Bai B., Grigg R.B., Liu Y., Zeng Z. (2005) Adsorption kinetics ofsurfactant used in CO2-Foam flooding onto berea sandstone,Proc. – SPE Annu. Tech. Conf. Exhib. 1951–1957 Society ofPetroleum Engineers. https://doi.org/10.2523/95920-ms.
Bai R., Deng J., Yang R.T. (2003) Improved multisite langmuirmodel for mixture adsorption using multiregion adsorptiontheory, Langmuir 19, 2776–2781. https://doi.org/10.1021/la020838v.
Belhaj A.F., Elraies K.A., Mahmood S.M., Zulkifli N.N., AkbariS., Hussien O.S.E. (2020) The effect of surfactant concentra-tion, salinity, temperature, and pH on surfactant adsorptionfor chemical enhanced oil recovery: a review, J. Pet. Explor.Prod. Technol. 10, 125–137. https://doi.org/10.1007/s13202-019-0685-y.
Bertier P., Schweinar K., Stanjek H., Ghanizadeh A., ClarksonC.R., Busch A., Kampman N., Prinz D., Amann-Hildenbrand A.,Krooss B.M., Pipich V. (2016) On the use and abuse of N2
physisorption for the characterization of the pore structure ofshales, Fill. Gaps – from Microsc. Pore Struct. to Transp. Prop.Shales 151–161. https://doi.org/10.1346/cms-wls-21-12.
Bhuyan D., Lake L.W., Pope G.A. (1990) MathematicalModeling of High-pH Chemical Flooding, SPE Reserv. Eng.5, 213–220. https://doi.org/10.2118/17398-PA.
Braconnier B., Preux C., Flauraud É., Tran Q.H., Berthon C.(2017) An analysis of physical models and numerical schemesfor polymer flooding simulations, Comput. Geosci. 21, 1267–1279. https://doi.org/10.1007/s10596-017-9637-0.
Brunauer S. (1943) The Adsorption of Gases and Vapors.Volume I: Physical Adsorption, Princeton University Press.
Brunauer S., Deming L.S., Deming W.E., Teller E. (1940) On atheory of the van der Waals adsorption of gases, J. Am. Chem.Soc. 62, 1723–1732. https://doi.org/10.1021/ja01864a025.
Brunauer S., Emmett P.H., Teller E. (1938) Adsorption of gasesin multimolecular layers, J. Am. Chem. Soc. 60, 309–319.https://doi.org/10.1021/ja01269a023.
Burcik E.J. (1965) A note on the flow behaviour of polyacry-lamide solutions in porous media, Prod. Mon. 29, 6.
Bustin R.M., Bustin A.M.M., Cui X., Ross D.J.K., Pathi V.S.M.(2008) Impact of shale properties on pore structure andstorage characteristics, in: Society of Petroleum Engineers –Shale Gas Production Conference, 2008, pp. 32–59. https://doi.org/10.2118/119892-ms.
Celik M., Somasundaran P. (1980) Wettability of reservoirminerals by flotation and correlation with surfactant adsorption,in: SPE Oilfield and Geothermal Chemistry Symposium, 28–30May, Stanford, California, Society of Petroleum Engineers.https://doi.org/10.2118/9002-MS.
Chen J., Loo L.S., Wang K. (2011) An Ideal Absorbed SolutionTheory (IAST) study of adsorption equilibria of binary mixturesof methane and ethane on a templated carbon, J. Chem. Eng.Data 56, 1209–1212. https://doi.org/10.1021/je101099c.
Chen L., Jiang Z., Liu K., Ji W., Wang P., Gao F., Hu T. (2017)Application of Langmuir and Dubinin-Radushkevich modelsto estimate methane sorption capacity on two shale samplesfrom the Upper Triassic Chang 7 Member in the southeasternOrdos Basin, China. Energy Explor. Exploit. 35, 122–144.https://doi.org/10.1177/0144598716684309.
Cheraghian G., Khalili Nezhad S.S., Kamari M., Hemmati M.,Masihi M., Bazgir S. (2014) Adsorption polymer on reservoirrock and role of the nanoparticles, clay and SiO2, Int. NanoLett. 4, 114. https://doi.org/10.1007/s40089-014-0114-7.
Cho Y., Apaydin O.G., Ozkan E. (2013) Pressure-dependentnatural-fracture permeability in shale and its effect on shale-gas well production, SPE Reserv. Eval. Eng. 16, 216–228.https://doi.org/10.2118/159801-PA.
Christopher R.H., Middleman S. (1965) Power-law flow througha packed tube, Ind. Eng. Chem. Fundam. 4, 422–426. https://doi.org/10.1021/i160016a011.
Cohen Y., Christ F.R. (1986) Polymer retention and adsorption inthe flow of polymer solutions through porous media, SPEReserv. Eng. Soc. Pet. Eng. 1, 113–118. https://doi.org/10.2118/12942-PA.
Cui L., Ma K., Abdala A.A., Dhabi A., Lu L.J., Tanakov I., BiswalS.L., Hirasaki G.J. (2015) Adsorption of a switchable cationicsurfactant on natural carbonate minerals, SPE J. 70–78.https://doi.org/10.2118/169040-pa.
Curbelo F.D.S., Garnica A.I.C., Leite D.F.Q., Carvalho A.B.,Silva R.R., Paiva E.M. (2020) Study of Enhanced Oil Recoveryand Adsorption Using Glycerol in Surfactant Solution, Energies13, 3135. https://doi.org/10.3390/en13123135.
Curtis M.E., Ambrose R.J., Sondergeld C.H., Rai C.S. (2010)Structural characterization of gas shales on the micro- andnano-scales, in: Canadian Unconventional Resources andInternational Petroleum Conference, 19–21 October, Calgary,Alberta, Canada, Society of Petroleum Engineers, pp. 1933–1947. https://doi.org/10.2118/137693-ms.
Dang T.Q.C., Chen Z., Nguyen T.B.N., Bae W. (2014) Investi-gation of isotherm polymer adsorption in porous media, Pet. Sci.Technol. 32, 1626–1640. https://doi.org/10.1080/10916466.2010.547910.
I. Mohammed et al.: Oil & Gas Science and Technology – Rev. IFP Energies nouvelles 75, 77 (2020) 17

Dauben D.L., Menzie D.E. (1967) Flow of polymer solutionsthrough porous media, J. Pet. Technol. 19, 1065–1073.https://doi.org/10.2118/1688-PA.
Dawson R., Lantz R.B. (1972) Inaccessible pore volume inpolymer flooding, Soc. Pet. Eng. J. 12, 448–452. https://doi.org/10.2118/3522-PA.
de Boer J.H. (1953) The dynamical character of adsorption,Clarendon Press, Oxford.
Deem R.L., Ali S.M.F. (1968) Adsorption and Flow of MultipleTracers in Porous Media, J. Can. Pet. Technol. 7, 60–65.https://doi.org/10.2118/68-02-06.
Ding W., Liu X., Song L., Li Q., Zhu Q., Zhu H., Hu F., Luo Y.,Zhu L., Li H. (2015) An approach to estimate the position of theshear plane for colloidal particles in an electrophoresis experi-ment, Surf. Sci. 632, 50–59. https://doi.org/10.1016/j.susc.2014.08.024.
Dominguez J.G., Willhite G.P. (1977) Retention and flowcharacteristics of polymer solutions in porous media, Soc.Pet. Eng. J. 17, 111–121. https://doi.org/10.2118/5835-PA.
Dubinin M.M., Radushkevich L.V. (1947) Equation of thecharacteristic curve of activated charcoal, Proc. Acad. Sci.USSR Phys. Chem. Sect. 55, 331–337.
Fianu J., Gholinezhad J., Hassan M. (2019a) Comparison ofsingle, binary and temperature-dependent adsorption modelsbased on error function analysis, J. Oil Gas Petrochem. Sci. 2,77– 91. https://doi.org/10.30881/jogps.00027.
Fianu J., Gholinezhad J., Hassan M. (2019b) Application oftemperature-dependent adsorption models in material balancecalculations for unconventional gas reservoirs, Heliyon 5,e01721. https://doi.org/10.1016/j.heliyon.2019.e01721.
Flory P.J. (1953) Principles of polymer chemistry, Cornell Univer-sity Press. https://doi.org/10.1126/science.119.3095.555-a.
Freundlich H. (1909) Kapillarchemie, eine Darstellung derChemie der Kolloide und verwandter Gebiete, AkademischeVerlagsgesellschaft.
Fritz W., Schluender E.U. (1974) Simultaneous adsorptionequilibria of organic solutes in dilute aqueous solutions onactivated carbon, Chem. Eng. Sci. 29, 1279–1282. https://doi.org/10.1016/0009-2509(74)80128-4.
Gil A., Grange P. (1996) Application of the Dubinin-Radushkevich and Dubinin-Astakhov equations in the charac-terization of microporous solids, Colloids Surf. A Physicochem.Eng. Asp. 113, 39–50. https://doi.org/10.1016/0927-7757(96)81455-5.
Glover C.J., Puerto M.C., Maerker J.M., Sandvik E.L. (1979)Surfactant phase behavior and retention in porous media, Soc.Pet. Eng. AIME J. 19, 183–193.
Gogarty W.B. (1967) Mobility Control With Polymer Solu-tions, Soc. Pet. Eng. J. 7, 161–173. https://doi.org/10.2118/1566-b.
Grigg R.B., Mikhalin A.A. (2007) Effects of flow conditions andsurfactant availability on adsorption, in: Proceedings – SPEInternational Symposium on Oilfield Chemistry, pp. 450–456.https://doi.org/10.2523/106205-ms.
Gruesbeck C., Collins R.E. (1982) Entrainment and depositionof fine particles in porous media, Soc. Pet. Eng. J. 22,847–856. https://doi.org/10.2118/8430-PA.
Guggenheim E. (1966) Application of statistical mechanics,Clarendon Press/Clarendon University Press, London.
Guzman K.A.D., Finnegan M.P., Banfield J.F. (2006) Influenceof surface potential on aggregation and transport of titaniananoparticles, Environ. Sci. Technol. 40, 7688–7693. https://doi.org/10.1021/es060847g.
Hall F.E., Chunhe Z., Gasem K.A.M., Robinson R.L., Dan Y.(1994) Adsorption of pure methane, nitrogen, and carbondioxide and their binary mixtures on wet fruitland coal, in:SPE Eastern Regional Meeting, Society of Petroleum Engi-neers. https://doi.org/10.2118/29194-MS.
Halsey G. (1952) The Role of Surface Heterogeneity in Adsorp-tion, Adv. Catal. 4, 259–269. https://doi.org/10.1016/S0360-0564(08)60616-1.
Hematfar V., Maini B.B., Chen Z. (2013) Experimental inves-tigation of the impact of asphaltene adsorption on two phaseflow in porous media, SPE - Eur. Form. Damage Conf.Proceedings, EFDC 2, 947–956.
Hill A. (1910) The possible effects of the aggregation ofthe molecules of hæmoglobin on its dissociation curves,BibSonomy J. Physiol 40, i–vii.
Hirasaki G.J., Pope G.A. (1974) Analysis of factors influencingmobility and adsorption in the flow of polymer solutionthrough porous media, Soc. Pet. Eng. J. 14, 337–346. https://doi.org/10.2118/4026-PA.
Huan-Zhi Z., Yan-Qing H. (2010) Resource potential anddevelopment status of global shale, Gas Oil Forum 6, 53–59.
Huber U., Stoeckli F., Houriet J.P. (1978) A generalization of theDubinin-Radushkevich equation for the filling of heterogeneousmicropore systems in strongly activated carbons, J. ColloidInterface Sci. 67, 195–203. https://doi.org/10.1016/0021-9797(78)90002-4.
Hutson N.D., Yang R.T. (1997) Theoretical basis for theDubinin-Radushkevitch (D-R) adsorption isotherm equation,Adsorption 3, 189–195. https://doi.org/10.1007/BF01650130.
Idris M.N., Kadafur I.B. (2015) Experimental studies on selectednano-particles using infrared spectrometry, Analysis 1, 124–137.
Jennings R.R., Rogers J.H., West T.J. (1971) Factors influenc-ing mobility control by polymer solutions, J. Pet. Technol. 23,391–401. https://doi.org/10.2118/2867-PA.
Joekar-Niasar V., Schreyer L., Sedighi M., Icardi M., Huyghe J.(2019) Coupled processes in charged porous media: fromtheory to applications, Transp. Porous Media 32, 183–214.https://doi.org/10.1007/s11242-019-01257-3.
Ju B., Fan T. (2009) Experimental study and mathematicalmodel of nanoparticle transport in porous media, PowderTechnol. 192, 195–202. https://doi.org/10.1016/j.powtec.2008.12.017.
Ju B., Fan T., Li Z. (2012) Improving water injectivity andenhancing oil recovery by wettability control using nanopow-ders, J. Pet. Sci. Eng. 86–87, 206–216. https://doi.org/10.1016/j.petrol.2012.03.022.
Kapoor A., Ritter J.A., Yang R.T. (1989) On the Dubinin—Radushkevich equation for adsorption in microporous solids inthe Henry’s Law Region, Langmuir 5, 1118–1121. https://doi.org/10.1021/la00088a043.
Kapoor A., Yang R.T. (1989) Correlation of equilibrium adsorp-tion data of condensible vapours on porous adsorbents, GasSep. Purif. 3, 187–192. https://doi.org/10.1016/0950-4214(89)80004-0.
Khan A.R., Al-Waheab I.R., Al-Haddad A. (1996) A generalizedequation for adsorption isotherms for multi-componentorganic pollutants in dilute aqueous solution, Environ.Technol. (United Kingdom) 17, 13–23. https://doi.org/10.1080/09593331708616356.
Khormali A., Sharifov A.R., Torba D.I. (2018) Experimental andmodeling study of asphaltene adsorption onto the reservoirrocks, Pet. Sci. Technol. 36, 1482–1489. https://doi.org/10.1080/10916466.2018.1496116.
I. Mohammed et al.: Oil & Gas Science and Technology – Rev. IFP Energies nouvelles 75, 77 (2020)18

Krumrine P.H., Falcone J.S., Campbell T.C. (1982) Surfactantflooding – 2. The effect of alkaline additives on permeabilityand sweep efficiency, Soc. Pet. Eng. J. 22, 983–992. https://doi.org/10.2118/9811-PA.
Landes S.H. (1961) Refinements in adsorption processing, in:Fall Meeting of the Society of Petroleum Engineers of AIME,8–11 October, Dallas, Texas.
Langmuir I. (1918) The adsorption of gases on plane surfaces ofglass, mica and platinum, J. Am. Chem. Soc. 40, 1361–1403.https://doi.org/10.1021/ja02242a004.
Li S., Hadia N.J., Lau H.C., Torsæter O., Stubbs L.P., Ng Q.H.(2018) Silica nanoparticles suspension for enhanced oil recov-ery: Stability behavior and flow visualization, in: Soc. Pet.Eng. SPE Eur. Featur. 80th EAGE Conf. Exhib. 2018.https://doi.org/10.2118/190802-ms.
Li S., Torsæter O. (2015) Experimental Investigation of theinfluence of nanoparticles adsorption and transport on wetta-bility alteration for oil wet Berea sandstone, in: SPE MiddleEast Oil and Gas Show and Conference, MEOS, Proceedings,Society of Petroleum Engineers (SPE), pp. 229–244. https://doi.org/10.2118/172539-ms.
Li S., Torsæter O., Lau H.C., Hadia N.J., Stubbs L.P. (2019) Theimpact of nanoparticle adsorption on transport and wettabilityalteration in water-wet berea sandstone: An experimentalstudy, Front. Phys. 7, 74. https://doi.org/10.3389/fphy.2019.00074.
Liu Y., Grigg R.B., Svec R.K. (2006) Foam mobility andadsorption in carbonate core, Proc. – SPE Symp. Improv. OilRecover. 2, 737–744.
Lu X.C., Li F.C., Watson A.T. (1995) Adsorption measurementsin devonian shales, Fuel 74, 4, 599–603.
Lowell S., Shields J.E., Lowell S., Shields J.E. (1991) Adsorptionisotherms, in: Powder Surface Area and Porosity, Springer,Netherlands, pp. 11–13. https://doi.org/10.1007/978-94-015-7955-1_3.
Mannhardt K., Novosad J.J., Jha K.N.N. (1994) Adsorption offoam-forming surfactants in Berea sandstone, J. Can. Pet.Technol. 33. https://doi.org/10.2118/94-02-04.
Marshall R.J., Metzner A.B. (1967) Flow of viscoelastic fluidsthrough porous media, Ind. Eng. Chem. Fundam. 6, 393–400.https://doi.org/10.1021/i160023a012.
Masel R.I. (1996) Principles of adsorption and reaction on solidsurfaces, John Wiley & Sons Inc.
McMillan W.G., Teller E. (1951) The assumptions of the B.E.T.theory, J. Phys. Colloid Chem. 55, 17–20. https://doi.org/10.1021/j150484a003.
Metzner A.B. (1977) Polymer solution and fiber suspensionrheology and their relationship to turbulent drag reduction,Phys. Fluids 20, S145. https://doi.org/10.1063/1.861723.
Meyers K.O., Salter S.J. (1980) Effect of oil brine ratio onsurfactant adsorption from microemulsions, Society of Petro-leum Engineers of AIME, SPE.
Mirchi V., Saraji S., Goual L., Piri M. (2016) Experimentalinvestigation of surfactant flooding in shale oil reservoirs:Dynamic interfacial tension, adsorption, and wettability, in:Society of Petroleum Engineers – SPE/AAPG/SEG Uncon-ventional Resources Technology Conference, pp. 1–6. https://doi.org/10.15530/urtec-2014-1913287.
Mungan N. (1969) Rheology and adsorption of aqueous polymersolutions, J. Can. Pet. Technol. 8, 45–50.
Myers A.L., Prausnitz J.M. (1965) Thermodynamics of mixed-gasadsorption, AIChE J. 11, 121–127. https://doi.org/10.1002/aic.690110125.
Nitta T., Kuro-Oka M., Katayama T. (1984a) An adsorptionisotherm of multi-site occupancy model for heterogeneoussurface, J. Chem. Eng. Japan 17, 45–52. https://doi.org/10.1252/jcej.17.45.
Nitta T., Shigetomi T., Kuro-Oka M., Katayama T. (1984b) Anadsorption isotherm of multi-site occupancy model for homo-geneous surface, J. Chem. Eng. Japan 17, 39–45. https://doi.org/10.1252/jcej.17.39.
Ogunberu A.L., Asghari K. (2005) Water permeability reductionunder flow-induced polymer adsorption, J. Can. Pet. Technol.44, 56–61. https://doi.org/10.2118/05-11-06.
Ohshima H. (1994) A simple expression for Henry’s function forthe retardation effect in electrophoresis of spherical colloidalparticles, J. Colloid Interface Sci. 168, 1, 269–271. https://doi.org/10.1006/jcis.1994.1419.
Ozkan E., Raghavan R.S., Apaydin O.G. (2010) Modeling offluid transfer from shale matrix to fracture network, in SPEAnnual Technical Conference and Exhibition, Society ofPetroleum Engineers. https://doi.org/10.2118/134830-MS.
Radke C.J., Prausnitz J.M. (1972) Thermodynamics of multi-solute adsorption from dilute liquid solutions, AIChE J. 18,761–768. https://doi.org/10.1002/aic.690180417.
Raghavan R., Chin L.Y. (2004) Productivity changes in reser-voirs with stress-dependent permeability, SPE Reserv. Eval.Eng. 7, 308–315. https://doi.org/10.2118/88870-PA.
Ramirez W., Shuler P., Friedman F. (1980) Convection,dispersion, and adsorption of surfactants in porous media,Soc. Pet. Eng. J. 20, 9. https://doi.org/10.2118/7951-PA.
Rani S., Prusty B.K., Padmanabhan E., Pal S.K. (2019)Applicability of various adsorption isotherm models on adsorp-tion of methane and CO2 on Indian shales, Environ. Prog.Sustain. Energy 38, 13222. https://doi.org/10.1002/ep.13222.
Redlich O., Peterson D.L. (1959) A useful adsorption isotherm, J.Phys. Chem. 63, 1024. https://doi.org/10.1021/j150576a611.
Revil A., Schwaeger H., Cathles L.M., Manhardt P.D. (1999)Streaming potential in porous media: 2. Theory and applica-tion to geothermal systems, J. Geophys. Res. Solid Earth 104,20033–20048. https://doi.org/10.1029/1999jb900090.
Rexer T.F.T., Benham M.J., Aplin A.C., Thomas K.M. (2013)Methane adsorption on shale under simulated geologicaltemperature and pressure conditions, Energy Fuels 27,3099–3109. https://doi.org/10.1021/ef400381v.
Romanielo L.L., Arvelos S., Tavares F.W., Rajagopal K. (2014)A modified multi-site occupancy model: evaluation of azeotro-pelike behavior in adsorption, Adsorption 21, 3–16. https://doi.org/10.1007/s10450-014-9644-6.
Rowland F.W., Eirich F.R. (1966) Flow rates of polymersolutions through porous disks as a function of solute. I.method, J. Polym. Sci. Part A-1 Polym. Chem. 4, 2033–2040.https://doi.org/10.1002/pol.1966.150040901.
Ruthven D.M. (1984) Principles of adsorption & adsorptionprocesses, Wiley, New York.
Saadi R., Saadi Z., Fazaeli R., Fard N.E. (2015) Monolayer andmultilayer adsorption isotherm models for sorption fromaqueous media. Korean J. Chem. Eng. 32, 787–799. https://doi.org/10.1007/s11814-015-0053-7.
Savins J.G. (1969) Non-newtonian flow through porous media, Ind.Eng. Chem. 61, 18–47. https://doi.org/10.1021/ie50718a005.
Sepehri M., Moradi B., Emamzadeh A., Mohammadi A.H.(2019) Experimental study and numerical modeling forenhancing oil recovery from carbonate reservoirs by nanopar-ticle flooding, Oil Gas Sci. Technol. – Rev. IFP Energiesnouvelles 74, 5. https://doi.org/10.2516/ogst/2018080.
I. Mohammed et al.: Oil & Gas Science and Technology – Rev. IFP Energies nouvelles 75, 77 (2020) 19

ShamsiJazeyi H., Hirasaki G.J., Verduzco R. (2013) Sacrificialagent for reducing adsorption of anionic surfactants, in:Proceedings – SPE International Symposium on OilfieldChemistry, pp. 214–229. https://doi.org/10.2118/164061-ms.
Sheng J.J. (2011) Modern chemical enhanced oil recovery,Elsevier Inc. https://doi.org/10.1016/C2009-0-20241-8.
Sips R. (1948) On the structure of a catalyst surface, J. Chem.Phys. 16, 490–495. https://doi.org/10.1063/1.1746922.
Smith F.W. (1970) The behavior of partially hydrolyzedpolyacrylamide solutions in porous media, J. Pet. Technol.22, 148–156. https://doi.org/10.2118/2422-pa.
Sorbie K.S. (1991) Introduction to polymer flooding, in: Poly-mer-Improved Oil Recovery, Springer, Netherlands, pp. 1–5.https://doi.org/10.1007/978-94-011-3044-8_1.
Sullivan R.B., Rushing J.A., Bachman R.C., Settari A., ConwayM.W., Barree R.D. (2006) Evaluation of nonlinear fracturerelative permeabilities and their impact on waterfrac perfor-mance in tight gas sands, in: Proc. – SPE Int. Symp. Form.Damage Control 2006, 15–17 February, Lafayette, Louisiana,USA, pp. 731–738.
Suresh R., Kuznetsov O., Agrawal D., Darugar Q., Khabashesku V.(2018) Reduction of surfactant adsorption in porous mediausing silica nanoparticles, Proc. Annu. Offshore Technol. Conf.2, 984–992.
Suwanayuen S., Danner R.P. (1980a) Vacancy solution theory ofadsorption from gas mixtures, AIChE J. 26, 76–83. https://doi.org/10.1002/aic.690260113.
Suwanayuen S., Danner R.P. (1980b) A gas adsorption isothermequation based on vacancy solution theory, AIChE J. 26,68–76. https://doi.org/10.1002/aic.690260112.
Swenson H., Stadie N.P. (2019) Langmuir’s theory of adsorp-tion: A centennial review, Langmuir 35, 5409–5426. https://doi.org/10.1021/acs.langmuir.9b00154.
Szabo M.T. (1975) Laboratory investigations of factors influ-encing polymer flood performance, Soc. Pet. Eng. AIME J. 15,338–346. https://doi.org/10.2118/4669-PA.
Tabatabal A., Gonzalez M.V., Harwell J.H., Scamehorn J.F.(1993) Reducing surfactant adsorption in carbonate reser-voirs, SPE Reserv. Eng. 8, 117–122. https://doi.org/10.2118/24105-pa.
Tan J., Weniger P., Krooss B., Merkel A., Horsfield B., Zhang J.,Boreham C.J., Graas G.V., Tocher B.A. (2014) Shale gaspotential of the major marine shale formations in the upperYangtze platform, South China, Part II: methane sorptioncapacity, Fuel 129, 204–218.
Temkin M., Pyzhev V. (1940) Kinetics of ammonia synthesison promoted iron catalysts, Acta Physicochimica URSS 12,327–356.
Toth J. (1971) State equation of the solid gas interface layer,Acta Chim. (Academiae Sci) Hungaricae 69, 311–317.
Trogus F.J., Sophany T., Schechter R.S., Wade W.H. (1977)Static and dynamic adsorption of anionic and nonionicsurfactants, Soc. Pet. Eng. AIME J. 17, 337–344. https://doi.org/10.2118/6004-pa.
Tsau J.S., Syahputra A.E., Grigg R.B. (2000) Economicevaluation of surfactant adsorption in CO2 foam application,in: SPE/DOE Improved Oil Recovery Symposium, 3–5 April,Tulsa, Oklahoma. https://doi.org/10.2523/59365-ms.
Tumba J., Agi A., Gbadamosi A., Junin R., Abbas A.,Rajaei K., Gbonhinbor J. (2019) Lignin as a potential additivefor minimizing surfactant adsorption on clay minerals indifferent electrolyte concentration, in: Society of PetroleumEngineers – SPE Nigeria Annual International Conference
and Exhibition 2019, NAIC 2019, pp. 1–23. https://doi.org/10.2118/198713-MS.
Volmer M.A., Mahnert P. (1925) Solution of solid substances inliquid surfaces and the characteristics of layers thus produced,Z. Phys. Chem 115, 253.
Walton K.S., Sholl D.S. (2015) Predicting multicomponentadsorption: 50 years of the ideal adsorbed solution theory,AIChE J. 61, 2757–2762. https://doi.org/10.1002/aic.14878.
Wang J., Han M., Fuseni A.B., Cao D. (2015) Surfactantadsorption in Surfactant-Polymer flooding for carbonatereservoirs, in: SPE Middle East Oil and Gas Show andConference, MEOS Proceedings, pp. 1736–1746. https://doi.org/10.2118/172700-ms.
Wang W., Yuan B., Su Y., Wang K., Jiang M., Moghanloo R.G.,Rui Z. (2016a) Nanoparticles adsorption, straining anddetachment behavior and its effects on permeability ofBerea cores: Analytical model and lab experiments, in:Proceedings – SPE Annual Technical Conference andExhibition, Society of Petroleum Engineers (SPE). https://doi.org/10.2118/181285-ms.
Wang Y., Zhu Y., Liu S., Zhang R. (2016b) Methane adsorp-tion measurements and modeling for organic-rich marineshale samples, Fuel 172, 301–309. https://doi.org/10.1016/j.fuel.2015. 12.074.
Wang Z., Li Y., Guo P., Meng W. (2016c) Analyzing theadaption of different adsorption models for describing theshale gas adsorption law, Chem. Eng. Technol. 39, 1921–1932.https://doi.org/10.1002/ceat.201500617.
White J. (2012) Computational fluid dynamics modelling andexperimental study on a single silica gel type B, Model. Simul.Eng. 2012, 9. https://doi.org/10.1155/2012/598479.
Willhite G.P., Dominguez J.G. (1977) Mechanisms of polymerretention in porous media, in Improved Oil Recovery bySurfactant and Polymer Flooding, D.O. Shah, R.S. Schechter(eds), Academic Press Inc., pp. 511–554.
Xiao-Chun Lu, Li Fan-Chang, Watson A.T. (1995) Adsorptionstudies of natural gas storage in Devonian shales, SPE Form.Eval. 10, 109–113. https://doi.org/10.2118/26632-pa.
Yan B., Wang Y., Killough J.E. (2016) Beyond dual-porositymodeling for the simulation of complex flow mechanisms inshale reservoirs, Comput. Geosci. 20, 69–91. https://doi.org/10.1007/s10596-015-9548-x.
Yin G., Grigg R.B., Svec Y. (2009) Oil recovery and surfactantadsorption during CO2-foam flooding, Offshore Technol.Conf. Proc. 1, 106–119.
Yu J., An C., Mo D., Liu N., Lee R. (2012) Study of adsorptionand transportation behavior of nanoparticles in three differentporous media, Proc. - SPE Symp. Improv. Oil Recover. 1, pp.311–323.
Yu W., Sepehrnoori K., Patzek T.W. (2016) Modeling gasadsorption in marcellus shale with Langmuir and bet isotherms.SPE J. Soc. Pet. Eng. 589–600. https://doi.org/10.2118/170801-PA.
Zhang J., Tang Y., Chen D. (2019) Prediction of methaneadsorption content in continental coal-bearing shale reservoirusing SLD model, Pet. Sci. Technol. 37, 1839–1845. https://doi.org/10.1080/10916466.2019.1610773.
Zhang T. (2012) Modeling of nanoparticle transport in porousmedia. Transp. Porous Media 362.
Zhang T., Ellis G.S., Ruppel S.C., Milliken K., Yang R. (2012)Effect of organic-matter type and thermal maturity onmethane adsorption in shale-gas systems, Org. Geochem. 47,120–131.
I. Mohammed et al.: Oil & Gas Science and Technology – Rev. IFP Energies nouvelles 75, 77 (2020)20
Zhang T., Murphy M., Yu H., Bagaria H.G., Yoon K.Y., NielsonB.M., Bielawski C.W., Johnston K.P., Huh C., Bryant S.L.(2013) Investigation of nanoparticle adsorption during trans-port in porous media, in: Proceedings - SPE Annual TechnicalConference and Exhibition, Society of Petroleum Engineers3161–3180. https://doi.org/10.2118/166346-ms.
Zhang T., Murphy M.J., Yu H., Bagaria H.G., Yoon K.Y.,Neilson B.M., Bielawski C.W., Johnston K.P., Huh C., BryantS.L. (2015) Investigation of nanoparticle adsorption duringtransport in porous media, SPE J. 20, 667–677. https://doi.org/10.2118/166346-PA.
Zhong X., Pu H., Zhou Y., Zhao J.X. (2019) Static adsorption ofsurfactants on Bakken rock surfaces in high temperature, high
salinity conditions, in: Proceedings – SPE International Sym-posium on Oilfield Chemistry, pp. 1–10. https://doi.org/10.2118/193589-ms.
Zhou W., Dong M., Liu Q., Xiao H. (2005) Experimentalinvestigation of surfactant adsorption on sand and oil-waterinterface in heavy oil/water/sand systems, in: CanadianInternational Petroleum Conference, 7–9 June, Calgary,Alberta.
Zhou X., Han M., Fuseni A.B., Yousef A.A. (2012) Adsorption-desorption of an amphoteric surfactant onto permeablecarbonate rocks, SPE – DOE Improv. Oil Recover. Symp.Proc. 1, 552–572. https://doi.org/10.2118/153988-ms.
I. Mohammed et al.: Oil & Gas Science and Technology – Rev. IFP Energies nouvelles 75, 77 (2020) 21