a river basin perspective of water resources and challenges
TRANSCRIPT

IntroductionTh e surface water resources potential in India is esti-mated to be around 1,869 km3. Due to topographical constraints and spatio-temporal variations in resources, it is estimated that only about 1,123 km3, (690 km3 from surface water and 433 km3 from groundwater) (Central Water Commission [CWC] 2010), can be used. According to the Food and Agriculture Organiza-tion (FAO), United Nations, the per capita availability of less than 2,000 m3/year is defi ned as a water-stressed condition, and the per capita availability below 1,000 m3/year is termed as a water-scarce condition. Due to a 3-fold increase in population during 1951–2010, the per capita availability of water in the country as a whole decreased from 5,177 m3/year in 1951 to 1,588 m3/year in 2010 (CWC 2010). Th is suggests that at a macro level, India is in a water-stressed state. Th e story at the local/regional level is far starker. Increasing shortages are felt at local levels which can spread to the regional level as the population continues to grow. India is divided into 20 river basins. Out of these, 14 basins are in a water-stressed condition (of which 10 are water-stressed, Table 1.1). Th e disparity among river basins is wide. Th e Brahmaputra-Barak basin has a total water availability of 11,782 m3/per person. On the other hand in river basins, such as Sabarmati and east
A River Basin Perspective of Water Resources and Challenges
Anju Gaur and Priyanie Amerasinghe†
1
fl owing rivers (Pennar and Kanyakumari), the availabil-ity of water is as low as 260 m3 per person per year (Table 1.1). Th e stress on water resources (both surface and groundwater) is increasing rapidly due to rising demands of various users and the deteriorating quality of water. In many regions in India the extraction of groundwater is more than the recharge (Chapter 7). Th e pollution of water resources caused by discharge of untreated municipal sewage and industrial effl uents in rivers and the sea, and agro-chemicals penetration in groundwater has further exacerbated the availability of good quality water. In short, the country’s fragile resources are stressed and are depleting fast, both in quantity and quality. Preserving the quality of water and managing multiple demands on it require an integrated water management strategy. Th e problem, however, is that water is a state subject and its management is spread across multiple organizations with hardly any coordination. Th is has posed diffi culties in streamlining management issues. Another challenge in the management of water is that state boundaries do not coincide with the geographical boundary of the resource. Th ough the National Water Policy, 2002 recognizes that river basins should be the
† Th e authors are thankful to Jai Mansukhani for his help in preparing the database. Th e views expressed in this chapter are those of the authors alone and do not necessarily represent the offi cial position of the World Bank.

Tab
le 1
.1
Surfa
ce a
nd G
roun
dwat
er R
esou
rces
in R
iver
Bas
ins i
n In
dia
S.N
o.
Nam
e of t
he ri
ver b
asin
Po
pula
tion
Cat
chm
ent
Aver
age
Estim
ated
Es
timat
ed
Tota
l Su
rface
To
tal
Per c
apita
(mill
ion)
ar
ea (k
m2 )
annu
al
utili
zabl
e re
plen
ishab
le ut
iliza
ble
stora
ge
surfa
ce a
nd
wat
er
su
rface
wat
er
surfa
ce w
ater
gr
ound
wat
er
wat
er
pote
ntia
l, gr
ound
wat
er
avai
labl
e
po
tent
ial (
km3 )
(km
3 ) re
sour
ces (
km3 )
(km
3 ) (k
m3 )
stora
ge (k
m3 )
(201
0)
1
Indu
s (up
to th
e bo
rder
) 59
.01
321,
289
73.3
1 46
26
.49
72.4
9 19
.14
45.6
3 1,
242
2
Gan
ga
505.
54
861,
452
525.
02
250
170.
99
420.
99
94.3
5 26
5.34
1,
039
2.1
Brah
map
utra
, Bar
ak, o
ther
s 49
.71
236,
136
585.
6 24
35
.07
59.0
7 52
.94
88.0
1 11
,782
3 G
odav
ari
76.0
2 31
2,81
2 11
0.54
76
.3
40.6
5 11
6.95
41
.89
82.5
4 1,
454
4 K
rishn
a
85.6
2 25
8,94
8 78
.12
58
26.4
1 84
.41
49.6
1 76
.02
912
5 C
auve
ry
41.2
7 81
,155
21
.36
19
12.3
31
.3
12.9
6 25
.26
518
6 Su
bern
arek
ha
13.2
3 29
,200
12
.37
6.81
1.
82
8.63
3.
93
5.75
93
5
7 Br
aham
ani &
Bai
tarn
i 13
.80
39,0
33
28.4
8 18
.3
4.05
22
.35
13.7
2 17
.77
2,06
3
8 M
ahan
adi
37.4
5 14
1,58
9 66
.88
49.9
9 16
.46
66.4
5 26
.52
42.9
8 1,
786
9 Pe
nnar
13
.67
55,2
13
6.32
6.
86
4.93
11
.79
4.82
9.
75
462
10
Mah
i 14
.78
34,8
42
11.0
2 3.
1 4.
2 7.
3 5.
21
9.41
74
6
11
Saba
rmat
i 14
.80
21,6
74
3.81
1.
93
3 4.
93
1.56
4.
56
257
12
Nar
mad
a
20.7
0 98
,796
45
.64
34.5
10
.83
45.3
3 27
.14
37.9
7 2,
205
13
Tapi
20
.85
65,1
45
14.8
8 14
.5
8.27
22
.77
12.2
6 20
.53
714
14
Wes
t fl o
win
g riv
ers F
rom
36
.33
52,9
00
87.4
1 11
.94
8.7
20.6
4 16
.42
25.1
2 2,
406
Ta
pi to
Tad
ri
15
Wes
t fl o
win
g riv
ers F
rom
45
.91
56,2
00
113.
53
24.2
7 9
33.2
7 13
.81
22.8
1 2,
473
Ta
dri t
o K
anya
kum
ari
16
East
fl ow
ing
river
s bet
wee
n 33
.25
22
.52
13.1
1 9
22.1
1 4.
24
13.2
4 67
7
Mah
anad
i & P
enna
r
17
East
fl ow
ing
river
s bet
wee
n 63
.29
100,
100
16.4
6 16
.73
9.2
25.9
3 1.
38
10.5
8 26
0
Penn
ar a
nd K
anya
kum
ari
18
Wes
t fl o
win
g riv
ers o
f Kut
ch,
31.1
0 32
1,90
0 15
.1
14.9
8 11
.23
26.2
1 9.
59
20.8
2 48
6
Saur
asht
ra in
clud
ing
Luni
19
Area
of i
nlan
d dr
aina
ge in
60,0
00
0
Raj
asth
an d
eser
t
20
Min
or ri
ver b
asin
s dra
inin
g in
to
2.11
36
,300
31
18.8
18
.8
0.31
19
.11
14,6
79
Bang
lade
sh &
Mya
nmar
T
otal
3,18
4,68
4 1,
869
690
431
1,12
2 41
1.81
84
3.21
1,
588
Sour
ce: C
entr
al W
ater
Com
miss
ion
and
Cen
tral
Gro
und
Wat
er B
oard
.

A River Basin Perspective of Water Resources and Challenges 5
basic hydrological unit for integrated planning and development of water resources, this has not happened so far. Th is chapter presents an overview of the state of water resources in India. Th ough the strategies and policies to address various issues aff ecting the sector are discussed in later chapters, key strategic issues to bridge the gap between increasing demand and supply at the basin level are presented in this chapter.
Status of Water Resources Availability in IndiaTh e system of surface water resource in India comprises of 20 major river basins. Seven rivers and their tributaries
feed these river basins (Figure 1.1). Of these 20 river basins, 13 are large comprising an aggregate catchment area of 2.6 million square km (Table 1.1). Th ese 13 major river basins together are spread over about 81 per cent of the geographical area of the country. Th ere are, however, substantial challenges and variations that these river basins face in their water availability. Th ese river basins depend on precipitation for water. Rainfall being the major component of precipitation is highly seasonal as most of the rain is concentrated during the monsoon season which lasts over 4–5 months (June to September/October). Further, there are huge geographical variations in the rainfall across the country. Th e western parts of Rajasthan get merely
Figure 1.1 Major River Basins in India
Source: Adapted from CWC (2010).
Area of inlanddrainage in Rajasthan
WFR of Kucha & Saurashtraincluding Luni
WFR fromTapi to Tadri
Sabarmati
NarmadaMahi
Krishna
Tapi
Godavari
WFR fromTadri to Kanyakumari
Pennar
CauveryEFR between
Pennar & Kanyakumari
EFR betweenMahanadi & Pennar
Brahmani & Baitrani
Mahanadi
Subernarekha
Minor rivers draininginto Myanmar & Bangladesh
Barai
Brahmaputra
Ganga
Indus
Ladakah and not draining into Indus

6 India Infrastructure Report 2011
100 mm of rain during the year, while Cherrapunji in Meghalaya gets yearly rainfall of 11,000 mm. Hence, the annual average surface water that is available in the river basins varies a lot. Table 1.1 presents the estimated average annual surface water potential across various river basins. Th ere are huge variations in the extent of catch-ment areas of river basins and their surface water potential. Th e geographical coverage of the Ganga and Brahamputra-Barak river basins is the largest and covers about 34 per cent of the country served by all river basins. Th e Ganga and Brahamputra-Barak river basins account for 60 per cent of the average annual water resources potential. However, due to topographi-cal constraints and spatio-temporal variability of the availability of water only 48 per cent of the total water potential in the Ganga basin and 4 per cent of the total water potential in the Brahmaputra basin is utilized. On the other hand, three river basins in southern India (Godavari, Krishna, and Cauvery) together rep-resent 21 per cent area of the country area while they account for only 11 per cent of the surface water. Table 1.1 also presents information on basin-wise utilizable surface water. Th e utilizable surface water as a percentage of the total water resource poten-tial is far higher for southern river basins, such as Godavari, Krishna, Cauvery, Pennar, and east fl owing rivers between Pennar and Kanyakumari river basins, than others. In the Pennar, Kanyakumari, and Tapi river basins, nearly all the water resource potential is utilizable. However, there is huge potential to tap the water resource in other river basins.
Surface Water Development through Storage
In order to address spatial and temporal variations across river basins and to increase water availability, water storage capacities have been developed along the rivers to meet the demand for water throughout the year. Surface water storages are categorized as major (live storage >10 km3), medium (2–10 km3), and minor projects (or irrigation tanks with culturable command area <2,000 ha). Th e total live storage in major and medium projects is 221 km3 (from completed projects), which contributes 32 per cent to the total utilizable surface water. In addition, the storage capacity of 191 km3 is either under construction or is being considered for development. Estimated total storage capacity of
completed, ongoing, and contemplated projects, would be 412 km3 which will take the total utilizable surface water to 881 km3 from the present level of 690 km3 for all river basins taken together. Th e Krishna basin leads in terms of existing stor-age capacity (41.80 km3), followed by the Godavari (25.12 km3), and Narmada basins (16.98 km3). In the southern river basins, where availability of water resource is a problem, including Krishna, Godavari, Cauvery, and west fl owing rivers, water harvesting is prevalent through tanks. Indiscriminate increase in storage, however, aff ects the natural regenerative capac-ity of rivers. Certain amount of river fl ow is therefore necessary. In the Krishna basin, the surge in storage development since the 1960s resulted in a drastic reduction in river discharge and outfl ow into the sea from an average annual fl ow of 57.22 km3 during 1950–60 to 24.94 km3 during 1995–2005 (Gaur et al. 2007). Th e actual surface water usage during a normal year in the basin is 117 per cent of the storage capacity in the basin. Th e existing storage capacity in the west fl owing rivers of Kutch, Saurashtra including Luni, Narmad, Brahmani, and Baitarni exceeds 50 per cent of their respective average annual natural fl ows. As a consequence, the overall fl ows reaching the sea from these rivers have reduced drastically. On the other hand, water rich basins, such as Brahmaputra and Barak have very low storage capacity, just about 9 per cent of the annual natural fl ow. In terms of planned storage capacity, the southern river basin of Pennar, which faces immense water shortages, leads in terms of planned storage development followed by the Tapi basin. Th is additional storage will, however, reduce the average annual natural fl ow of rivers in these basins by more than 70 per cent. On the one hand while it is necessary to tap the river fl ow by increasing storage capacity, it is important to balance the new development of storage in a way that the regenerative capacity of the river is not aff ected.
Status of GroundwaterTh e potential groundwater resource has two compo-nents—static (10,812 km3) and dynamic reserves (433 km3). Although static reserves are high, they cannot be exploited except in an emergency as they are non-replenishable. Only the usage of dynamic reserves, which are replenished seasonally, is permitted (Ministry

A River Basin Perspective of Water Resources and Challenges 7
of Water Resources 2002). Th e zone of fl uctuation for the dynamic resource is about 450 m below the ground level in the alluvium soil aquifer in the Indo-Gangetic Valley, 100–150 m in the inland river basin, and 200 m in hard rock aquifers. Th e major source for dynamic recharge is rainfall, which contributes about 67 per cent of the recharge. Th e rest of the groundwater recharge happens from non-rainfall sources, such as leaky canals, tanks, and local water bodies (Central Ground Water Board 2004). Table 1.1 gives the estimated replenishable ground-water resource by river basins. Th ough a detailed discussion on groundwater is presented in Chapter 7, the key points that emerge from the distribution of groundwater across the country are discussed here. Nearly half of the replenishable groundwater resource is located in the Ganga-Brahmaputra-Barak river basins. Th e Indus river basin accounts for another 25 per cent of the replenishable groundwater resource. Of the total utilizable water, groundwater comprise about a third except in Ganga-Brahmaputra-Barak, where it is about 42 per cent, and in Subernarekha, Brahmani, Baitarni, Mahanadi, and Narmada where it is 25 per cent or less. Unlike the availability of surface water, which is highly seasonal, groundwater is a steady source of water throughout the year. Of the total storage of water that is available throughout the year (comprising surface water storage plus the replenishable groundwater resource), groundwater constitutes nearly 50 per cent, though there are inequalities across river basins. In the Ganga river basin, the share of groundwater in the total water storage is about 64 per cent. In basins like Krishna, Mahanadi, Subernarekha, and Narmada the share is 35 per cent or less.
Groundwater Resources Development
At the national level, the net annual groundwater draft is about 231 km3 which is 58 per cent of the dynamic reserves. Nearly 92 per cent of the groundwater draft is used for irrigation while the remaining is used for domestic and industrial use. Th e groundwater resource has been exploited to the extent that many regions in the country are facing severe problems (Chapter 7). Th e overexploitation of groundwater has resulted in a number of problems, such as sea water ingression in coastal areas and groundwater pollution in diff erent parts of the country.
Th e challenges for further development of ground-water systems are two-fold: (i) how to restrain ground-water use to sustainable levels in overexploited regions? and (ii) how to develop the large untapped groundwater potential, which exists in eastern India? Th e willing-ness to control the overexploitation of the groundwater resource by farmers by using effi cient irrigation systems has remained weak. Subsidized electricity supply in most regions has further exacerbated the overexploita-tion of groundwater.
Water Demand at the RiverBasin LevelTh e demand for water will grow from 656 km3 in 2010 to 1069 km3 by 2050 (Th atte et al. 2009). Irrigation is the largest consumer of water, which accounted for 85 per cent of the water demand in 2010 (Table 1.2), followed by domestic use (6 per cent), energy development (3 per cent), and industries (6 per cent). Th e demand for water from non-irrigation sectors will grow rapidly over the next 40 years. Th e demand for water in the domestic sector will grow 2.6 times, energy 3.7 times, and industry 2.2 times during 2010–50 (Th atte et al. 2009). Th e National Commission on Integrated Water Resources Development (NCIWRD) has estimated the multi-sector uses within basins (Table 1.3). Following the National Water Policy, 2002 criteria for allocation, priority was accorded to domestic use, followed by irrigation, industries, and other uses. For agriculture, NCIWRD assumed that the effi ciency of surface irriga-tion systems would increase to 60 per cent from the present level of 35–40 per cent. Th e estimates indicate that 9 out of the 20 river basins do not have suffi cient water for industry or other uses. Based on the avail-ability of water according to priority of use, river basins like Indus and Sabarmati did not have any residual water left for industrial and other uses even in 2010. Th e situation will be worse in 2050 when Ganga and the basin fed by the east fl owing rivers Mahanadi and Pennar will also face severe water availability problems. Estimates for 2010 indicate that at the basin level, d mestic water accounted for 9 to 46 per cent of the total water demand (based on Table 1.3). Even in water rich basins, such as the Barak, domestic water constitutes the major demand for water. Due to low storage capacity the availability for other uses cannot be enhanced. By

8 India Infrastructure Report 2011
Table 1.2 Available Water Resources in India and Demand Projections by 2025 and 2050
Water Resources Year 2010 2025 2050
Estimated annual precipitation (including snowfall) (km3) 4000
Average annual potential in rivers, (km3) 1869
Estimated utilizable water (km3) 1123 1379
Surface (km3) 690 910
Ground (km3) 433 469
Existing surface storage (km3) 214 412 412
Population (million) 1150 1394 1750
Per capita actual water availability (m3) 977 806 685
Per capita actual storage (m3) 186 296 235
Irrigated area SW (M ha) 87 139 175
Water demand † (km3)
Domestic 43 62 111
Irrigation 557 611 807
Industry 37 67 81
Energy 19 33 70
Total 656 773 1069
Water regeneration (Mega Litre/day) 45133 68123 132253
(km3) 16 25 48
Source: Central Water Commission, † Adapted from Th atte et al. (2009).
2050, domestic water will account for 12–55 per cent of the total water demand mainly due to an increase in population. Th ree more river basins of Ganga, Krishna, and Subernarekha will be added to the list of water scarce basins, taking the number of water-scarce basins to 12 by 2025. By 2050, the Indus basin may also become water-scarce while the Godavari basin may come closer to the water-scarce level. By 2050 the level of water demand will reach closer to the utilizable level. Harnessing all of the 690 km3 of utilizable surface water will be possible only if match-ing storage is built. As shown in Table 1.2, by 2025 the use of recycled water may be able to partially serve a basin’s water demand through water conservation schemes but that will add only a tiny component to the overall water availability. Adopting various mea-sures for exploring and tapping the remaining water
resources, in addition to innovative water conserva-tion and management techniques, would be necessary. Central Ground Water Board has estimated that it is possible to increase the groundwater availability by about 36 km3, by taking up rainwater harvesting and artifi cial recharge over an area of 45 M ha utilizing surplus monsoon run-off . Trans-basin transfer of water, if taken to the full extent could further increase the uti-lizable quantity by approximately 220 km3 (Planning Commission 2008).
Challenges for Water Resource Availability, Management, and SustainabilityTh ere are a number of externalities associated with the water resource that aff ect its availability, manage-ment, and sustainability. Externalities, such as fl oods

Tab
le 1
.3
Riv
er B
asin
-wise
Wat
er D
eman
d Pr
ojec
tions
for 2
010,
202
5, a
nd 2
050
S.N
o.
Rive
r bas
in
Tota
l of
Estim
ated
dem
and
for W
ater
in 2
010
(km
3 ) Ba
lanc
e ava
ilabl
e for
indu
stries
surfa
ce a
nd
an
d ot
her u
ses (k
m3 )
grou
ndw
ater
Ir
rigat
ion
Dom
estic
Tota
l Re
turn
N
et fo
r irr
igat
ion
2010
20
25
2050
reso
urce
s (km
3 )
Flow
†
and
Dom
.
1 In
dus
72.5
10
2.09
2.
83
104.
92
12.4
7 92
.45
–19.
95
–49.
5 –7
1.81
2 a)
Gan
ga
421
311.
99
22.1
9 33
4.18
48
.95
285.
23
135.
77
43.9
1 –2
4.25
2.1
b) B
rahm
aput
ra
50.5
5 12
.91
1.31
14
.22
2.34
11
.88
38.6
7 34
.87
32.0
7
2.2
Bara
k &
oth
ers
8.52
1.
61
1.42
3.
03
1.3
1.73
6.
79
6.44
5.
65
3 G
odav
ari
116.
9 34
.37
3.22
37
.59
6.01
31
.58
85.3
2 75
.2
67.7
2
4 K
rishn
a 84
.4
42.8
5 4.
28
47.1
3 7.
71
39.4
2 44
.98
32.3
2 22
.94
5 C
auve
ry
31.3
16
.13
1.98
18
.11
3.2
14.9
1 16
.39
11.5
9 8.
01
6 Su
barn
arek
ha
8.6
3.45
0.
61
4.06
0.
83
3.23
5.
37
4.31
3.
47
7 Br
aham
ani &
Bai
tarn
i 22
.35
7.15
0.
51
7.66
1.
12
6.54
15
.81
13.7
12
.11
8 M
ahan
adi
66.5
26
.32
1.52
27
.84
3.85
22
.99
43.5
1 34
.79
29.0
5
9 Pe
nnar
11
.83
5.81
0.
64
6.45
1.
09
5.36
6.
47
4.72
3.
33
10
Mah
i 7.
3 5.
07
0.62
5.
69
1 4.
69
2.61
1.
12
0.01
11
Saba
rmat
i 4.
9 7.
01
0.87
7.
88
1.4
6.48
-1
.58
-3.6
8 -5
.23
12
Nar
mad
a 45
.3
11.2
6 0.
83
12.0
9 1.
79
10.3
35
31
.69
29.2
4
13
Tapi
22
.77
3.89
1.
1 4.
99
1.27
3.
72
19.0
5 17
.86
16.9
6
14
Wes
t fl o
win
g riv
ers f
rom
Tap
i to
Tadr
i 20
.6
3.9
2.51
6.
41
2.4
4.01
16
.59
15.4
7 14
.25
15
Wes
t fl o
win
g riv
ers f
rom
33
.3
5.99
1.
94
7.93
2.
15
5.78
27
.52
25.6
7 24
.27
Ta
dri t
o K
anya
kum
ari
16
East
fl ow
ing
river
s bet
wee
n 22
.1
21.0
1 1.
43
22.4
4 3.
25
19.2
2.
9 –3
.26
-7.8
4
Mah
anad
i and
Pen
nar
17
East
fl ow
ing
river
s bet
wee
n 25
.7
24.2
1 3.
49
27.7
5.
21
22.4
9 3.
21
–4.0
1 -9
.35
Pe
nnar
and
Kan
yaku
mar
i
18
Wes
t fl o
win
g riv
ers o
f Kut
ch
26.2
22
.46
1.61
24
.07
3.53
20
.54
5.66
-1
.02
-6.1
5
and
Saur
asht
ra in
clud
ing
Luni
19
Area
of i
nlan
d dr
aina
ge in
Raj
asth
an
18
.27
0.68
18
.95
2.37
16
.58
–16.
58
–22.
04
–26.
52
20
Min
or ri
ver b
asin
s dra
inin
g in
to
18.8
0.
67
0.12
0.
79
0.16
0.
62
18.1
8 17
.98
17.8
2
Mya
nmar
(Bur
ma)
and
Ban
glad
esh
To
tal
1,12
1.42
68
8.42
55
.71
744.
13
113.
4 62
9.73
49
1.69
19
6.73
13
5.75
Sour
ce: †
Ada
pted
from
Th a
tte et
al. (
2009
) and
Pla
nnin
g C
omm
issio
n (2
007)
. Esti
mat
ed b
y th
e Nat
iona
l Com
miss
ion
for I
nteg
rate
d W
ater
Res
ourc
es D
evel
opm
ent (
NC
IWR
D).
Not
e: †
(80%
of d
omes
tic +
10%
of i
rrig
atio
n)

10 India Infrastructure Report 2011
and droughts caused by extreme climatic factors, aff ect the livelihood and economy of a region. Th e quality of water and trans-boundary issues have an impact on the availability of this resource for consumption.
Extreme Climate Factors: Flood and Drought
Floods and droughts aff ect vast areas of the country that transcend geographical boundaries of states. One-sixth of the geographical area of the country (about 40 M ha) is drought-prone. Similarly, fl oods aff ect around 7.5 M ha of land each year. Despite such an impact of these calamities, experience in managing their impact has been poor. Managing the impact of droughts as well as fl oods requires a system of data col-lection, transmission, forecasting, and dissemination through an early warning system. However, a majority of the fl ood warning systems in India are not timely, primarily due to poor transmission. Delays cause enor-mous damage to property and lives every year. More-over, models that are used for fl ood forecasting and its infl uence zones are not rigorous enough due to lack of integration of hydrology and the weather forecasting systems. Th e lead time for fl ood forecasting can be improved through the use of hydraulic and hydrologic models which are linked to the weather forecasting system, the real time data acquisition system, and the reservoir operation system. It is possible to improve the current forecasting methods by using satellite based information for better estimates of rainfall and snowmelt. Attempts are being made to modernize site-specifi c forecasting systems with satellite based telemetry, which will improve overall basin-wise forecasting.
Water Quality
Poor water quality will further strain the availability of freshwater for various uses. Th e quality of water has become a serious problem in river basins. About 70 per cent of the surface water resources and large propor-tions of groundwater reserves have been contaminated due to indiscriminate discharge of wastewater from the industry, agriculture, and households sectors which contain biological as well as toxic organic and inorganic pollutants. Water pollution across river basins varies in severity depending on the degree of urban development, agri-
cultural and industrial practices, and systems for collecting and treating wastewater. Th e Central Pollu-tion Control Board (CPCB) has identifi ed some of the polluted river stretches and possible sources of pollution (Table 1.4). Most of the polluted stretches of rivers are located in and around large urban areas. Municipal sewage contributes about 75 per cent and industrial pollution accounts for the rest of the point source pollution. Class-I and Class-II cities together generate an estimated 38,254 MLD of sewage (CPCB 2009). Th e treatment capacity of 11,787 MLD in 2009 was far behind the requirements. By 2050, the sewage generation from Class-I, II cities will increase by three-and-a-half times to 132,253 MLD, which will pose serious problems if concerted eff orts to add wastewater treatment capacity are not undertaken. Groundwater is also polluted due to point and non-point source pollution. In some areas, the groundwater is not of the desired quality due to geogenic elements. For example, occurrence of high fl uoride content has been reported in 13 states. Other pollutants, such as arsenic in West Bengal, and iron in the north-eastern states, Orissa, and other parts of the country have also been reported. In the canal irrigated land of Haryana, Punjab, Delhi, Rajasthan, Gujarat, Uttar Pradesh, Karnataka, and Tamil Nadu, groundwater is aff ected due to salinization (the aff ected area comprises over 193,000 km2 of land) (Th atte et al. 2009). Eff orts were made in the past to clean water resources through government intervention. Th e Ganga Action Plan implemented under the National River Conserva-tion Plan (NRCP—1995/96) covers pollution abate-ment activities in 34 rivers and 160 towns in 20 states. Major interventions under the plan include intercep-tion and diversion of sewage into networked channels, construction of sewage treatment plants (STPs), low cost sanitation works, and river front development activities. Pollution abatement plans have been adopted for some rivers for implementation through a designated authority for the purpose (for example, the National Ganga River Basin Authority in 2009), where holistic approaches are being utilized. Th ough other formal or informal authorities are being set up for river pollution abatement activities, synergy between regulatory and implementing authorities is necessary for future water development programmes.

A River Basin Perspective of Water Resources and Challenges 11
Trans-boundary Water Issues: International and Inter-state Scenarios
From a river basin perspective, water resource develop-ment and management has to address trans-boundary water allocation issues. Since water management is done through sector-wise administration by a number
of government entities spread over 11 Central minis-tries, state governments, and local bodies water politics, rights, and confl icts are commonplace (discussed in detail in Chapters 3 and 4). Hence, the political economy drives the water agenda nationally and inter-nationally.
Table 1.4 Pollution in Selected Stretches of Rivers Basins
S. No. Name of the river basin Polluted Stretch Existing Critical Possible Causes of Pollution Class* Parameters
1 Indus Satluj: Downstream of D/E BOD, DO Domestic from Ludhiana and (up to the border) Ludhiana to Harike Jalandhar, and industrial from hosieries, tanneries, electroplating, and engineering Satluj: Downstream D/E Ammonia Waste from fertilizer, cholarlkali of Nangal mills from Nangal
2 Ganga Chambal River: Downstream D/E BOD, DO Domestic and industrial of Nagda and Kota Gomti: Downstream of D/E BOD, DO, Domestic and industrial Lucknow Coliform from distilleries Hindon: Sahranpur to D DO, BOD, Domestic and industrial confl uence with Yamuna Toxicity Kali: Downstream of D/E BOD, Domestic and industrial Modinagar to confl uence Coliform with Ganga Yamuna: Delhi confl uence D/E Domestic and industrial waste with Chambal from Delhi, Mathura, and Agra
2.1 Brahmaputra, Downstream of Dhanbad D/E BOD, Industrial pollution from Barak, others Toxicity Dhanbad, Asansol, Haldia, and Brunpur
3 Godavari Downstream of Nasik, BOD Industrial waste from sugar Nanded industries, distilleries, and food processing industries
4 Krishna Karad to Sangli D/E BOD Industrial waste from sugar industries and distilleries
5 Subernarekha Hatia Dam to Bharagora D/E Ammonia Domestic and industrial from Ranchi and Jamshedpur
6 Sabarmati Starting from u/s of E BOD, DO, Domestic and industrial Ahmedabad to Vautha Coliform from Ahmedabad through Sabarmati Ashram
Source: Central Pollution Control Board and Jain et al. (2007).Notes: *As per CPCB ( http://cpcb.nic.in/data2005.php last accessed on 20 September 2011) the existing classes for water quality are A (good ) to E (very bad): • D is best suited for wildlife and fi sheries (pH 6.5–8.5, Dissolved Oxygen > 4 mg/l, Free Ammonia < 1.2) • E is best suited for irrigation and controlled waste disposal (pH 6–6.5, EC < 2250 Mmhos/cm, SAR < 26 Boron < 2 mg/l).

12 India Infrastructure Report 2011
Out of the 20 river basins, the two largest–the Indus and the Ganga-Brahmaputra-Barak basins are international river basins and the management of water resources is, therefore, driven by agreements or treaties between riparian countries. Th e remaining basins are mostly inter-state basins and a majority of them have commissions or boards to manage water issues. Accord-ing to the Indian Constitution, water is a state subject and the role of the centre is limited only to the extent of managing the water resource in case inter-state river water disputes arise (Th atte et al. 2009). It may seem that the states have absolute rights over rivers and lakes but the Indian Easement Act, 1882 allows other users to claim prescriptive rights to the waters if customary usage of water can be established for a period of 20 years or more (D’souza 2006). In that sense, there are multiple rights holders—states, sectors, individuals, and communities—who hold various types of water rights. Multiplicity of rights poses problems for an in-tegrated management of the water resource and hence its equitable availability. Rights related to water need an appropriate framework (this aspect has been discussed in Chapter 5) to reduce water confl icts between states, sectors, and people.
Programmes and Institutions Involvedin the Sector
Growing demand across competing sectors, increasing occurrence of droughts, declining water quality, ex-treme weather conditions, inter-state river disputes, and inadequate institutional reforms and enforcement are some of the problems that the water sector in India faces today. Th e major areas that need attention are: management of existing water assets (used for irrigation and water supply systems) and water resources together with water sector institutional reforms. Towards this end, the Government of India has initiated a number of programmes and projects in-cluding the Accelerated Irrigation Benefi ts Programme, Hydrology Projects II, setting up of a Water Quality Assessment Authority, Command Area Development and Water Management Programme, National Project for Repair, Renovation and Restoration of Water Bod-ies, Flood Management, and setting up of River Basin Organizations. In addition, water resources restructur-ing projects are on in Andhra Pradesh, Maharashtra, Rajasthan, Uttar Pradesh, Madhya Pradesh, and Tamil
Nadu which are aimed at modernizing irrigation systems. Th ese programmes aim at a dressing the infrastructure gaps that exist and managing the water resource to enhance its quantity, quality, and sustainability. Despite the conceptualization of a number of programmes, eff ective implementation has been chal-lenging due to diff erent priorities of implementing agencies, poor coordination among implementing departments, and low level of monitoring mechanisms. For example, from a functional point of view, the responsibility for ensuring adequate availability of water for agricultural use is divided among the Ministry of Water Resources (MoWR), which is responsible for major, medium, and minor irrigation programmes, the Department of Land Resources which is responsible for watershed management, the Department of Rural Development which is responsible for the Mahatma Gandhi National Rural Employment Guarantee Act (MGNREGA) which deals with water conservation issues, and the Department of Agriculture which addresses issues associated with water use effi ciency (Figure 1.2). Requirements of rural drinking water, which are largely met through groundwater sources, are in the functional domain of the Department of Drinking Water Supply (DDWS) within the Ministry of Rural Development (MoRD). Th e development and management of groundwater involves other players and schemes that lie outside the purview of DDWS. Similarly, in the urban context, the Ministry of Urban Development (MoUD), states and its various depart-ments and urban local bodies (ULBs), are involved in the supply of water within cities. In order to make these institutional arrangements eff ective, proper planning, convergence of various agencies, site-specifi c design, and monitoring using modern techniques, such as remote sensing have to be in place. Given that water availability in India will be under tremendous stress in the future and many river basins will face severe water shortages rising demand and the deteriorating quality of water needs policies and strategies that manage the resource holistically.
Policies and StrategiesWhile the policies and strategies for the water sector and the institutional arrangements to deliver them have been discussed at length in various chapters in this

A River Basin Perspective of Water Resources and Challenges 13
Catchment
Forest ManagementDepartment of Forest
and Environment
Rainfed management, watershed developmentDepartment of Agriculture, Rural Development,
Land Resources
Reservoir
Reservoir operation andirrigation service delivery
Water Res. Dept.
Department of TourismDepartment Fisheries
Hydropower & thermalpower generation
Electricity Department
Water Supply
Domestic water Supplyand Sanitation
Rural development, Urban Dept.
IndustriesIndustrial Department
Irrigation SystemWater Res. Dept., &
Water users associations
On Farm Water Management
Water use efficiencyIrrigation Department,
Command areaDevelopment Authority,
Department of Agriculture
Wells and pumpinstallation Irrigation,
Agriculturaldepartmentsand private
Maintenance of smallwater bodies and channels
Rural Development throughlocal bodies Panchayat
(MGNREGA programme), etc.
Recharge structuresDept. of
AgriculturalRural (local
organizations), NGOs
Recyled Water
Wastewater treatmentUrban, Industrial Dept.
Reuse of recycled water Industries,farmers, local organizations
Environmental flowsMinistry of Environment
Central AgenciesIndian Meteorological Department, Ministry of Water Resources (Central Water Commission,
Central Groundwater Board), Central Pollution Control Board, Department of Space
Figure 1.2 Existing Multi-disciplinary Approach for Water Resource Management in A River Basin
Source: Authors’ own.
volume, a brief review of select policies and strategies is presented here.
Integrated Water Resources Management and River Basin Organization
In order to cater to multi-sectoral water demands and an optimum and judicious utilization of the available land and water resource, integrated water resource management (IWRM) is necessary. A basin authority, such as a river basin organization (RBO) is best suited to implement the principles of IWRM and for
planning inter-state water allocation. Th e functions of an RBO should include assessing water availability, preparing comprehensive plans for the operational development of surface and groundwater systems, and promoting measures for prevention of water logging, water conservation, and ensuring water quality. Th e need for RBOs for inter-state water allocation and decision-making has been extensively discussed at the government, non-government, and political levels in the country. However, with the exception of the Brahmaputra and Barak Board and the Betwa River

14 India Infrastructure Report 2011
Box 1.1Th e Brahmaputra Board
Th e Brahmaputra-Barak Basin• One of the largest rivers in the world with a specifi c yield of 85 ha m/km2 or 850 millimetre next to the Amazon river
(87 ha m/km2 or 870 millimetre). • Th e basin extends over an area of 592,000 km2 and falls in Tibet, India, Bhutan, Bangladesh, and Myanmar. • Th e seven riparian states are Arunachal Pradesh, Assam, Meghalaya, Manipur Mizoram, Nagaland, and Tripura.• Th e system serves a population of 50 million in India. • Out of the total water potential of 585 km3 within India, only 42 km3 is available for benefi cial use due to topographical
constraints.• Due to high yield, the basin is highly prone to fl oods with very low storage capacity of 2.3 km3. Almost 50 km3 of storage
is under construction or consideration for development. • In 1980, the Brahmaputra Board was set up under the Brahmaputra Board Act, 1980 to prepare a master plan for the
control of fl oods in the Brahmaputra Valley giving due regard to the overall development and utilization of the water resources.
• Institutions involved in the Brahmaputra Barak Basin are the board, state representatives, the Central Water Commission, Central Electrical Authority, Geological Survey of India, and the Indian Meteorological Department.
Main FunctionsTh e Board became eff ective in 1982. Its main functions are:• Preparing a plan for fl ood control and utilization of water resources for various uses.• Preparing a detailed report and estimates for proposed projects.• Construction, maintenance, and operation of multi-purpose projects with the approval of the central government.
Source: Brahmaputra Board. Available at: http://brahmaputraboard.gov.in/organisation.htm
Board, such basin authorities have not been realized. Th ese boards were set up by the MoWR in 1980 for planning and for the integrated implementation of measures for the control of fl oods and bank erosion in the Brahmaputra Valley.1 A few basin authorities, such as the Narmada Control Authority and the Upper Yamuna River Board are involved in the operation of the water system, but are not considered full-fl edged basin authorities. While the Brahmaputra and Barak boards have comprehensive functions encompassing a whole range of inter-state and basin management functions, other river basin authorities, such as the Narmada Control Authority have limited functions relating only to the construction of a project. Th ese boards were set up at the initiative of MoWR with not much support from states causing ineffi ciencies in their operations. If such boards are created with the support of the state, their functions will become more eff ective (see Box 1.1 for details about the Brahmaputra Board).
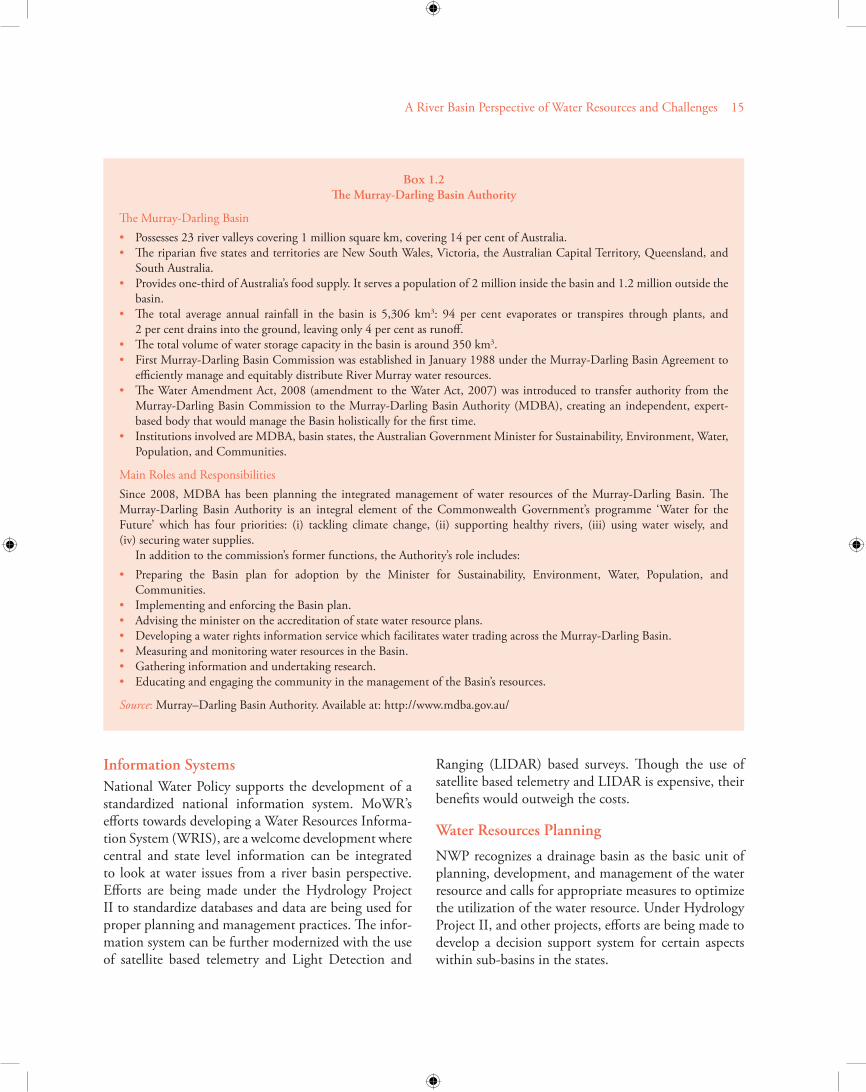
Recently, the Krishna Water Distribution Tribunal II suggested that a Krishna Basin Authority should be created along the lines of the Murray-Darling Basin Authority in Australia for the integrated management of the water resource (see Box 1.2).2 Th e authority is proposed to be constituted by the Government of India and will be headed by a panel of experts repre-senting environment, irrigation, agriculture, ground-water, geology, health, and ecology to protect the river basin area for its long-term sustainable productivity and ecology.
National Water Policy
Th e National Water Policy (NWP) was fi rst formulated and adopted in September 1987 and later updated in 2002. It covers a comprehensive plan for India, and if adopted at a basin level, it can add value to water development programmes. We now discuss some of the highlights of this policy.
1 Brahmaputra Board. Available at: http://brahmaputraboard.gov.in/organisation.htm last accessed on 20 September 2011. 2 Murray–Darling Basin Authority. Available at: http://www.mdba.gov.au/last accessed on 20 September 2011.
A River Basin Perspective of Water Resources and Challenges 15
Information Systems
National Water Policy supports the development of a standardized national information system. MoWR’s eff orts towards developing a Water Resources Informa-tion System (WRIS), are a welcome development where central and state level information can be integrated to look at water issues from a river basin perspective. Eff orts are being made under the Hydrology Project II to standardize databases and data are being used for proper planning and management practices. Th e infor-mation system can be further modernized with the use of satellite based telemetry and Light Detection and
Ranging (LIDAR) based surveys. Th ough the use of satellite based telemetry and LIDAR is expensive, their benefi ts would outweigh the costs.
Water Resources Planning
NWP recognizes a drainage basin as the basic unit of planning, development, and management of the water resource and calls for appropriate measures to optimize the utilization of the water resource. Under Hydrology Project II, and other projects, eff orts are being made to develop a decision support system for certain aspects within sub-basins in the states.
Box 1.2Th e Murray-Darling Basin Authority
Th e Murray-Darling Basin • Possesses 23 river valleys covering 1 million square km, covering 14 per cent of Australia.• Th e riparian fi ve states and territories are New South Wales, Victoria, the Australian Capital Territory, Queensland, and
South Australia.• Provides one-third of Australia’s food supply. It serves a population of 2 million inside the basin and 1.2 million outside the
basin. • Th e total average annual rainfall in the basin is 5,306 km3: 94 per cent evaporates or transpires through plants, and
2 per cent drains into the ground, leaving only 4 per cent as runoff . • Th e total volume of water storage capacity in the basin is around 350 km3.• First Murray-Darling Basin Commission was established in January 1988 under the Murray-Darling Basin Agreement to
effi ciently manage and equitably distribute River Murray water resources. • Th e Water Amendment Act, 2008 (amendment to the Water Act, 2007) was introduced to transfer authority from the
Murray-Darling Basin Commission to the Murray-Darling Basin Authority (MDBA), creating an independent, expert-based body that would manage the Basin holistically for the fi rst time.
• Institutions involved are MDBA, basin states, the Australian Government Minister for Sustainability, Environment, Water, Population, and Communities.
Main Roles and ResponsibilitiesSince 2008, MDBA has been planning the integrated management of water resources of the Murray-Darling Basin. Th e Murray-Darling Basin Authority is an integral element of the Commonwealth Government’s programme ‘Water for the Future’ which has four priorities: (i) tackling climate change, (ii) supporting healthy rivers, (iii) using water wisely, and (iv) securing water supplies. In addition to the commission’s former functions, the Authority’s role includes:• Preparing the Basin plan for adoption by the Minister for Sustainability, Environment, Water, Population, and
Communities.• Implementing and enforcing the Basin plan. • Advising the minister on the accreditation of state water resource plans. • Developing a water rights information service which facilitates water trading across the Murray-Darling Basin. • Measuring and monitoring water resources in the Basin. • Gathering information and undertaking research. • Educating and engaging the community in the management of the Basin’s resources.
Source: Murray–Darling Basin Authority. Available at: http://www.mdba.gov.au/

16 India Infrastructure Report 2011
Groundwater Development
Th e development of groundwater is aff ected by policies and strategies from multiple sectors, including power and agriculture. Improved access to electricity in the eastern parts of India and incentives that have moti-vated head enders in canal irrigated area to use ground-water in place of canal water have contributed to substantial groundwater development, leading to over-exploitation of groundwater in many regions. Some states, such as Gujarat, are implementing regulations to counter the overexploitation of groundwater. A typical way by which overexploitation is addressed is by constructing groundwater recharge structures. However, this strategy needs careful evaluation. If overexploited areas in the upstream are supplemented with recharge structures, it may aff ect water availability (even for priority use, such as drinking) in the down-stream projects. In closed or water-stressed river basins, water recharge structures should be implemented only after a proper analysis of the upstream and downstream implications and their eff ectiveness, particularly in southern India where infi ltration potential for ground-water recharge is low.
Participatory Approaches to Water Resources Management
NWP recognizes the need for legal and institutional changes at various levels and participatory water re-source management. Some reforms like establishing water users associations (WUAs) have been undertaken but their outcomes appear to be highly variable across the states (see Chapter 9). WUAs will need to be further strengthened and empowered. Th is may even require changes in the legislature. Currently, a majority of water-related schemes are introduced through gram panchayats and not WUAs. Clarity of roles and respon-sibilities between these two local bodies will strengthen implementation processes. Apart from WUAs for canal irrigation, water user groups of water bodies, such as tanks and groundwater also need appropriate policy frameworks for a more holistic management of water development processes within the basins.
Irrigation Projects
Managing irrigation water is necessary to conserve water in a sector that constitutes 85 per cent of the water demand and a large part of this demand is due
to ineffi cient use. Th ere are good examples of well-run irrigation projects. A case in point is the Parambikulam-Aliyar Project (PAP) in Tamil Nadu. Th is project has a planned operation system which encompasses a system of rotation of alternate canal system for alternate seasons, with opportunities for conjunctive use, fi xed schedule, a gravity-based pipe conveyance system, and a drip irrigation system.
Water Quality
Water quality has become a major concern from a river basin perspective as upstream pollution has a downstream impact. Greater emphasis on the use of clean technologies and adopting context-specifi c technological options at diff erent points along the waste streams is the way forward. In order to achieve this, from a regulation perspective, economic instruments (taxes and incentives), which are aimed at resource conservation, waste minimization, and reuse of wastes, would be necessary.
Monitoring of Projects
Ongoing and outcome monitoring is the key to mea-suring the success of projects and should be empha-sized in all water development programmes. Modern technologies, such as management information systems to monitor the progress in implementation, mobile based technology, a global positioning system (GPS) based cameras, and satellite based imageries should be promoted to monitor the impact on land use. Th e reliability of data and quick assessment ability can help in good decision-making which is based on evidence.
Private Sector Participation
Although public-private partnerships (PPPs) for developing the water resource have been promulgated, the outcomes have not been as expected. Th is may be due to the fact that irrigation projects require large capital investments and given the low water charges, these may not appeal to a private investor (discussed in Chapter 14). An approach for promoting PPPs could be initiating collaboration by outsourcing services, such as irrigation system operations and maintenance, implementing effi cient water management techniques, and agricultural extension projects with agreed output criteria for improved effi ciency of the systems that clearly defi ne irrigated areas and crop productivity.

A River Basin Perspective of Water Resources and Challenges 17
Th ese projects could be of a small size. An appropriate unit for the size is the command area, which can be easily monitored.
Research and Development
Research and development off ers an array of tools and techniques for water resource modelling on a basin scale (discussed in Chapter 2). Opportunities that are available for developing models suitable for India with national and international collaboration should be explored as sophisticated modelling at a hydro-logical unit is necessary for integrated water resource management.
ConclusionGiven that India is likely to face severe water shortages in the future, measures to tap the water resource with prudent conservation measures will be required. Water shortages are likely to be exacerbated in some basins more than in the others due to pressures of demand, inadequate storage, deteriorating water quality, and rising disputes in inter-state water allocation. Integrated water management strategies that look at water in a holistic manner are required. In its pres-ent state of governance, water is managed by various
local, state, and central agencies. It is necessary to re-look at the management of this vital resource. Th e natural boundary of surface water is its hydrological boundary—the river basin. Th ere are tremendous opportunities for improving water availability and se-curity from a basin perspective, provided the resource is managed in a holistic and integrated manner at this level. To achieve integrated water resource manage-ment, administrative set ups, such RBOs consisting of multi-disciplinary units, are required for planning and implementation. Th e National Water Policy, 2002 encompasses vital initiatives for water resource management. However, their implementation requires strategic innovations to meet future demands. Modern-izing information systems, having innovative resource planning, implementation, and monitoring of strate-gies, and focused evaluation systems using modern and advanced techniques supplemented by effi cient governance mechanisms are the way forward. River basin level water development strategies will require revisiting policies and politics that aff ect the use of water which are sectoral. Th e sectoral nature of water use creates strategy silos such as energy, agriculture, remote sensing centres, and environment without giv-ing due consideration to their inter-linkages.
References
Central Ground Water Board (2004), Dynamic Groundwater Resources of India, Ministry of Water Resources, Govern-ment of India, New Delhi.
Central Water Commission [CWC] (2010), ‘Preliminary Consolidated Report on Eff ect of Climate Change on Water Resources’, Government of India, available at: http://cwc.gov.in/main/downloads/Preliminary_Report_fi nal.pdf last accessed on 20 September 2011.
———— (2010), ‘Water and Related Statistics’, Government of India, available at http://cwc.gov.in/main/downloads/ last accessed on 20 September 2011.
Central Pollution Control Board [CPCB] (2009), d‘Status of Waste Supply, Wastewater
Generation, and Treatment in Class I Cities and Class II Towns of India’, available at http://www.cpcb.nic.in/oldwebsite/Newsper cent20Letters/Latest/sewagepollu-tion.html last accessed in August 2010.
D’souza, R. (2006), Interstate Disputes over Krishna Waters: Law, Science and Imperialism’, Orient Longman, Hyderabad.
Gaur A., P.G. McCornick. H. Turral, and S. Acharya (2007), ‘Implications of Drought and Water Regulation in the Krishna Basin, India’, International Journal of Water Resources Development, Vol. 23, No. 4, pp. 583–94.
Jain S.K., P.K. Agarwal, and V.P. Singh (2007), Hydrology and Water Resources of India. Springer.
Ministry of Water Resources (2002), National Water Policy 2002, Ministry of Water Resources, Government of India, New Delhi, 1 April.
Planning Commission (2008), Eleventh Five Year Plan (2007–12): Inclusive Growth, Vols 1–3. Planning Com-mission, Oxford University Press, New Delhi.
———— (2007), Report of the Steering Committee on Water resources for Eleventh Five Year Plan (2007–2012), Planning Commission, Government of India, New Delhi.
Th atte, C.D., A.C. Gupta, and M.L. Baweja (2009), Water Resources Development in India, Indian National Com-mittee on Irrigation and Drainage, New Delhi.