a scalable approach for statistical learning in …tresp/papers/swj252_1.pdf · a scalable approach...
TRANSCRIPT

Semantic Web 1 (2011) 1–5 1IOS Press
A Scalable Approach for Statistical Learningin Semantic GraphsEditor(s): Claudia d’AmatoOpen review(s): Paulo Cesar G. Costa, George Mason University, US; Joaquin Vanschoren, Leiden University, Netherlands; Lorand Dali, JozefStefan Institute, Slovenia
Yi Huang a,∗, Volker Tresp a,b, Maximilian Nickel b, Achim Rettinger c and Hans-Peter Kriegel ba Corporate Technology, Siemens AG, Otto-Hahn-Ring 6, 81739 Munich, GermanyE-mail: {yihuang,volker.tresp}@siemens.comb Department of Computer Science, Ludwig Maximilian University, Oettingenstraße 67, 80538 Munich, GermanyE-mail: {nickel,kriegel}@dbs.ifi.lmu.dec Karlsruhe Institute of Technology, Kaiserstraße 12, 76131 Karlsruhe, GermanyE-mail: [email protected]
Abstract.Increasingly, data is published in the form of semantic graphs. The most notable example is the Linked Open Data (LOD)
initiative where an increasing number of data sources are published in the Semantic Web’s Resource Description Framework andwhere the various data sources are linked to reference one another. In this paper we apply machine learning to semantic graphdata and argue that scalability and robustness can be achieved via an urn-based statistical sampling scheme. We apply the urnmodel to the SUNS framework which is based on multivariate prediction. We argue that multivariate prediction approaches aremost suitable for dealing with the resulting high-dimensional sparse data matrix. Within the statistical framework, the approachscales up to large domains and is able to deal with highly sparse relationship data. We summarize experimental results using afriend-of-a-friend data set and a data set derived from DBpedia. In more detail, we describe novel experiments on disease geneprioritization using LOD data sources. The experiments confirm the ease-of-use, the scalability and the good performance of theapproach.
Keywords: Statistical Machine Learning, Linked Open Data, Semantic Web, Statistical Relational Learning, Linked Life Data
1. Introduction
Increasingly, data is published in the form of seman-tic graphs. The most notable example is the LinkedOpen data (LOD)[1] initiative where an increasingnumber of data sources are published in the Seman-tic Web’s Resource Description Framework (RDF) [2]and where the various data sources are linked to refer-ence one another. LOD forms a huge semantic graphwith links from subject nodes to object nodes. Infor-mation access is enabled via query languages such
*Corresponding author. E-mail: [email protected]
as SPARQL —potentially enriched with reasoning—, retrieval and search. LOD is potentially also a greatsource for machine learning applications, which is thetopic of this paper. In particular we focus on Statis-tical Relational learning (SRL) which is able to ex-ploit statistical patterns in interlinked domains. Thisis in contrast to regular machine learning, which ex-ploits patterns in attribute-based representations, andto Inductive Logic Programming (ILP), which con-cerns machine learning in interconnected determinis-tic, or close-to-deterministic, domains. We argue thatLOD has particular properties that should be takeninto account in SRL. Most importantly, LOD is typ-
1570-0844/11/$27.50 c© 2011 – IOS Press and the authors. All rights reserved

2 Y. Huang et al. / Statistical Learning in Semantic Graphs
ically not collected systematically as the data origi-nates from different sources and is also incomplete inmany cases. This is true, in particular, for relationshipsacross different data sources: the referencing betweendata sources is typically sparse and incomplete. Thusin our work we have a preference for approaches thatcan deal with the sparsity of the data, the incomplete-ness of the data, and which scale well with the growingsize of LOD. An approach fulfilling these requirementsis the SUNS1 approach, which has been introduced ina series of papers [3,4,5] and is readily applicable toLOD data. Here we review the SUNS approach anddescribe applications to different LOD domains. Wealso show how ontological background knowledge canbe integrated into SUNS and how learned informationcan be integrated into an extended SPARQL languagefor querying. A novel contribution of this paper is adetailed description of the application of the SUNSmodel to Linked Life Data (LLD) [6], which is a cu-rated subset of LOD with a focus on life science data.
In the next section, we review related work. In Sec-tion 3 we discuss machine learning in the context ofLOD and define a setting with a clear statistical in-terpretation. In Section 4 we describe the learning ap-proach. The following sections are concerned with ex-periments using LOD. In Section 5 we discuss the ap-plication of the SUNS model to social network datafrom LOD and illustrate how learned results can bequeried using an extended SPARQL query. In Sec-tion 6 we apply our approach to LOD’s DBpedia data.Here, we demonstrate how ontological backgroundknowledge can be integrated into learning. Section 7discusses the application to LLD where the task is topredict new gene disease relationships from known re-lationships. Section 8 presents our conclusions.
2. Related Work and Some Background
2.1. Related Learning Approaches
In [7] the authors describe SPARQL-ML, a frame-work for adding data mining support to SPARQL.SPARQL-ML was inspired by Microsoft’s Data Min-ing Extension (DMX). A particular ontology for spec-ifying the machine learning experiment is developed.The approach uses Relational Bayes Classifier (RBC)and Relational Probabilistic Trees (RPT).
1SUNS stands for Statistical Units Node Set.
The work on inductive databases [8] also considersrelational representations but is focused on the bettercurated data situation in relational databases.
Bayesian approaches (examples that are suitable forthe relational domains are [9,10,11,12]) are quite flex-ible and interpretable and provide a probability distri-bution over a relational domain (see Section 3.2). Ex-periments on LOD data are still quite limited [13].
Inductive logic Programming (ILP) considers deter-ministic or close-to-deterministic dependencies. Typ-ical examples are many ILP approaches [14,15] andpropositionalized ILP approaches [16,17]. [18] de-scribes a perspective of ILP for the Semantic Web.
Multivariate prediction generalizes supervised learn-ing to predict several variables jointly, conditioned onsome inputs. The improved predictive performance inmultivariate prediction, if compared to simple super-vised learning, has been attributed to the sharing of sta-tistical strength between the multiple tasks, i.e., data isused more efficiently (see [19] and citations therein fora review). Due to the large degree of sparsity of the re-lationship data in typical semantic graph domains, weexpect that multivariate prediction is quite interestingand we apply it in this paper.
Recently, there has been quite some work on the re-lationship between kernels and graphs [20,21,22,23].Relation prediction on graphs is quite related to semi-supervised learning as surveyed in [24] where the goalis to predict node labels based on known node la-bels in a graph. Kernels for semi-supervised learninghave, for example, been derived from the spectrum ofthe Graph-Laplacian. In [25,26] approaches for Gaus-sian process based link prediction have been presented.Link prediction in relational graphs has also been cov-ered from the relational learning and the ILP com-munities [27,28,29]. Kernels for semantically rich do-mains have been developed by [30]. Link predictionis covered and surveyed in [31,32]. Inclusion of onto-logical prior knowledge to relational learning has beendiscussed in [33].
In last years, tensor factorization based approacheshave been also applied to relational learning. [34] in-troduces the Bayesian Clustered Tensor Factorization(BCTF) and applies it to various smaller relationaldata sets. TripleRank [35] applies the CP [36] tensordecomposition to RDF graphs for faceted browsing.A scalable tensor factorization approach to relationallearning, RESCAL, proposed in [37], performs collec-tive learning and can be applied to classification andentity resolution problems. Very recently, it has beenused to factor the YAGO2 ontology [38].

Y. Huang et al. / Statistical Learning in Semantic Graphs 3
From early on there has been considerable work onsupporting ontologies using machine learning [39,40,41], while data mining perspectives for the SemanticWeb have been described by [42,43]. [44] provides asurvey of the statistical learning models and relatedtechniques for Semantic Web data representations.
2.2. Related Work on Disease Gene Prioritization
Kann [45] provides an up-to-date review on the lat-est advances in the field of translational bioinformat-ics, focusing on the advances of computational tech-niques to search for and classify disease genes.
Certain gene properties differentiate disease genesand have been used as the basis for computationaltools to prioritize disease gene candidates derived fromthese experiments. All of the current approaches arebased on the integration of different sources such as:gene function (disease genes are expected to sharecommon functional properties), pathways (diseasegenes are most likely to share common pathways),gene expression (disease genes are expected to be co-expressed), gene regulation (genes within the samegene-regulation network are expected to affect similardiseases), sequence properties, and protein interaction(disease genes are often highly connected with othergenes from the same disease).
Current limitations result from the amount and qual-ity of the available experimental data generated bythese techniques is a major limitation of the gene-prioritization techniques. For instance, protein-proteininteraction-based methods suffer from the incomplete-ness and low quality of the data currently available forinteraction networks in mammals. Another source ofuncertainty is the disease mapping information usedto train and evaluate the computational methods, for itis of variable resolution and expected to contain largenumbers of false positives.
Machine learning methods, e.g., decision trees andsimilarity based methods are widely used. For exam-ple, PhenoPred derives a similarity score that repre-sents the chance of the gene disease association to betrue [46]. In the following we will compare our systemwith the ToppGene Suite, which is one of the state-of-the art approaches with an easy to use interface [47].It uses a fuzzy-based similarity measure between thegenes in the training and test set based on their seman-tic annotation.
Fig. 1. Example of an RDF graph displaying a social friendship net-work in which the income of a person is an attribute. Concepts (re-sources) are represented by circular nodes and triples are representedby labeled directed links from subject node to object node. The di-amond-shaped nodes stand for random variables which are in stateone if the corresponding triples exist. Nodes representing statisticalunits (here: Persons) have a darker rim.
3. Statistical Learning in Semantic Graphs
3.1. RDF and Linked Open Data
Semantic domains can be represented as directed la-beled graphs where nodes stand for concepts such asobjects, categories or attributes and links describe sim-ple subject-predicate-object statements: a directed arcpoints from the subject node (e.g., representing an ob-ject or a category), to an object node (e.g., represent-ing an object, a category or an attribute) (Figure 1).The link is labeled by the predicate. Examples of suchsemantic graphs are the RDF graphs of the SemanticWeb [2] and LOD [1], the underlying data structure inthe YAGO2 ontology [48] and the semantic graph for-mat in [49]. We assume that the graph only containslinks that are known to exist.2 In this paper we con-sider the learning task of predicting links which are notpresent in the semantic graph but which likely exist,considering statistical patterns that are implicit in thedata. For example, we might predict the likelihood thatJack wants to be friends with Jane or that Jack’s in-come is high or that Jack is a human being, and not aparrot.
In the next sections we briefly discuss statistical ap-proaches to networked data and motivate our approach.
2A link, resp. the associated subject-predicate-object statement, issometimes referred to as a triple.
4 Y. Huang et al. / Statistical Learning in Semantic Graphs
3.2. Network Models in Statistical RelationalLearning
Let’s consider the following mapping between asemantic RDF graph and a probabilistic model. Insemantic graphs, nodes represent objects in the realworld and links represent simple subject-predicate-object statements. In a probabilistic setting the RDFlinks become random variables (Figure 1). In a graph-ical probabilistic model, the random variables, i.e. thelinks in the RDF graph, become nodes and links be-tween the random variables represent direct proba-bilistic dependencies. Bayesian graphical models withdirected links and Markov networks with undirectedlinks are two common representatives of graphicalprobabilistic models.
Since in most networked domains it is reasonableto assume that information at one location influencesvia some paths information at other locations in thenetwork, a graphical probabilistic model would reflectthis global dependency as well. Statistical networkmodels, which have been developed from this viewpoint are, e.g., PRMs [9], MLNs [10], the IHRM [11],IRM [12] and, most recently, tensor models [37]. Ad-vantages of these approaches are their elegance, powerand generality. A disadvantage is that learning and pre-diction can be computationally expensive since infer-ence needs to take into account all evidence in the net-work by crossing over all nodes in the network. Theproblem can sometimes be alleviated, e.g., by lifted in-ference [50] and by exploiting the structure of the net-work. Another problem here is that generalization tonew entities requires that these entities and their struc-ture are integrated into the existing graphical proba-bilistic model, requiring inference over the joint do-main.
One might argue that a graphical probabilistic modelmodeling a complete RDF graph is most close to theground truth and might reflect the true belief of a userabout dependencies, independencies, and probabilisticdistributions. This fits well to a Bayesian view as arational measure of belief, and in fact, most networkmodels in SRL follow a Bayesian approach [9,10,11,12].
3.3. Approaches with a Frequentist Flavor Using anUrn Model
In a frequentist approach, probabilities are definedin the limit of an infinite number of trials. At first, itmight appear to be difficult to apply frequentist mod-
eling to networked domains since one often needs towork with only one network (e.g., one university do-main). On the other hand this seems to be a commonsituation in statistical modeling: e.g., if one samplespersons and studies their properties, one often ignoresthe fact that these persons participate in different net-works, e.g., that two persons might be members of thesame family. A statistical setting here can be well de-fined considering an urn process. In statistics, an urnproblem is an idealized mental exercise in which someobjects of real interest are represented as colored ballsin an urn or other container and are the statistical unitsin the experiment. One pretends to draw (remove) oneor more balls from the urn; the goal is to determine theprobability of drawing one color or another, or someother properties. If objects are returned to the urn (sam-pling with replacement), a statistical process is well-defined and generalization from the sample to the pop-ulation via inductive statistics is well-defined as well.In our context, the objects of interest (the “balls”) aredefined as entities with specified properties in the se-mantic graph, e.g., all students in Munich. These en-tities define the balls in the urn, i.e., the population.A sample is the formed by randomly selecting entitiesfrom the population.
Generalization to entities outside of the population(i.e., beyond the semantic graph in the data base) canalso be guaranteed if both the entities in the popula-tion and the entities in the test set can be consideredunbiased samples of a common population. Thus, weconsider the situations where, e.g., the population con-sists of all 20-year old students in Munich and the sam-ple consists of a subset. Statistical inference allows usto generalize from the sample to the population. Thequestion whether one can generalize to another popu-lation, e.g., to all students in Munich, depends on thefact if the new population is similar to the original pop-ulation. e.g., if 20-year old students are statisticallyidentical to the whole student population.
We want to note that a Bayesian analysis using theurn model is possible as well. It would now be requiredthat the user formulates the prior modeling assump-tions with respect to the urn sampling model.
As in any statistical analysis, care must be taken.Some pitfalls specific to a networked domain are dis-cussed in [51].

Y. Huang et al. / Statistical Learning in Semantic Graphs 5
4. Scalable Kernel Machine Learning forSemantic Graphs
The SUNS approach is based on the scalable urnmodel described in Section 3.3 and has been intro-duced in [3] where a feature-based approach was de-scribed. Since the number of features is very large inthe applications we are considering in this publication,we formulate the problem in terms of inner productsof features, i.e., we use a kernel formulation. The ker-nel solution is made scalable by using the Nyström ap-proximation.
4.1. The Nyström Approximation
We now assume that for any two statistical units iand j in the population a kernel ki,j is defined. A sub-set of the population of size N , i.e., the sample, de-fines the training set. Let K be the kernel matrix (i.e.,Gram matrix) for the training instances. In many ap-plications N can be very large, therefore we now fol-low [52] and use the Nyström approximation to scaleup kernel computations to large data sets.
The Nyström approximation is based on an approx-imation to eigen functions and starts with the eigen de-composition
K = UDU> (1)
of the kernel matrix. The Nyström approximation tothe kernel for two arbitrary instances i and j can bewritten as
ki,j ≈ k>.,i Ur diagr (1/dl) U>r k.,j
where diagr (1/dl) is a diagonal matrix containing theinverse of the r leading eigenvalues in D and whereUr contains the corresponding r columns of U .3 Here,k.,i is a vector of kernels between instance i and thetraining instances.
The vector of approximate kernels between a statis-tical unit i and all units in the training data can be writ-ten as
k.,i ≈ UrU>r k.,i (2)
3Based on this approximation the rank of any kernel matrix is lessthan or equal to r ≤ N .
and the matrix of approximate kernels between allpairwise units in the training data is
K ≈ Ur diagr (dl)U>r . (3)
These modified kernels can now be used in kernel ap-proaches such as SVM learning or Gaussian processlearning. In particular, the reduced rank approximationEquation 3 can greatly reduce the computational re-quirements [52].4
4.2. Example: Regularized Least Squares Solutionsfor Multivariate Prediction
We now assume that for an instance i we have Ltargets or random variables yi = (yi,1, . . . , yi,L)
>
available. We want to train a model of the form yi =k>(., i)W where W is an N × L weight matrix.
A regularized least squares cost function can be for-mulated as
trace(Y −KW )(Y −KW )> + λ traceW>KW
where Y = (y1, . . . , yN )> and where λ ≥ 0 is a reg-ularization parameter. If we use the Nyström approxi-mation for the kernels we obtain as least squares solu-tion for the weight matrix
WLS = U diagr
(1
dl + λ
)U>Y.
The prediction for the training data (i.e., in smoothingor transduction) is
Y = U diagr
(dl
dl + λ
)U>Y
and in general
yi = k>(., i)WLS . (4)
We now consider some special kernels. Assume thatfor each instance i, in addition to the random variablesof interest yi, we also have covariates xi available. Co-variates might, for example, represent aggregated in-formation. If the kernel can be written as an inner prod-uct of the covariates kxi,j = x>i xj , our Nyström ap-
4We use the Nyström approximation slightly differentlyfrom [52]. There, Equation 1 is used on a submatrix ofK and Equa-tion 2 is then used to approximate K.

6 Y. Huang et al. / Statistical Learning in Semantic Graphs
proximation is equivalent to regularized PCA regres-sion in that covariate space. Another interesting solu-tion is when kyi,j = y>i yj in which case our Nyströmapproximation is equivalent to regularized matrix re-construction via PCA, often used in collaborative fil-tering. Note that in the latter case the low rank Nys-tröm approximation is not only a necessity to obtain ascalable solution but is also necessary to obtain validpredictions at all: with λ → 0 and r = N we wouldobtain the trivial Y = Y . Finally, with kzi,j = z>i zjwhere zi = (αx>i , y
>i )
>, we obtain the reduced rankpenalized regression (RRPP) algorithm in the SUNSframework [4]. Here, α is a positive weighting factorbalancing the influence of the two information sources.
4.3. Kernel for Semantic Graphs
So far the discussion has been quite general andthe Nyström approximation can be used for any kerneldefined between instances in the population. As dis-cussed in Section 2, there are a number of interestingkernels defined for nodes in a graph but most of themare not directly applicable to the rich domain of a se-mantic graph with many different node types and manydifferent relation types. An exception is [30], whichdefines kernels exploiting rich ontological backgroundknowledge.
We here present the kernel based on the SUNSframework [53]. The random variables represent thelikelihood of links where the statistical unit is the sub-ject or object. Additional features describe aggregatedinformation. Although features are explicitly calcu-lated, a kernel approach is still preferred since in theapplications that we are considering the number of fea-tures can be quite large whereasN , the size of the sam-ple, can be controlled more easily.
4.3.1. The Random Variables or Targets in the DataMatrix
Figure 1 shows a simple semantic graph with nodesPerson, Jack, Joe, Jane, High and relation typesrdf:type, knows, knows, hasIncome. We now intro-duce for each potential triple a triple node drawn as adiamond-shaped node in Figure 1. A triple node is instate one (true) if the triple is known to exist and isin state zero (false) if the triple is known not to exist.Graphically, one only draws the triple nodes in stateone, i.e., the existing triples.
We now associate some triples with statistical units.The idea is to assign a triple to a statistical unit if thestatistical unit appears in the triple. Let’s consider the
statistical unit Jane. Based on the triples she is par-ticipating in, we obtain (?personA, rdf:type, Person),(Joe, knows, ?personA), and (?personA, hasIncome,High) where ?personA is a variable that represents astatistical unit. The expressions form the random vari-ables (outputs) and define columns in the data matrix.5
By considering the remaining statistical units Jack andJoe we generate the expressions (columns), (?personA,knows, Jane) and (Jack, knows, ?personA). We will notadd (Jane, knows, ?personA) since Jane considers noone in the semantic graph to be her friend. We iteratethis procedure for all statistical units in the sample andadd new expressions (i.e., columns in the data matrix),if necessary. Note that expressions that are not repre-sented in the sample will not be considered.
In [3] the triples associated with a statistical unitwere denoted as statistical unit node set (SUNS). Thedata matrix formed with the N statistical units as rowsand the random variables as columns is denoted asY . Note that Y contains random variables derived formultiple different predicates.
4.3.2. Non-random Covariates in the Data MatrixThe columns in the data matrix that we have de-
rived so far represent truth values of actual or potentialtriples. Those triples are treated as random variables inthe analysis. If the machine learning algorithm predictsthat a triple is very likely, we can enter this triple in thesemantic graph. We now add columns to the data ma-trix that provide additional information for the learn-ing algorithm but which we treat as covariates or fixedinputs.
First, we derive simplified relations from the seman-tic graph. More precisely, we consider the expressionsderived in the last subsection and replace constants byvariables. For example, from (?personA, knows, Jane)we derive (?personA, knows, ?personB) and count howoften this expression is true for a statistical unit ?per-sonA, i.e., we count the number of friends of person?personA.
Also consider that often a textual description isavailable for a node from which non-random featurescan be derived (See the experiments in Section 6).
Second, we consider a simple type of aggregated co-variate from outside a SUNS. Consider first a binarytriple (?personA, knows, Jane) . If Jane is part of an-other binary triple, in the example, (?personA, hasIn-come, High) then we form the expression (?personA,
5Don’t confuse a random variable representing the truth value ofa statement with a variable in a triple, representing an object.

Y. Huang et al. / Statistical Learning in Semantic Graphs 7
knows, ?personB) ∧ (?personB, hasIncome, High) andcount how many rich friends a person has. A largenumber of additional covariates are possible but so farwe restricted ourselves to these two types. The matrixformed with the N statistical units as rows and the co-variates as columns is denoted as X and the completedata matrix becomes the matrix (αX, Y ).
Covariates are of great importance, in particular ifstatistical units are rather disconnected. For example,to predict the social status of two professors at differ-ent universities in different countries, it might be rel-evant how many students they administer, but not ex-actly which students, or it might be important that theyare the dean of some department, but not of which de-partment. In social network terms: it might be relevantthat they play the same roles.
5. Experiments and Querying Using FOAF Data
5.1. Data Set and Experimental Setup
5.1.1. Data SetThe experiments are based on friend-of-a-friend
(FOAF) data. The purpose of the FOAF project [54]is to create a web of machine-readable pages describ-ing people, their relationships, and people’s activi-ties and interests, using W3C’s RDF technology. TheFOAF ontology is based on RDFS/OWL and is for-mally specified in the FOAF Vocabulary Specification0.916.
We gathered our FOAF data set from user profilesof the community website LiveJournal.com7. All ex-tracted entities and relations are shown in Figure 2.In total we collected 32,062 persons and all relatedattributes. An initial pruning step removed little con-nected persons and rare attributes. The resulting datamatrix, after pruning, has 14,425 rows (persons) and15,206 columns. Among those columns 14,425 ones(friendship attributes) refer to the property knows. Theremaining 781 columns (general attributes) refer togeneral information about age, location, number ofblog posts, attended school, online chat account andinterest.
6http://xmlns.com/foaf/spec/7http://www.livejournal.com/bots/
Fig. 2. Entity-relationship diagram of the LJ-FOAF domain
5.1.2. Evaluation Procedure and Evaluation MeasureThe task is to predict potential friends of a per-
son, i.e., knows statements. For each person in the dataset, we randomly selected one knows friendship state-ment and set the corresponding matrix entry to zero,to be treated as unknown (test statement). In the testphase we then predicted all unknown friendship en-tries, including the entry for the test statement. Thetest statement should obtain a high likelihood value,if compared to the other unknown friendship entries.Here we use the normalized discounted cumulativegain (nDCG) [55] (described in the Appendix) to eval-uate a predicted ranking.
5.1.3. Baseline MethodsAs a baseline we create a random ranking for all un-
known triples, i.e., every unknown triple gets a randomprobability assigned. Another baseline is Pearson cor-relation coefficient (PCC) where the prediction for auser xi is calculated as xi = 1
N
∑j 6=i xj
<xj ,xi>‖xj‖‖xi‖ and
N is a normalization term.
5.1.4. Data Retrieval and Sampling StrategiesSetting 1 describes the situation where the depicted
part of the Semantic Graph is randomly accessible,meaning that all instances can be queried directly fromtriple stores. Statistical units in the sample for trainingare randomly sampled and statements for other ran-domly selected statistical units are predicted for testing(inductive setting). In this setting, persons are rarelyconnected by the knows relations. The knows relationin the training and test set is very sparse (0.18%).
Setting 2 also concerns the situation where statis-tical units in the sample are randomly selected, butthis time the truth values of statements concerning thestatistical units in the training sample are predicted(transductive setting). Some instances of the knows re-lation of the selected statistical units are withheld fromtraining and used for prediction. Prediction should beeasier here since the statistics for training and predic-tion match perfectly.

8 Y. Huang et al. / Statistical Learning in Semantic Graphs
20 50 100 150 200 300 4000.1
0.15
0.2
0.25
0.3
0.35
0.4
Number of latent variables
nDC
G@
all
RandomPCCSVDLDARRPP
20 50 100 150 200 300 4000.1
0.15
0.2
0.25
0.3
0.35
0.4
Number of latent variablesnD
CG
@al
l
RandomPCCNNMFSVDLDARRPP
(a) (b)
Fig. 3. Comparison between different algorithms. nDCG all is plotted against the number of latent variables: (a) and (b) for settings 1 and 2respectively.
5.2. Results
Besides RRPP of the SUNS approach we inves-tigate three other multivariate prediction approachesbased on matrix completion, i.e., singular value de-composition (SVD), non-negative matrix factoriza-tion (NNMF) [56] and latent Dirichlet allocation(LDA) [57]. All approaches estimate unknown matrixentries via a low-rank matrix approximation. NNMF isa decomposition under the constraints that all terms inthe factoring matrices are non-negative. LDA is basedon a Bayesian treatment of a generative topic model.After matrix completion of the zero entries in the datamatrix, the entries are interpreted as certainty valuesthat the corresponding triples are true. After training,the models can also be applied to statistical units in thepopulation outside the sample.
Figure 3 shows the experimental results for ourFOAF data set. The error bars show the 95% confi-dence intervals based on the standard error of the meanover the samples. The figure plots the nDCG all scoreof the algorithms against the number of latent vari-ables. RRPP clearly outperforms the other methodsand also the baseline and does not exhibit overfittingwith increasing rank. LDA is a Bayesian method whichperforms second best but overfits with increasing rank.
Note that NNMF does not appear in Figure 3 (a), sinceit is not applicable in a inductive setting.
A more detailed description of the experimental re-sults can be found in [4].
5.3. Comparison to IHRM
It is interesting to compare our method to statisti-cal relational models. The IHRM model is an infinitelatent-class multi-relational Bayesian learning methodand was evaluated in [33] using a FOAF dataset. Thisdata set was also gathered from the website LiveJour-nal.com. A difference to the data set used in this pa-per is that there was no information available aboutInterest and rather an attribute expressing whether auser has an image. The details about the data setcan be obtained in [33]. We utilize the same data setand the same experimental setting and calculate thearea under the ROC curve (AUC) as evaluation mea-sure. When predicting knows relations, PPRR achieves0.9322(±0.003) which is clearly better than the AUCscore performed by IHRM 0.813(±0.005).

Y. Huang et al. / Statistical Learning in Semantic Graphs 9
5.4. Extended SPARQL and More SamplingStrategies
We want to demonstrate how learned probabilisticstatements can be queried. The following SPARQLquery illustrates a query for LiveJournal users who livein Munich and might want to be Trelena’s friend:
PREFIX ya: http://blogs.yandex.ru/schema/foafPREFIX foaf: http://xmlns.com/foaf/0.1/PREFIX dc: http://purl.org/dc/elements/1.1/SELECT DISTINCT ?personWHERE {?person ya:located ?city .?person foaf:knows <http://trelana.
livejournal.com/trelana>WITH PROB ?prob .
FILTER REGEX(?city, "Munich") .}ORDER BY DESC(?prob)
Listing 1: The query includes the predicted knowstriples for Trelena and rates them by predictedprobability.
Figure 4 shows an output of a knows prediction ap-plication.
6. Experiments with DBpedia Data
DBpedia [58] is part of LOD and contains struc-tured information extracted from Wikipedia. At thetime of writing this paper, it describes more than 3.4million concepts, including 312,000 persons, 413,000places and 94,000 music albums, DBpedia does notonly serve as a “nucleus for the web of data”, but alsoholds great potential to be used in conjunction withmachine learning approaches. Yet, even though DB-pedia already provides a great value, it is still limitedin the information it provides and in terms of quality.For example, although there are many cities covered inDBpedia, most information, like its most famous cit-izens and its most spectacular sights, is not very use-ful for machine learning purposes. Here we report re-sults using a population consisting of all members ofthe German Bundestag to evaluate our approach. Thispopulation has been created by collecting all triplesthat are returned by the SPARQL query
SELECT ?s ?p ?o WHERE {?s ?p ?o .?s skos:subject dbp-cat:
Members_of_the_German_Bundestag .}
Listing 2: The query generates the population of theGerman Bundestag.
6.1. Data Quality
A great benefit of LOD data is that by one simpleSPARQL query the sample is defined. While DBpediahas great potential for machine learning, there are alsochallenges when these machine learning approachesare applied to DBpedia data. The first issue is related tothe problem of incomplete data. It is very common forsubjects in a DBpedia population to share only a sub-set of predicates. For instance, only 101 of 293 mem-bers of the German Bundestag represented in DBpe-dia have an entry for the predicate dbp-ont:party ordbp-prop:party. Therefore, in order to handle DBpe-dia data, a machine learning algorithm has to be ableto deal with missing or incomplete data. The secondissue is related to noisy predicates. For predicates itis often the case that there are semantical duplicates,e.g. dbp-prop:party and dbp-ont:party. While du-plicate predicates are not a big problem by default,they can become a challenge when they are used incon-sistently, which can greatly increase the preprocessingeffort. Third, even more serious than noisy predicatesare noisy objects. E.g. the Christian Democratic Unionof Germany was represented by the literals "CDU"
and "Christian Democratic Union" or the resourcesdbpedia:Christian_Democratic_Union and dbpedia
:Christian_Democratic_Union_(Germany). Thus thetrue members of this party would have been dividedinto four distinct subsets and this needs to be resolvedprior to learning. Finally, we have to consider the sizeof the dataset, as the sample can get quite large whenall available information in DBpedia is used for a pop-ulation.
6.2. Predicting Party Membership
In the following experiments the learning challengewas to correctly predict the political party for eachsubject, where the party is identified by the object ofthe predicate dbp-prop:party. Duplicate predicateswould bias the experiments as they are heavily cor-

10 Y. Huang et al. / Statistical Learning in Semantic Graphs
Fig. 4. Query: Who wants to be Trelena’s friends. Her actual friends are predicted first with confidence values on one (green frame). Theninterestingly, it is predicted that she should be her own friend (black frame), followed by a ranked list of predicted friends (red frame).
related with the target predicate. Therefore predicateslike dbp-ont:party or dbp-ont:Person/party wereremoved. Moreover, predicate-object pairs that arevery closely related to a party membership like (?s,
skos:subject, dbp-cat:Politicians_of_the_Social_
Democratic_Party_of_Germany) or (?s, rdf:type,
yago:GermanGreenPartyPoliticians) were also re-moved. Rare features were sometimes pruned. In orderto demonstrate the aforementioned challenges associ-ated with DBpedia data, we conducted the followingexperiments
– ORIG: The original data from DBpedia (version3.5.1). After pruning, this dataset consisted N =293 rows (persons) and 804 columns.
– DISAMB: In this experiment the objects of thetarget predicate were manually disambiguated tosolve the noisy objects problem. After the disam-biguation exactly one concept (resource) for eachparty (CDU, CSU, SPD, FDP, Alliance ’90/TheGreens, The Left, Centre Party) remained in thedata set. Thus, for each statistical unit we esti-mate L = 8 variables. Furthermore, in the origi-nal data set only 101 of 293 statistical units had anentry for dbp-prop:party dbp-ont:party. Since
machine learning algorithms benefit from a largernumber of examples we manually added the partyfor the remaining 192 units. After pruning, thisdata set had 802 columns.
– PEARSON: We used the Pearson correlation co-efficient on the disamb data set as a baselinemethod.
– AGE: In this experiment the age of each politicianwas added as a continuous feature, by subtract-ing the birth year (when available) from the year2010. To prevent that the age values dominatedthe remaining columns, age values were normal-ized. After pruning this data set had 804 columns.
– WEIGHT: We used a weighting coefficient ofα = 0.4 to put less importance on the covariates(see Section 4.2).
– STATE: The predicates dbp-prop:birthPlace ordbp-ont:birthPlace specify the city or villageof birth. For the members with no entry here, wefilled in the entry manually. Naturally, the birth-place is not a useful attribute for our task, whereasthe state of the birthplace can be quite valuable,since in Germany exist clear local party prefer-ences. Filling in the state information from the

Y. Huang et al. / Statistical Learning in Semantic Graphs 11
birthplace information can easily be done by ex-ploiting geographical part-of-relationships withOWL reasoning.
– TEXT: Finally associated textual information wasexploited by tokenizing the objects of the predi-cates rdf:comment and dbp-prop:abstract andby adding one column for each occurring token.When a token was present for a particular statis-tical unit, the entry was set to one, else to zero.After pruning the data set had 2591 columns.
– ALL: In this experiment all previously describedapproaches were combined. Since the number ofattributes changed, we also changed the weight-ing factor to α = 0.2. After pruning this data sethad 2623 columns.
Except for ORIG, the basis for all experiments wasthe DISAMB data set. To evaluate how well the partymembership is predicted, we performed leave-one-outcross-validation by iterating over all subjects. In eachiteration we set all dbp-prop:party entries for thesubject of the current iteration to zero and used pre-dicted estimates for ranking. As evaluation measureswe used nDCG and bpref [59], the latter often beingused in TREC tracks designed for evaluation environ-ments with incomplete relevance data.
Figure 5 and 6 show the results for nDCG and bpref.As expected, the results obtained from the raw datawere worst with a score of 0.722. The effect of datacleaning from disambiguation improved the score by 7points. A small improvement in score can be achievedby adding the age. This shows that age is a weak pre-dictor of party membership, at least in this Bundestagdata set. Furthermore, an improvement in score can beachieved by putting more weight on the quantity of in-terest, i.e., the party membership. The textual descrip-tion sometimes contains strong hints on party mem-bership and the score improves to 0.928. The state in-formation is also quite relevant as an input, which iswell explained by the peculiarities of German politics.Finally, quite a high score of 0.963 is achieved by acombination of all methods.
7. Experiments using Linked Life Data
Life science data forms a significant part of the LODcloud. To a large extent, the life science data has beenextracted from well maintained data bases such thatthis portion of LOD is of high quality. We apply ourapproach to an important problem in life sciences, i.e.,
0.0 0.2 0.4 0.6 0.8 1.0
bpref-5
Original
Disamb
Pearson
Age
Weight
Text
State
All
0.722
0.797
0.715
0.801
0.837
0.928
0.842
0.963
Fig. 5. The bpref scores on the Bundestag population.
1 2 3 4 5 6 7
top n items
0.3
0.4
0.5
0.6
0.7
0.8
0.9
1.0
nDC
G@n
scor
e
OrigPearsonDisambWeightStateTextAgeAll
Fig. 6. The nDCG scores on the Bundestag population.
the prediction of gene-disease relationships and showthat we obtain competitive results to state-of-the-artsolutions.
7.1. Gene-Disease Prediction
Disease genes are those genes involved in the causa-tion of, or associated with a particular disease. At thisstage, more than 2500 disease genes have been dis-covered. Unfortunately, the relationship between genesand diseases is far from simple since most diseases

12 Y. Huang et al. / Statistical Learning in Semantic Graphs
are polygenic and exhibit different clinical pheno-types. High-throughput genome-wide studies like link-age analysis and gene expression profiling typically re-sult in hundreds of potential candidate genes and it isstill a challenge to identify the disease genes amongthem. One reason is that genes can often perform sev-eral functions and a mutational analysis of a particulargene reveal dozens of mutation cites that lead to differ-ent phenotype associations to diseases like cancer [45].Analysis is further complicated because environmen-tal and physiological factors come into play as well asexogenous agents like viruses and bacteria.
Despite this complexity, it is quite important to beable to rank genes in terms of their predicted rele-vance for a given disease as a valuable tool for re-searchers and with applications in medical diagnosis,prognosis, and a personalized treatment of diseases.During the last years, a number of solutions and toolshave been developed for this purpose, such as Topp-Gene [47]. Those tools use features and gene similar-ity measures to generalize from known disease genesto others. Kann [45] provides an up-to-date review onthe latest advances in the field of translational bioin-formatics, focusing on the advances of computationaltechniques to search for and classify disease genes.
Certain gene properties differentiate disease genesand have been used as the basis for computationaltools to prioritize disease gene candidates derived fromthese experiments. All of the current approaches arebased on the integration of different sources such as:gene function (disease genes are expected to sharecommon functional properties), pathways (diseasegenes are most likely to share common pathways),gene expression (disease genes are expected to be co-expressed), gene regulation (genes within the samegene-regulation network are expected to affect similardiseases), sequence properties, and protein interaction(disease genes are often highly connected with othergenes from the same disease).
The quality of the available experimental data is amajor limitation of the gene-prioritization techniques.For instance, protein-protein interaction-based meth-ods suffer from the incompleteness and low quality ofthe data currently available for interaction networks inmammals.
In the following we will compare our system withthe ToppGene Suite, which is one of the state-of-the-art approaches with an easy to use interface [47] anduses a fuzzy similarity measure between genes.
7.2. Gene-Disease Data
A great benefit of LOD is that the data required forthe experiments, i.e., gene-disease relationships, geneattributes, and disease attributes, can be extracted with-out much effort. For gene-disease relationships manu-ally curated and well maintained data bases were used.In particular, we used OMIM [60], UniProt [61], Phar-mGKB [62] and CTD [63]. All of these databasesexcept UniProt use Entrez Gene [64] identifiers forgenes. However, the mapping of UniProt to EntrezGene is complete enough to use only Entrez Geneidentifiers as the gene vocabulary. Unfortunately thisdoesn’t apply to diseases. Some of the databases useOMIM terms while others use MeSH. The mapping ofOMIM to MeSH or vice versa is non-trivial and sub-ject of ongoing research (e.g. see [65]). For this reasononly data with MeSH identifiers have been used. Afterthe gene-disease relations had been extracted, this in-formation was stored in an RDF triple store, by creat-ing triples of the kind (<Entrez Gene ID>, siemens:
related_to, <MeSH ID>).In the next step we retrieved data for the gene at-
tributes. We used the attributes mentioned in a re-cent review article [66]. For instance, we accessed Bi-oGRID [67] and HPRD [68] which provide protein in-teraction information. UniProt [61] and Reactome [69]provide data about pathways and Gene Ontology [70]provides gene function annotations.
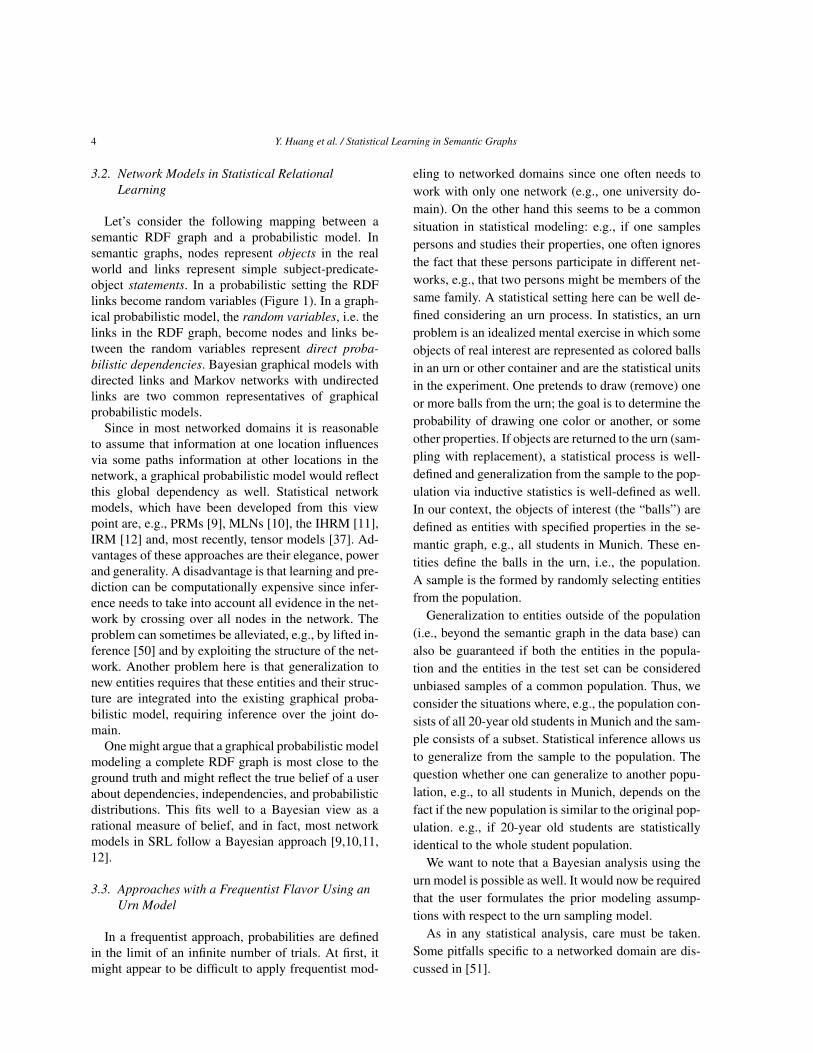
Again it was quite helpful that the relevant datasources were available in the LOD cloud and were assuch easily accessible. In particular, Bio2RDF [70] andLinked Life Data (LLD)8 are two projects from the Se-mantic Web and the Linked Data community that inte-grate various bioinformatic databases and publish thisinformation in the form of RDF triples. At the timeof this writing the Bio2RDF website9 lists 57 differentdatabases. Figure 7 shows the various databases andhow they are connected.
In Bio2RDF, resources are accessible via a REST-like interface and identified by normalized URIs of theform http://bio2rdf.org/<namespace:id>. There-fore, for each Entrez Gene ID we queried the Bio2RDFwith the appropriate identifier, retrieved all availableinformation as RDF triples and added them to the ex-isting gene-disease graph. In doing so, we were able toderive attributes for protein interaction by using datafrom e.g. BioGRID or HPRD, gene function by us-
8http://linkedlifedata.com9http://bio2rdf.wiki.sourceforge.net/
Y. Huang et al. / Statistical Learning in Semantic Graphs 13
Fig. 7. Bio2RDF databases and connections. (Sourcehttp://bio2rdf.wiki.sourceforge.net)
ing Gene Ontology annotations, Pathway through datafrom Pathway Commons, UniProt or Reactome. More-over, we included information about the protein do-main from CDD [71] as well as PubMed co-citations.The gene length was added in a postprocessing step asa normalized continuous attribute. Therefore, most ofthe attributes that have been identified in [66] as impor-tant for gene-disease priorization could be retrieved byone single request to Bio2RDF and one postprocessingstep for any gene in the gene-disease relation graph.
Finally, we gathered data for disease attributes. Asmentioned above we used only MeSH diseases inour experiments for gene-disease relationship predic-tion. Their attributes are neither available as easilynor in any RDF format. We crawled the MeSH treestructure of the diseases via MeSH Browser (2010MeSH)10. Then, we split tree numbers according tothe levels of the MeSH hierarchy from the top oneto the leafs. For instance, the disease “abetalipopro-teinaemia” (mesh:D000012) is located in three nodesin the hierarchy and one of them is C16.320.565.Therefore, we form the attributes C16, C16.320 andC16.320.565. In this way we obtained for 1138 MeSHdiseases totally 4389 attributes which are arranged in a10-level hierarchy.
The gene-disease data set is available at http://
www.dbs.ifi.lmu.de/~huang/index.html#datasets.
10http://www.nlm.nih.gov/mesh/MBrowser.html
7.3. The Data Matrices
We compared two experiments. In the first exper-iment, the genes were treated as statistical units andin the second experiment the diseases were treated asstatistical units. In the first experiment the data ma-trix consisted of the N ×M data matrix Y where therows of Y represent the N genes and the columns ofY represent the M diseases. The element yi,j is equalto one if it is known that gene i affects disease j andis zero otherwise. We explored N = 3820 genes andM = 3102 diseases, 1138 of which are MeSH terms.Y is very sparse and contains only 0.07 % ones wherethe MeSH part of Y has 0.13% ones. In addition, thedata matrix contains the matrix XG with the attributesdescribing the genes. In the raw data, we obtained al-most a million attributes. This number was reduced toless than 100000 after cutting the attributes that are as-sociated with only one gene.XG is very sparse as well,filled with 0.13% ones.
In the second experiment, the diseases were treatedas statistical units and the data matrix consisted ofthe Y T . In addition, the data matrix contains the ma-trix XD with the attributes describing the diseases. Weused 4389 disease attributes. Only 0.28% of the entriesof XD are ones.
7.4. Experiments on Gene-Disease Modeling
7.4.1. EvaluationIn the experiments we removed a known gene-
disease relationship for each gene (i.e., we set the en-try to zero) and predicted the likelihood of all zero en-tries. We then evaluated how the known relationshipwas ranked in comparison to the other zeros using thenDCG@n score with n = 10 (the nDCG score is de-scribed in the Appendix). We repeated the procedure 5times to be able to produce error bars and mean values.
Figure 8 shows the nDCG score against rank r forthe basis SUNS models on the gene data set (a) and thedisease data set (b). In both experiments an attribute-based prediction (only usingXG, resp.XD for the ker-nel) gave worst results (att) (regularized PCA regres-sion of Section 4.2). Models using Y for the kernelperformed much better (rel) (regularized matrix recon-struction using PCA of Section 4.2). When both Y andXG, resp. XD were used with α = 1, the results weresuboptimal, due to the dominance of the attributes.Best performance could be achieved by carefully tun-ing α. Due to the large number of attributes, in the firstexperiment a small α = 0.1 gave best results whereas

14 Y. Huang et al. / Statistical Learning in Semantic Graphs
5 50 100 5000
0.05
0.1
0.15
0.2
0.25
Number of latent variables
nDC
G@
10
Relation(R)A+RAttribute(A)Weighted A+R
5 50 100 5000
0.05
0.1
0.15
0.2
0.25
Number of latent variablesnD
CG
@10
Relation(R)A+RAttribute(A)Weighted A+R
(a) gene data set (b) disease data set
Fig. 8. (a) The nDCG@10 score against rank r for the SUNS model where the statistical units were the genes. The bottom (blue, att) line showsthe performance of the SUNS model using only XG for the kernel and the second line from the top (red, rel) shows the performance of theSUNS model using Y for the kernel. We can see that the relationships were better predictors. An RRPP SUNS model with α = 1 (second linefrom bottom, green, att+rel) was worse than the relationship model alone. An RRPP SUNS model with α = 0.1 gave best results. (b) The samebut for the SUNS model where the statistical units were the diseases. At high rank r the attributes were also quite informative. An RRPP SUNSmodel with α = 0.5 gave best results, when rank r exceeded 50.
in the second experiment, we used α = 0.5. With anoptimally tuned α both choices of statistical units re-sulted in similar performances (RRPP). An interestingquestion is if it is beneficial to combine both models.Figure 9 shows the nDCG score against rank r for themulti-population SUNS models in which the predic-tion of both models are simply averaged. With RRPPSUNS models as components (b), we got overall bestperformance by simply averaging predictions.11
7.4.2. Comparison with ToppGeneIn order to compare our approach with other ex-
isting gene prioritization tools, we have selected thestate-of-the-art service ToppGene. Therefore the sameevaluation procedure as described in [72] and [73] hasbeen employed. First, various diseases have been se-lected from the OMIM and MeSH databases togetherwith their related genes. The number of related genesranges from 18 for Hypertension to 47 for Asthma. Ad-ditionally, 99 random, but unrelated genes have beenselected for each disease. For each disease the fol-
11Different weighting factors did not improve with respect to sim-ple averaging.
lowing validation procedure has been applied: Performleave-one-out validation for each related gene by re-moving this gene (the “target” gene) from the trainingset (ToppGene) or setting the target relation to zero.Then, a ranking of the 99 random genes combined withthe target gene is computed. Hereby, sensitivity wasdefined as the frequency of the target genes that areranked above a given threshold (e.g. in the top 10% ofthe results) and specificity as the frequency of genesthat are ranked below the threshold. Since we used datadifferent from the original ToppGene paper, we sub-mitted all training and test data manually through theToppGene web interface12 and recorded the ranking.All ToppGene results have been computed with thestandard parameters suggested by the interface.
Table 1 shows the evaluation results of SUNS andToppGene on 4 different diseases. Each number rep-resents an average over up to 50 genes. We can seethat in 7 out of 12 cases SUNS was superior to Topp-Gene. In Psoriasis ToppGene is superior for top 20%.We have observed a trend that for higher percentage
12http://toppgene.cchmc.org/prioritization.jsp

Y. Huang et al. / Statistical Learning in Semantic Graphs 15
5 50 100 5000
0.05
0.1
0.15
0.2
0.25
Number of latent variables
nDC
G@
10
DiseaseGeneBoth
5 50 100 5000
0.05
0.1
0.15
0.2
0.25
Number of latent variablesnD
CG
@10
DiseaseGeneBoth
(a) attribute only (b) attribute and relationship
Fig. 9. (a) The nDCG@10 score against rank r for the multi-population SUNS model with equal weights and the SUNS models using XG,resp. XG for calculating the kernel. We see that the multi-population model gave best results. (b) The same but for the RRPP SUNS models ascomponents. The multi-population model gave overall best results.
Table 1Validation results of SUNS and ToppGene. The best results for eachdisease are printed bold.
Top 5% Top 10% Top 20%
Autistic Disorder (mesh:D001321)
ToppGene 0.20 0.26 0.36SUNS 0.36 0.40 0.46
Psoriasis (mesh:D011565)
ToppGene 0.44 0.52 0.92SUNS 0.64 0.68 0.72
Hypertension, essential (omim:145500)
ToppGene 0.61 0.83 1.0SUNS 0.89 1.0 1.0
AIDS, delayed/rapid progression to (omim:609423)
ToppGene 1.0 1.0 1.0SUNS 0.91 0.91 1.0
values, ToppGene tends to be strong. We believe thatthese results are quite promising, considering that inToppGene the weights on the relevance of the differentattributes were carefully adjusted whereas in SUNS,all attributes essentially have the same weights. We
see a good chance that with a careful weighting of at-
tributes, our approach can even perform better.

16 Y. Huang et al. / Statistical Learning in Semantic Graphs
8. Further Applications and Conclusions
This paper discussed approaches towards statisti-cal machine learning in semantic graphs. We proposedthe SUNS approach as a flexible, robust and scal-able approach. In the typical data situation with manycolumns in the data matrix, we proposed a kernel ap-proach. We demonstrated that the SUNS approach caneasily be applied to a large number of learning tasks.
First, we presented results from a social network do-main and we showed how learned information can beretrieved using an extended SPARQL query.
Secondly, we applied the approach to data extractedfrom DBpedia. Here the data is quite noisy and consid-erable preprocessing is needed to yield good results.Also, by including textual data the prediction resultswere considerably improved. This improvement canalready be observed even if a simple keyword basedrepresentation is used without any sophisticated in-formation extraction. Some of the data preprocessingsteps can easily be executed with ontological (OWL-)reasoning, such as the generalization from city to state.In fact, materialization of facts derivable from logi-cal reasoning is recommended as a preprocessing step.Other preprocessing steps, such as the calculation ofage from the birthday and the current date, were donealgorithmically.
In a third and novel application, we studied a lifescience domain with several hundred thousand covari-ates, demonstrating the scalability of the approach. Weachieved excellent performance in gene prioritization.
The presented approach was also used in coopera-tions with other research teams. In [74] the SUNS ap-proach is applied for item recommendations in the con-text of RDF stream reasoning. In contributions to theMEDICO use case in THESEUS13 the SUNS modelis used as a learning decision system for predictingprocedures and diagnoses for a given patient. The rec-ommendation is based on a data set of previously col-lected patient histories.
Scalability of the overall approach is guaranteed.First, we can control the number of instances consid-ered in the Nyström approximation. Second we cancontrol the rank of the approximation. Third, we cancontrol the number of local features that are used to de-rive the kernel. In our experiments, M , the number offeatures, was always quite high. In this case the mostcostly computation is the calculation of the kernel re-quiring N2M operations.
13http://theseus-programm.de/
LOD data provides a great potential for applyingmachine learning approaches on that. Besides thoseexamples in this paper, recently we investigated the ap-plication of a tensor factorization approach to predict-ing the rdf:type relation (e.g. dbpedia-owl:Person)in [38] and also the application of a combined learn-ing approach to prediction the writer’s nationality (e.g.yago:FrenchWriters) in [75], when textual data is in-cluded. In the last paper it is also discussed how aSUNS-like model can be extended to model a com-plete LOD data base with many types of entities andrelationships.
AcknowledgementsWe acknowledge funding by the German Federal
Ministry of Economy and Technology (BMWi) underthe THESEUS project and by the EU FP 7 Large-ScaleIntegrating Project LarKC.
9. Appendix
Details on the nDCG Score
We use the normalized discounted cumulative gain(nDCG) to evaluate a predicted ranking. The nDCGscore is calculated by summing over all the gains in therank list R with a log discount factor as
nDCG(R) =1
Z
∑k
2r(k) − 1
log(1 + k),
where r(k) denotes the target label for the k-thranked item in R, and r is chosen such that a perfectranking obtains value 1. To focus more on the top-ranked items, we also consider the nDCG@n whichonly counts the top n items in the rank list. Thesescores are averaged over all ranking lists for compari-son.
References
[1] Bizer, C., Heath, T., Berners-Lee, T.: Linked data - the storyso far. International Journal on Semantic Web and InformationSystems (IJSWIS) (2009)
[2] Tauberer, J.: Resource Description Framework,http://rdfabout.com/
[3] Tresp, V., Huang, Y., Bundschus, M., Rettinger, A.: Material-izing and querying learned knowledge. In: Proceedings of theFirst ESWC Workshop on Inductive Reasoning and MachineLearning on the Semantic Web. (2009)

Y. Huang et al. / Statistical Learning in Semantic Graphs 17
[4] Huang, Y., Bundschus, M., Tresp, V., Rettinger, A., Kriegel,H.P.: Multivariate structured prediction for learning on the Se-mantic Web. In: Proceedings of the 20th International Confer-ence on Inductive Logic Programming (ILP). (2010)
[5] Huang, Y., Nickel, M., Tresp, V., Kriegel, H.P.: A scalable ker-nel approach to learning in semantic graphs with applicationsto linked data. In: 1st Workshop on Mining the Future Internet.(2010)
[6] Momtchev, V., Peychev, D., Primov, T., Georgiev, G.: Ex-panding the pathway and interaction knowledge in Linked LifeData. In: Proceedings of International Semantic Web Chal-lenge. (2009)
[7] Kiefer, C., Bernstein, A., Locher, A.: Adding data miningsupport to SPARQL via statistical relational learning methods.In: Extended Semantic Web Conference 2008, Springer-Verlag(2008)
[8] Raedt, L.D., Jaeger, M., Lee, S.D., Mannila, H.: A theory ofinductive query answering. In: Proceedings of the IEEE Inter-national Conference on Data Mining. (2002)
[9] Getoor, L., Friedman, N., Koller, D., Pferrer, A., Taskar, B.:Probabilistic relational models. In Getoor, L., Taskar, B., eds.:Introduction to Statistical Relational Learning. MIT Press(2007)
[10] Domingos, P., Richardson, M.: Markov logic: A unifyingframework for statistical relational learning. In Getoor, L.,Taskar, B., eds.: Introduction to Statistical Relational Learning.MIT Press (2007)
[11] Xu, Z., Tresp, V., Yu, K., Kriegel, H.P.: Infinite hidden rela-tional models. In: Proceedings of the Conference on Uncer-tainty in Artificial Intelligence (UAI). (2006)
[12] Kemp, C., Tenenbaum, J.B., Griffiths, T.L., Yamada, T., Ueda,N.: Learning systems of concepts with an infinite relationalmodel. In: Proceedings of the National Conference on Artifi-cial Intelligence (AAAI). (2006)
[13] Rettinger, A., Nickles, M., Tresp, V.: Statistical relationallearning of trust. Machine Learning (2010)
[14] Quinlan, J.R.: Learning logical definitions from relations. Ma-chine Learning 5(3) (1990)
[15] Muggleton, S., Feng, C.: Efficient induction of logic programs.In: Proceedings of the 1st Conference on Algorithmic LearningTheory, Ohmsma, Tokyo (1990)
[16] De Raedt, L.: Attribute-value learning versus inductive logicprogramming: The missing links (extended abstract). In: ILP’98: Proceedings of the 8th International Workshop on Induc-tive Logic Programming, Springer-Verlag (1998)
[17] Lavrac, N., Džeroski, S., Grobelnik, M.: Learning nonrecur-sive definitions of relations with LINUS. In: EWSL-91: Pro-ceedings of the European Working Session on Machine Learn-ing. (1991)
[18] Lisi, F.A., Esposito, F.: An ILP perspective on the SemanticWeb. In: Semantic Web Applications and Perspectives. (2005)
[19] Tresp, V., Yu, K.: Learning with dependencies between severalresponse variables. In: Tutorial at the International Conferenceon Machine Learning. (2009)
[20] Cumby, C.M., Roth, D.: On kernel methods for relationallearning. In: Proceeding of the International Conference onMachine Learning. (2003)
[21] Vishwanathan, S.V.N., Schraudolph, N., Kondor, R.I., Borg-wardt, K.: Graph kernels. Journal of Machine Learning Re-search - JMLR (2008)
[22] Gärtner, T., Lloyd, J., Flach, P.: Kernels and distances for struc-tured data. Machine Learning 57(3) (2004)
[23] Lösch, U., Bloehdorn, S., Rettinger, A.: Graph kernels for RDFdata. In: Proceedings of the 9th Extended Semantic Web Con-ference (ESWC’12), Springer (2012)
[24] Zhu, X.: Semi-supervised learning literature survey. Technicalreport, Computer Sciences TR 1530 University of WisconsinMadison (2006)
[25] Yu, K., Chu, W., Yu, S., Tresp, V., Xu, Z.: Stochastic relationalmodels for discriminative link prediction. In: Proceedings ofAdvances in Neural Information Processing Systems. (2006)
[26] Xu, Z., Kersting, K., Tresp, V.: Multi-relational learning withgaussian processes. In: Proceedings of the 21st InternationalJoint Conference on Artificial Intelligence (IJCAI-09). (2009)
[27] Taskar, B., Wong, M.F., Abbeel, P., Koller, D.: Link predic-tion in relational data. In: Proceedings of Advances in NeuralInformation Processing Systems. (2003)
[28] Muggleton, S., Lodhi, H., Amini, A., Sternberg, M.J.E.: Sup-port vector inductive logic programming. In Hoffmann, A.,Motoda, H., Scheffer, T., eds.: Proceedings of the 8th Inter-national Conference on Discovery Science. Volume 3735 ofLNCS., Springer (2005)
[29] Landwehr, N., Passerini, A., De Raedt, L., Frasconi, P.: kFOIL:Learning simple relational kernels. In: Proceedings of the Na-tional Conference on Artificial Intelligence (AAAI). (2006)
[30] d’Amato, C., Fanizzi, N., Esposito, F.: Non-parametric sta-tistical learning methods for inductive classifiers in semanticknowledge bases. In: Proceedings of the IEEE InternationalConference on Semantic Computing - ICSC 2008. (2008)
[31] Popescul, A., Ungar, L.H.: Statistical relational learning forlink prediction. In: Workshop on Learning Statistical Modelsfrom Relational Data. (2003)
[32] Getoor, L., Diehl, C.P.: Link mining: a survey. SIGKDD Ex-plorations (2005)
[33] Rettinger, A., Nickles, M., Tresp, V.: Statistical relationallearning with formal ontologies. In: Proceedings of TheEuropean Conference on Machine Learning and Principlesand Practice of Knowledge Discovery in Databases (ECMLPKDD). (2009)
[34] Sutskever, I., Salakhutdinov, R., Tenenbaum, J.B.: Modellingrelational data using bayesian clustered tensor factorization. In:Advances in Neural Information Processing Systems. (2009)
[35] Franz, T., Schultz, A., Sizov, S., Staab, S.: Triplerank: RankingSemantic Web data by tensor decomposition. In: 8th Interna-tional Semantic Web Conference(ISWC2009). (2009)
[36] Bro, R.: PARAFAC. Tutorial and applications. Chemometricsand Intelligent Laboratory Systems 38 (1997) 149–171
[37] Nickel, M., Tresp, V., Kriegel, H.P.: A three-way model for col-lective learning on multi-relational data. In: Proceedings of the28th International Conference on Machine Learning. (2011)
[38] Nickel, M., Tresp, V., Kriegel, H.P.: Factorizing Yago: Scalablemachine learning for linked data. In: Proceedings of the 21stInternational World Wide Web Conference. (2012)
[39] Maedche, A., Staab, S.: Ontology Learning. In: Handbook onOntologies 2004. Springer (2004)
[40] Fanizzi, N., d’Amato, C., Esposito, F.: DL-FOIL: Conceptlearning in description logics. In: Proceedings of the Interna-tional Conference on Inductive Logic Programming. (2008)
[41] Lehmann, J.: DL-learner: Learning concepts in descriptionlogics. Journal of Machine Learning Research - JMLR (2009)

18 Y. Huang et al. / Statistical Learning in Semantic Graphs
[42] Berendt, B., Hotho, A., Stumme, G.: Towards Semantic Webmining. In: ISWC ’02: Proceedings of the First InternationalSemantic Web Conference on The Semantic Web. (2002)
[43] Mika, P.: Social Networks and the Semantic Web. Springer(2007)
[44] Rettinger, A., Lösch, U., Tresp, V., d’Amato, C., Fanizzi, N.:Mining the Semantic Web - Statistical learning for next genera-tion knowledge bases. Data Mining and Knowledge Discovery(2012)
[45] Kann, M.G.: Advances in translational bioinformatics: compu-tational approaches for the hunting of disease genes. Briefingin Bioinformatics 11 (2010)
[46] Radivojac, P., Peng, K., Clark, W.T., Peters, B.J., Mohan, A.,Boyle, S.M., Mooney, S.D.: An integrated approach to infer-ring gene-disease associations in humans. Proteins 72 (2008)
[47] Chen, J., Bardes, E.E., Aronow, B.J., Jegga, A.G.: ToppGenesuite for gene list enrichment analysis and candidate gene pri-oritization. Nucleic Acids Research 37 (2009)
[48] Suchanek, F.M., Kasneci, G., Weikum, G.: Yago: a core ofsemantic knowledge. In: Proceedings of the 16th InternationalConference on World Wide Web. (2007)
[49] Strube, M., Ponzetto, S.P.: WikiRelate! computing semantic re-latedness using Wikipedia. In: Proceedings of the AAAI Con-ference on Artificial Intelligence. (2006)
[50] de Salvo Braz, R., Amir, E., Roth, D.: Lifted first-order prob-abilistic inference. In Getoor, L., Taskar, B., eds.: Introductionto Statistical Relational Learning. MIT Press (2007)
[51] Neville, J., Jensen, D.: Bias/variance analysis for relationaldomains. In: Proceedings of the International Workshop onInductive Logic Programming - ILP. (2007)
[52] Williams, C.K.I., Seeger, M.: Using the Nyström method tospeed up kernel machines. In: Advances in Neural InformationProcessing Systems 13. (2001)
[53] Tresp, V., Bundschus, M., Rettinger, A., Huang, Y.: TowardsMachine Learning on the Semantic Web. In: Uncertainty Rea-soning for the Semantic Web I. Lecture Notes in AI, Springer(2008)
[54] Brickley, D., Miller, L.: The Friend of a Friend (FOAF) project,http://www.foaf-project.org/
[55] Jarvelin, K., Kekalainen, J.: IR evaluation methods for retriev-ing highly relevant documents. In: Proceedings of the Interna-tional ACM SIGIR Conference on Research and Developmentin Information Retrieval. (2000)
[56] Lee, D.D., Seung, H.S.: Learning the parts of objects by non-negative matrix factorization. Nature (1999)
[57] Blei, D.M., Ng, A.Y., Jordan, M.I.: Latent dirichlet allocation.Journal of Machine Learning Research 3 (2003)
[58] Auer, S., Bizer, C., Kobilarov, G., Lehmann, J., Cyganiak, R.,Ives, Z.: DBpedia: A nucleus for a web of open data. TheSemantic Web (2008)
[59] Buckley, C., Voorhees, E.M.: Retrieval evaluation with incom-plete information. In: Proceedings of the 27th ACM SIGIRConference on Research and Development in Information Re-trieval. (2004)
[60] Hamosh, A., Scott, A.F., Amberger, J.S., Bocchini, C.A.,McKusick, V.A.: Online mendelian inheritance in man(OMIM), a knowledgebase of human genes and genetic disor-ders. Nucleic acids research 33(Database Issue) (2005) D514
[61] Apweiler, R., Bairoch, A., Wu, C.H., Barker, W.C., Boeck-mann, B., Ferro, S., Gasteiger, E., Huang, H., Lopez, R., Ma-grane, M., et al.: UniProt: the universal protein knowledgebase.Nucleic acids research 32(Database Issue) (2004) D115
[62] Hewett, M., Oliver, D.E., Rubin, D.L., Easton, K.L., Stuart,J.M., Altman, R.B., Klein, T.E.: PharmGKB: the pharmacoge-netics knowledge base. Nucleic Acids Research 30(1) (2002)163
[63] Mattingly, C., Rosenstein, M., Colby, G., Forrest Jr, J., Boyer,J.: The comparative toxicogenomics database (CTD): a re-source for comparative toxicological studies. Journal of Exper-imental Zoology. Part A, Comparative Experimental Biology305(9) (2006) 689
[64] Maglott, D., Ostell, J., Pruitt, K.D., Tatusova, T.: Entrez gene:gene-centered information at NCBI. Nucleic acids research(2006)
[65] Isaac, K., Ming-Chin, L., Lewis, F.: Metadata mapping andreuse in caBIG. BMC Bioinformatics 10
[66] Kann, M.G.: Advances in translational bioinformatics: compu-tational approaches for the hunting of disease genes. Briefingsin Bioinformatics 11(1) (2010) 96
[67] Stark, C., Breitkreutz, B.J., Reguly, T., Boucher, L., Bre-itkreutz, A., Tyers, M.: BioGRID: a general repository for in-teraction datasets. Nucleic acids research 34(Database Issue)(2006) D535
[68] Peri, S., Navarro, J.D., Kristiansen, T.Z., Amanchy, R., Suren-dranath, V., Muthusamy, B., Gandhi, T.K.B., Chandrika, K.N.,Deshpande, N., Suresh, S., et al.: Human protein referencedatabase as a discovery resource for proteomics. Nucleic acidsresearch 32(Database Issue) (2004) D497
[69] Joshi-Tope, G., Gillespie, M., Vastrik, I., D’Eustachio, P.,Schmidt, E., Bono, B.D., Jassal, B., Gopinath, G.R., Wu, G.R.,Matthews, L., et al.: Reactome: a knowledgebase of biologicalpathways. Nucleic acids research 33(Database Issue) (2005)D428
[70] Belleau, F., Nolin, M.A., Tourigny, N., Rigault, P., Morissette,J.: Bio2RDF: towards a mashup to build bioinformatics knowl-edge systems. Journal of Biomedical Informatics 41(5) (2008)
[71] Marchler-Bauer, A., Anderson, J.B., Cherukuri, P.F.,DeWeese-Scott, C., Geer, L.Y., Gwadz, M., He, S., Hurwitz,D.I., Jackson, J.D., Ke, Z., et al.: CDD: a conserved domaindatabase for protein classification. Nucleic acids research33(Database Issue) (2005) D192
[72] Chen, J., Xu, H., Aronow, B., Jegga, A.: Improved humandisease candidate gene prioritization using mouse phenotype.BMC Bioinformatics 8(1) (2007) 392
[73] Aerts, S., Lambrechts, D., Maity, S., Loo, P.V., Coessens, B.,Smet, F.D., Tranchevent, L., Moor, B.D., Marynen, P., Hassan,B., Carmeliet, P., Moreau, Y.: Gene prioritization through ge-nomic data fusion. Nature Biotechnology 24(5) (May 2006)544, 537
[74] Barbieri, D., Braga, D., Ceri, S., Valle, E.D., Huang, Y., Tresp,V., Rettinger, A., Wermser, H.: Deductive and inductive streamreasoning for semantic social media analytics. IEEE IntelligentSystems 99 (2010)
[75] Jiang, X., Huang, Y., Nickel, M., Tresp, V.: Combining infor-mation extraction, deductive reasoning and machine learningfor relation prediction. In: Proceedings of the 9st ExtendedSemantic Web Conference. (2012)