a seismic driven integrated approach to build a reservoir ...spgindia.org/2010/104.pdffor a...
TRANSCRIPT

P-104
A Seismic driven integrated approach to build a reservoir model
for a heterogeneous shallow marine stratigraphic
sand body in Krishna Godavari basin.
Varun Sharma*, George A.S. Manickam, Solomon Asseffa, Sanchita Ganguly, Partha Saikia. Schlumberger Asia Services Ltd.
M.Y. Farooqui, Bijay Behera, Moumita Sengupta, Abinash Mohanta, Gujarat State Petroleum Corporation Ltd.
Summary
This paper reviews the concept; process and workflow for identifying reservoir scale geobodies using seismic pre-stack
inversion, rock physics, geological and petrophysical data to build an integrated reservoir model. The study area is located in the
Krishna-Godavari basin along the east coast of India, which covers the deltaic and inter-deltaic areas of Krishna and Godavari
rivers and extends into the offshore. The basin evolved through crustal rifting and subsequent drifting during Mesozoic time,
followed by major fluvial and marine Tertiary sedimentation. The specific study area is in the Cretaceous sedimentary sequence
of the KG basin.
A geological model is constructed for Upper Cretaceous shallow water depositional systems in the Krishna- Godavari basin to
conceptualize the reservoir architecture which comprises of complex stratigraphic traps in the sedimentary sequence. Detailed
3D seismic interpretation, seismic inversion and wireline logs are integrated in a quantitative and probabilistic interpretation
approach. This study combines seismic attributes derived from pre-stack inversion (AVO) and rock physics to generate a lithogy
cube (Lithocube) and associated probability cubes for each classes based on a Bayesian classification scheme (pdf’s).
The conceptual depositional model for Upper Cretaceous is based on observations from logs and core data showing that the
main facies type in this section is marine or restricted marine shale, associated with fining up channel sands of fluvial and tidal
channel origin, isolated bars which can either be tidal or deltaic mouth bar or long-shore bar. These various architectural
elements indicate a complex deltaic depositional environment with limited structural discontinuity and with all possible
stratigraphic heterogeneity.
Petrophysical evaluation reveals good porosity and permeability in sand bars as the sediments are well sorted and matured.
Similarly, the channel sands should also provide good to moderate reservoir quality.
Prior to this study, a total number of eleven exploratory wells were drilled in the area, but due to high stratigraphic
heterogeneity only two wells encountered reservoir facies. To better assess reservoir distribution, seismic inversion and
Lithocube volumes are used as main drivers for delineating and modeling of the reservoir geobodies. The seismic volume,
inversion results, rock physics and petrophysical data of existing wells are analyzed in the context to the geological findings to
establish the conceptual model and build the geocellular model.

A Seismic driven integrated approach to build a reservoir model
2
The Lithocube scheme enables to identify 3 classes in the Upper Cretaceous section i.e. Class1 (HC Sand), Class 2 (Wet Sand)
and Class3 (Shale). Analysis and interpretation of the Lithocube confirms the dominance of Class3 (Shale) with some discrete
occurrences of sand geobodies. To further assess these geobodies, probability cubes, generated from the Bayesian classification
scheme are evaluated. For instance, a longitudinal bar is identified using the Class 1 sand and further refined on the probability
of the hydrocarbon sand to delineate a high confidence drilling location. The occurrence of the geobody is confirmed by one of
the existing wells in the section, which proved hydrocarbon in the Drill Stem Test.
The resultant model is utilized to generate appraisal locations and a review towards development.
1. Introduction
Krishna-Godavari [KG] basin is proving to be one of the
largest gas basins of the country. This pericratonic rift basin has multiple proven petroleum system of Mio-Pliocene, Upper and Lower Cretaceous age. Present study is focused on the depositional environment of Upper Cretaceous sediments. The study area is located in the shallow offshore of KG Basin, East coast of Indian peninsular, near the north eastern bank of Godavari Delta.
Previous studies indicate existence of two structural trends in this region, 1) The NW-SE trend which is along the Pranhita Godavari rift trend of the Gondwana, mostly recorded in the Lower Cretaceous and below, and 2) the NE-SW trend parallel to pericretonic rift trends which is commonly recorded in the deposits of Upper Cretaceous and onward. Both these structural trends are defined by series of horst-graben structures bounded by numerous normal faults resulting sub-basinal high and trough
complex.
Figure 1: The KG-Basin location map
1.1. Stratigraphy
The pre-Cretaceous sediments of Krishna-Godavari basin comprises Permo-Carboniferous to Jurassic Gondwana sediments deposited mainly with in the Pranhita-Godavari graben. These sediments are overlying on the Achaean basement that created the NW-SE trending fault grabens. Thickness of these pre-Cretaceous sediments vary with various sub-basins within KGbasin that are separated by
NE-SW and NW-SE trending faults. Cretaceous outcrops in the northeastern margin of the basin include the Gollapalli Sandstone, Raghavapuram Shale, and Tirupati Sandstone. The Gollapalli sandstones are ferruginous and micaceous, with a paleocurrent direction of 10–20 deg to the northwest (Vasudeva Rao and Krishna

A Seismic driven integrated approach to build a reservoir model
3
Rao, 1977). The Raghavapuram shales are mainly white, buff, and lilac clays, underlain by fine-grained sandstones. The Tirupati sandstones are feldspathic toward the top and ferruginous toward the bottom. Lenticular clay beds, petrified wood, and cross-bedding characterize the
sandstone, which has a paleocurrent direction of 5–10 deg dip toward the southeast. Basalt lava flows [Razole volcanics] with Upper Cretaceous– Lower Paleocene intertrappean beds are overlain by the Miocene–Pliocene Rajahmundry Sandstone. This sandstone is red, feldspathic, ferruginous, lateratized, cross-bedded, and conglomeratic (Figure 2).
Figure 2: The generalized stratigraphy of KG-Basin [Bastia et.al.
2007]
2. Conceptual geological model
A proper understanding of the sedimentary facies distribution in the subsurface provides possible depositional setting with structura and sedimentological control over
heterogeneities. Borehole image logs play very important roles in providing high resolution micro-resistivity data which can be further used to identify various structural & sedimentary features. Integration of image data, mudlog, petrophysical logs, volumetric interpretations of six well data [Well-1, Well-2, Well-3, Well-4, Well-5 and Well-7] and calibration of these
results with the available core information resulted in identification of sedimentary facies types. Each well log data provided the vertical/inclined association of these facies which, according to Walther’s law, should be associated laterally. Thus, depositional setting was interpreted from the vertical and horizontal distribution of
these facies and a conceptual depositional model was obtained.
2.1. Types of reservoir facies/ sand bodies
The following sedimentary facies were identified and their characteristics are discussed below: A. Channel Facies: Identified from gradual upward
increase of both the conductivity in the image log and the GR, and vertical succession of sharp base/erosional surface, cross-bedding & planner
bedding from bottom to top indicating waning of depositional energy. Occasional presence of glauconitic observed from the master log data indicate some marine influence. The vertical thickness of channel facies varied from 10m to 70m.
B. Sand Bar Facies: These are sand bodies with coarsening upward succession identified from upward increase in the image resistivity & bedding thickness and decrease in GR. Presence of high angle cross beds indicate high energy condition. Also, thick, vertically stacked bars observed in few wells indicating progradation / aggradations of bar deposits. These bars can ei- ther be the channel bars, shallow marine barrier bars or tidal bars depending upon their orientation & elongation direction.
C. Heterolithics Facies: These are the thin planner beds / lami- nations of sand, silt & shale alternation, occurring in between the sand bars & channels. These are identified from the image texture and thin laminated sedimentary structures. It indicates fluctuating depositional energy condition commonly seen in in- ter-tidal zone.
D. Sheet Sand Facies: Well bedded highly resistive relatively clean sand succession where the gamma ray response is rela- tively low & flat. Tabular cross beddings identified from within 5-10 m thick
sand sheets. These are indicative of planer sheet sand and can occur as wedges near the beach where the wave action predominates as compared to tides.
E. Siltstone Facies: Predominantly consists of fine grained [silt size] sediments representing low to moderate depositional en- ergy settings. Mostly, these are well bedded successions occur- ring within shale or in between sand and shale/

A Seismic driven integrated approach to build a reservoir model
4
heterololithics deposits and represent channel over bank, tidal flat and / or dis- tal bar deposits.
F. Shale Facies: Predominantly consists of argillaceous sedi- ments which may or may not have bedding structures. Thick deposition of calcareous shale generally inferred as deposits of calm & quiet environments.
Figure 3: Sedimentary facies types identified from the well log
data and calibrated with the core analysis
Figure 4: Palaeo-current direction obtained from the planar
bedding surface orientation from all the six wells
The paleo-current direction was also obtained from planar bed- ding surface orientations, which indicate an overall flow direc- tion towards South to South-East in most of the well data. 2.2. Environment of the basin
The overall sedimentary succession showed deposition of vari- ous sandstone facies, such as channel sand, sand bars, sheet sand or sand wedges along with the siltstone,
heterolithics and car- bonate rich shale deposits. Correlation of these facies types along the borehole sections provided vertical association of fa- cies whereas, correlation among the six well data provided the lateral distribution of these facies types. Interpretation of these facies correlations indicated shallow marine type environment of deposition, where there is gradual deepening of depo-center is observed within the data range vertically as well as laterally from east to west. The paleo-current directions were towards south to south-east; hence paleo-shoreline could be envisaged as NE-SW trending one. These observations and interpretation, therefore, lead to a con- ceptual paleo-depositional environment model that may have prevailed in a part of KG Basin during Upper Cretaceous. The south to south-eastward flowing channel is meeting the NE-SW trending shoreline and forming a complex shallow marine depo- sitional environment. Here the environmental heterogeneities were reflected from the coexistence of channel system, lagoon marsh deposits, shallow marine sand bars and restricted & open marine shale [Figure 5].
Figure 5: Conceptual geological model for the Upper Creta- ceous
depositional settings
The borehole image and well data derived sedimentary facies provide insight into deciphering the sedimentological history of the palaeo environment and the key elements of the depositional system of Late Cretaceous reservoirs in the KG Basin. The vari- ous reservoir types, identified here, i.e., channel sand, sand bars, sand sheets and sands within heterolithics have their own reser- voir characteristics. A relation between image facies to petro- physical rock typing was established and a Static Reservoir Model using seismic controlled facies map obtained.

A Seismic driven integrated approach to build a reservoir model
5
3. Seismic interpretation and inversion results
3.1. Inversion results of Upper Cretaceous
The inversion results are very encouraging. For the Acoustic Impedance and Vp/Vs the match between the absolute inversion result and the well logs is generally very good with respect to both reflector placement and absolute values. However our ob- servation was that a lot of details can be observed which can then be used to fine tune or correct the existing interpretation or understanding of the geology.
Figure 6. P-Impedance (left) and VpVs ratio results after inver-
sion for Well-6. Blue indicates the inverted trace, red is data and
green the low frequency trace or the starting solution.
Figure 7. P-Impedance (left) and VpVs ratio results after inver-
sion for Well-7. Blue indicates the inverted trace, red is data and
green the low frequency trace or the starting solution.
3.2 Rock Physics Cross-plots and Observations
The logs were checked for quality and the required
editing made, seismic attribute logs such as acoustic impedance, shear impedance, VPVS ratio and Poisson’s Ratio logs were generated and used to produce cross plots colour-coded by petrophysical logs such as volume of clay (VCL), porosity (PHIT) and water saturation (Sw). Figures 8 and Figure 9 are such examples. Good separation of these properties such as varying matrix con- tent (e.g. sand and shale) and fluid saturation (hydrocarbon and brine) means that there is a high probability that inversion will help in the mapping of definable geological bodies.
The Vp versus porosity cross plot, with the Hasin-Shtrikman quartz-brine bounds (Figure 9) shows that the P-wave velocity decreases with increasing porosity for Upper Cretaceous forma- tion. The figure also show that the cleaner sand has a higher ve- locity than the shaly-sand and shaly intervals. Similarly Figure 9 shows that there is a separation between sand and shale in SI-AI domain and further between hydrocarbon-bearing sand shaly- sand and shaly intervals. Figure 10 is acoustic impedance (AI) versus Poisson’s ratio (PR) cross plot for the reservoir zones colour-coded by VCL, Sw and porosity. Superimposed as over- lays on the cross-plot are the empirical Greenberg-Castagna- Gardner (GC-G) curves for brine saturated sand (olive), shale (green) and limestone (blue). The figure shows that the sand and shaly-sand/shale are separated in AI-PR domain. The porous hydrocarbon-bearing sand has lower acoustic impedance (Figure 10). The thickness of the hydrocarbon bearing sands varies from 5m to over 20m within the thick Upper Cretaceous shale. It is also important to note that the clay content of the hydrocarbon bearing zones goes up to 40% which could suppress the fluid effect at the seismic scale. Therefore use of these seismic attributes for mapping hydrocarbon-bearing sands should take into consideration these lithological factors and the thickness of the sands which may be below the seismic resolution.

A Seismic driven integrated approach to build a reservoir model
6
Figure 8: P-wave velocity as a function of porosity colour-
coded by clay volume (left), Shear impedance versus Acoustic
impedance colour-coded by clay volume (centre) and Shear im-
pedance versus Acoustic impedance colour-coded by water satu-
ration for VCL 0.4 (right) (Logs used are Upper Cretaceous
formation, Well-1, Well-2, Well-3, Well-4, Well-5 and Well-6).
Figure 9: Acoustic impedance versus Poisson’s ratio cross plot
colour-coded by clay volume (left), colour-coded by water satu-
ration for VCL 0.4 (centre) and colour-coded by porosity for
VCL 0.4 (right) (Logs used are Upper Cretaceous formation,
wells Well-1, Well-2, Well-3, Well-4, Well-5, and Well-6).
3.3 LithoCube analysis
Rock physics and AVO trends are dependent on mineralogy (i.e. lithology) and fluid properties. Lithofacies can therefore be classified using elastic attributes such as acoustic impedance, shear impedance, VPVS ratio (Poisson’s ratio), etc. derived from well log data. The aim of the LithoCube analysis is to produce a spatial lithol- ogy distribution based on litho classes which are defined by petrophysical properties and seismic response based on attrib- utes such as acoustic impedance (AI), shear impedance (SI) and Vp/Vs from well logs. The petrophysical properties, mainly clay volume (VCL), porosity (PHIE) and saturation (Sw) together with sonic and density logs were used to diagnose the rocks and establish the classes as the seismic response is dependent on these properties. The following procedures were followed in the LithoCube analysis. a) Evaluate the capability of seismic attributes (AI,
SI, and Vp/Vs) derived from sonic and density logs to separate sand from shale and hydrocarbon-bearing sand from brine sand
b) Prepare the relevant logs for the analysis and create litho classes based on step (a)
c) Create probability density functions (PDF’s) for each class
d) Apply the PDF’s to the inversion results to produce lithology class cubes and probability cubes for each class.
Figure 10 shows how the combination of elastic parameters (AI, SI and VP/VS) and clay volume and saturation are used to de- fine classes. Primarily Vp/Vs and secondarily SI are better dis- criminators compared to AI (Figures 12 and 13).
A Seismic driven integrated approach to build a reservoir model
7
Figure 10: Acoustic impedance (a), Shear impedance (b) and
Vp/Vs (c) versus clay content in the Upper Cretaceous Forma-
tion. (Logs used are Upper Cretaceous formation, wells Well-1,
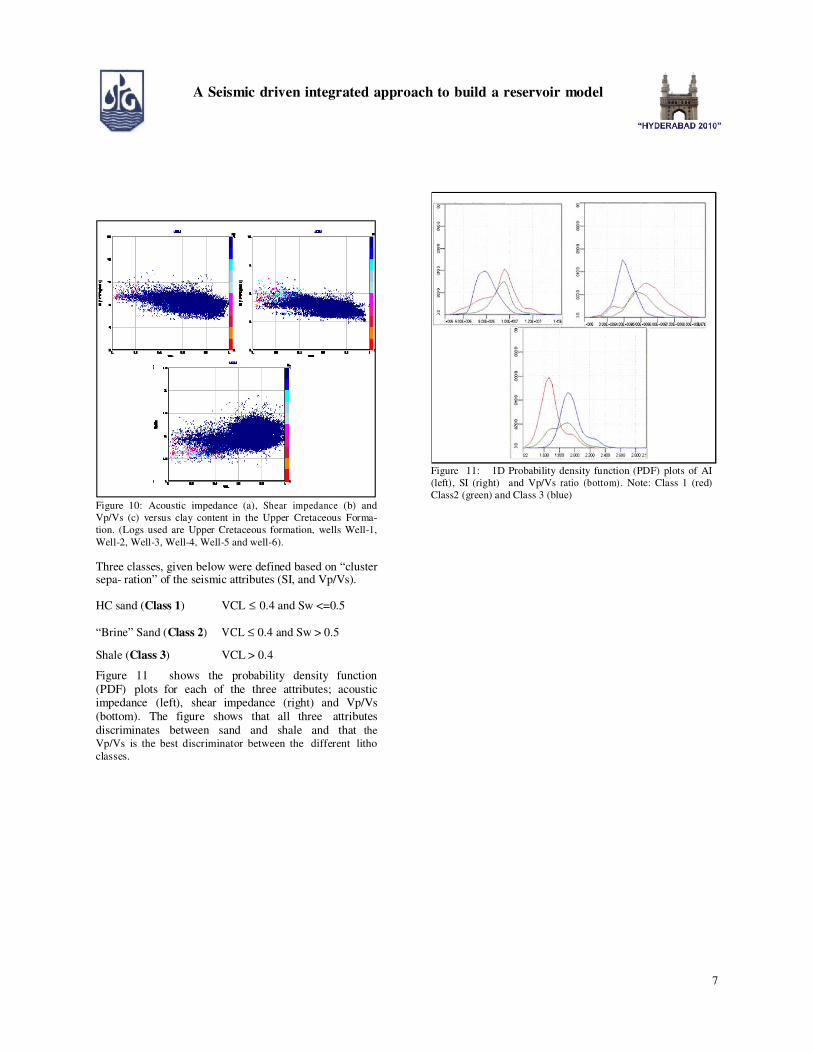
Well-2, Well-3, Well-4, Well-5 and well-6).
Three classes, given below were defined based on “cluster sepa- ration” of the seismic attributes (SI, and Vp/Vs).
HC sand (Class 1) VCL ≤ 0.4 and Sw <=0.5
“Brine” Sand (Class 2) VCL ≤ 0.4 and Sw > 0.5
Shale (Class 3) VCL > 0.4
Figure 11 shows the probability density function (PDF) plots for each of the three attributes; acoustic impedance (left), shear impedance (right) and Vp/Vs (bottom). The figure shows that all three attributes discriminates between sand and shale and that the
Vp/Vs is the best discriminator between the different litho
classes.
Figure 11: 1D Probability density function (PDF) plots of AI
(left), SI (right) and Vp/Vs ratio (bottom). Note: Class 1 (red)
Class2 (green) and Class 3 (blue)

A Seismic driven integrated approach to build a reservoir model
8
Figure 12: SI and Vp/Vs PDFs (left) and Bayesian Prediction
statistics (right).
The 2D PDFs. SI (x-axis) and Vp/Vs (y-axis) and the Bayesian statistics of the litho class prediction based on the AI, SI and VP/Vs attributes are shown in Figure 12. It should be noted, that the Lithocube interpretation should involve the probability (uncertainty) associated with it. In addition to the uncertainty the geology and the depositional environment (i.e. the likelihood of sand distribution) should be taken in to
account. It is notewor- thy that these classes are based on the log data of the wells (i.e. within the range of variability of Sw and mineralogy).
The PDFs created using acoustic impedance, shear impedance and Vp/Vs ratio have been applied to the inversion results to produce class cubes and probability cubes for each class defined earlier. Examples of the results of the litho cube (class cube with the probability cube for class 1) are shown in Figure 13a for selected In line where Well-7 is positioned. The litho class prediction matches very well with the log data as shown in Fig- ure 13a and 13b. In addition to lithoclasses, porosity cube was produced from the seismic inversion cubes (AI, SI and Vp/Vs) using a rock model and simulation.
4. Well data integration to validate the rock physics
4.1. Building up of static model at the reservoir scale
A well (being called as Well-7) had been drilled which encoun- tered gas and condensate from the Upper Cretaceous section. The occurrence of the sand in Upper Cretaceous section in this well was unique as there was no evidence of either the sand or hydrocarbon in any of the nearby wells.
Using the Geological insight, the analysis of the seismic volume, the section possessing the Upper Cretaceous interval has been particularly reviewed to identify the geological events. The fol- lowing broader analysis has been seen from the seismic volume:
• The section at the base of Upper Cretaceous
sequence pos- sesses mainly 3 facies represented as Class1 (red), Class 2 (Orange) and Class3 (yellow). The main facies in the entire section are the shales, however there are some discrete Geo-bodies encased in the shale sequences.
• The base of Upper Cretaceous sequence appear to be asso- ciated with the sheet sand deposits overlying
the uncon- formity Lower Cretaceous unconformity.
• The Sheet sand deposits represented by Class 1, appearing to be the carpet for the Upper Cretaceous section (red col- oured) is an elongated discrete Geo-body or a ‘Bar’ identi- fied from the Geological facies study in which hydrocarbon is entrapped which is overlying the Lower Cretaceous un- conformity.

A Seismic driven integrated approach to build a reservoir model
9
• The shape of this random/ longitudinal bar has been identi- fied using the Class 1 sand filtered by high Probability cube of Class1. Figure 14 shows the shape of the sand body in 3D view. The shape of this Geo-body has been inferred from the
Probability of Class 1 shown in Figure 14
• The tested object of the well Well-7 is a portion of this sand body. Figure 15 displays the well sections with the ELAN logs and the Geo-body occurrence.
Figure 13a: Lithocube through Well-7.
Figure 13b: Probability of class 1 through Well-7
Figure 14: Extracted Geobody passing through the drilled wells
Figure 15: Well-7 DST interval with processed logs
5. Conclusions
• The conceptual geological model obtained from the well data indicated depositional setting control over the reservoir characters, type, size, shape and distribution. Also, the Late Cretaceous post-rift
progradation is very well related with the regional geology of the KG basin.
• The inversion and rock physics results for the LithoCube analysis shows there is a spatial lithology distribution based on litho classes which are defined by petrophysical properties and seismic response based on attributes such as acoustic impedance (AI),

A Seismic driven integrated approach to build a reservoir model
10
shear impedance (SI) and Vp/Vs from well logs. The petrophysical properties, mainly clay volume (VCL), porosity (PHIE) and saturation (Sw) together with sonic and density logs were used to diagnose the rocks and establish the classes as the seismic response is
dependent on these properties.
• The inversion results shows the tested object is lying with the Class 1 of Lithocube with high probability and low VpVs. Class-1 from Lithocube was a part of a discrete sand body. The morphology of the sand had
been extracted as a geobody using the class1 type of lithocube and its probability.
• The probability cube for class 1 shows the Well-7 lied in the periphery of the discrete sand body. Extension and lateral limits of the sand was inferred by analyzing
the sheet sand to carry out extraction of the sand body in which hydrocarbon is entrapped.
• Another litho class appearing as a Geobody overlying parallel to the class 1 is the Class 2. However as per Bayesian scheme rock physics report, probability of
finding a good reservoir in it is low.
• Identification of Geological complexity, discrete sand bodies and stratigraphic traps could be very well understood by such seismic guided integrated approach.
6. Acknowledgements
Authors are thankful to the Managing Director, GSPCL for
their kind approval for this technical presentation. They also
ac- knowledge Alexis Carrillat and Anubrati Mukherjee from
Schlumberger for all their technical support.
7. References G. N. Rao., September 2001, Sedimentation, stratigraphy,and petroleum potential of Krishna-Godavari basin, East Coast of India. AAPG Bulletin, v. 85, no. 9 (), pp. 1623–1643. S.K. Gupta, 2006, Basin Architecture and Petroleum System
of K-G Basin, East Coast India. The Leading Edge, 830-837.
R. Bastia, A. Tyagi, K. Saxena (Reliance Industries
Ltd), T. Klimentos, R. Altman, S. Alderman, S.
Bahuguna (Schlumberger). November 2007, Evaluation of
Low Re-sistivity-Pay Deepwater Turbidities Using
Constrained Thin-Bed Petrophysical Analysis. Paper
presented at SPE Annual Technical Conference and
Exhibition in Anaheim, California, U.S.A., 11-14.
Vasudeva Rao, P., and V. V. Krishna Rao, 1977,
Stratigraphy, basin framework, sedimentation structures
and petroleum prospects of the Gondwanas of Godavari
graben: Proceedings of IVGondwana, p. 25–30.
Sengupta, M. and Bachrach, R., 2007. Uncertainty in
seismic-based pay volume estimation: Analysis using rock
physics and Bayesian statistics. The leading edge. 184-189.