a seven-year analysis of el achievement at a minnesota
TRANSCRIPT

St. Cloud State UniversitytheRepository at St. Cloud State
Culminating Projects in English Department of English
9-2016
A Seven-year Analysis of EL Achievement at aMinnesota High SchoolLisa M. PerbixSCSU
Follow this and additional works at: https://repository.stcloudstate.edu/engl_etds
This Thesis is brought to you for free and open access by the Department of English at theRepository at St. Cloud State. It has been accepted forinclusion in Culminating Projects in English by an authorized administrator of theRepository at St. Cloud State. For more information, please [email protected].
Recommended CitationPerbix, Lisa M., "A Seven-year Analysis of EL Achievement at a Minnesota High School" (2016). Culminating Projects in English. 63.https://repository.stcloudstate.edu/engl_etds/63
A Seven-year Analysis of EL Achievement at a Minnesota High School
by
Lisa Perbix
A Thesis
Submitted to the Graduate Faculty of
St. Cloud State University
In Partial Fulfillment of the Requirements
For the Degree
Master of Arts in
English: Teaching English as a Foreign Language
September, 2016
Thesis Committee:
James Robinson, Chairperson
John Madden
Edward Sadrai

2
Abstract
This paper reports on a study that analyzed the effectiveness of a district-wide training
effort to help close the achievement gap between EL and mainstream students who were in
graduating classes from 2009 through 2015. Existing data from 64 participants at a high
school was collected to determine if there have been any positive or negative trends over the
past 7 years in the academic performance of these high school English Learner (EL) students.
Information such as grade point average at graduation, class graduation rates and reading
information, specific to vocabulary and reading Lexile level, were collected from standardized
test scores to determine these trends. Although results of this study did not show a significant
improvement in academic achievement during the seven years analyzed, the overall EL
program support and the partnerships between mainstream and EL colleagues grew
substantially in this district.
3
Table of Contents
Page
List of Tables ................................................................................................................... 5
Chapter
1. Introduction ......................................................................................................... 6
EL Accountability ......................................................................................... 7
Background and Need for the Study ............................................................. 10
Limitations of the Study ................................................................................ 11
2. Literature Review ................................................................................................ 12
Educational Reform in the USA .................................................................... 12
Educational Reform for ELs .......................................................................... 13
The Limitations and Challenges of High Stakes Testing for ELs ................. 15
Grade Point Averages and Graduation Rates of EL Students ....................... 15
Academic English Vocabulary Used in High Schools .................................. 16
NWEA/MAP Test Background ..................................................................... 19
Summary ........................................................................................................ 20
Research Questions ....................................................................................... 20
3. Methodology ........................................................................................................ 21
Data Collection .............................................................................................. 21
Procedure ....................................................................................................... 25
Data Analysis ................................................................................................. 27
Summary ........................................................................................................ 29
4
Chapter Page
4. Results ................................................................................................................. 30
5. Conclusions ......................................................................................................... 39
Research Questions ....................................................................................... 39
Findings ......................................................................................................... 41
Conclusion ..................................................................................................... 43
Further Research ............................................................................................ 43
References ....................................................................................................................... 45
Appendix ........................................................................................................................ 49

5
List of Tables
Table Page
1. Final GPA, All Students ...................................................................................... 31
2. Group Statistics of GPA before and after 2012 Training .................................... 31
3. Final GPA t-test ................................................................................................... 32
4. Average Graduation Rates Group A vs. Group B ............................................... 33
5. Average EL Graduation Rates 7-year Trend ....................................................... 33
6. 7-year Graduation Trend per MN Report Card ................................................... 34
7. Vocabulary Scores for All EL Students .............................................................. 35
8. Vocabulary Groups Statistics before and after Training ..................................... 36
9. Vocabulary t-test ................................................................................................. 36
10. Below Grade Level Reading Lexile .................................................................... 37
11. Reading Lexile Level below Grade Level-before Training vs. after
Training ......................................................................................................... 37
12. Reading Lexile Level below Grade Level t-test .................................................. 38
6
Chapter 1: Introduction
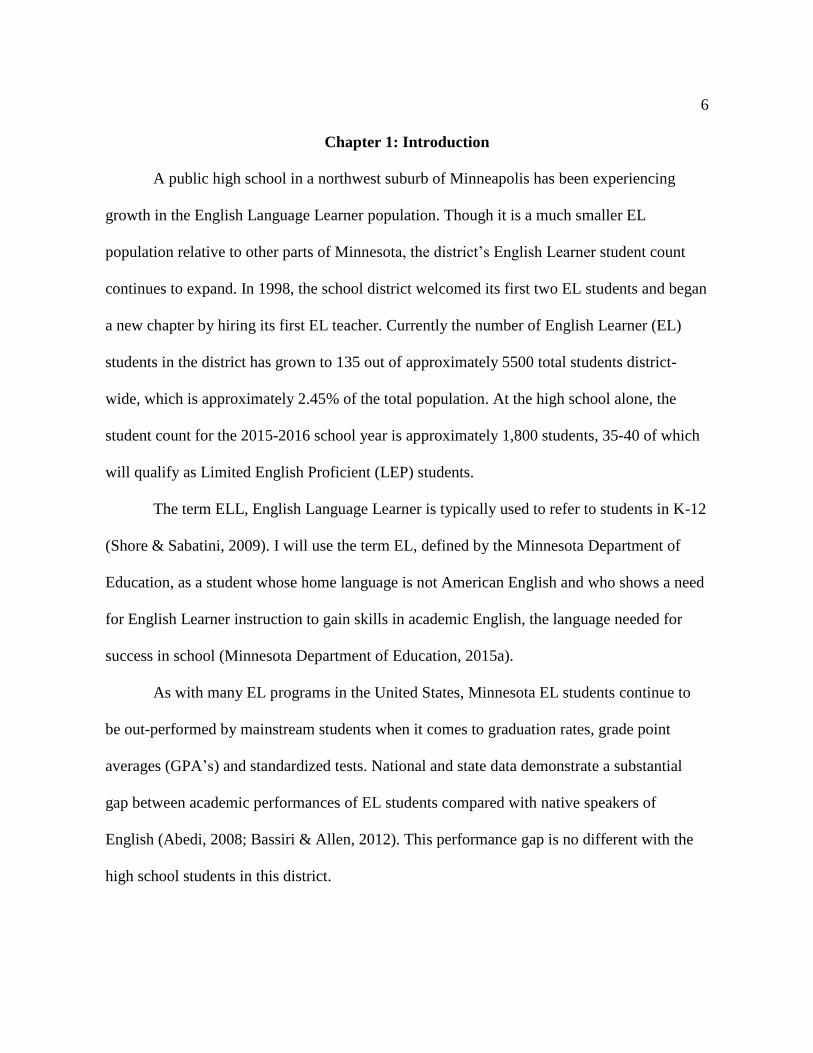
A public high school in a northwest suburb of Minneapolis has been experiencing
growth in the English Language Learner population. Though it is a much smaller EL
population relative to other parts of Minnesota, the district’s English Learner student count
continues to expand. In 1998, the school district welcomed its first two EL students and began
a new chapter by hiring its first EL teacher. Currently the number of English Learner (EL)
students in the district has grown to 135 out of approximately 5500 total students district-
wide, which is approximately 2.45% of the total population. At the high school alone, the
student count for the 2015-2016 school year is approximately 1,800 students, 35-40 of which
will qualify as Limited English Proficient (LEP) students.
The term ELL, English Language Learner is typically used to refer to students in K-12
(Shore & Sabatini, 2009). I will use the term EL, defined by the Minnesota Department of
Education, as a student whose home language is not American English and who shows a need
for English Learner instruction to gain skills in academic English, the language needed for
success in school (Minnesota Department of Education, 2015a).
As with many EL programs in the United States, Minnesota EL students continue to
be out-performed by mainstream students when it comes to graduation rates, grade point
averages (GPA’s) and standardized tests. National and state data demonstrate a substantial
gap between academic performances of EL students compared with native speakers of
English (Abedi, 2008; Bassiri & Allen, 2012). This performance gap is no different with the
high school students in this district.

7
EL Accountability
The guidelines of No Child Left Behind (NCLB) require all students to make adequate
yearly progress (AYP) in mathematics and reading (U.S. Department of Education, 2009).
AYP is evaluated using nine different groups: all students, American Indians, Asians, Blacks,
Hispanics, Whites, limited English proficient, special education, and students receiving free
and reduced lunch. What constitutes AYP and the tools used to calculate and assess it is
different in each individual state. Each state chooses a set of assessments and defines adequate
progress. If the school does not meet the state’s definition, they do not make AYP (U.S.
Department of Education, 2004).
The district where this study takes place is currently held accountable by the
Minnesota Comprehensive Assessment Series III standardized tests (MCA IIIs). The MCA
IIIs assess all students in grades 3-8, as well as grade 10, in reading; grades 3-8 and 11 in
mathematics; and grades 5, 8, and 10 in science (Minnesota Department of Education, 2010a).
The AYP is calculated by a point system and there must be 95% district participation in the
assessments. If a student partially meets standards, his/her respective school earns half a
point. If a student meets standards, one point is earned. The points earned by the school are
then compared to statewide targets to determine if the school is making AYP (MN
Department of Education, 2010b).
NWEA/ MAP test. Many schools have adopted the Northwest Evaluation Association
(NWEA) test to help predict student achievement on the MCAs and focus teacher instruction
on specific student skills. At the HS where this study takes place, the students take the test in
winter of the freshman and sophomore years and are given a Rasch Unit (RIT) score.

8
Teachers are given the RIT score norm for each grade level, the score in which each child
needs to achieve to be at grade level. Because the NWEA MAP tests are state-aligned tests, in
theory, correlation to the MCAs should be strong (Dessoff, 2008). However, ELs in particular
are held to unfair standards. Time in country, language proficiency, and educational
backgrounds are all major factors of EL success (Collier, 1987; Droop & Verhoeven, 2003;
Gottardo & Mueller, 2009; Shore & Sabatini, 2009).
ACCESS test. NCLB attempts to address these concerns. It requires all states to
annually review the achievement of its ELs. There are three areas in which ELs must improve
and these are known as annual measurable achievement objectives (AMAO) and it is done
through a language test designed for English Learners. According the Minnesota Department
of Education, AMAO 1 focuses on making progress and requires that “Progress in English
language acquisition measured by annual increases in the percentage of students making
progress in learning English, based on the annual state English language proficiency
assessment” (Minnesota Department of Education, 2010b). AMAO 2 focuses on proficiency
and says “Attainment of English language proficiency measured by the percentage of students
meeting state criteria for English language proficiency, as measured on the annual state
English language proficiency assessment” (Minnesota Department of Education, 2010b).
Finally, AMAO 3 requires that “Academic achievement and success as measured by
Adequate Yearly Progress (AYP) targets for the EL subgroup (under Title I) in meeting
grade-level academic achievement standards in English Language Arts (Reading) and
Mathematics, as measured on the annual state content assessments and gains in attendance
and graduation for ELs” (Minnesota Department of Education, 2010b).
9
The Accessing Comprehension and Communication in English State-to-State
(ACCESS) test assesses ELs in grades K-12 in the four language domains of reading, writing,
speaking and listening. It is on these tests only that ELs are being compared to EL peers to
determine appropriate growth. The tests have been written specifically for ELs and measure
their progress in comparison to other ELs. However, the State of Minnesota does not consider
an EL’s score on the ACCESS test to be substantial enough to measure ELs progress. ELs
academic progress is also measured on the state tests, the MCA IIIs in reading and math. The
MCA IIIs assess the academic achievement of all students and the set norms and expectations
are directed towards Native English Speakers (NES), which creates a disadvantage for ELs,
who are by definition still learning the English language (Minnesota Department of
Edudation, 2010b).
Depending on students’ results, a district can be considered as at/above target for
AMAO, below target for AMAO, or of having a group cell too small to be applicable for
AMAO (less than 100 EL students district wide). Districts can be labeled as In Need of
Improvement (INOI) status if they do not make AMAO, resulting in parent notification,
supplemental educational service, corrective action or preparation for restructuring
(Minnesota Department of Education, 2010b).
In a study using data from several school districts in different states, Abedi, Leon, and
Mirocha (2003) found that the achievement gap between EL and non-EL students is widest in
reading. After working with the high school EL students in this district, it is apparent that our
students’ reading abilities and assessment scores have also declined as they grow into middle
10
and high school, which is another reason why focus will be with the reading scores on their
assessments tests.
Background and Need for the Study
Without significant gains in vocabulary and reading ability, the gap between EL
students’ current vocabulary/reading level and their goal of grade-level reading
comprehension continues to widen. Books and academic reading material are given Lexile
levels, which determine what grade level the reading material is at. Lexile reader measures
and Lexile text measures both use a scale and can be used to tell the reader what range is most
appropriate along with showing growth of a readers ability (MetaMetrics, 2015). By the time
some ELs are seniors, the vocabulary and reading gap may be 5 or more years, which will
create additional challenges for post-secondary education. In college, the literacy
requirements quickly become more advanced than what was required in high school; students
are expected to read texts that are beyond their reading level and then summarize, synthesize,
and/or perform critical analysis. This challenge, then, is especially concerning, given that the
single biggest factor in predicting academic success for second language learners is
vocabulary (Saville-Troike, 1984).
In an effort to close the achievement gap, during the 2010/2011 school-year, the
school district that is the subject of this study conducted a comprehensive needs assessment of
its EL program. The general results of this assessment at the high school level uncovered an
overlying need for additional academic vocabulary and language building within all core
content areas. The assessment was followed by a 2-year training program which comprised of
EL teachers in collaboration with select mainstream teachers to help with the growing need to
11
better prepare our EL population with academic rigor and to narrow the achievement gap in
the district. At the high school level, academic language was addressed and incorporation of
both content objectives and language objectives to compliment the mainstream curriculum
within the disciplines of English, Math, Science, Social Studies, Business and Physical
Education (re-word per Ed) were created.
Over a 2-year period (fall of 2011to spring of 2013), mainstream teachers volunteered
and were selected to attend multiple trainings during the year where they created language
objectives to coordinate with their content objectives. Language objectives need to include the
academic vocabulary needed to support the content vocabulary. An example of a language
objective would be to Analyze the effects of the Treaty of Versailles and how it affected the
origins of WWII. The student would need to know what it means to analyze along with the
difference between effect and affect.
Limitations of the Study
- The sample size for this micro-study is small, due to the limited number of EL
students at this high-school (EL graduating classes are typically 6-12 students).
- Because ELs are a very fluid group, spontaneously moving away or exiting out of
the program as their English progresses, it is difficult to determine to what extent
each EL in this study received instruction from the mainstream teachers who had
EL training.
12
Chapter 2: Literature Review
The purpose of this study is to determine if the EL teacher training administered
district wide had an impact on EL academic success. The ultimate goal is to narrow the
achievement gap between the performance of EL students and mainstream students in this
district. The elements analyzed to determine if this gap narrowed includes student grade point
averages, graduation rates and the reading and vocabulary performance on a standardized test
administered in this district.
Educational Reform in the USA
Education is necessary for the growth and success of our country. Our Founding
Fathers expressed the importance of an education for ALL, regardless of being rich or poor
(U.S. Department of Education 2004). With this concept of public education in the U.S., the
task of educating its people has been the responsibility of each state; however because of its
growing importance, the federal government decided to step in and take a larger role with this
responsibility. In 1965, the Elementary and Secondary Education Act (ESEA) was approved
to help the war on poverty (U.S. Department of Education, 2004) and to increase the
educational opportunities for children from lower income families. The ESEA went through
several revisions over the decades. In 2001, the George W. Bush administration revised the
ESEA act once again and called it The No Child Left Behind (NCLB) Act of 2001.
Many educators and students around the US have felt the impact of the educational
reform act of 2001. The NCLB covers a number of programs, and one of the more significant
ones is the requirement that each state develop ‘challenging’ academic standards. These states
are required to administer assessment tests annually from grades 3-11 to determine if all
13
students are ‘proficient’ in these standards and have shown grade level mastery or knowledge
with academic content. Another significant part of the NCLB is that schools are responsible to
make ‘adequate yearly progress’ or AYP (including subgroups such as EL).
The NCLB Act increased the requirements that all children are assessed annually to
determine if they are proficient. During the school year of 2014-2015 (the last year of this
study) the state testing requirements for Minnesota are transitioning to the American College
Testing (ACT) suite of standardized tests. However, based on the 7-year sample of 12th grade
EL students in this study (from the spring of 2009 to the spring 2015) in order to graduate, the
MN Department of Education and/or this school district being analyzed require every high
school student to test in the following:
Minnesota Comprehensive Assessments (MCAs) state mandated writing (9th
grade)
Minnesota Comprehensive Assessments (MCAs) state mandated reading (10th
grade)
Minnesota Comprehensive Assessments (MCAs) state mandated science (10th
grade)
Minnesota Comprehensive Assessments (MCAs) state mandated math (11th grade)
ACT PLAN (10th grade) state offered (but not mandated) standardized test in
reading, math, English and science informing students and parents of academic
progress, interests and career plans and a precursor for the ACT test.
MAP/NWEA (9th and 10th grade) district purchased, computer adapted tests with
national measures in reading and math.
Educational Reform for ELs
A number of programs were developed under the NCLB Act of 2001, including Title
III, which is targeted to help Limited English Proficient (LEP) children and immigrant youth
in the United States (Cook, 2012). In the past, English language learners had been instructed
toward a level of English proficiency before academic content was introduced; however,
literature on this subject shows that ELs cannot wait for language skills to fully develop
14
before these students are taught the critical academic content required of all students to
succeed in our public schools (Cook, Linquanti, Chinen, & Jung, 2012). Title III states that
LEP students must not only attain English proficiency, but simultaneously meet the same
academic standards as their English-speaking peers in all content areas (Kato et al., 2004). In
other words, Title III requires states to develop English-language-proficiency (ELP) standards
aligned with the language needed for both social skills in the English language and also the
academic language needs for the content standards, used by the mainstream (U.S. Department
of Education, 2009). Title III requires states to assess each EL’s ELP annually and also
requires each state to set annual measurable achievement objectives (AMAO), of which all
three levels of AMAO must be met. Even if a school district makes two of the three AMAO
requirements, they still do not ‘make AMAO’, or pass the AMAO accountability law.
Each state is responsible for developing their own English Language Proficiency
standards. In 2010 Minnesota became the 23rd state to join the World Class Instructional
Design and Assessment (WIDA) consortium (edweek.org/2010), which currently includes 37
states (WIDA 2015). WIDA focuses on the importance of academic language and how to
support language learners. In 2011-2012 was the first time that all Minnesota school districts
administered the ACCESS test (Assessing Comprehension and Communication in English
State-to-State) for English Language Learners. ACCESS is an English language proficiency
assessment given to Kindergarten through 12th graders who have been identified as limited
English proficient (LEP) and is given annually in WIDA member states to assess students'
progress in acquiring academic English (WIDA 2015).
15
The Limitations and Challenges of High Stakes Testing for ELs
Most educated American adults would agree that they would like to see every child in
America, regardless of income, ethnicity or background, achieve high standards in school.
However, by assessing LEP students in these high stake standardized tests (which are often
culturally biased toward a European culture) and holding school districts accountable for a
proficiency level equal to their mainstream peers proves to be a challenge. Multiple research
findings consistently show how EL students perform substantially lower than their native
English-speaking peers (Abedi & Levine, 2013). Many have debated over the years that
English language learners should be excluded from the regular state tests, at least until they
have enough language proficiency to meaningfully participate (Wright, 2007). These students
face a two-way challenge; learning a new language while simultaneously mastering content in
the language they may be struggling to learn. Given that the high stake tests being used are
linguistically complex and administered in a language they are learning, it is no surprise that
ELs will typically perform worse on the tests used to comply with the mandates of NCLB
(Menken, 2010).
Grade Point Averages and Graduation Rates of EL Students
As with testing results, the grade point average (GPA) and graduation rates among EL
students have historically reflected lower performance. What are they? Give research? The
NCLB act addresses graduation rates along with test-score performance when determining
whether a school or district made AYP (Lloyd, 2012). However, because of the discrepancy
between the different states and how they reported graduation rates, the U.S. Department of
Education Blog in 2008 used new regulations that required all states to transition toward an
16
even, cohort-based method for calculating graduation rates and to use that rate for federal
accountability purposes (Lloyd, 2012).
The 2008 policies also required states to report disaggregated cohort graduation rates
for specific student groups defined on the basis of race and ethnicity, poverty, disability
status, and English-language proficiency. As of 2012, thirty-seven states have publicly
reported rates for each of these mandated groups; seven states have released results only in the
aggregate. In addition, 29 states have posted detailed results by gender and 14 states have
disaggregated graduation rates for other groups (Lloyd, 2012).
In 2015, the National Center for Education Statistics released a report regarding the
national on-time graduation rate for school year 2012-2013. These on-time graduation rates
provide a measure of how many students successfully complete high school in four years with
a regular high school diploma (Zubrzycki, 2012). According to the statistics published on the
Minnesota Department of Education website, for the 2012-2013 school year, Minnesota’s
graduation rate was at 78%. The following year in 2014, the state of Minnesota’s graduation
rate rose to 81.2 with its announced goal to reach 90% by the year 2020.
The graduation rates in the district studied are higher than those of the state of
Minnesota. In 2010, the high school’s graduation rate was just under 94%. Several years later
in 2014 this district reported a graduation rate of 98%, topping the state average margin by
nearly 20% (Minnesota Department of Education, 2015b).
Academic English Vocabulary Used in High Schools
One of the first, and the most significant, researchers to make a distinction between
academic and everyday language is Jim Cummins (Enright, 2011). For language learners,

17
academic language and vocabulary refers to “the language of schooling…distinct from
language used outside of school, requires formal instruction, and presents unique challenges
for students who are learning it while they are still developing a second language” (Enright,
2011, p. 83).
Cummins first introduced the theory of Basic Interpersonal Communication (BICS)
and Cognitive Academic Language Proficiency (CALP) in 1979. BICS is considered social
English, usually developing in 2 years (1979 and 1981). CALP is the language needed to be
successful in academics: reading, writing, speaking, and listening. Various factors can affect
the amount of time it takes to develop CALP: age of arrival, native language skills, years of
English instruction and proficiency level (Collier, 1987). Cummins stated that 5 to 7 years is
usually the minimum it takes for ELs to catch up to grade level norms (Cummins, 1999). An
additional variable to the acquisition of language learning is appropriate education. A student
is able to reach grade level norms by the previously noted items only if a student has been
receiving appropriate education; this ideal time frame of CALP development is not always
realistic. Another important factor to developing CALP is how much previous education they
have had in their home language and at what age they left their native country.
Cummins’ theory does not necessarily apply to all students. It is possible that high
levels of CALP can precede fluency in BICS. He additionally states that BICS can reach a
ceiling in development, whereas CALP will continue to develop in ELs and native speakers
alike, for their entire educational career (1999). However, it is important to realize that many
ELs will take longer periods of time to develop CALP. While their BICS may appear fluent, it
is not a determiner of their level of CALP.
18
There is a wide range of years that have been determined as the amount of time it
takes for a student to be academically successful in English (Collier, 1987; Collier & Thomas,
2007; Cummins, 1999). Initially Collier found it took on average four to eight years for an EL
to develop academic English skills and be performing at grade level (1987). Collier and
Thomas (2007) later determined that success for an EL was greatly dependent upon the type
of EL services he/she had been receiving throughout his/her education. Collier and Thomas
(2007) gathered statistics on ELs achievement in grades K-12 from 1985-2007. It was clear
that students receiving academic instruction in their native languages, while simultaneously
learning English, were more likely to close the achievement gap (Collier & Thomas, 2007).
However, students solely receiving instruction solely in English, whether an ESL pull-out
model or EL taught through content (sheltered instruction was also in this category), were less
likely to close the achievement gap (Collier & Thomas, 2007). Typical achievement was
defined as a student graduating high school at the 50th percentile. ELs receiving English
instruction through a pull-out model on average graduated high school at the 11th percentile.
ELs that had received English instruction through content or sheltered instruction on average
graduated high school at the 22nd percentile. In great contrast, ELs that had received two-way
bilingual classroom instruction closed the achievement gap, 100% graduated in the 50th
percentile (Collier & Thomas, 2007). These statistics show how ELs achievement of English
language proficiency can greatly differ from each other. There is not a set of guidelines that
can tell educators how long it will take an EL to reach grade level.
It is important to point out how high of an expectation it is for ELs to eliminate the
achievement gap in a short period of time. For ELs entering school with no prior English, the
19
first 2 to 3 years are spent developing basic English skills (Collier & Thomas, 2007). During
these years, academic content may be difficult to access, depending on EL programing. After
the initial 2 to 3 years, these students must then spend the next 6 years making a year and a
half of growth each consecutive year to catch up in academic content. This would mean for an
EL entering into kindergarten, it could take until eighth grade for this student to be at grade
level. It is difficult for ELs coming from highly educated backgrounds with formal schooling
experience to reach the 50th percentile at graduation (Collier & Thomas, 2007). It is even
more of a challenge for our students that are transient, struggling with financial problems,
and/or of refugee status (Collier & Thomas, 2007). Therefore, we are expecting incredible and
possibly unrealistic gains from our ELs with limited time learning English.
NWEA/MAP Test Background
The Northwest Evaluation Association (NWEA) measures the growth of each student
in Reading and Math by creating a MAP (Measure of Academic Progress) for each student.
This test is administered to every student 3rd through 10th grade in this district. This is a test of
approximately 45 questions and is a non-timed test.
Founded in 1973 in the Pacific Northwest of the U.S., the NWEA test is a formative
assessment and a reading tool this district has been using for over 20 years. The test adapts to
the student’s level as they take it, getting more difficult or easier, depending on the student’s
correct and/or incorrect answers. After taking the test, each student receives an individual RIT
score, or more clearly, an achievement score. This score indicates to the teacher what reading
level the student is at, what skills they have mastered, and what skills they need to continue to

20
develop in which areas. This test was used to analyze vocabulary development along with
Lexile reading level.
Summary
In this section, the history of educational reform both in the USA and also for ELs was
addressed. The academic English vocabulary used in high schools was discussed along with
the amount of time it takes ELs to develop their social and academic English needed to
succeed in school. High stake testing was presented specific to the NWEA/MAP test and the
limitations and challenges of high stake testing for ELs was reviewed.
Research Questions
1. Did the 2012 needs assessment and teacher training show a significant difference
in EL student GPA over the seven-year period?
2. Did the 2012 teacher training show a change in EL graduation rates over the 7-
year period?
3. Did the needs assessment and teacher training, which focused on building
academic language, help the vocabulary component of the NWEA/MAP reading
test for EL students?
4. Did the needs assessment and teacher training have an impact on EL students’
overall reading Lexile levels?

21
Chapter 3: Methodology
This chapter describes the methodology and the quantitative research design used to
collect data in this study. A description of the participants and how the data was collected and
analyzed is discussed.
Data Collection
Participants. There were 64 EL high-school students at a suburban high school
northwest of Minneapolis who participated in the study. Students were eligible for the study if
they: (1) had qualified for EL service during their high school years, (2) attended this high
school between the graduating years of 2009 through 2015. If they successfully exited the EL
program, or attended the Alternative high school (ALP), or qualified and attended a Post-
Secondary Education Option (PSEO), or dropped out of high school, they were also included
in the study. Students were excluded from the study if they moved away before graduating
and / or were receiving Special Education (SPED) services.
Students in the study came from a variety of linguistic backgrounds. The largest
populations of speakers were Spanish, Hmong, Lao, Russian, and Creole English. ELs in this
school district speak approximately 15 different languages at home, other than English.

22
Participant breakdown.
Class of 2009: 10 participants
Of these 10 participants, 5 were male and 5 were female. Five were Hispanic and 5 were
Asian.
Class of 2010: 7 participants
Of these 7 participants, 3 were male and 4 were female. Four were Hispanic, 2 were Black
and 1 was White.
Class of 2011: 10 participants
Of these 10 participants, 2 were male and 8 were female. Six were Hispanic, 3 were Asian
and 1 was White.
Male50%
Female50%
2009 GENDER
Asian50%
Hispanic 50%
2009 ETHNICITY
Male43%Female
57%
2010 GENDER
Black29%
Hispanic57%
White14%
2010 ETHNICITY
Male 20%
Female80%
2011 GENDER
Asian30%
Hispanic60%
White10%
2011 ETHNICITY
23
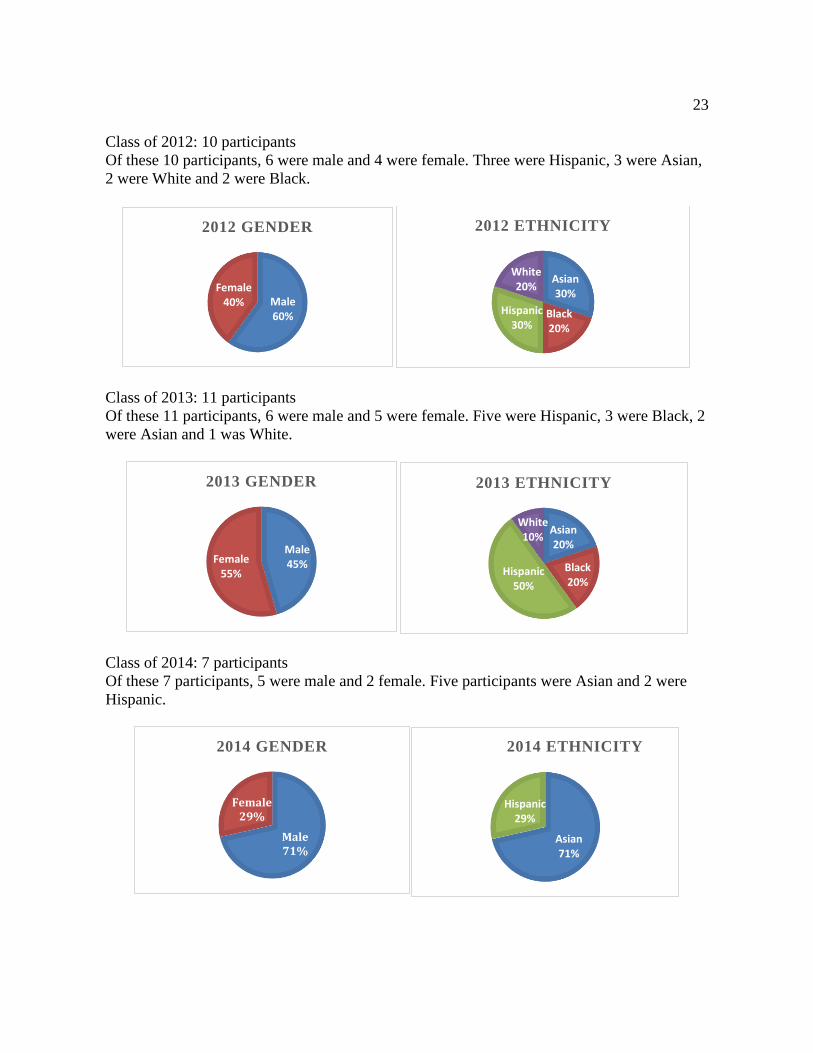
Class of 2012: 10 participants
Of these 10 participants, 6 were male and 4 were female. Three were Hispanic, 3 were Asian,
2 were White and 2 were Black.
Class of 2013: 11 participants
Of these 11 participants, 6 were male and 5 were female. Five were Hispanic, 3 were Black, 2
were Asian and 1 was White.
Class of 2014: 7 participants
Of these 7 participants, 5 were male and 2 female. Five participants were Asian and 2 were
Hispanic.
Male60%
Female40%
2012 GENDER
Asian30%
Black20%
Hispanic30%
White20%
2012 ETHNICITY
Male45%Female
55%
2013 GENDER
Asian20%
Black20%
Hispanic50%
White10%
2013 ETHNICITY
Male71%
Female29%
2014 GENDER
Asian71%
Hispanic29%
2014 ETHNICITY

24
Class of 2015: 9 participants
Of these 9 participants, 6 were male and 3 female. Two participants were Black, 5 were
Hispanic, and 2 were Asian.
Student data collection technique. Data was collected in two phases. First, the
students grade level, length of years at the high school, final grade point average at the end of
their senior year, graduation status (if they graduated or not), if they exited the EL program
(which requires them to pass their EL language assessment test by WIDA, maintain at least a
2.0 GPA and pass the MCA or NWEA standardized tests), their ethnicity and language
spoken at home were collected. These were all retrieved through the district’s information
storage system called Technology and Information Educational Services (TIES). As a teacher
in the district I am permitted access to view EL’s background information in the TIES system.
In 2010, the district changed data storage systems (from SASI to TIES) and I was granted
permission to have a senior administrative assistant along with the guidance office help
retrieve the information, mainly for EL students graduating in the years 2009 and 2010.
The second phase of data collection was specific to standardized test results. Student
reading achievement data was collected using the NWEA MAP assessment test, which was
administered during each student’s 10th and/or 11th grade year. Specific information from the
NWEA that was collected included their vocabulary score and their reading Lexile score.
Male67%
Female 33%
2015 GENDER
Black22%
Hispanic56%
Asian22%
2015 ETHNICITY
25
The NWEA standardized test was chosen over other tests including the MCA, the
PLAN test, and the ACCESS test for a variety of reasons. First, the Minnesota Common
Assessment (MCA) test changed from MCA II to MCA III in 2013, making the direct
comparison over the 7 years, more complicated and potentially inconsistent. The PLAN test (a
precursor to the national ACT test) was eliminated from further analysis due to the timed
nature of the test, which ultimately does not show reading or vocabulary development in EL
students since they are cut off from answering the questions after their time limit is up. The
ACCESS test was also eliminated from the testing data collected because the state of
Minnesota officially began administering this test in the spring of 2012, and the data collected
for this study began in 2009, thus not allowing the full 7 years of data to be analyzed. The
NWEA was the only standardized reading test that has consistently been administered to all
students at this high school during the whole 7-year timeframe, between 2009 and 2015, with
minor changes to the test format.
All information gathered from the TIES system: graduation year for each EL student,
length of LEP service in our district, ethnicity, overall GPA, graduation rate per class over the
7-year period, NWEA information including average RIT score per graduating class, average
vocabulary level per graduating class, average Lexile reading level per graduating class was
manually entered into a Microsoft Excel spreadsheet.
Procedure
Independent variables. The procedure of the study was as follows. Throughout the
school year, new student information such as U.S. entry, school entry date, language
proficiency, grade level, EL status, Special Education status, and qualification for free or

26
reduced lunch, and other notes are entered into TIES by individual schools’ secretaries and
guidance office personnel. This information comes directly from the parents or guardians
completing the registration forms. Students who are previously enrolled in the district have
their information updated annually.
These EL enrollments only qualified for selection if the students did not qualify for
SPED and they were at the high school, without moving away. This information was coded
into an excel spreadsheet.
An independent variable is defined in statistics as a variable in an experiment in which
the experimenter manipulates to observe its relationship with another quantity (Collins
English Dictionary, 2010). In this data set, the instruction received by teachers who went
through the 2010-2012 EL Needs Assessment training was the independent variable. These
selected teachers were supposed to disseminate this training to the rest of their department and
incorporate it into their classes.
Dependent variables. After gathering independent variables and entering them into
the Excel software, the process of retrieving and entering dependent variables continued:
student graduation rate percentage, students GPA average by class at graduation, students EL
status (exit, ALP, or drop-out). Additional dependent variables collected included information
from the NWEA MAP test, which is taken every winter, such as students’ individual
vocabulary scores and reading Lexile scores.
A dependent variable is the event (here the MAP scores along with the GPA and
graduation rates) studied and anticipated to change according to the independent variables
(Collins English Dictionary, 2010). All students in grades 9 and 10 are required by the district
27
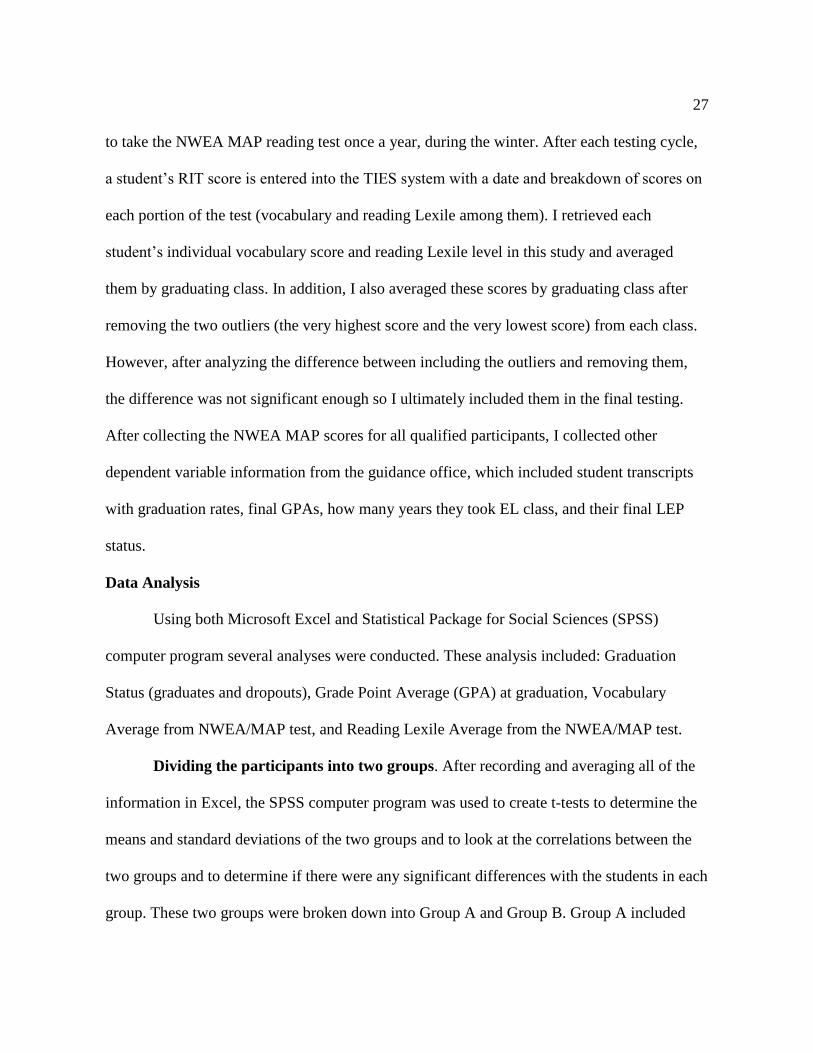
to take the NWEA MAP reading test once a year, during the winter. After each testing cycle,
a student’s RIT score is entered into the TIES system with a date and breakdown of scores on
each portion of the test (vocabulary and reading Lexile among them). I retrieved each
student’s individual vocabulary score and reading Lexile level in this study and averaged
them by graduating class. In addition, I also averaged these scores by graduating class after
removing the two outliers (the very highest score and the very lowest score) from each class.
However, after analyzing the difference between including the outliers and removing them,
the difference was not significant enough so I ultimately included them in the final testing.
After collecting the NWEA MAP scores for all qualified participants, I collected other
dependent variable information from the guidance office, which included student transcripts
with graduation rates, final GPAs, how many years they took EL class, and their final LEP
status.
Data Analysis
Using both Microsoft Excel and Statistical Package for Social Sciences (SPSS)
computer program several analyses were conducted. These analysis included: Graduation
Status (graduates and dropouts), Grade Point Average (GPA) at graduation, Vocabulary
Average from NWEA/MAP test, and Reading Lexile Average from the NWEA/MAP test.
Dividing the participants into two groups. After recording and averaging all of the
information in Excel, the SPSS computer program was used to create t-tests to determine the
means and standard deviations of the two groups and to look at the correlations between the
two groups and to determine if there were any significant differences with the students in each
group. These two groups were broken down into Group A and Group B. Group A included

28
graduating classes from 2009 through 2012 with 37 participants; students who graduated
before and during the needs assessment and teacher training, who were not affected by the
teacher training. Group B included graduating classes from 2013 through 2015 involving
students after the training was finished. The date of 2012 was a pivoting point in this study
since students after that date were receiving instruction from teachers who had received the
EL teacher training, which had stemmed from the needs assessment.
As data were collected, these questions continued to be examined:
1. Is the difference between the means of the two samples groups different enough to
determine whether some other variable(s), such as the training that was offered
after the EL needs assessment, could have caused the difference?
2. Did the EL training which showed how to create and incorporate language
objectives and the mainstream teachers who went through the training, have an
impact on the student’s academic performance in class (GPAs) and/or on the
vocabulary component or the reading Lexile level demonstrated on the NWEA
reading test?
3. Was there a significant difference between Group A and Group B when it came to
final GPA’s, graduation rates, vocabulary test results or reading Lexile level?
Significance. Correlations (2-tailed) were done to determine if any significance
existed below the .05 level. In statistics, “significant” means probably true. Significance
levels shows how likely a pattern in the data is due to chance. The most common level is .95,
meaning that the finding has a 95% chance of being true. However, in statistics, instead of
being displayed as .95 it will show as .05, meaning the finding has a 5% (.05) chance of not
29
being true, which is the opposite of a 95% chance of being true. For example, if p = .01 it
means there is a 99% chance of it being true. If p < .05 (which is the most common level
used), then there is a 95% or more chance of it being true (Nunan & Bailey, 2009).
Summary
The overall methodology and research design of this quantitative study is to determine
if the needs assessment and teacher training made a significant difference in academic
performance of the ELs at this high school. A description of the participants along with how
the data was collected and how it was analyzed were shared.
30
Chapter 4: Results
This study took place in a northwest suburb of a metropolitan area in the upper
Midwest of the United States. Participants included sixty-four high school EL students, who
graduated between 2009 and 2015. Data were collected to determine if there have been any
trends over the past 7 years regarding academic performance of these high school EL
students. Graduation rates, grade point averages and NWEA standardized test scores were
gathered from the data storage information system used in this district called TIES. Students
qualifying for EL services during their high school years (excluding special education
students and students who moved away during high school) were included in the study. From
TIES, this information was recorded and coded into Microsoft Excel then entered in the
statistical analysis tool of SPSS. Test results were divided into two groups, students
graduating between 2009 through 2012 (Group A) and students graduating between 2013
through 2015 (Group B). The mean and standard deviation were found for both groups using
the four research questions, then t-tests were conducted to determine if any significant
differences existed between Group A and Group B.
Research Question 1. Did the 2012 needs assessment and teacher training show a
significant difference in EL student grade point average over the 7-year period?
A slight decrease in grade point average between Group A (2.46) and Group B (2.35),
as reflected in Tables 1 and 2 below, was observed in the results. After entering this
information into SPSS, no significant difference in GPA was found between Group A and
Group B (p = .453).

31
A slight decrease, as reflected in Table 1, was observed in the overall GPA mean over
the 7-year period. The standard deviation is higher in 2010 (.680006) and 2013 (.646074),
which indicates the scores are spread wider around the mean. In 2010, three students earned a
GPA over 3.0 (one student as high as 3.281) and one student earned a GPA lower than a 2.0
(with a 1.28). In 2013, two students earned a GPA over 3.5 (3.61 and 3.822) and two students
earned a GPA below 2.0 (1.961 and 1.928).
Table 1
Final GPA, All Students
Class of Mean N Std. Deviation
2009 2.47980 10 .506387
2010 2.65257 7 .680006
2011 2.53760 10 .572293
2012 2.24390 10 .525821
2013 2.52355 11 .646074
2014 2.23714 7 .541251
2015 2.24144 9 .551567
Total 2.41833 64 .568841
Table 2 below compares the final grade point average of the two groups, the Before
and Including Training Group (Group A: 2009-2012) and the After Training Group (Group B:
2013-2015). As mentioned, there was a slight decrease in the overall GPA mean between the
two groups.
Table 2
Group Statistics of GPA before and after 2012 Training
Training N Mean Std. Deviation
Final GPA Before & Including Training 37 2.46435 .560466
After Training 27 2.35526 .584788

32
After the mean and standard deviation were found between the two groups, Levene’s
test for equality of variances was performed which determined equal variances between the
groups were assumed.
Table 3
Final GPA t-test
t-test for Equality of Means
t df Sig. (2-tailed)
Mean
Difference
Final GPA Equal variances assumed .755 62 .453 .109092
Table 3 shows the significance between Group A and Group B as p = .453. The two
groups were not statistically significantly different.
While Table 1 shows a slight decrease in the overall GPA mean during the 7-year
period, Table 2 shows a decrease in GPA between the mean of Group A and Group B. After
the t-test was performed using the mean and standard deviation of these two groups, Table 3
shows no statistical significant difference between the two groups.
Research Question 2. Did the 2012 teacher training show a change in graduation
rates over the 7-year period?
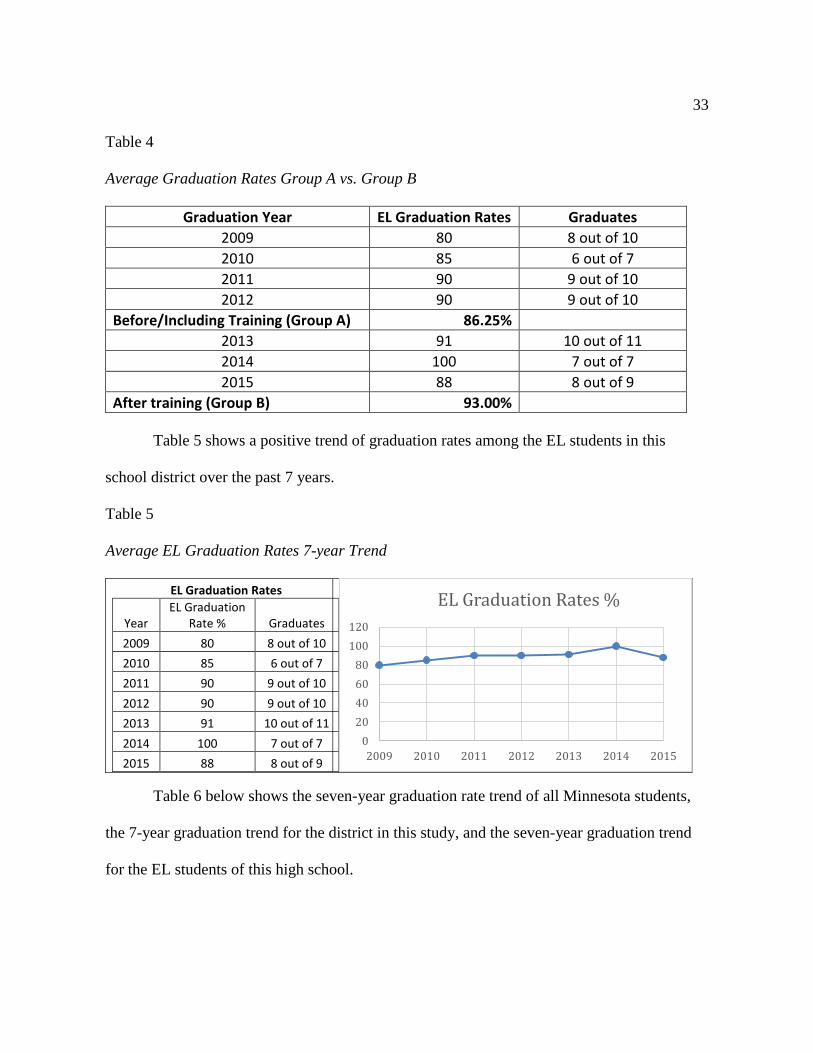
Tables 4 and 5 show a positive trend of graduation rates among the EL students in this
school district. Table 4 shows an increase in the graduation rates from the mean of Group A to
the mean of Group B rose from approximately 86% to 93%, an almost 7% increase in
graduation rates of EL students in this district.
33
Table 4
Average Graduation Rates Group A vs. Group B
Graduation Year EL Graduation Rates Graduates
2009 80 8 out of 10
2010 85 6 out of 7
2011 90 9 out of 10
2012 90 9 out of 10
Before/Including Training (Group A) 86.25%
2013 91 10 out of 11
2014 100 7 out of 7
2015 88 8 out of 9
After training (Group B) 93.00%
Table 5 shows a positive trend of graduation rates among the EL students in this
school district over the past 7 years.
Table 5
Average EL Graduation Rates 7-year Trend
EL Graduation Rates
Year EL Graduation
Rate % Graduates
2009 80 8 out of 10
2010 85 6 out of 7
2011 90 9 out of 10
2012 90 9 out of 10
2013 91 10 out of 11
2014 100 7 out of 7
2015 88 8 out of 9
Table 6 below shows the seven-year graduation rate trend of all Minnesota students,
the 7-year graduation trend for the district in this study, and the seven-year graduation trend
for the EL students of this high school.
0
20
40
60
80
100
120
2009 2010 2011 2012 2013 2014 2015
EL Graduation Rates %

34
Table 6
7-year Graduation Trend per MN Report Card
Graduating Year State of Minnesota
Graduation Rate
District overall Graduation
Rate
District EL Graduation
Rate
2009 82.6% Not available 80%
2010 80.4% 93.9% 85%
2011 77.2% 96.4% 90%
2012 77.9% 96% 90%
2013 79.8% 98% 91%
2014 81.2% 98% 100%
2015 81.9% 98.6% 88%
Mean 80.14% 96.82% 89.14%
Standard Deviation 1.85 1.6 5.67
While the high school EL students in this district continue to be out-performed by
their mainstream peers, they are graduating at a higher rate than their peers within the greater
state of Minnesota. The 7-year graduation rate mean for the state of Minnesota came in at
80.14% while the EL graduation rate in this district averaged 9% higher than the state.
Research Question 3. Did the needs assessment and teacher training, which focused
on building academic language, help the vocabulary component of the NWEA/MAP reading
test?
Even though the mean increased slightly between Group A (218.17) and Group B
(221.16), there was no statistical significance (p = .260) within the vocabulary means between
the two groups.
Table 7 below shows a positive trend over the seven-year period regarding the
vocabulary scores on the annual NWEA reading test. The years of 2011, 2014, and 2015 had
one vocabulary score (each year) missing from the data set. For example, during the
graduating year of 2011 there were 10 participants in the study, however one participant’s
vocabulary score in TIES was not available. This information was missing from the TIES

35
Learning Management System within the district. Based on the average RIT score on the
NWEA test from each of these three students, the missing vocabulary score was eliminated
from the overall average so it would not positively or negatively sway the results.
The year 2012 shows an unusually high standard deviation of 20.232, nearly double
that of any other year tested during the 7-year period. The vocabulary scores from 2012
ranged from 180 to 240, with the average coming in at 214.7.
Table 7
Vocabulary Scores of All EL Students
Class of Mean N Std. Deviation
2009 219.00 10 10.934
2010 219.00 7 8.266
2011* 220.44 9 10.713
2012 214.70 10 20.232
2013 218.82 11 6.014
2014* 222.67 6 9.374
2015* 223.25 8 6.018
Total 219.39 61 11.227
* missing vocabulary score from TIES
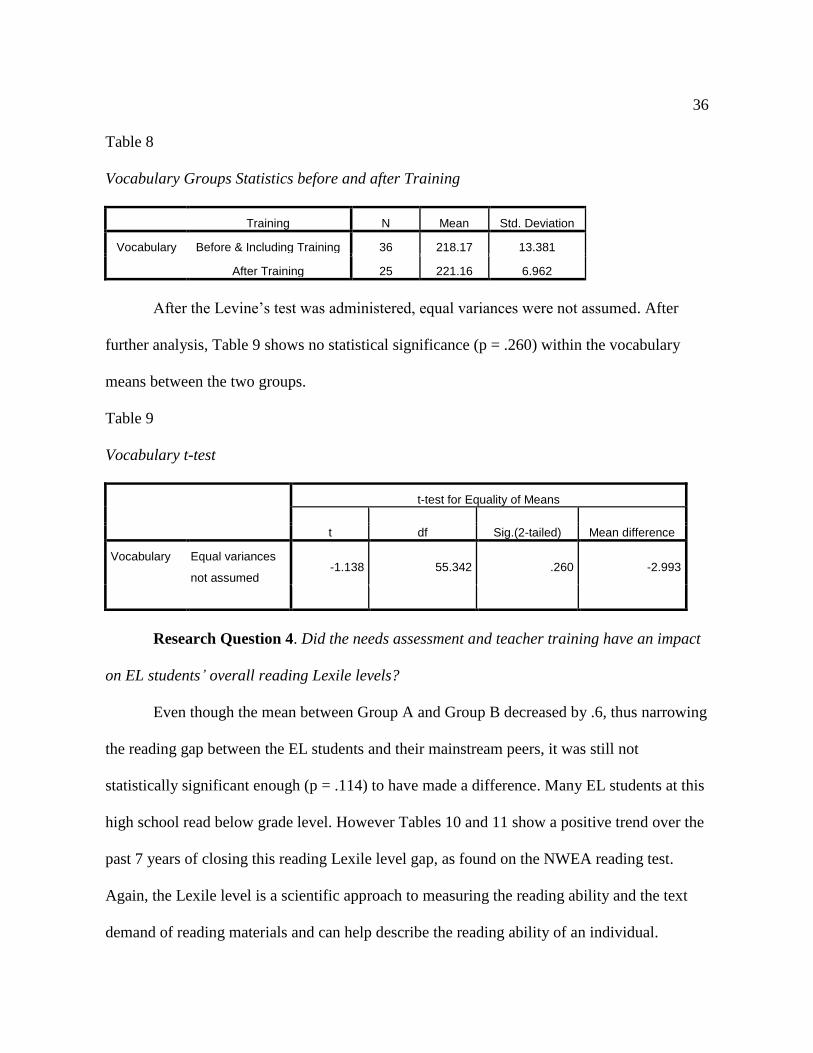
Table 8 shows the overall mean difference between the two groups, before the training
occurred and after the training was over. The overall mean difference in vocabulary scores
between Group A and Group B increased by almost 3 points (2.99) meanwhile the standard
deviation spread decreased from 13.381 in Group A (before and during training) to 6.962 in
Group B.
36
Table 8
Vocabulary Groups Statistics before and after Training
Training N Mean Std. Deviation
Vocabulary Before & Including Training 36 218.17 13.381
After Training 25 221.16 6.962
After the Levine’s test was administered, equal variances were not assumed. After
further analysis, Table 9 shows no statistical significance (p = .260) within the vocabulary
means between the two groups.
Table 9
Vocabulary t-test
t-test for Equality of Means
t df Sig.(2-tailed) Mean difference
Vocabulary Equal variances
not assumed -1.138 55.342 .260 -2.993
Research Question 4. Did the needs assessment and teacher training have an impact
on EL students’ overall reading Lexile levels?
Even though the mean between Group A and Group B decreased by .6, thus narrowing
the reading gap between the EL students and their mainstream peers, it was still not
statistically significant enough (p = .114) to have made a difference. Many EL students at this
high school read below grade level. However Tables 10 and 11 show a positive trend over the
past 7 years of closing this reading Lexile level gap, as found on the NWEA reading test.
Again, the Lexile level is a scientific approach to measuring the reading ability and the text
demand of reading materials and can help describe the reading ability of an individual.
37
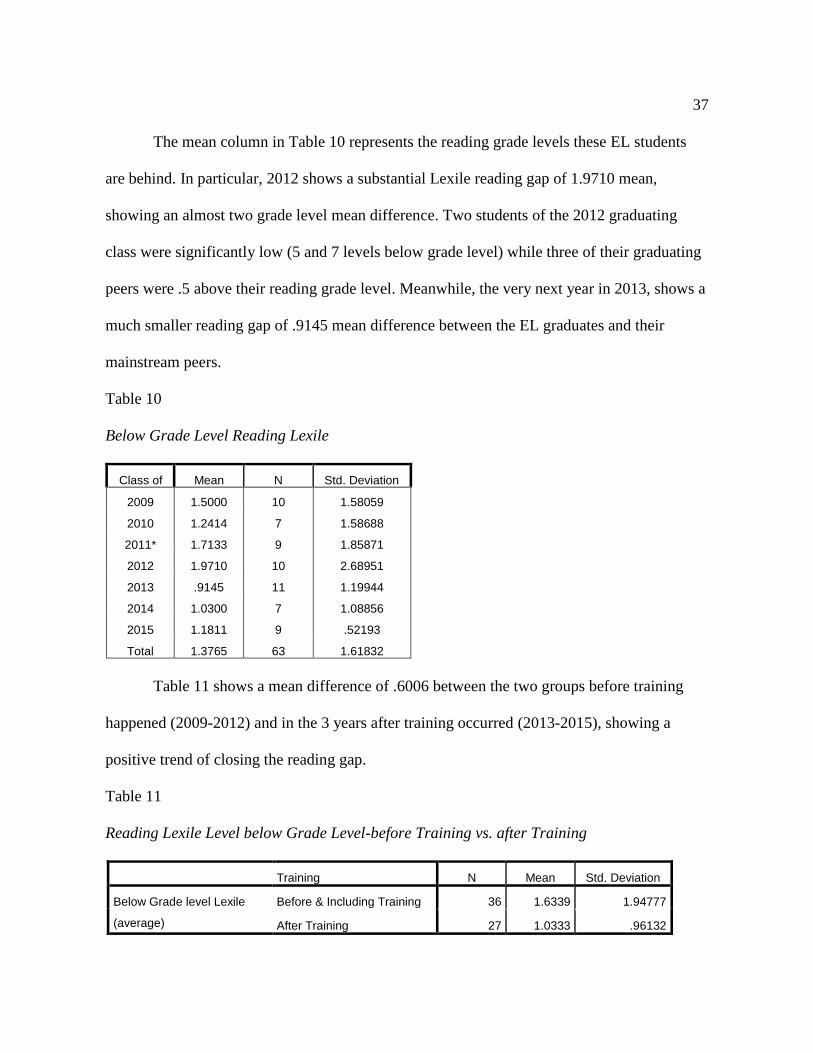
The mean column in Table 10 represents the reading grade levels these EL students
are behind. In particular, 2012 shows a substantial Lexile reading gap of 1.9710 mean,
showing an almost two grade level mean difference. Two students of the 2012 graduating
class were significantly low (5 and 7 levels below grade level) while three of their graduating
peers were .5 above their reading grade level. Meanwhile, the very next year in 2013, shows a
much smaller reading gap of .9145 mean difference between the EL graduates and their
mainstream peers.
Table 10
Below Grade Level Reading Lexile
Class of Mean N Std. Deviation
2009 1.5000 10 1.58059
2010 1.2414 7 1.58688
2011* 1.7133 9 1.85871
2012 1.9710 10 2.68951
2013 .9145 11 1.19944
2014 1.0300 7 1.08856
2015 1.1811 9 .52193
Total 1.3765 63 1.61832
Table 11 shows a mean difference of .6006 between the two groups before training
happened (2009-2012) and in the 3 years after training occurred (2013-2015), showing a
positive trend of closing the reading gap.
Table 11
Reading Lexile Level below Grade Level-before Training vs. after Training
Training N Mean Std. Deviation
Below Grade level Lexile
(average)
Before & Including Training 36 1.6339 1.94777
After Training 27 1.0333 .96132

38
Table 12 shows a t-test to establish significance between Group A and Group B.
Though the significance was smaller (p = .114), it was still not strong enough to be considered
statistically significant between Group A and Group B.
Table 12
Reading Lexile Level below Grade Level t-test
t-test for Equality of Means
t df Sig.(2-tailed) Mean difference
Vocabulary Equal variances
not assumed 1.607 53.789 .114 .60056
As demonstrated, many EL students at this high school read below grade level.
Although the mean between Group A and Group B decreased by .6, indicating the reading gap
may be closing among the ELs in this district, it was still not statistically significant enough
(p = .114) to have made a difference.

39
Chapter 5: Conclusion
This study took place in a public high school in an outer suburb of a metropolitan area
in the upper Midwest of the United States. Data from 64 EL students at this high school, all in
graduating classes between 2009 and 2015, were collected to determine if there have been any
trends over the past 7 years in the academic performance of these high school EL students.
Information such as GPAs, class graduation rates and reading information (specific to
vocabulary and reading Lexile level) were collected from the NWEA/MAP test scores to
determine these trends.
The purpose of this study was to determine if the achievement gap between EL
students and their mainstream peers has changed over the past seven years. The four research
questions that were investigated in this study provided useful insight in determining if the EL
teacher training of 2012 made an impact on this district’s EL students’ academic performance
in class (GPAs), their graduation rate trends, and the vocabulary component and reading
Lexile level as demonstrated on their NWEA standardized reading tests.
Research Questions
Research Question 1. Did the 2012 needs assessment and teacher training show a
significant difference in EL student GPA over the 7-year period?
As mentioned, there has been a slight decrease in overall GPA of our EL students at
the high school level over the past 7 years. Statistically, the 2-tailed significance came in at
.45, which is well above the .05 significance breakpoint. This could be due to a variety of
reasons. In 2010, Minnesota revised its standards and in 2012-2013 implemented these higher
Common Core standards into the curriculum requirements. Another reason the GPA average
40
might be slightly lower than expected is due to the limited number of participants in this
study. Just two or three students in one graduating class can significantly affect the results
with high or low GPAs.
Research Question 2. Did the 2012 teacher training show a change in EL graduation
rates over the 7-year period?
It is encouraging to see that the graduation rates of the EL students at this high school
continue to increase. Group A graduation average was 86% and Group B’s graduation rate
came in at 93%, an increase of 7%. Though a gap between the EL and mainstream students at
this high school still exists, it is motivating to see the EL graduation rates in this district
surpassing the state of Minnesota’s regular graduation rate.
According to Minnesota’s Department of Education, its goal by 2020 is to see the state
graduation rate over 90%. In 2014, this districts EL graduation reached a perfect 100%, with
all seven of its remaining EL/LEP students graduating on time. In 2015, with just one EL
student dropping out in the spring of his senior year, it decreased the graduation rate to 88%
(8 out of 9 graduates). When dealing with low EL student numbers, it’s significant how much
one student can change the graduation rate of this district’s EL graduating class.
Research Question 3. Did the needs assessment and teacher training, which focused
on building academic language, help the vocabulary component of the NWEA/MAP reading
test?
According to the NWEA/MAP reading results specific to vocabulary, there has been a
positive growth among our EL student population at the high school. The overall mean
difference in vocabulary scores between Group A and Group B increased by almost 3 points;

41
meanwhile the standard deviation spread decreased by over 6 points (from approximately 13.4
to approximately 7.0). Although there was no statistical significance between Group A and
Group B vocabulary scores (p = .26), there appears to be some improvement as shown with
the mean scores between the two groups.
Research Question 4. Did the needs assessment and teacher training have an impact
on EL students’ overall reading Lexile levels?
Over the past 5 years, a big push has been made in this district to increase our students
reading skills, with both mainstream students and special groups such as EL. When choosing
books to read with students, the Lexile level is often used which determines what grade level
range the reading material is at. Unfortunately, by the time some of these ELs are seniors, the
reading gap is as high as 5 or more years behind their peers, which will create additional
challenges for post-secondary education when asked to synthesize and analyze reading
material. After analyzing the reading levels of these EL students over the past 7 years, it is
exciting to see the reading gap is narrowing. Over the past 3 years, there is approximately a 1-
year grade level gap (1.03) between the EL graduates and the mainstream students in this
district. This is an improvement from the Lexile gap in 2011 and 2012 where it was close to
two grade levels lower.
Findings
One surprising finding with the GPA statistics between the two groups was a slight
decrease in GPA between the earlier Group A, graduating between 2009-2012 receiving an
overall mean of 2.46 GPA and later Group B, graduating between 2013-2015, receiving an
overall GPA mean of 2.35. Because the graduating classes of EL students are so small at this
42
high school (ranging from 7-11 students each year) just a couple of students can greatly sway
these results.
One interesting finding was that the graduation rates of the EL students at this high
school continue to out-perform the state of Minnesota’s average graduation rates. According
to the Minnesota Report Card, as published by the Minnesota Department of Education, this
district’s EL student population has out-performed the overall MN graduation rates for the
past 6 years (ranging anywhere between 5% to 19% higher). Even though the graduation rates
of the EL students in this district continue to rise, they are still well below their mainstream
peers in the same district (ranging between 6% to 10% below their peers). Note that the
graduation rates of the mainstream in this district are among the very highest in the state, at
98% in 2015 compared to 81.9% mainstream graduation rate for the state of Minnesota in
2015.
Two encouraging findings show a mean increase both in our EL students’ academic
vocabulary and in our EL students’ reading Lexile levels as found on the NWEA/MAP
standardized reading test. Though more work and training are continually needed, it is still
rewarding to see that the district’s EL teacher training effort in 2012 which focused on
building academic vocabulary in the content areas and the high school building’s 2015-2016
staff goal “to deliberately use teaching strategies to increase critical literacy” has helped to
increase the average academic vocabulary scores and reading lexile level increase over the
recent years.
43
Conclusion
Although it is a small study, the results provided useful insight into our EL students’
overall academic performance. What is especially interesting is that while there was a
somewhat positive increase in the average between the teacher training administered district-
wide with the vocabulary test scores and the reading Lexile levels over the past 7 years,
statistically, there was no significant difference between the groups; however when looking at
the means of the two groups, Group B showed stronger numbers. The correlation was not
significant with the EL students’ overall GPA at graduation and the mean between the two
groups showed a slight decrease. This seems to indicate that the training was somewhat
effective specifically with building academic vocabulary and overall reading strategies,
however it may not have been directly transferred into the actual grades (GPA) the EL
students earned in their mainstream classes. After working with high school aged students, I
have often observed that the GPAs they earn in their classes do not necessarily reflect how
hard they work. As many realize, there is a lot more that should be evaluated and reviewed
when looking at a student’s overall academic abilities then just their grade point average.
Further Research
Future studies that could provide additional insights into the understanding of how to
help the academic performance of high school EL students would be to continue looking at
strategies of how to help EL students increase their GPAs during their high school years since
it plays a significant part in post-education acceptance.
Statistically, the training effort did not make a difference in the EL achievement over
the past 7 years. Perhaps a larger EL student population giving more participants as well as
44
more time analyzing future classes is needed. However, when looking at the averages of the
EL students over the years, there are very positive steps that have been accomplished in this
EL program. Not only did the EL graduation rates rise, the academic vocabulary became
stronger, and the reading Lexile level gap decreased, but the overall EL program support and
the partnerships between mainstream and EL colleagues grew substantially in this district.
45
References
Abedi, J. (2008). Measuring students’ level of English proficiency: Educational significance
and assessment requirements. Educational Assessment, 13(2-3), 193-214.
doi:10.1080/10627190802394404
Abedi, J., & Levine, H. G. (2013). Fairness in assessment of English learners. Leadership,
42(3), 26-38.
Abedi, J., Leon, S., & Mirocha, J. (2003). Impact of student language background on content-
based performance: analysis of extant data (CSE Report 603). Los Angeles, CA:
University of California, National Center for Research on Evaluation, Standards, and
Student Testing.
Bassiri, D., & Allen. (2012). Grade 8 to 12 academic growth patterns for English language
learners and students with disabilities. ACT Research Report Series, 2012(1). Iowa
City, IA: ACT, Inc.
Collier, V. (1987). Age and rate of acquisition of second language for academic purposes.
TESOL Quarterly, 21(4), 617-641.
Collier, V., & Thomas, W. (2007). Predicting second language academic success in English
using the prism model. In J. Cummins & C. Davison (Eds.), International handbook of
English language teacher, part 1 (pp. 333-348). New York, NY: Springer.
Collins English Dictionary. (2010). (Complete and unabridged 10th ed.). Independent
variable; dependent variable. Retrieved December, 2015, from Dictionary.com
website: http://dictionary.reference. com/browse/independent variable.
46
Cook, H. G., Linquanti, R., Chinen, M., & Jung, H. (2012). National evaluation of Title III
implementation supplemental report: Exploring approaches to setting English
language proficiency performance criteria and monitoring English Learner progress.
Washington DC: US Department of Education, Office of Planning, Evaluation and
Policy Development.
Cummins, J. (1979). Cognitive/academic language proficiency, linguistic interdependence,
the optimum age question and some other matters (working papers on bilingualism).
The Ontario Institute for Studies in Education.
Cummins, J. (1981). Age on arrival and immigrant second language learning in Canada: A
reassessment. Applied Linguistics, 2, 132-149.
Cummins, J. (1999). BICS and CALP: Clarifying the distinction (opinion paper). University
of Toronto.
Dessoff, A. (2008). Diagnostic testing. District Administration, 44(4), 42-45. Retrieved from
Academic Search Premier database.
Droop, M., & Verhoeven, L. (2003). Language proficiency and reading ability in first and
second language learners. Reading Research Quarterly, 38(1), 101-103.
Enright, K. A. (2011). Language and literacy for new mainstream. American Educational
Research Journal, 48(1), 80-118. doi: 10.3102/0002831210368989
Gottardo, A., & Mueller, J. (2009). Are first and second language factors related in predicting
second language reading comprehension? A study of Spanish-speaking children
acquiring English as a second language from first to second grade. Journal of
Educational Psychology, 101(2), 330-344. doi: 10.1037/a0014320

47
Kato, K., Albus, D., Liu, K., Guven, K., Thurlow, M., National Center on Educational
Outcomes, M. M., & ... National Association of State Directors of Special Education,
W. D. (2004). Relationships between a Statewide Language Proficiency Test and
Academic Achievement Assessments. LEP Projects Report 4. National Center on
Educational Outcomes, University of Minnesota.
Lloyd, S. C. (2012). As new federal rules kick in on graduation rates, states change their
calculations. Education Week, 31(34), 27.
Menken, K. (2010). NCLB and English language learners: Challenges and consequences.
Theory into Practice, 49(2), 121-128. doi:10.1080/00405841003626619
MetaMetrics. (2015). The Lexile® framework for reading. Retrieved from
http://www.lexile.com/about-lexile/lexile-overview/lexile-infographic/.
Minnesota Department of Administration. (2010a). Immigrants to Minnesota by region and
selected country of birth. Retreived from http://www.demography.state.mn.us/
resource.html?Id=18679.
Minnesota Department of Education. (2010b). 2009-2010 Minnesota assessments:
Interpretive guide. Retrieved from http://education.state.mn.us.MDE/Accountability_
Programs/Assessment_and_Testing/Assessments/MCA/Reports/index.htm.
Minnesota Department of Education. (2015a). Eligibility for English learner services.
Retreived from http://education.state.mn.us/MDE/JustParent/EngLearn/index.html.
Minnesota Department of Education. (2015b). Title III. Retrieved from http://education.
state.mn.us/MDE/SchSup/ESEA/TitleIII/.
48
Nunan, D., & Bailey, K. (2009). Exploring second language classroom research: A
comprehensive guide. Boston, MA: Heinle, Cengage Learning.
Saville-Troike, M. (1984). What really matters in second language learning for academic
achievement? TESOL Quarterly, 18(2), 199-219.
Shore, J., & Sabatini, J. (2009). English Language learners with reading disabilities: A
review of the literature and the foundation for a research agenda. Princeton, NJ: ETS.
U.S. Department of Education. (2004). Elementary and Secondary Education Act. Retrieved
from http://www.ed.gov/esea.
U.S. Department of Education. (2009). Standards and assessments peer review guidance:
Information and examples for meeting requirements of the No Child Left Behind Act of
2001. Retrieved from http:/www2.ed.gov/policy/elsec/guid/saaprguidance.pdf.
U.S. Department of Education Blog. (2008). More states with high graduation rates.
Retrieved from www.ed.gov/blog/2014/11/more-states-with-high-graduation-rates/.
WIDA. (2015). Enhancing opportunities for language learners. Retrieved from
www.wida.us.
Wright, W. E. (2007). A catch-22 for language learners. Educational Leadership, p. 14.
Zubrzycki, J. (2012, December 4). New graduation rates posted for most states. Education
Week Spotlight, 32(13), 26.
Zucker, S. (2003). Fundamentals of standardized testing. Harcourt Assessment Report.
Retrieived from http://images.pearsonclinical.com/images/PDF/assessmentReports/
FundamentalsofStandardizedTesting_Final.pdf.
49
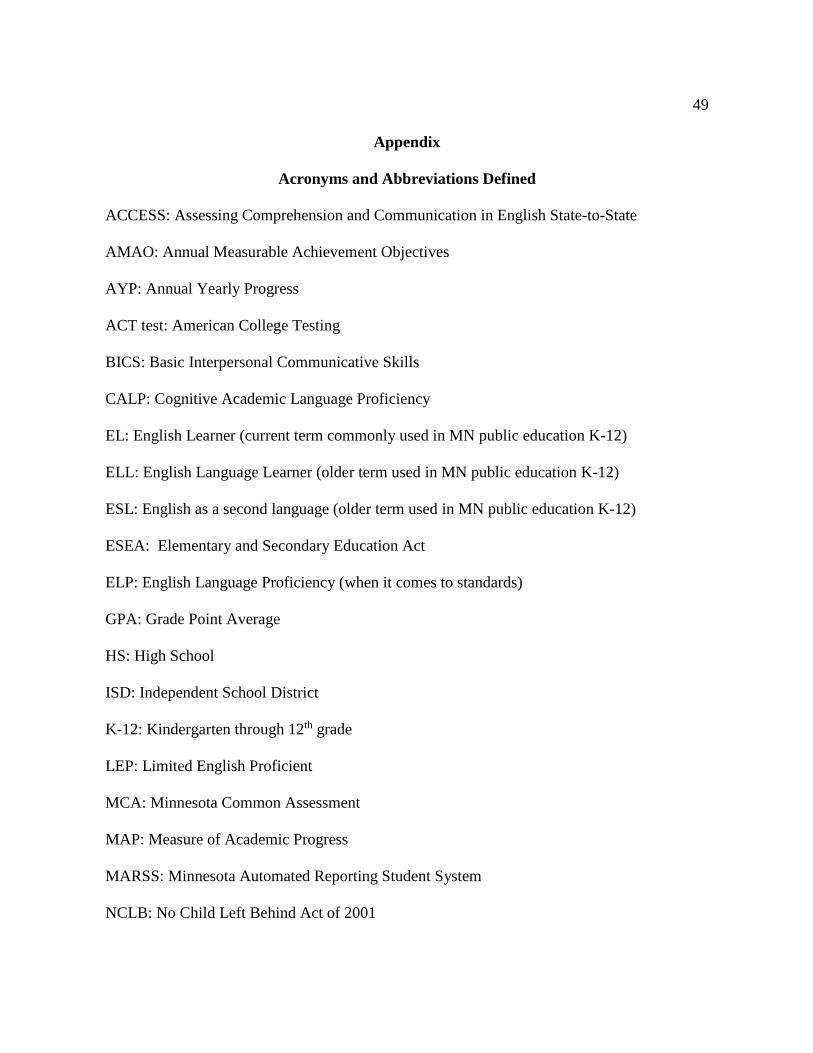
Appendix
Acronyms and Abbreviations Defined
ACCESS: Assessing Comprehension and Communication in English State-to-State
AMAO: Annual Measurable Achievement Objectives
AYP: Annual Yearly Progress
ACT test: American College Testing
BICS: Basic Interpersonal Communicative Skills
CALP: Cognitive Academic Language Proficiency
EL: English Learner (current term commonly used in MN public education K-12)
ELL: English Language Learner (older term used in MN public education K-12)
ESL: English as a second language (older term used in MN public education K-12)
ESEA: Elementary and Secondary Education Act
ELP: English Language Proficiency (when it comes to standards)
GPA: Grade Point Average
HS: High School
ISD: Independent School District
K-12: Kindergarten through 12th grade
LEP: Limited English Proficient
MCA: Minnesota Common Assessment
MAP: Measure of Academic Progress
MARSS: Minnesota Automated Reporting Student System
NCLB: No Child Left Behind Act of 2001

50
NWEA: Northwest Evaluation Association
PLAN test: No abbreviation found, but part of the ACT test suite
RIT: Rasch Unit score used in the MAP/NWEA test equal-interval vertical scale
SIOP: Sheltered Instruction Observation Protocol
STMA: Saint Michael / Albertville
TIES: learning management system that district 885 uses for grade entry, test entry,
attendance, etc.
WIDA: Originally stood for Wisconsin, Delaware and Alabama, but later changed the
acronym to stand for World-Class Instructional Design and Assessment.