a short-term negative eddy feedback on midlatitude … · a short-term negative eddy feedback on...
TRANSCRIPT

A Short-Term Negative Eddy Feedback on Midlatitude Jet Variabilitydue to Planetary Wave Reflection
GWENDAL RIVIÈRE AND LOÏC ROBERT
Laboratoire de Météorologie Dynamique/IPSL, Ecole Normale Supérieure/CNRS/UPMC, Paris, France
FRANCIS CODRON
LOCEAN/IPSL, Université Pierre et Marie Curie/CNRS/IRD, Paris, France
(Manuscript received 8 March 2016, in final form 20 June 2016)
ABSTRACT
A three-level quasigeostrophic model on the sphere is used to identify the physical nature of the negative
planetary wave feedback on midlatitude jet variability. A first approach consists of studying the nonlinear
evolution of normal-mode disturbances in a baroclinic westerly zonal jet. For a low-zonal-wavenumber dis-
turbance, successive acceleration and deceleration of the jet occur as a result of reflection of the wave on
either side of the jet. The planetary wave deposits momentum in opposite ways during its poleward or
equatorward propagation. In contrast, a high-zonal-wavenumber disturbance is not reflected but absorbed
within the subtropical critical layer. It thus only induces poleward momentum fluxes, which accelerate the jet
and shift it slightly poleward. A long-term simulation forced by a relaxation toward a zonally symmetric
temperature profile is then analyzed. Planetary waves are shown to be baroclinically excited. When they
propagate equatorward, they induce an acceleration of the jet together with a slight poleward shift. About
two-thirds of the planetary waves are absorbed by the subtropical critical layer, which allows the accelerated
poleward-shifted jet to persist for a while. For the remaining third, the potential vorticity equatorward of the
jet is so well homogenized that a reflection occurs. It is followed by an abrupt jet deceleration during the
subsequent poleward propagation. The reflection of planetary waves on the poleward side of the jet is more
systematic because of the quasi-permanent presence of a turning latitude there. This negative planetary wave
feedback is shown to act more on pulses of the jet than on its latitudinal shifts.
1. Introduction
Midlatitude jet variability is usually described using
the leading empirical orthogonal function (EOF) of the
zonally averaged zonal wind, sometimes called the zonal
index (Yu and Hartmann 1993; Feldstein and Lee 1998;
Gerber and Vallis 2007). This index is closely related to
the leading EOF of the tropospheric geopotential
height, the so-called annular mode introduced by
Thompson and Wallace (2000). These modes of jet
variability mainly represent latitudinal fluctuations of
the jet and are triggered by variations of the eddy mo-
mentum fluxes. The same eddy momentum fluxes also
act tomaintain the different phases of the leadingmodes
through a positive eddy feedback, which lasts a few
weeks after the peak of the phases (Robinson 1996,
2000; Lorenz and Hartmann 2001). As such, the positive
feedback increases the persistence of the leading modes
and accounts for their dominance: because it is present
mainly for latitudinal shifts of the jet and much less for
variations of its intensity, the eddy feedback explains
why the leading mode strongly projects onto the former
and much less onto the latter jet changes (Lorenz and
Hartmann 2001, 2003; Barnes and Hartmann 2011).
The positive eddy feedback is primarily due to syn-
optic, high-frequency waves whose momentum flux
convergence maintains the zonal wind anomalies even a
few weeks after their peak (Feldstein and Lee 1998;
Lorenz and Hartmann 2001). Several studies suggested
that the efficiency of the positive eddy feedback de-
creases with the mean jet latitude (Kidston and Gerber
2010; Barnes and Hartmann 2010). However, there is
still a debate on the exact nature of the positive synop-
tic eddy feedback (e.g., Robinson 2000; Lorenz and
Corresponding author address: Gwendal Rivière, LMD-ENS, 24
rue Lhomond, 75005 Paris, France.
E-mail: [email protected]
NOVEMBER 2016 R IV IÈRE ET AL . 4311
DOI: 10.1175/JAS-D-16-0079.1
� 2016 American Meteorological Society
Hartmann 2003; Robinson 2006; Barnes and Hartmann
2011; Zhang et al. 2012; Zurita-Gotor et al. 2014): some
studies emphasize the role of barotropic mechanisms
whereby a jet shift creates a change in the horizontal
propagation of the waves (e.g., Barnes and Hartmann
2011; Lorenz 2014). Some others focus on baroclinic
mechanisms in which the jet shift induces a change in the
latitude of the baroclinicity and thus a change in the
latitude of wave stirring, which in turn impacts the lati-
tude of momentum flux convergence (e.g., Robinson
2000; Zurita-Gotor et al. 2014). Others again propose
mixed barotropic–baroclinic mechanisms in which the
latitude of the lower baroclinicity determines the nature
of wave propagation at upper levels (Rivière 2009).
On the contrary, the planetary, low-frequency waves
act to hasten the short-term decay of the zonal wind
anomalies during the first week following their peak
(Feldstein and Lee 1998; Watterson 2002). By analyz-
ing observational datasets, Lorenz and Hartmann
(2003) showed that the jet acts as a waveguide for these
waves; so they propagate into the jet and remove mo-
mentum from it. This general behavior of planetary
waves is well reproduced in simple models (O’Rourke
and Vallis 2013). However, the underlying mechanisms
explaining the short-term damping effect of planetary-
scale waves on jet variability have not been deeply
examined in the literature, and studies discussing this
negative planetary eddy feedback (Lorenz and
Hartmann 2003; Simpson et al. 2014) are much less
numerous than for the positive synoptic eddy feedback.
And yet the difficulties encountered by climate models
in representing the annular mode variability might not
only come from a misrepresentation of the positive
synoptic feedback (Arakelian and Codron 2012;
Barnes and Polvani 2013) but also from a mis-
representation of planetary waves and their negative
feedback (Simpson et al. 2014). There is therefore a
clear need for further investigation of the planetary
wave effect on midlatitude jet variability in a more
systematic manner, as done in the present paper.
The waveguide effect of westerly jets on planetary
waves has been underlined by different studies (e.g.,
Hoskins and Ambrizzi 1993; Branstator 2002; Lorenz
and Hartmann 2003). Following linear theories, such a
waveguide exists when turning latitudes (or equivalently
reflecting levels) exist on both sides of the jet. However,
the presence of a waveguide is far from being systematic:
it depends on thewavenumber and on the strength of the
westerly jet. For instance, the Asian jet is more likely
to act as a waveguide because it is strong and sharp
enough (Hoskins and Ambrizzi 1993). Generally speak-
ing, because of the stronger planetary vorticity gradient
at lower latitudes, quasi-stationary and low-frequency
Rossby waves tend to have a turning latitude on the
poleward flank of the westerly jets and a critical latitude
(i.e., where the phase speed equals the background
zonal wind) on the equatorward flank (Karoly 1983;
Lorenz 2014). When the waves approach the critical
latitude, linear theory predicts that the waves will be
absorbed (Held 1983). However, when during their
nonlinear stage the waves break near the critical latitude
in a region called the critical layer, they feed back onto
their environment and tend to homogenize the potential
vorticity. This leads to a near-zero potential vorticity
gradient within the critical layer, which will favor a re-
flection of the waves (Geisler and Dickinson 1974; Held
1983). If the critical layer is of finite extent, the nonlinear
theory of Rossby wave critical layer thus predicts that
the critical layer will necessarily become reflective after
some time (Killworth and McIntyre 1985). This theory
has been largely confirmed in realistic numerical ex-
periments of localized Rossby wave trains propagating
into the subtropics (Brunet and Haynes 1996;
Magnusdottir and Haynes 1999). In observational data,
one-third of planetary Rossby wave breakings occurring
near a subtropical critical latitude seem to lead to re-
flection (Abatzoglou and Magnusdottir 2004).
Most of these wave–mean flow interaction studies
focused on nonlinear processes within the critical layer
itself. They did not pay attention to the later evolution of
the reflecting waves and their feedback on the jet out-
side of the critical layer. More recently, Abatzoglou and
Magnusdottir (2006) started such an analysis by com-
paring the effects on the North Atlantic Oscillation
(NAO) of reflecting and nonreflecting planetary wave
breakings occurring in the subtropical North Atlantic.
Nonreflecting waves continuously induce poleward
momentum fluxes when they approach the subtropics,
which drive an extended positive NAO phase. On the
contrary, reflecting waves first induce poleward mo-
mentum fluxes and then equatorward fluxes after their
reflection, which suddenly stop the development of the
positive NAO phase and even create a reversal of the
polarity of the NAO a few days after the reflection. Our
main purpose in this paper is to show that more gener-
ally the short-term negative feedback by planetary
waves on jet variability can be attributed to
reflecting waves.
We analyze the interaction of planetary waves and jet
variability using a three-level quasigeostrophic model
on the sphere, addressing the following questions:
d Why and in which circumstances do planetary waves
reflect near the subtropical critical layer?d Howdo planetary wave reflections on both sides of the
jet affect the jet variability?
4312 JOURNAL OF THE ATMOSPHER IC SC IENCES VOLUME 73
Section 2 presents the model, the setup of the nu-
merical experiments, and the diagnostic tools. Section
3 analyzes the life cycles of nonlinear baroclinic dis-
turbances having a normal-mode structure at the ini-
tial time. Then a detailed study of a long-term
integration of the model forced by a relaxation to a
prescribed zonally symmetric temperature profile is
made in section 4. Conclusions and a discussion are
presented in section 5.
2. Methodology
a. Model
We use the quasigeostrophic (QG) model of
Marshall and Molteni (1993, hereinafter MM93). It is a
three-level spectral model on the sphere that integrates
the potential vorticity (PV) equation at each vertical
level i:
›qi
›t52J(c
i,q
i)2D
i1 S
i, (1)
where qi and ci denote the PV and streamfunction.
Levels i 5 1, 2, and 3 correspond to 200, 500, and
800hPa, respectively. The PV can be expressed as
q15 f 1=2c
12R22
1 (c12c
2) , (2)
q25 f 1=2c
21R22
1 (c12c
2)2R22
2 (c22c
3) , (3)
and
q35 f 1=2c
31R22
2 (c22c
3) , (4)
where f5 2V sinu is the Coriolis parameter (V is Earth’s
rotation rate and u is the latitude). The Rossby radii of
deformation R1 5 660 km and R2 5 400km for the 200–
500-hPa layer and the 500–800-hPa layer, respectively,
are set to the same values as in Rivière (2009). Each
term Di is the sum of linear operators, including a
Newtonian relaxation of temperature, a linear drag at
the surface (for i 5 3), and horizontal diffusion. The
term Si is the forcing term. A T42 truncation is used.
1) NORMAL-MODE APPROACH
The first set of simulations consists of nonlinear evo-
lution of unstable normal modes. The basic flow is a
baroclinic westerly zonal jet centered at 458. Its merid-
ional profile is a Gaussian function of latitude with 158width; the peak zonal wind speeds are 45, 22.5, and
9ms21 at levels 1, 2, and 3, respectively. Such a profile
aims at representing a typical wintertime westerly jet.
The sum of the dissipation and forcing terms can be
written as
2D11 S
152c
H=8q0
1 1 t21R1R
221 (c
12c
2) , (5)
2D21 S
252c
H=8q0
2 2 t21R1R
221 (c
12c
2)
1 t21R2R
222 (c
22c
3), and (6)
2D31 S
352c
H=8q0
3 2 t21E =2c
32 t21
R2R222 (c
22c
3) ,
(7)
where q0i denote the PV minus the planetary vorticity
and the Ekman damping time scale tE 5 3 days. The
forcing terms Si are zero in this section. The value of cHis such that the damping time scale of the shorter waves
at T42 truncation is 0.02 days. The relaxation time
scales tR1 5 tR2 5 25 days are as in the formulation of
MM93. After computing the normal modes with the
linear model, the resulting disturbances are introduced
in the nonlinear model with weak amplitudes: the
perturbation PV is 20 times smaller than the basic-state
PV at the initial time.
2) LONG-TERM RUN
The sum of the dissipation and forcing terms can here
be written as
2D11 S
152c
H=8q0
1 1 t21R1R
221 (c
12c
22 ~c
11 ~c
2) ,
(8)
2D21 S
252c
H=8q0
2 2 t21R1R
221 (c
12c
22 ~c
11 ~c
2)
1 t21R2R
222 (c
22c
32 ~c
21 ~c
3), and (9)
2D31 S
352c
H=8q0
3 2 t21E =2c
3
2 t21R2R
222 (c
22c
32 ~c
21 ~c
3) . (10)
The forcing terms Si are those including variables
denoted with a tilde, such as ~c1 2 ~c2 and ~c2 2 ~c3 which
are proportional to the temperature-restoration field
between levels 1 and 2 and between levels 2 and 3,
respectively. The diffusion and dissipation coefficients
cH and tE have the same values as in the normal-mode
approach. The temperature relaxation coefficients are
equal to tR15 40 days and tR25 15 days in order to get
relaxation time scales similar to Held and Suarez
(1994)’s framework with shorter time scales at lower
levels. The restoration temperature is an error func-
tion of latitude in thermal wind balance with the zonal
jet given by
~ui5U
0iexp
"2
�u2u
0
du
�2#. (11)
The jet latitude is u0 5 308N, its width du5 208, and the
velocity at the different levels U01 5 50m s21, U02 525ms21, and U03 5 10ms21. The simulation lasts
NOVEMBER 2016 R IV IÈRE ET AL . 4313

15 years; the first 300 days have been removed before the
analysis.
b. Refractive index
The refractive index of waves within the three-level
quasigeostrophic framework on the sphere can be
expressed as (see appendix)
n21 5
›q1/›y
u12 ca cosu
2R2
2
R21
�1
R1
21
R2
�2
2m2
a2 cos2u, (12)
n22 5
›q2/›y
u22 ca cosu
2
�1
R1
21
R2
�22
m2
a2 cos2u, and (13)
n23 5
›q3/›y
u32 ca cosu
2R2
1
R22
�1
R1
21
R2
�2
2m2
a2 cos2u, (14)
where u and q are the zonal-mean zonal wind and PV,
respectively; c is the angular phase speed of the distur-
bance, a is Earth’s radius, and m is the nondimensional
zonal wavenumber. The second terms on the rhs of Eqs.
(12), (13), and (14) take into account the variations of
the stratification with height, similarly to the continuous
formulation obtained in Charney and Drazin (1961) and
Matsuno (1970).
In all simulations, the phase speed of waves has been
computed for each day as follows: first, the meridional
wind is decomposed into contributions from individual
zonal wavenumbers m
ym(l,u, z, t)5A
mcos(ml1f
m) ,
where l is longitude. By multiplying ym by cos(ml) and
sin(ml) and then zonally averaging, one obtains
ymcos(ml)5
Am
2cosf
mand
ymsin(ml)52
Am
2sinf
m.
The phase fm is thus given by the angle of the previous
vector. The difference of fm between day d and its
successor d 1 1 is then computed to get an estimation
of the angular phase speed c of the waves present at
each day d.
3. Normal-mode study
The nonlinear evolution of unstable baroclinic nor-
mal modes for individual zonal wavenumbers m 2 [3,
11] is analyzed in the present section. While such an
approach has been intensively adopted since the 1970s
(Gall 1976; Simmons and Hoskins 1978), the following
results, which focus on the successive stages of the
nonlinear evolution and the difference between
planetary and synoptic waves, do not seem to have
been underlined before. For our basic flow, the most
unstable wavenumbers are m 5 6, 7, and 8, with
e-folding times equal to 1.9, 1.8, and 1.9 days, re-
spectively. Since the disturbances have small initial
amplitudes, a few days are needed for them to reach
finite amplitudes. The jet begins to be visibly modi-
fied around t 5 4 days, roughly at the same time as
when the momentum flux convergence reaches
strong values (see Fig. 1).
Normal-mode disturbances have a pronounced an-
ticyclonic tilt because of spherical geometry (Simmons
and Hoskins 1978; Balasubramanian and Garner
1997). Indeed, the stronger planetary vorticity gradi-
ent on the equatorward side of the jet also makes the
refractive index stronger there than on the poleward
side, as seen in Eqs. (12)–(14) (Rivière 2009). This
leads to predominant poleward momentum fluxes
during the first stage of the nonlinear evolution of the
normal modes between t 5 4 and 8 days. Hence, a di-
polar structure in the momentum flux convergence
appears during that time interval, with positive and
negative values on the poleward and equatorward sides
of the jet, respectively. The jet moves poleward and
accelerates, as can be clearly seen at t 5 8 days for the
most unstable wavenumbers (m 2 [5, 8]). Note also that
the jet becomes narrower at t 5 8 days than at t 50 days.
After this first stage of the nonlinear evolution, the
behavior of the disturbances and their feedback onto the
jet vary depending on their wavenumber. For low
wavenumbers (m 2 [4, 6]), as soon as the jet is
accelerated, the momentum flux convergence abruptly
reverses sign with negative values on the jet core and on
its poleward flank and positive values on its equatorward
flank. This occurs between t5 11 and 14 days form5 4
(Fig. 1a) and between t5 8 and 11 days form5 5 and 6
(Figs. 1b,c). This sign reversal of the momentum flux
convergence leads to a decelerated jet with a minimum
intensity reached at t5 16, 12, and 11 days form5 4, 5,
and 6, respectively. After this second stage, yet another
sign reversal of the momentum flux convergence is
observed, which creates a new acceleration of the jet.
This alternation in the sign of the momentum flux
convergence continues with decreasing amplitudes
until t 5 20 days.
For higher wavenumbers (m 2 [7, 9]), the alternation
in the sign of the momentum flux convergence barely
occurs (Figs. 1d–f). After a nonlinear stage during which
synoptic disturbances mainly accelerate the jet, the jet
intensity slowly decreases with time because of the dis-
sipating processes.
4314 JOURNAL OF THE ATMOSPHER IC SC IENCES VOLUME 73
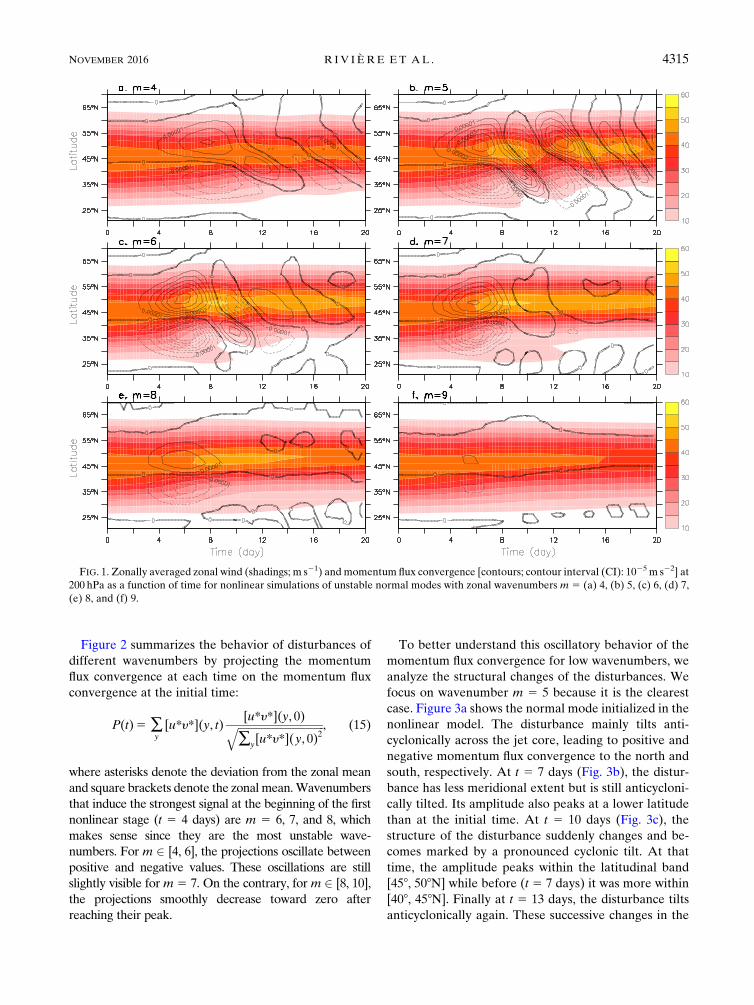
Figure 2 summarizes the behavior of disturbances of
different wavenumbers by projecting the momentum
flux convergence at each time on the momentum flux
convergence at the initial time:
P(t)5 �y
[u*y*](y, t)[u*y*](y, 0)ffiffiffiffiffiffiffiffiffiffiffiffiffiffiffiffiffiffiffiffiffiffiffiffiffiffiffiffiffiffiffiffiffi�y
[u*y*](y, 0)2q , (15)
where asterisks denote the deviation from the zonal mean
and square brackets denote the zonal mean.Wavenumbers
that induce the strongest signal at the beginning of the first
nonlinear stage (t 5 4 days) are m 5 6, 7, and 8, which
makes sense since they are the most unstable wave-
numbers. For m 2 [4, 6], the projections oscillate between
positive and negative values. These oscillations are still
slightly visible form5 7. On the contrary, form 2 [8, 10],
the projections smoothly decrease toward zero after
reaching their peak.
To better understand this oscillatory behavior of the
momentum flux convergence for low wavenumbers, we
analyze the structural changes of the disturbances. We
focus on wavenumber m 5 5 because it is the clearest
case. Figure 3a shows the normal mode initialized in the
nonlinear model. The disturbance mainly tilts anti-
cyclonically across the jet core, leading to positive and
negative momentum flux convergence to the north and
south, respectively. At t 5 7 days (Fig. 3b), the distur-
bance has less meridional extent but is still anticycloni-
cally tilted. Its amplitude also peaks at a lower latitude
than at the initial time. At t 5 10 days (Fig. 3c), the
structure of the disturbance suddenly changes and be-
comes marked by a pronounced cyclonic tilt. At that
time, the amplitude peaks within the latitudinal band
[458, 508N] while before (t 5 7 days) it was more within
[408, 458N]. Finally at t 5 13 days, the disturbance tilts
anticyclonically again. These successive changes in the
FIG. 1. Zonally averaged zonal wind (shadings; m s21) and momentum flux convergence [contours; contour interval (CI): 1025 m s22] at
200 hPa as a function of time for nonlinear simulations of unstable normal modes with zonal wavenumbers m 5 (a) 4, (b) 5, (c) 6, (d) 7,
(e) 8, and (f) 9.
NOVEMBER 2016 R IV IÈRE ET AL . 4315
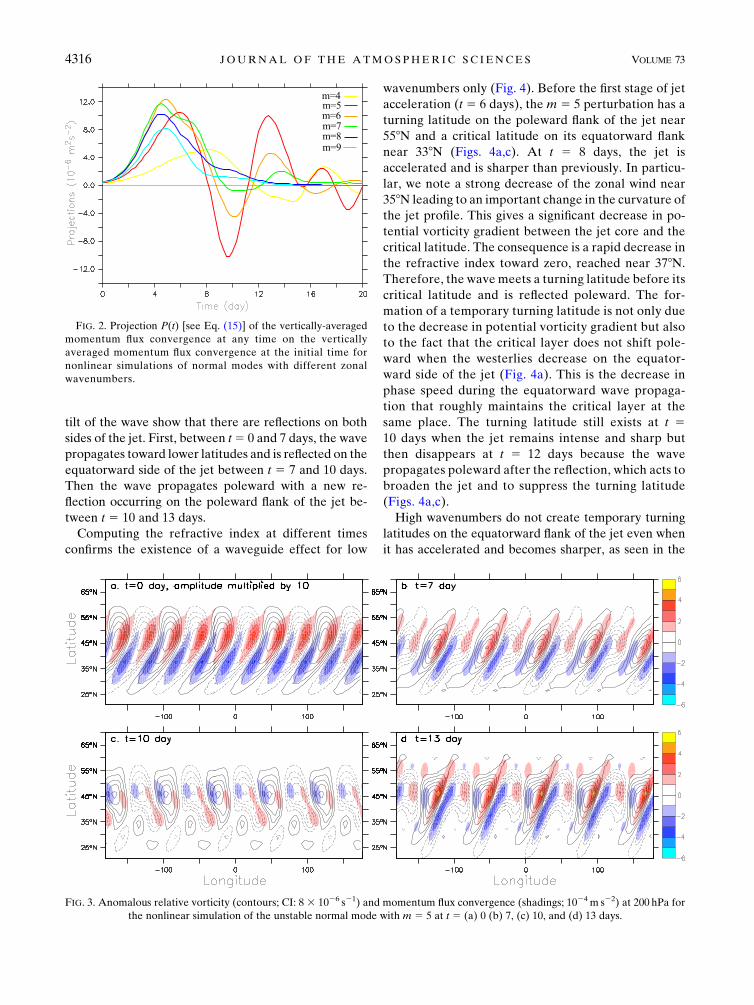
tilt of the wave show that there are reflections on both
sides of the jet. First, between t5 0 and 7 days, the wave
propagates toward lower latitudes and is reflected on the
equatorward side of the jet between t 5 7 and 10 days.
Then the wave propagates poleward with a new re-
flection occurring on the poleward flank of the jet be-
tween t 5 10 and 13 days.
Computing the refractive index at different times
confirms the existence of a waveguide effect for low
wavenumbers only (Fig. 4). Before the first stage of jet
acceleration (t 5 6 days), the m 5 5 perturbation has a
turning latitude on the poleward flank of the jet near
558N and a critical latitude on its equatorward flank
near 338N (Figs. 4a,c). At t 5 8 days, the jet is
accelerated and is sharper than previously. In particu-
lar, we note a strong decrease of the zonal wind near
358N leading to an important change in the curvature of
the jet profile. This gives a significant decrease in po-
tential vorticity gradient between the jet core and the
critical latitude. The consequence is a rapid decrease in
the refractive index toward zero, reached near 378N.
Therefore, the wave meets a turning latitude before its
critical latitude and is reflected poleward. The for-
mation of a temporary turning latitude is not only due
to the decrease in potential vorticity gradient but also
to the fact that the critical layer does not shift pole-
ward when the westerlies decrease on the equator-
ward side of the jet (Fig. 4a). This is the decrease in
phase speed during the equatorward wave propaga-
tion that roughly maintains the critical layer at the
same place. The turning latitude still exists at t 510 days when the jet remains intense and sharp but
then disappears at t 5 12 days because the wave
propagates poleward after the reflection, which acts to
broaden the jet and to suppress the turning latitude
(Figs. 4a,c).
High wavenumbers do not create temporary turning
latitudes on the equatorward flank of the jet even when
it has accelerated and becomes sharper, as seen in the
FIG. 2. Projection P(t) [see Eq. (15)] of the vertically-averaged
momentum flux convergence at any time on the vertically
averaged momentum flux convergence at the initial time for
nonlinear simulations of normal modes with different zonal
wavenumbers.
FIG. 3. Anomalous relative vorticity (contours; CI: 8 3 1026 s21) and momentum flux convergence (shadings; 1024 m s22) at 200 hPa for
the nonlinear simulation of the unstable normal mode with m 5 5 at t 5 (a) 0 (b) 7, (c) 10, and (d) 13 days.
4316 JOURNAL OF THE ATMOSPHER IC SC IENCES VOLUME 73
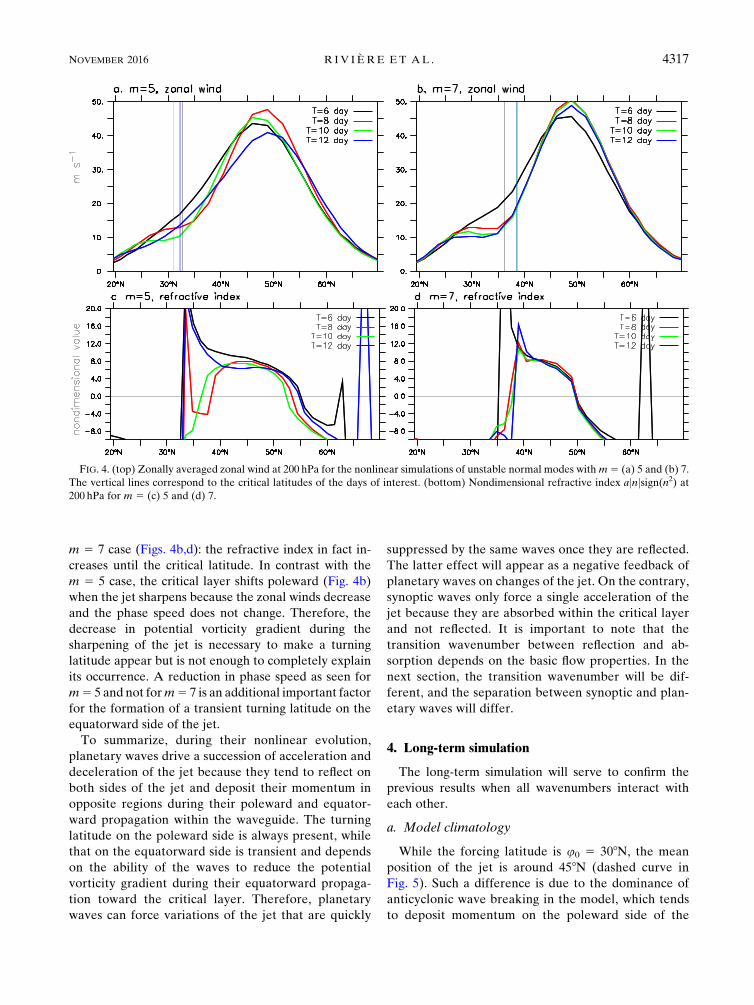
m 5 7 case (Figs. 4b,d): the refractive index in fact in-
creases until the critical latitude. In contrast with the
m 5 5 case, the critical layer shifts poleward (Fig. 4b)
when the jet sharpens because the zonal winds decrease
and the phase speed does not change. Therefore, the
decrease in potential vorticity gradient during the
sharpening of the jet is necessary to make a turning
latitude appear but is not enough to completely explain
its occurrence. A reduction in phase speed as seen for
m5 5 and not form5 7 is an additional important factor
for the formation of a transient turning latitude on the
equatorward side of the jet.
To summarize, during their nonlinear evolution,
planetary waves drive a succession of acceleration and
deceleration of the jet because they tend to reflect on
both sides of the jet and deposit their momentum in
opposite regions during their poleward and equator-
ward propagation within the waveguide. The turning
latitude on the poleward side is always present, while
that on the equatorward side is transient and depends
on the ability of the waves to reduce the potential
vorticity gradient during their equatorward propaga-
tion toward the critical layer. Therefore, planetary
waves can force variations of the jet that are quickly
suppressed by the same waves once they are reflected.
The latter effect will appear as a negative feedback of
planetary waves on changes of the jet. On the contrary,
synoptic waves only force a single acceleration of the
jet because they are absorbed within the critical layer
and not reflected. It is important to note that the
transition wavenumber between reflection and ab-
sorption depends on the basic flow properties. In the
next section, the transition wavenumber will be dif-
ferent, and the separation between synoptic and plan-
etary waves will differ.
4. Long-term simulation
The long-term simulation will serve to confirm the
previous results when all wavenumbers interact with
each other.
a. Model climatology
While the forcing latitude is u0 5 308N, the mean
position of the jet is around 458N (dashed curve in
Fig. 5). Such a difference is due to the dominance of
anticyclonic wave breaking in the model, which tends
to deposit momentum on the poleward side of the
FIG. 4. (top) Zonally averaged zonal wind at 200 hPa for the nonlinear simulations of unstable normal modes withm5 (a) 5 and (b) 7.
The vertical lines correspond to the critical latitudes of the days of interest. (bottom) Nondimensional refractive index ajnjsign(n2) at200 hPa for m 5 (c) 5 and (d) 7.
NOVEMBER 2016 R IV IÈRE ET AL . 4317
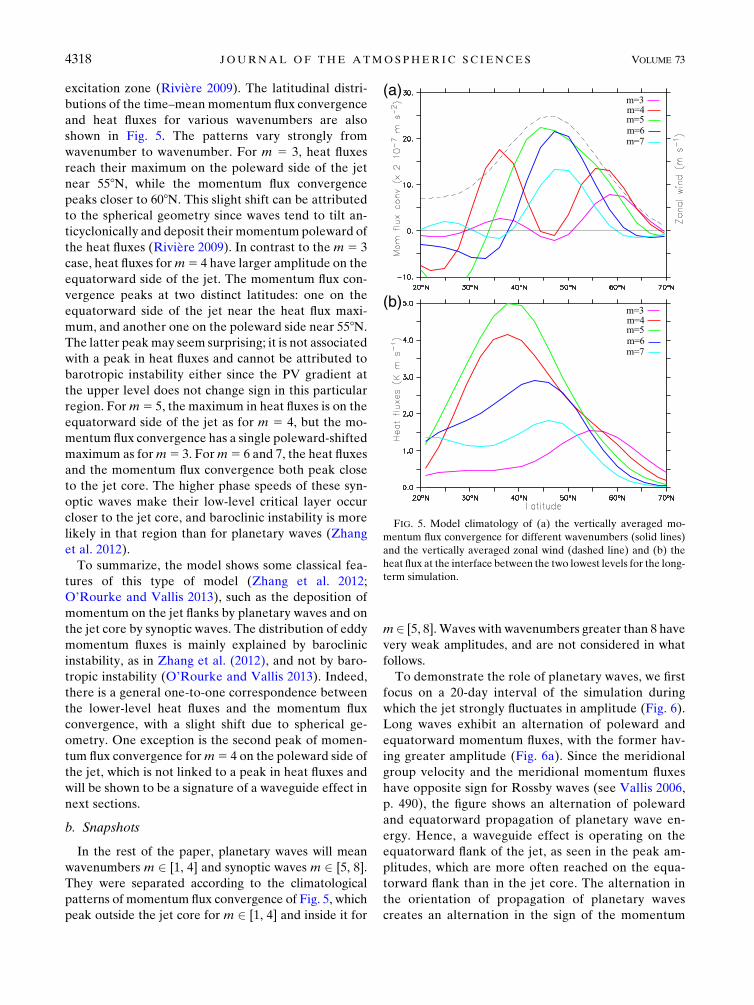
excitation zone (Rivière 2009). The latitudinal distri-
butions of the time–mean momentum flux convergence
and heat fluxes for various wavenumbers are also
shown in Fig. 5. The patterns vary strongly from
wavenumber to wavenumber. For m 5 3, heat fluxes
reach their maximum on the poleward side of the jet
near 558N, while the momentum flux convergence
peaks closer to 608N. This slight shift can be attributed
to the spherical geometry since waves tend to tilt an-
ticyclonically and deposit their momentum poleward of
the heat fluxes (Rivière 2009). In contrast to the m 5 3
case, heat fluxes form5 4 have larger amplitude on the
equatorward side of the jet. The momentum flux con-
vergence peaks at two distinct latitudes: one on the
equatorward side of the jet near the heat flux maxi-
mum, and another one on the poleward side near 558N.
The latter peakmay seem surprising; it is not associated
with a peak in heat fluxes and cannot be attributed to
barotropic instability either since the PV gradient at
the upper level does not change sign in this particular
region. Form5 5, the maximum in heat fluxes is on the
equatorward side of the jet as for m 5 4, but the mo-
mentum flux convergence has a single poleward-shifted
maximum as form5 3. Form5 6 and 7, the heat fluxes
and the momentum flux convergence both peak close
to the jet core. The higher phase speeds of these syn-
optic waves make their low-level critical layer occur
closer to the jet core, and baroclinic instability is more
likely in that region than for planetary waves (Zhang
et al. 2012).
To summarize, the model shows some classical fea-
tures of this type of model (Zhang et al. 2012;
O’Rourke and Vallis 2013), such as the deposition of
momentum on the jet flanks by planetary waves and on
the jet core by synoptic waves. The distribution of eddy
momentum fluxes is mainly explained by baroclinic
instability, as in Zhang et al. (2012), and not by baro-
tropic instability (O’Rourke and Vallis 2013). Indeed,
there is a general one-to-one correspondence between
the lower-level heat fluxes and the momentum flux
convergence, with a slight shift due to spherical ge-
ometry. One exception is the second peak of momen-
tum flux convergence form5 4 on the poleward side of
the jet, which is not linked to a peak in heat fluxes and
will be shown to be a signature of a waveguide effect in
next sections.
b. Snapshots
In the rest of the paper, planetary waves will mean
wavenumbers m 2 [1, 4] and synoptic waves m 2 [5, 8].
They were separated according to the climatological
patterns of momentum flux convergence of Fig. 5, which
peak outside the jet core for m 2 [1, 4] and inside it for
m 2 [5, 8]. Waves with wavenumbers greater than 8 have
very weak amplitudes, and are not considered in what
follows.
To demonstrate the role of planetary waves, we first
focus on a 20-day interval of the simulation during
which the jet strongly fluctuates in amplitude (Fig. 6).
Long waves exhibit an alternation of poleward and
equatorward momentum fluxes, with the former hav-
ing greater amplitude (Fig. 6a). Since the meridional
group velocity and the meridional momentum fluxes
have opposite sign for Rossby waves (see Vallis 2006,
p. 490), the figure shows an alternation of poleward
and equatorward propagation of planetary wave en-
ergy. Hence, a waveguide effect is operating on the
equatorward flank of the jet, as seen in the peak am-
plitudes, which are more often reached on the equa-
torward flank than in the jet core. The alternation in
the orientation of propagation of planetary waves
creates an alternation in the sign of the momentum
FIG. 5. Model climatology of (a) the vertically averaged mo-
mentum flux convergence for different wavenumbers (solid lines)
and the vertically averaged zonal wind (dashed line) and (b) the
heat flux at the interface between the two lowest levels for the long-
term simulation.
4318 JOURNAL OF THE ATMOSPHER IC SC IENCES VOLUME 73
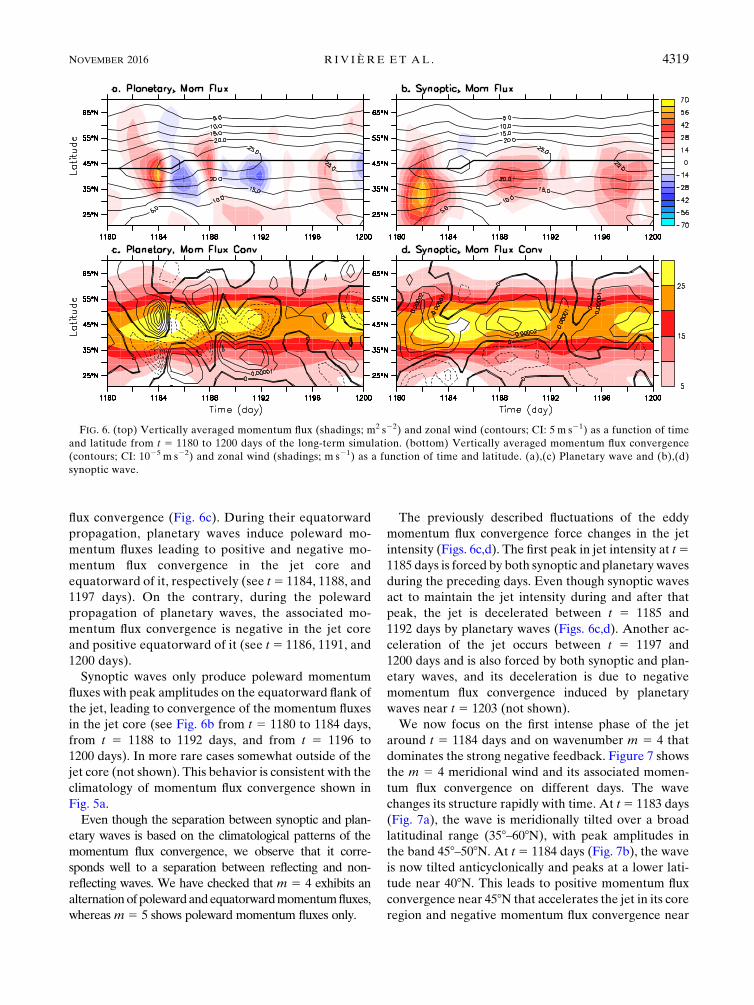
flux convergence (Fig. 6c). During their equatorward
propagation, planetary waves induce poleward mo-
mentum fluxes leading to positive and negative mo-
mentum flux convergence in the jet core and
equatorward of it, respectively (see t5 1184, 1188, and
1197 days). On the contrary, during the poleward
propagation of planetary waves, the associated mo-
mentum flux convergence is negative in the jet core
and positive equatorward of it (see t 5 1186, 1191, and
1200 days).
Synoptic waves only produce poleward momentum
fluxes with peak amplitudes on the equatorward flank of
the jet, leading to convergence of the momentum fluxes
in the jet core (see Fig. 6b from t 5 1180 to 1184 days,
from t 5 1188 to 1192 days, and from t 5 1196 to
1200 days). In more rare cases somewhat outside of the
jet core (not shown). This behavior is consistent with the
climatology of momentum flux convergence shown in
Fig. 5a.
Even though the separation between synoptic and plan-
etary waves is based on the climatological patterns of the
momentum flux convergence, we observe that it corre-
sponds well to a separation between reflecting and non-
reflecting waves. We have checked that m 5 4 exhibits an
alternationofpolewardandequatorwardmomentumfluxes,
whereasm5 5 shows poleward momentum fluxes only.
The previously described fluctuations of the eddy
momentum flux convergence force changes in the jet
intensity (Figs. 6c,d). The first peak in jet intensity at t51185 days is forced by both synoptic and planetary waves
during the preceding days. Even though synoptic waves
act to maintain the jet intensity during and after that
peak, the jet is decelerated between t 5 1185 and
1192 days by planetary waves (Figs. 6c,d). Another ac-
celeration of the jet occurs between t 5 1197 and
1200 days and is also forced by both synoptic and plan-
etary waves, and its deceleration is due to negative
momentum flux convergence induced by planetary
waves near t 5 1203 (not shown).
We now focus on the first intense phase of the jet
around t 5 1184 days and on wavenumber m 5 4 that
dominates the strong negative feedback. Figure 7 shows
the m 5 4 meridional wind and its associated momen-
tum flux convergence on different days. The wave
changes its structure rapidly with time. At t5 1183 days
(Fig. 7a), the wave is meridionally tilted over a broad
latitudinal range (358–608N), with peak amplitudes in
the band 458–508N. At t5 1184 days (Fig. 7b), the wave
is now tilted anticyclonically and peaks at a lower lati-
tude near 408N. This leads to positive momentum flux
convergence near 458N that accelerates the jet in its core
region and negative momentum flux convergence near
FIG. 6. (top) Vertically averaged momentum flux (shadings; m2 s22) and zonal wind (contours; CI: 5 m s21) as a function of time
and latitude from t 5 1180 to 1200 days of the long-term simulation. (bottom) Vertically averaged momentum flux convergence
(contours; CI: 1025 m s22) and zonal wind (shadings; m s21) as a function of time and latitude. (a),(c) Planetary wave and (b),(d)
synoptic wave.
NOVEMBER 2016 R IV IÈRE ET AL . 4319

358N that decelerates the zonal winds on the equator-
ward flank of the jet. On the contrary, one day later, at
t 5 1185 days (Fig. 7c), the wave tilt is cyclonic, and the
momentum flux convergence is negative near the jet
core in the band 408–458N and positive on its equator-
ward flank in the band 308–358N. The strong de-
celeration of the jet induced by the m 5 4 wave is still
present at t5 1186 days (Fig. 7d). The peak amplitude of
the wave is farther north than on the previous day. The
rapid change in the wave momentum forcing of the jet
thus occurs precisely at the time of the wave reflection
near t 5 1185 days.
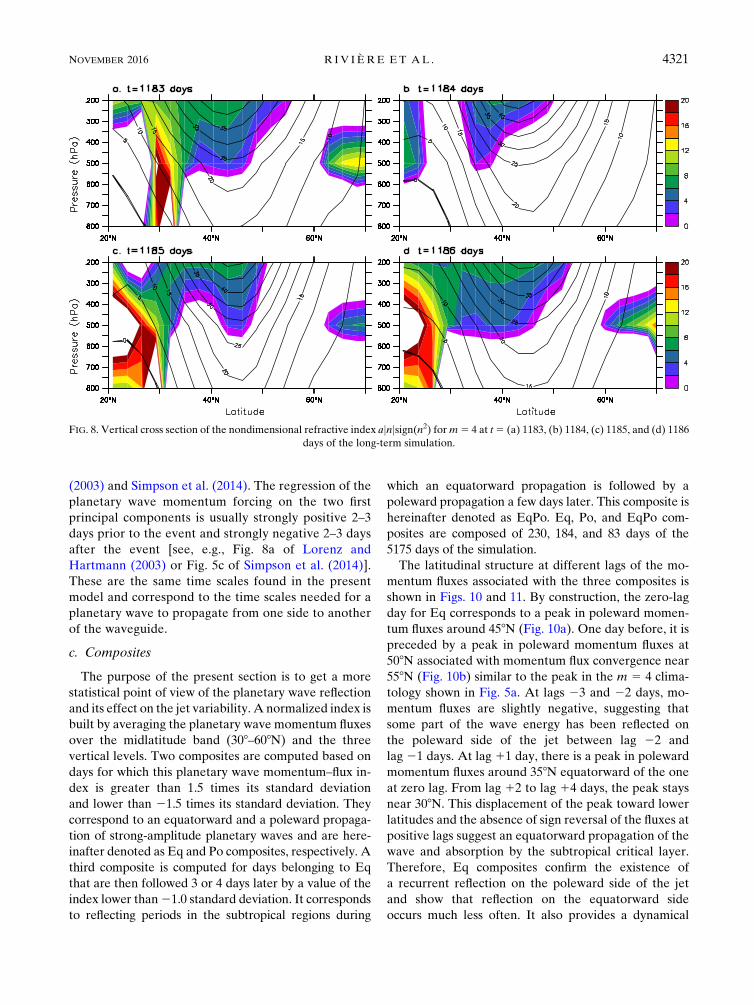
Figure 8 shows the vertical cross sections of the zonal
wind and of the refractive index for m 5 4 at t 5 1183,
1184, 1185, and 1186 days. A turning latitude on the
equatorward flank of the jet appears at t 5 1184 and
1185 days, when the zonal wind on the equatorward
flank of the jet is weakest. All the other cases show a
positive refractive index and an increase in the re-
fractive index as latitude decreases and therefore an
absorbing critical layer. A decomposition of the factors
explaining this rapid change in the refractive index
is shown in Fig. 9. From t 5 1183 to 1184 days, when
the wave propagates equatorward, the zonal wind de-
creases from 20 to 14m s21 at 308N (Fig. 9b), while the
PV gradient decreases from 4 3 10211m21 s21 to 1 310211m21 s21. The decrease in the PV gradient domi-
nates over that in zonal wind. It makes the ratio
a2(›q/›y)/(u2 c0a cosu) decrease by up to a factor of 2
between t5 1184 and 1185 days (Fig. 9c), where c0 is the
phase speed taken at t 5 1184 days. The decrease in
phase speed during the equatorward propagation of the
wave also participates in the low refractive index, albeit
less importantly, since the differences between the ra-
tios a2(›q/›y)/(u2 ca cosu) at t 5 1184 and 1185 days
are larger than the differences between the ratios
a2(›q/›y)/(u2 c0a cosu) (Figs. 9c,d). Such a change in
the refractive index has not been detected for synoptic
waves. For the latter waves, the refractive index in-
creases as latitude decreases toward the critical layer.
To summarize, this section showed that both plane-
tary waves and synoptic waves can drive an accelera-
tion of the jet. In addition, synoptic waves tend to
extend its duration, while planetary waves tend to
suppress it. This confirms a well-known picture found
in many studies (e.g., Feldstein and Lee 1998;
Watterson 2002; Lorenz and Hartmann 2001). The new
result of the present study is that this negative feedback
from planetary waves on the jet acceleration occurs
when they reflect on its equatorward flank. Similarly,
the planetary waves induce a negative feedback on a jet
deceleration just after their reflection on its poleward
flank (see t 5 1186 days in Figs. 6a,c). Our results
provide an interpretation for the rapid change of sign in
the planetary wave momentum forcing on the leading
modes of variability, as shown in Lorenz andHartmann
FIG. 7. Meridional wind (contours; CI: 5 m s21) and momentum flux convergence (shadings; m s22) at 200 hPa for zonal wavenumber
m 5 4 at t 5 (a) 1183, (b) 1184, (c) 1185, and (d) 1186 days of the long-term simulation.
4320 JOURNAL OF THE ATMOSPHER IC SC IENCES VOLUME 73
(2003) and Simpson et al. (2014). The regression of the
planetary wave momentum forcing on the two first
principal components is usually strongly positive 2–3
days prior to the event and strongly negative 2–3 days
after the event [see, e.g., Fig. 8a of Lorenz and
Hartmann (2003) or Fig. 5c of Simpson et al. (2014)].
These are the same time scales found in the present
model and correspond to the time scales needed for a
planetary wave to propagate from one side to another
of the waveguide.
c. Composites
The purpose of the present section is to get a more
statistical point of view of the planetary wave reflection
and its effect on the jet variability. A normalized index is
built by averaging the planetary wave momentum fluxes
over the midlatitude band (308–608N) and the three
vertical levels. Two composites are computed based on
days for which this planetary wave momentum–flux in-
dex is greater than 1.5 times its standard deviation
and lower than 21.5 times its standard deviation. They
correspond to an equatorward and a poleward propaga-
tion of strong-amplitude planetary waves and are here-
inafter denoted as Eq and Po composites, respectively. A
third composite is computed for days belonging to Eq
that are then followed 3 or 4 days later by a value of the
index lower than21.0 standard deviation. It corresponds
to reflecting periods in the subtropical regions during
which an equatorward propagation is followed by a
poleward propagation a few days later. This composite is
hereinafter denoted as EqPo. Eq, Po, and EqPo com-
posites are composed of 230, 184, and 83 days of the
5175 days of the simulation.
The latitudinal structure at different lags of the mo-
mentum fluxes associated with the three composites is
shown in Figs. 10 and 11. By construction, the zero-lag
day for Eq corresponds to a peak in poleward momen-
tum fluxes around 458N (Fig. 10a). One day before, it is
preceded by a peak in poleward momentum fluxes at
508N associated with momentum flux convergence near
558N (Fig. 10b) similar to the peak in the m 5 4 clima-
tology shown in Fig. 5a. At lags 23 and 22 days, mo-
mentum fluxes are slightly negative, suggesting that
some part of the wave energy has been reflected on
the poleward side of the jet between lag 22 and
lag 21 days. At lag 11 day, there is a peak in poleward
momentum fluxes around 358N equatorward of the one
at zero lag. From lag 12 to lag 14 days, the peak stays
near 308N. This displacement of the peak toward lower
latitudes and the absence of sign reversal of the fluxes at
positive lags suggest an equatorward propagation of the
wave and absorption by the subtropical critical layer.
Therefore, Eq composites confirm the existence of
a recurrent reflection on the poleward side of the jet
and show that reflection on the equatorward side
occurs much less often. It also provides a dynamical
FIG. 8. Vertical cross section of the nondimensional refractive index ajnjsign(n2) form5 4 at t5 (a) 1183, (b) 1184, (c) 1185, and (d) 1186
days of the long-term simulation.
NOVEMBER 2016 R IV IÈRE ET AL . 4321

interpretation for the poleward peak in the climatology
of them5 4 momentum flux convergence that seems to
be due to wave reflection on the poleward side of the jet.
At zero-lag day, the Po composite shows a peak in
equatorward momentum fluxes (Fig. 10c). This poleward
propagation is preceded by an equatorward propagation
at lag 23 and lag 22 days and is followed by an equa-
torward propagation from lag 12 to lag 14 days. This
composite reflects the existence of reflection on both
sides of the jet. Note that the maximum of momentum
flux convergence between 558 and 608N at lag 12 days
occurs just after the wave reflection on the poleward side
(Fig. 10d), similar to lag 21 days in the Eq composite.
The EqPo composite is built to select reflecting cases
in the subtropical critical layer. It contains 83 cases,
which correspond to one-third of the Eq cases, consis-
tent with the observational study of Abatzoglou and
Magnusdottir (2004).
To investigate how planetary waves and their reflection
affect the nature of the jet variability, two additional
normalized indices have been defined based on the daily
time series of the jet latitude (hereinafter called shifting
mode) and the maximum speed of the jet (hereinafter
called pulsing mode), as in Barnes and Hartmann (2011).
The standard deviations of these two time series are 1.58
and 2.1ms21, respectively. The jet is here defined as the
vertically averaged zonal-mean zonal wind.
Figure 11 shows the average evolution of the zonal
wind and the shifting and pulsing indices around the days
defined by the Eq, Po, or EqPo wave-based composites.
For Eq, there is a rapid acceleration of the jet from lag21
to lag 12 days of about 3ms21, accompanied by a slight
poleward shift of a few degrees (Fig. 11a). The pulsing
index increases from20.7 to 0.1 during the same period,
while the shifting index increases from 20.4 to 0.1
(Fig. 11b). Then the two indices slowly decrease to zero
from lag 12 to lag 15 days. The slightly stronger varia-
tions of the pulsing index compared to the shifting index
suggest that planetary wave activity is more able to excite
the pulsing mode than the shifting mode. This could be
because the latitudinal band in which the waves propa-
gate, or in other words the waveguide position, is shifted
equatorward compared to the jet core (see Figs. 6a,b).
Indeed, if the waveguide was symmetric with respect to
the mean jet axis, the deposit of momentum would occur
on both flanks of the jet depending on the orientation of
the wave. This would facilitate the triggering of the
shifting mode. Since the waveguide is displaced equa-
torward, an equatorward-propagating wave tends to de-
posit momentum on the jet core and accelerate the jet.
FIG. 9. Zonal averages at 200 hPa of (a) the potential vorticity gradient ›q/›y; (b) the zonal wind u; (c) the ratio a2(›q/›y)/(u2 c0a cosu),where c05 c(t5 1183 days) is the phase speed computed at the beginning of the period; and (d) the ratio a2(›q/›y)/(u2 ca cosu) form5 4.
4322 JOURNAL OF THE ATMOSPHER IC SC IENCES VOLUME 73

On the contrary, a poleward-propagating wave tends to
decelerate the jet.
The Po composite shows the reverse situation compared
to theEq composite. There is a deceleration of the jet from
lag 21 to lag 12 days accompanied by a slight equator-
ward shift (Fig. 11c). The pulsing index decreases from
0 to 20.7 and the shifting index from 0.2 to 20.4 during
that period (Fig. 11d). The two indices then increase
to 20.1 from lag 12 to lag 15 days. In that case, the two
modes have roughly the same amplitude of variations.
An interesting result concerns the comparison between
the variations of the indices for Eq and Po. For Po, the jet
profile at the zero-lag day is recovered at lag 14 days.
This is not the case forEq, where the jet is still muchmore
intense at lag 14 days than at the zero-lag day. This is
because, for Po, there is reflection of the waves on the
poleward side of the jet around lag12 days (see Fig. 10c),
which leads to a planetary wave forcing opposite to that
occurring prior to lag 12 days. On the contrary, the Eq
composite does not show a reflection, which explains why
the negative feedback at later lags is weak. The EqPo
composite confirms this view. EqPo contains the sub-
sample of Eq cases characterized by a reflection on the
subtropical flank of the jet. For EqPo, there is a rapid
decrease in both the pulsing and shifting indices between
lag 12 and lag 15 days (Fig. 11f), while for Eq the de-
crease of these indices is small during the same time in-
terval (Fig. 11b). The momentum flux convergence is
FIG. 10. Time lag composites of (a),(c),(d) the vertically averaged planetary wave momentum flux and (b),(d),(f) its convergence as
a function of latitude: (a),(b) the planetary waves propagate equatorward (Eq composite); (c),(d) the planetary waves propagate poleward
(Po composite); (e),(f) the planetary waves propagate equatorward and then poleward a few days later (EqPo composite). See text for
more details on the computation of the Eq, Po, and EqPo composites.
NOVEMBER 2016 R IV IÈRE ET AL . 4323
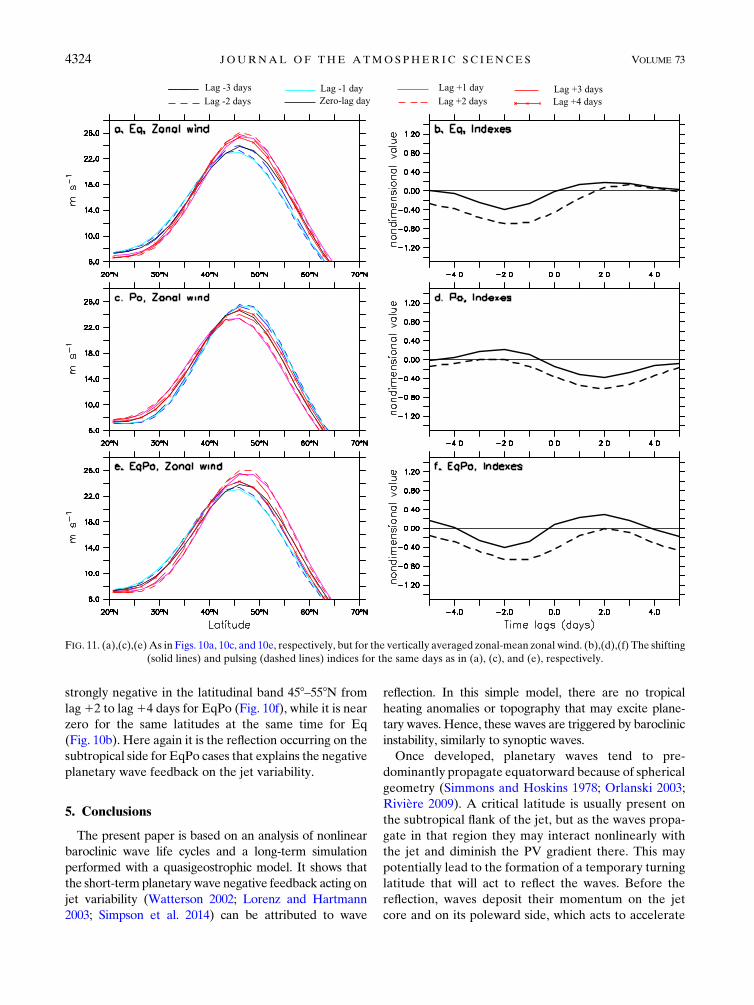
strongly negative in the latitudinal band 458–558N from
lag12 to lag14 days for EqPo (Fig. 10f), while it is near
zero for the same latitudes at the same time for Eq
(Fig. 10b). Here again it is the reflection occurring on the
subtropical side for EqPo cases that explains the negative
planetary wave feedback on the jet variability.
5. Conclusions
The present paper is based on an analysis of nonlinear
baroclinic wave life cycles and a long-term simulation
performed with a quasigeostrophic model. It shows that
the short-termplanetarywave negative feedback acting on
jet variability (Watterson 2002; Lorenz and Hartmann
2003; Simpson et al. 2014) can be attributed to wave
reflection. In this simple model, there are no tropical
heating anomalies or topography that may excite plane-
tary waves. Hence, these waves are triggered by baroclinic
instability, similarly to synoptic waves.
Once developed, planetary waves tend to pre-
dominantly propagate equatorward because of spherical
geometry (Simmons and Hoskins 1978; Orlanski 2003;
Rivière 2009). A critical latitude is usually present on
the subtropical flank of the jet, but as the waves propa-
gate in that region they may interact nonlinearly with
the jet and diminish the PV gradient there. This may
potentially lead to the formation of a temporary turning
latitude that will act to reflect the waves. Before the
reflection, waves deposit their momentum on the jet
core and on its poleward side, which acts to accelerate
FIG. 11. (a),(c),(e)As in Figs. 10a, 10c, and 10e, respectively, but for the vertically averaged zonal-mean zonal wind. (b),(d),(f) The shifting
(solid lines) and pulsing (dashed lines) indices for the same days as in (a), (c), and (e), respectively.
4324 JOURNAL OF THE ATMOSPHER IC SC IENCES VOLUME 73

the jet and displace it slightly poleward. After the re-
flection, waves deposit their momentum on the equa-
torward side of the jet and act to decelerate it in its core
region. If there is absorption instead of reflection, the jet
acceleration is amplified and persists much longer. In the
long-term simulation, one-third of the equatorward-
propagating waves tend to reflect, and two-thirds tend
to be absorbed. These results confirm the observational
study made by Abatzoglou and Magnusdottir (2006).
When planetary waves propagate poleward, they are
reflected near the quasi-permanent turning latitude lo-
cated on the poleward flank of the jet very close to its axis.
Before the reflection, the jet is decelerated and shifted
equatorward, whereas it is accelerated and shifted pole-
ward after the reflection. Thus, planetary waves tend to
suppress the jet variations that they drove a few days
before. Because the waveguide is shifted equatorward
relative to the jet core region, the planetary wave forcing
and feedback act more efficiently on pulses of the jet in-
tensity than on its latitudinal shifts. Indeed, an equatorward-
propagating wave along such a waveguide tends to
deposit momentumon the jet core and accelerate the jet.
On the contrary, a poleward-propagatingwave along the
same waveguide tends to decelerate the jet.
The planetary waveguide effect underlined in the
present study is nonlinear since it needs an important
homogenization of the PV by waves breaking in the
subtropical critical layer in order for reflection to occur.
The PV homogenization is a necessary component for a
turning latitude to appear on the equatorward flank of
the jet, but this is often not enough. For instance, the
decrease in phase speed is another ingredient that helps
decreasing the refractive index to zero on the equator-
ward flank of the jet. In the normal-mode analysis, the
decrease in phase speed was found to be more pro-
nounced for planetary waves than synoptic waves. The
explanation for such an observation is left for future
studies. In the long-term simulation, it is easier to in-
terpret the difference of behavior between planetary
and synoptic waves. The jet acceleration and the ho-
mogenization of PV on its equatorward flank are trig-
gered by both waves. Since planetary waves have lower
phase speeds than synoptic waves, the critical layer of
the former waves is more likely to be located south of
the region of PV homogenization than that of the latter
waves. This is the main reason why planetary waves are
more inclined to reflect than synoptic waves.
The wavenumber at which the transition between
reflecting and nonreflecting waves occurs can fluctuate
from case to case. This is why the separation between
planetary and synoptic waves differs between the
normal-mode simulations and the long-term simulation.
Indeed, the transition depends on the background flow
along which the waves propagate. The present study
suggests that the structure of the time-mean momen-
tum flux convergence helps separate the two kinds of
behavior. Reflecting waves present two peaks in the
time-mean momentum flux convergence on both sides
of the jet, while nonreflecting waves exhibit only
one peak.
The reflection of planetary waves detailed in the
present study provides an interpretation of some results
underlined in past studies. In particular, it explains the
time variations of the cross-covariance between the
principal component of the leading mode of jet vari-
ability and the planetary wave momentum forcing seen
in many studies (Lorenz and Hartmann 2001, 2003;
Simpson et al. 2014). This cross-covariance usually gets a
positive maximum 2 days before the peak in the prin-
cipal component and a negative minimum 2 days after
[see, e.g., Fig. 8a of Lorenz andHartmann (2003), Fig. 5c
of Simpson et al. (2014), or Fig. 9 of Eichelberger and
Hartmann (2007)]. This corresponds to the typical time
scale of the waveguide since the propagation from one
side to another of the waveguide lasts roughly 2 days.
In future studies, both the short-term negative planetary
eddy feedback and the more classical long-term positive
synoptic eddy feedback (e.g., Robinson 2000; Zurita-
Gotor et al. 2014) should be taken into account to interpret
midlatitude jet variability. In a companion paper (Robert
et al. 2016, manuscript submitted to J. Atmos. Sci.), we
investigate both synoptic and planetary eddy feedbacks to
interpret the emergence and persistence of the leading
modes of jet variability in the same quasigeostrophic
model. In particular, we show that synoptic waves also
induce a short-term negative feedback—with a distinct
mechanism—which mainly acts on jet pulses.
Acknowledgments. The authors would like to thank
two anonymous reviewers for their useful comments,
which helped to clarify the paper.
APPENDIX
Deriving the Refractive Index Formulation
The purpose of the appendix is to derive an expression
for the refractive index in the three-level quasigeo-
strophic framework that takes into account the distinct
Rossby radii of deformation. The analytical develop-
ment is similar to the continuously stratified problem,
which is first briefly recalled.
a. The continuously stratified problem
The classical Charney–Drazin problem investigates
the vertical propagation of Rossby waves in a stratified
NOVEMBER 2016 R IV IÈRE ET AL . 4325
medium within the quasigeostrophic framework (Holton
1992). The potential vorticity is expressed in log-pressure
coordinates as follows:
q5=2c1 f 1f 20rR
›
›z*
�rR
N2
›c
›z*
�, (A1)
where rR 5 r0e2z*/H is the density profile of an iso-
thermal atmosphere, and N is the Brunt–Väisälä fre-
quency. We seek solutions of the linearized equation of
conservation of potential vorticity of the form
c0 5 ez*/(2H)Re[~c(y, z*)ei(ml2vt)], (A2)
where v is the frequency. The factor ez*/(2H) is in-
troduced to account for the decrease of density with
height with a scale height H. It leads to the following
expression (Matsuno 1970; Palmer 1982):
›2~c
›y21
f 2
N2
›2~c
›z*21 n2~c5 0, (A3)
where
n2 5›q/›y
u12 ca cosu
2f 2
4N2H22
m2
a2 cos2u. (A4)
We note that the second term on the rhs of Eq. (A4)
appears because of the variation of rR with altitude.
b. The three-level problem
The expression of PV in the three levels written in
Eqs. (2)–(4) can be thought of as being the result of the
discretization of the continuous form of the quasigeo-
strophic PV in pressure coordinates:
q15 f 1=2c
11 f 20
�›
›p
�1
s
›c
›p
��1
5 f 1=2c11R22
0 (c02c
1)2R22
1 (c12c
2) , (A5)
q25 f 1=2c
11 f 20
�›
›p
�1
s
›c
›p
��2
5 f 1=2c21R22
1 (c12c
2)2R22
2 (c22c
3) , (A6)
and
q35 f 1=2c
11 f 20
�›
›p
�1
s
›c
›p
��3
5 f 1=2c31R22
2 (c22c
3)2R22
3 (c32c
4) , (A7)
where s is the stratification parameter, which varies with
the pressure p. The streamfunction at levels above 1
and below 3 is represented by c0 5 c1 and c4 5 c3,
respectively. These equalities are closely related to the
underlying rigid lid conditions of the model. Indeed, the
vertical velocity being zero at the interfaces between
levels 0 and 1 and between levels 3 and 4, this can be, in
particular, satisfied by a zero temperature, which is
equivalent to the vertical derivative of the streamfunction
being zero. The Rossby radii of deformation between
levels 0 and 1 and between levels 3 and 4 are represented
by R0 and R3, respectively.
To obtain the refractive index formulation for the three-
level problem, we need to find a formulation for the line-
arized equation of the potential vorticity where double
derivatives in y and p appear. Therefore, we follow the
same approach as in the continuous problem by seeking
wavelike solutions of the following form:
(c00,c
01,c
02,c
03,c
04)
5
R2
1
R22
~c0,R
1
R2
~c1, ~c
2,R
2
R1
~c3,R2
2
R21
~c4
!ei(ml2vt) , (A8)
with the ratio R1/R2 being introduced to account for the
variation of the Rossby radius of deformation with height,
similar to the treatment of density in Eq. (A2). By
choosing R0 5R21/R2 and R3 5R2
2/R1 (i.e., a linear varia-
tion of the radius of deformation with pressure), the line-
arized PV can be expressed as
q01 5
R1
R2
=2~c11
1
R21
�›2~c
›p2
�1
2R
2
R1
�1
R1
21
R2
�2
~c1, (A9)
q02 5=2~c
21
1
R1R
2
�›2~c
›p2
�2
2
�1
R1
21
R2
�2
~c2, (A10)
and
q03 5
R2
R1
=2~c31
1
R22
�›2~c
›p2
�3
2R
1
R2
�1
R1
21
R2
�2
~c3. (A11)
The linearized version of the conservation of PV [i.e.,
Eq. (1) without diabatic terms] can then be written at
each level as
›2~c1
›y21
R22
R21
1
R1R
2
�›2~c
›p2
�1
1 n21~c15 0, (A12)
›2~c2
›y21
1
R1R
2
�›2~c
›p2
�2
1 n22~c25 0, and (A13)
›2~c3
›y21
R21
R22
1
R1R
2
�›2~c
›p2
�3
1 n23~c35 0, (A14)
where n21, n
22, and n2
3 are expressed in Eqs. (12), (13), and
(14). The second terms on the rhs of the latter equations
4326 JOURNAL OF THE ATMOSPHER IC SC IENCES VOLUME 73
are negative and are a function of the Rossby radii of
deformation, consistent with the continuous problem [see
Eq. (A4)]. We note that, when the two Rossby radii of
deformation are equal (R1 5 R2), these terms are zero.
Hence, when the two Rossby radii of deformation are
different, the waves are less propagating.
REFERENCES
Abatzoglou, J. T., and G. Magnusdottir, 2004: Nonlinear planetary
wave reflection in the troposphere. Geophys. Res. Lett., 31,
L09101, doi:10.1029/2004GL019495.
——, and ——, 2006: Opposing effects of reflective and non-
reflective planetarywave breaking on theNAO. J. Atmos. Sci.,
63, 3448–3457, doi:10.1175/JAS3809.1.
Arakelian, A., and F. Codron, 2012: Southern Hemisphere jet
variability in the IPSL GCM at varying resolutions. J. Atmos.
Sci., 69, 3788–3799, doi:10.1175/JAS-D-12-0119.1.
Balasubramanian, G., and S. Garner, 1997: The role of momentum
fluxes in shaping the life cycle of a baroclinic wave. J. Atmos.
Sci., 54, 510–533, doi:10.1175/1520-0469(1997)054,0510:
TROMFI.2.0.CO;2.
Barnes, E. A., and D. L. Hartmann, 2010: Testing a theory for the
effect of latitude on the persistence of eddy-driven jets using
CMIP3 simulations. Geophys. Res. Lett., 37, L15801, doi:10.1029/
2010GL044144.
——, and ——, 2011: Rossby wave scales, propagation, and the
variability of eddy-driven jets. J. Atmos. Sci., 68, 2893–2908,
doi:10.1175/JAS-D-11-039.1.
——, and L.M. Polvani, 2013: Response of the midlatitude jets, and of
their variability, to increased greenhouse gases in the CMIP5
models. J. Climate, 26, 7117–7135, doi:10.1175/JCLI-D-12-00536.1.
Branstator, G., 2002: Circumglobal teleconnections, the jet stream
waveguide, and the North Atlantic Oscillation. J. Atmos.
Sci., 15, 1893–1910, doi:10.1175/1520-0442(2002)015,1893:
CTTJSW.2.0.CO;2.
Brunet, G., and P. H. Haynes, 1996: Low-latitude reflection of
Rossby wave trains. J. Atmos. Sci., 53, 482–496, doi:10.1175/
1520-0469(1996)053,0482:LLRORW.2.0.CO;2.
Charney, J. G., and P. G. Drazin, 1961: Propagation of planetary-
scale disturbances from the lower into the upper atmosphere.
J. Geophys. Res., 66, 83–109, doi:10.1029/JZ066i001p00083.
Eichelberger, S. J., and D. Hartmann, 2007: Zonal jet structure and
the leading mode of variability. J. Climate, 20, 5149–5150,
doi:10.1175/JCLI4279.1.
Feldstein, S., and S. Lee, 1998: Is the atmospheric zonal index
driven by an eddy feedback? J. Atmos. Sci., 55, 3077–3086,
doi:10.1175/1520-0469(1998)055,3077:ITAZID.2.0.CO;2.
Gall, R., 1976: Structural changes of growing baroclinic waves.
J.Atmos. Sci., 33, 374–390, doi:10.1175/1520-0469(1976)033,0374:
SCOGBW.2.0.CO;2.
Geisler, J., and R. Dickinson, 1974: Numerical study of an in-
teracting Rossby wave and barotropic zonal flow near a
critical level. J. Atmos. Sci., 31, 946–955, doi:10.1175/
1520-0469(1974)031,0946:NSOAIR.2.0.CO;2.
Gerber, E., and G. Vallis, 2007: Eddy–zonal flow interactions and
the persistence of the zonal index. J. Atmos. Sci., 64, 3296–
3311, doi:10.1175/JAS4006.1.
Held, I., 1983: Stationary and quasi-stationary eddies in the ex-
tratropical troposphere: Theory. Large-Scale Dynamical
Processes in the Atmosphere, R. P. Pearce and B. J. Hoskins,
Eds., Academic Press, 127–168.
——, and M. Suarez, 1994: A proposal for the intercomparison of
the dynamical cores of atmospheric general circulation
models. Bull. Amer. Meteor. Soc., 75, 1825–1830, doi:10.1175/
1520-0477(1994)075,1825:APFTIO.2.0.CO;2.
Holton, J., 1992: An Introduction to Dynamic Meteorology. 3rd
ed. International Geophysics Series, Vol. 48, Academic
Press, 511 pp.
Hoskins, B. J., and T. Ambrizzi, 1993: Rossby wave propagation
on a realistic longitudinally varying flow. J. Atmos. Sci.,
50, 1661–1671, doi:10.1175/1520-0469(1993)050,1661:
RWPOAR.2.0.CO;2.
Karoly, D. J., 1983: Rossby wave propagation in a barotropic at-
mosphere. Dyn. Atmos. Oceans, 7, 111–125, doi:10.1016/
0377-0265(83)90013-1.
Kidston, J., and E. P. Gerber, 2010: Intermodel variability of the
poleward shift of the austral jet stream in the CMIP3 in-
tegrations linked to biases in 20th century climatology. Geo-
phys. Res. Lett., 37, L09708, doi:10.1029/2010GL042873.
Killworth, P., and M. E. McIntyre, 1985: Do Rossby-wave critical
layers absorb, reflect, or over-reflect? J. FluidMech., 161, 449–
492, doi:10.1017/S0022112085003019.
Lorenz, D. J., 2014: Understandingmidlatitude jet variability and
change using Rossby wave chromatography: Wave–mean
flow interaction. J. Atmos. Sci., 71, 3684–3705, doi:10.1175/
JAS-D-13-0201.1.
——, and D. L. Hartmann, 2001: Eddy–zonal flow feedback in the
SouthernHemisphere. J. Atmos. Sci., 58, 3312–3327, doi:10.1175/
1520-0469(2001)058,3312:EZFFIT.2.0.CO;2.
——, and ——, 2003: Eddy–zonal flow feedback in the Northern
Hemisphere winter. J. Climate, 16, 1212–1227, doi:10.1175/
1520-0442(2003)16,1212:EFFITN.2.0.CO;2.
Magnusdottir, G., and P. H. Haynes, 1999: Reflection of planetary
waves in three-dimensional tropospheric flows. J. Atmos.
Sci., 56, 652–670, doi:10.1175/1520-0469(1999)056,0652:
ROPWIT.2.0.CO;2.
Marshall, J., and F. Molteni, 1993: Toward a dynamical un-
derstanding of planetary-scale flow regimes. J. Atmos. Sci.,
50, 1792–1818, doi:10.1175/1520-0469(1993)050,1792:
TADUOP.2.0.CO;2.
Matsuno, T., 1970: Vertical propagation of stationary plane-
tary waves in the winter Northern Hemisphere. J. Atmos.
Sci., 27, 871–883, doi:10.1175/1520-0469(1970)027,0871:
VPOSPW.2.0.CO;2.
O’Rourke, A. K., and G. Vallis, 2013: Jet interaction and the in-
fluence of a minimum phase speed bound on the propagation
of eddies. J. Atmos. Sci., 70, 2614–2628, doi:10.1175/
JAS-D-12-0303.1.
Orlanski, I., 2003: Bifurcation in eddy life cycles: Implica-
tion for storm-track variability. J. Atmos. Sci., 60, 993–1023,
doi:10.1175/1520-0469(2003)60,993:BIELCI.2.0.CO;2.
Palmer, T., 1982: Properties of the Eliassen–Palm flux for planetary
scale motions. J. Atmos. Sci., 39, 992–997, doi:10.1175/
1520-0469(1982)039,0992:POTEPF.2.0.CO;2.
Rivière, G., 2009: Effect of latitudinal variations in low-level baro-
clinicity on eddy life cycles and upper-tropospheric wave-
breaking processes. J. Atmos. Sci., 66, 1569–1592, doi:10.1175/
2008JAS2919.1.
Robinson, W., 1996: Does eddy feedback sustain variability in the
zonal index? J. Atmos. Sci., 53, 3556–3569, doi:10.1175/
1520-0469(1996)053,3556:DEFSVI.2.0.CO;2.
——, 2000: A baroclinic mechanism for the eddy feedback on
the zonal index. J. Atmos. Sci., 57, 415–422, doi:10.1175/
1520-0469(2000)057,0415:ABMFTE.2.0.CO;2.
NOVEMBER 2016 R IV IÈRE ET AL . 4327
——, 2006: On the self-maintenance of midlatitude jets. J. Atmos.
Sci., 63, 2109–2122, doi:10.1175/JAS3732.1.
Simmons, A. J., and B. J. Hoskins, 1978: The life cycles of some
nonlinear baroclinic waves. J. Atmos. Sci., 35, 414–432,
doi:10.1175/1520-0469(1978)035,0414:TLCOSN.2.0.CO;2.
Simpson, I., T. Shepherd, P. Hitchcock, and J. F. Scinocca, 2014:
Southern annular mode dynamics in observations and models.
Part II: Eddy feedbacks. J. Atmos. Sci., 71, 2489–2515,
doi:10.1175/JAS-D-13-0325.1.
Thompson, D. W. J., and J. M. Wallace, 2000: Annular modes
in the extratropical circulation. Part I: Month-to-month
variability. J. Climate, 13, 1000–1016, doi:10.1175/
1520-0442(2000)013,1000:AMITEC.2.0.CO;2.
Vallis, G., Ed., 2006: Atmospheric and Oceanic Fluid Dynamics:
Fundamentals and Large-Scale Circulation. Cambridge Uni-
versity Press, 745 pp.
Watterson, I., 2002: Wave–mean flow feedback and the per-
sistence of simulated zonal flow vacillation. J. Atmos. Sci.,
59, 1274–1288, doi:10.1175/1520-0469(2002)059,1274:
WMFFAT.2.0.CO;2.
Yu, J.-Y., and D. L. Hartmann, 1993: Zonal flow vacillation and
eddy forcing in a simple GCM of the atmosphere. J. Atmos.
Sci., 50, 3244–3259, doi:10.1175/1520-0469(1993)050,3244:
ZFVAEF.2.0.CO;2.
Zhang, Y., X.-Q. Yang, Y. Nie, and G. Chen, 2012: Annular
mode–like variation in a multilayer quasigeostrophic
model. J. Atmos. Sci., 69, 2940–2958, doi:10.1175/
JAS-D-11-0214.1.
Zurita-Gotor, P., J. Blanco-Fuentes, and E. Gerber, 2014: The
impact of baroclinic eddy feedback on the persistence of jet
variability in the two-layer model. J. Atmos. Sci., 71, 410–429,doi:10.1175/JAS-D-13-0102.1.
4328 JOURNAL OF THE ATMOSPHER IC SC IENCES VOLUME 73