a simple bioanalytical method for the quantification of
TRANSCRIPT

A simple bioanalytical method for the quantification of antiepilepticdrugs in dried blood spots
Mohamed Shah, N., Hawwa, A. F., Millership, J. S., Collier, P. S., & McElnay, J. C. (2013). A simplebioanalytical method for the quantification of antiepileptic drugs in dried blood spots. JOURNAL OFCHROMATOGRAPHY B-ANALYTICAL TECHNOLOGIES IN THE BIOMEDICAL AND LIFE SCIENCES, 923-924, 65-73. https://doi.org/10.1016/j.jchromb.2013.02.005
Published in:JOURNAL OF CHROMATOGRAPHY B-ANALYTICAL TECHNOLOGIES IN THE BIOMEDICAL AND LIFESCIENCES
Document Version:Peer reviewed version
Queen's University Belfast - Research Portal:Link to publication record in Queen's University Belfast Research Portal
Publisher rights This is the author’s version of a work that was accepted for publication in Journal of Chromatography B. Changes resulting from thepublishing process, such as peer review, editing, corrections, structural formatting, and other quality control mechanisms may not bereflected in this document. Changes may have been made to this work since it was submitted for publication. A definitive version wassubsequently published in Journal of Chromatography B, [VOL 923-924, (2013)]
General rightsCopyright for the publications made accessible via the Queen's University Belfast Research Portal is retained by the author(s) and / or othercopyright owners and it is a condition of accessing these publications that users recognise and abide by the legal requirements associatedwith these rights.
Take down policyThe Research Portal is Queen's institutional repository that provides access to Queen's research output. Every effort has been made toensure that content in the Research Portal does not infringe any person's rights, or applicable UK laws. If you discover content in theResearch Portal that you believe breaches copyright or violates any law, please contact [email protected].
Download date:08. Apr. 2022
Accepted Manuscript
Title: A simple bioanalytical method for the quantification ofantiepileptic drugs in dried blood spots
Authors: N. Mohamed Shah, A.F. Hawwa, J.S. Millership, P.S.Collier, J.C. McElnay
PII: S1570-0232(13)00090-1DOI: doi:10.1016/j.jchromb.2013.02.005Reference: CHROMB 18282
To appear in: Journal of Chromatography B
Received date: 19-10-2012Revised date: 28-1-2013Accepted date: 3-2-2013
Please cite this article as: N.M. Shah, A.F. Hawwa, J.S. Millership, P.S.Collier, J.C. McElnay, A simple bioanalytical method for the quantification ofantiepileptic drugs in dried blood spots, Journal of Chromatography B (2010),doi:10.1016/j.jchromb.2013.02.005
This is a PDF file of an unedited manuscript that has been accepted for publication.As a service to our customers we are providing this early version of the manuscript.The manuscript will undergo copyediting, typesetting, and review of the resulting proofbefore it is published in its final form. Please note that during the production processerrors may be discovered which could affect the content, and all legal disclaimers thatapply to the journal pertain.
Page 1 of 35
Accep
ted
Man
uscr
ipt
2
Title: A simple bioanalytical method for the quantification of antiepileptic drugs in
dried blood spots
Authors: N Mohamed Shah1,2, AF Hawwa1, JS Millership1, PS Collier1, JC McElnay1
1Clinical and Practice Research Group, School of Pharmacy, Medical Biology Centre,
Queen’s University Belfast, 97 Lisburn Road, Belfast, BT9 7BL, UK. School of Pharmacy,
Queen’s University Belfast, UK
2Faculty of Pharmacy, Universiti Kebangsaan Malaysia, Jalan Raja Muda Abdul Aziz, Kuala
Lumpur, Malaysia
Corresponding Author: Professor James C. McElnay, BSc, PhD, FPSNI, FRPharmS,
FACCP, Clinical and Practice Research Group, School of Pharmacy, Medical Biology
Centre, Queen’s University Belfast, 97 Lisburn Road, Belfast BT9 7BL, UK.
Email: [email protected] Tel: +44 2890 335800 Fax: +44 2890 247794
Financial Disclosure: The authors would like to acknowledge the funding received from the
British Council under the Prime Minister’s II Initiative award and from Atlantic Philanthropies.
The authors wish also to acknowledge the Ministry of Higher Education, Malaysia for the
studentship provided. The funder of the current study had no involvement in: (1) design and
conduct of the study; (2) collection, management, analysis, and interpretation of the data;
and (3) preparation, review, or approval of the manuscript.
Conflict of Interest: The authors have no conflicts of interest relevant to this article to
disclose.
Page 2 of 35
Accep
ted
Man
uscr
ipt
3
Abstract
An increasing number of publications on the dried blood spot (DBS) sampling approach for
the quantification of drugs and metabolites have been spurred on by the inherent
advantages of this sampling technique. In the present research, a selective and sensitive
high-performance liquid chromatography method for the concurrent determination of multiple
antiepileptic drugs (AEDs) [levetiracetam (LVT), lamotrigine (LTG), phenobarbital (PHB)],
carbamazepine (CBZ) and its active metabolite carbamazepine-10,11 epoxide (CBZE)] in a
single DBS has been developed and validated. Whole blood was spotted onto Guthrie cards
and dried. Using a standard punch (6mm diameter), a circular disk was punched from the
card and extracted with methanol: acetonitrile (3:1, v/v) containing hexobarbital (Internal
Standard) and sonicated prior to evaporation. The extract was then dissolved in water and
vortex mixed before undergoing solid phase extraction using HLB cartridges.
Chromatographic separation of the AEDs was achieved using Waters XBridge™ C18
column with a gradient system. The developed method was linear over the concentration
ranges studied with r ≥0.995 for all compounds. The lower limits of quantification (LLOQs)
were 2, 1, 2, 0.5 and 1 μg/mL for LVT, LTG, PHB, CBZE and CBZ, respectively. Accuracy
(%RE) and precision (%CV) values for within and between day were <20% at the LLOQs
and <15% at all other concentrations tested. This method was successfully applied to the
analysis of the AEDs in DBS samples taken from children with epilepsy for the assessment
of their adherence to prescribed treatments.
Page 3 of 35
Accep
ted
Man
uscr
ipt
4
Highlights:
We report a simple method for the analysis of four antiepileptic drugs in DBS samples
The method was applied to DBS samples collected from children with epilepsy
Such technique has potential in assessing adherence to AEDs using home sampling
Keywords: Antiepileptic drugs; Dried blood spot; HPLC; Children
Abbreviations:
AEDs Antiepileptic drugs
DBS Dried blood spot
CBZ Carbamazepine
LTG Lamotrigine
PHB Phenobarbital
LVT Levetiracetam
HPLC High Performance Liquid Chromatography
CBZE carbamazepine-10,11 epoxide

Page 4 of 35
Accep
ted
Man
uscr
ipt
5
1. Introduction
Antiepileptic drugs are the mainstay for the control of seizures in the management of
epilepsy [1]. Regular monitoring of AED serum concentrations i.e. therapeutic drug
monitoring (TDM), to guide dosage adjustments, is especially useful for children due to the
greater pharmacokinetic variability in this population compared to adults. TDM is also
important in assessing compliance with the prescribed regimen [2–4].
Dried blood spot (DBS) sampling is a technique used to collect capillary whole blood, either
from a finger or heel prick, by spotting the blood onto a filter paper/card. This procedure was
first established by Dr. Robert Guthrie in 1963 to measure phenylalanine for the detection of
phenylketonuria in newborns [5]. Since then, this technique has been utilised for the
population screening of newborns for inborn errors of metabolism and other clinical
applications including the detection of a wide range of biological markers in epidemiological
studies [6–7], disease surveillance [6–9] as well as toxicological evaluations and screening
illicit drug use [10–12].
DBS sampling provides various advantages over conventional venous sampling. It is
relatively non-invasive, with minimal blood volumes drawn [9]. This makes the technique
particularly valuable for collecting samples in infants, children and the elderly [7]. DBS
collection can be performed by non-medically trained individuals and by patients themselves
after adequate training [7–8]. It also avoids the risks associated with the use of needles and
syringes [13]. DBS samples do not need to be centrifuged or separated after collection
unlike plasma or serum [7], which in turn also reduces the risks associated with handling of
potentially infected materials [13]. A unique attribute of the DBS sampling is that it enables

Page 5 of 35
Accep
ted
Man
uscr
ipt
6
samples to be collected by patients themselves or parents/guardians at home and for
samples to be posted by regular mail to the laboratory for analysis [8–9]. This allows
convenient monitoring at any desired sampling time and for the monitoring results to be
readily available at the clinic during a routine check-up [8].
Analysis of single AED concentrations in DBS has been reported for topiramate [14],
phenobarbital [15], lamotrigine [16–19], gabapentin [20], phenytoin [21] and rufinamide [22].
However, apart from one recent study by Déglon et al. (which determined clobazam and
clonaxepam) [23], no recent publication reported on the simultaneous determination of the
concentration of multiple AEDs in a single DBS sample. The combined determination of
different AEDs has the potential to monitor polymedicated patients and offers the possibility
to quantify clinical samples of patients treated with any of these compounds in one
sequence, with a single set of calibrators and QC samples [24]. The analysis of multiple
AEDs in a single DBS had been explored by researchers at the Epilepsy Centre, Hemestede
in the Netherlands and the MEDTOX® laboratories in the US, but with limited information
published [25–28]. Therefore, the aim of the present research was to develop and validate a
method to analyse the AEDs of interest, i.e. carbamazepine (CBZ) and its active metabolite
carbamazepine-10,11 epoxide (CBZE), levetiracetam (LVT), lamotrigine (LTG) and
phenobarbital (PHB) in DBS samples using High Performance Liquid Chromatography
(HPLC) with ultraviolet (UV) detection. These AEDs were selected based on a recent audit
by our group of the most commonly prescribed AEDs in children with epilepsy in N. Ireland
(data not published). Determination of the AEDs of interest in plasma or serum samples
using HPLC with UV or diode array detection (DAD) detection has been reported in the
literature [29–33]. The analytical methodology was optimised and applied in the analysis of
the AEDs in DBS samples of children with epilepsy collected at the clinic and in the patients’
home for adherence determination.
Page 6 of 35
Accep
ted
Man
uscr
ipt
7
2. Experimental
2.1. Materials
LVT, LTG, PHB, CBZ, CBZE, hexobarbital (HXB) [internal standard], potassium dihydrogen
phosphate and dipotassium hydrogen phosphate were purchased from Sigma-Aldrich
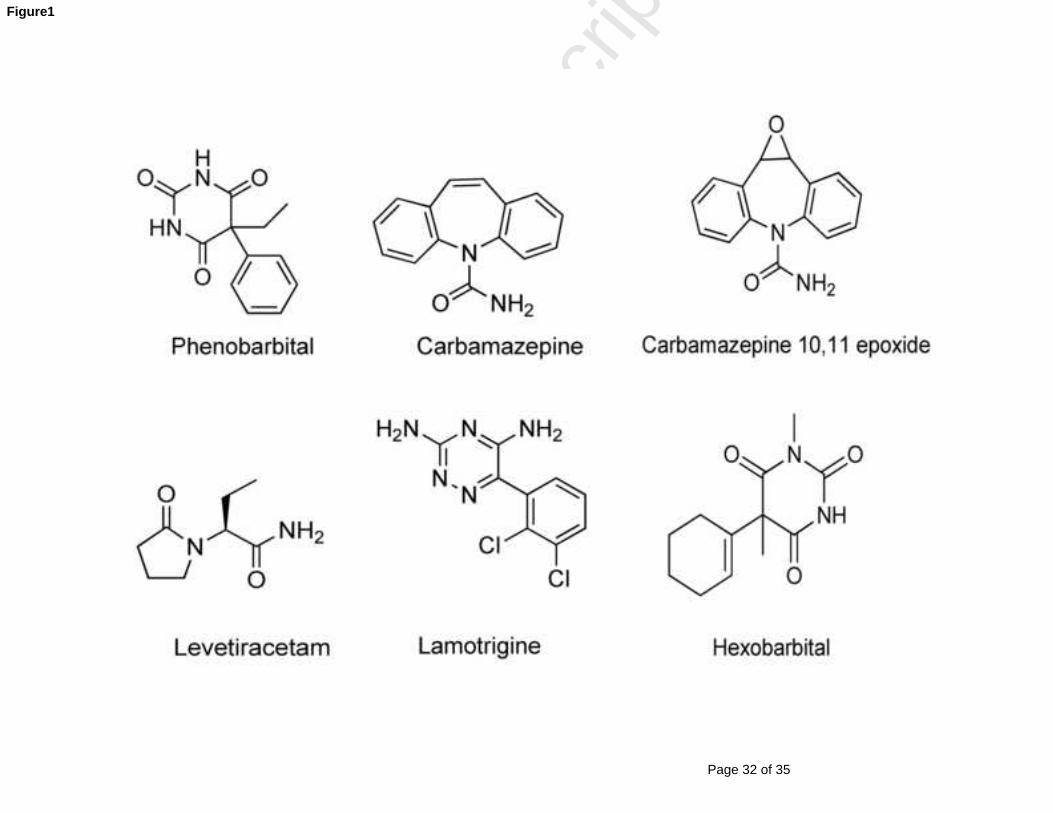
(Poole, England), the chemical structures of the AEDs are shown in Fig. 1. Methanol and
acetonitrile were of HPLC grade and obtained from AGB Scientific Apparatus, Ltd (Belfast,
N. Ireland). The water utilised was purified using a Milipore Direct-QTM 5 water purification
system (Milipore, Watford, England). Filtration of the phosphate buffer (part of the mobile
phase) was performed using FP-VericelTM (0.45μm) membrane filters purchased from
Sartorius (Epsom, UK).
2.2. Standards
HXB was used as an internal standard, a stock solution of the IS was prepared by dissolving
25mg in 25mL of methanol and this was further diluted with methanol (1:100). Stock
solutions of LVT, LTG, PHB and CBZ were prepared at a concentration of 1mg/mL in
methanol. A stock solution of CBZE was prepared at a concentration of 0.5mg/mL in
methanol. The stock solutions were further diluted (1:25) with mobile phase consisting of
75% buffer (25mM phosphate buffer pH 6.2), 15% acetonitrile and 10% methanol. The
working standards were prepared by further dilutions of the diluted (1:25) stock solutions
with the mobile phase described above. Solutions of the calibration standards were prepared
from the working standards.
Ten microlitres of each of the analytes of interest (LVT, LTG, PHB, CBZ and CBZE) in
methanol were added to 0.95mL human whole blood aliquots to yield final concentrations of
the calibration standards (C1-C8) in the concentration range 0.5μg/mL to 10μg/mL for CBZE,
Page 7 of 35
Accep
ted
Man
uscr
ipt
8
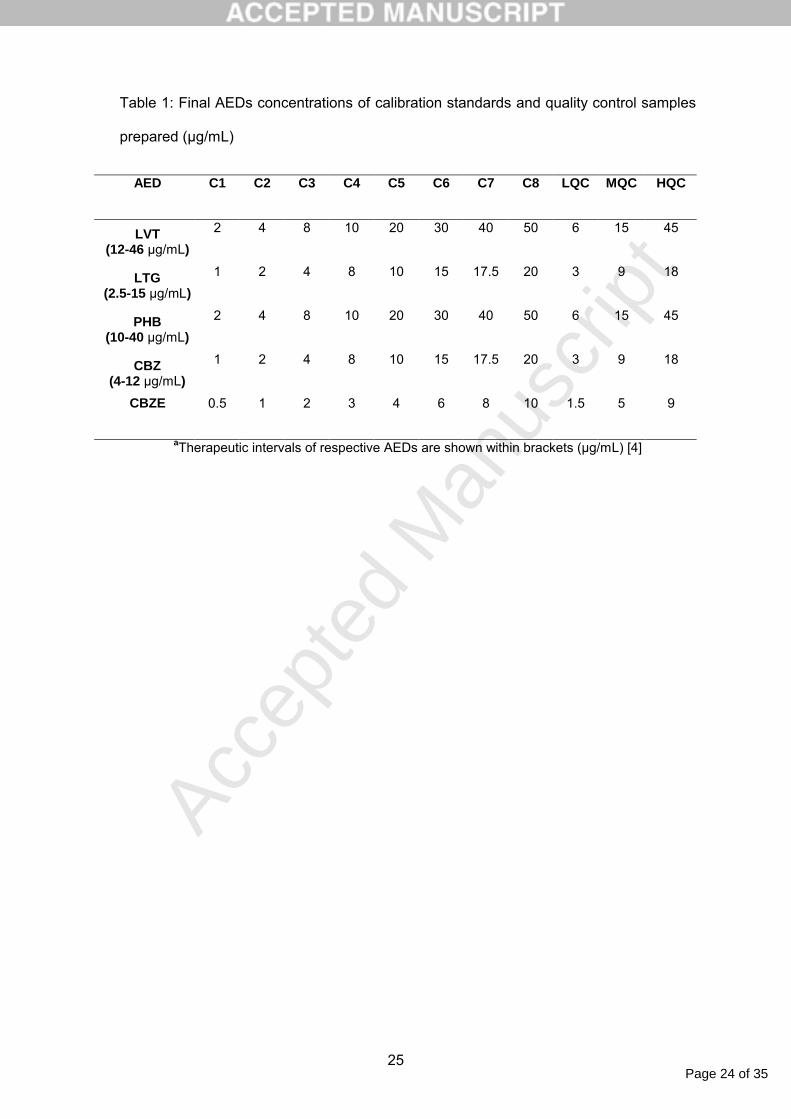
1μg/mL to 20μg/mL for LTG and CBZ, and 2μg/mL to 50μg/mL for LVT and PHB (Table 1).
The lowest calibrator concentrations were arbitrarily chosen as the lower limits of
quantification (LLOQs). The low, medium and high quality control (LQC, MQC and HQC)
samples were prepared with final concentrations as shown in the Table 1.
2.3. Sample preparation and extraction
Thirty microlitres of the prepared spiked blood standards were spotted onto individual
Guthrie cards (Schleicher & Schuell 903®, Aston Ltd, England), dried overnight at room
temperature in the dark and stored within a greaseproof paper liner, inside a sealed
polypropylene container at -80ºC until required for analyses. For each DBS, a 6mm diameter
disk was punched manually and placed in a polypropylene Eppendorf tube (2.0mL capacity).
An aliquot (980µL) of extracting solvent containing methanol:acetonitrile (3:1, v/v) and 20µL
of the 10µg/mL HXB was added to the disk and the tube was sonicated using a DECON
FS200® frequency sweep water-bath sonicator for 15 minutes. The sample mixture was then
placed in a disposable glass culture tube and the extract dried under a stream of nitrogen at
40ºC for 30 minutes using a Zymark TurboVap® LV Evaporator Workstation. The residue
was then dissolved in 1 mL water and vortex mixed for 30 seconds before undergoing solid
phase extraction (SPE).
The SPE procedure was carried out using a Waters Extraction Manifold with Oasis® HLB
1mL cartridges that had been conditioned using 1mL of methanol followed by 1mL of water.
The loaded sample was drawn through the cartridge at a maximum flow rate of 1mL/min.
The cartridge was then washed with 1mL water and the AEDs eluted with 1mL of
methanol:acetonitrile mixture (3:1, v/v) at a maximum flow rate of 1mL/min. The eluate was
evaporated under a stream of nitrogen at 40ºC for 20 minutes and reconstituted with 100μL
of mobile phase (75% phosphate buffer pH 6.2, 15% acetonitrile and 10% methanol). The

Page 8 of 35
Accep
ted
Man
uscr
ipt
9
extract was transferred into an auto sampler vial and 50μL was injected onto the HPLC
column.
2.4. Chromatography
HPLC analysis was carried out on a Waters® Alliance HPLC system consisting of Waters®
2695 Separations Module connected to the Waters® 2487 Dual Wavelength Absorbance
Detector. Data recording was carried out using Empower™ software. The separation was
performed using an XBridge™ C18 column (150 x 4.6mm, 3.5μ; Waters, UK) fitted with an
XBridge™ guard column of similar chemistry (20 x 4mm, 3.5μ; Waters, UK).
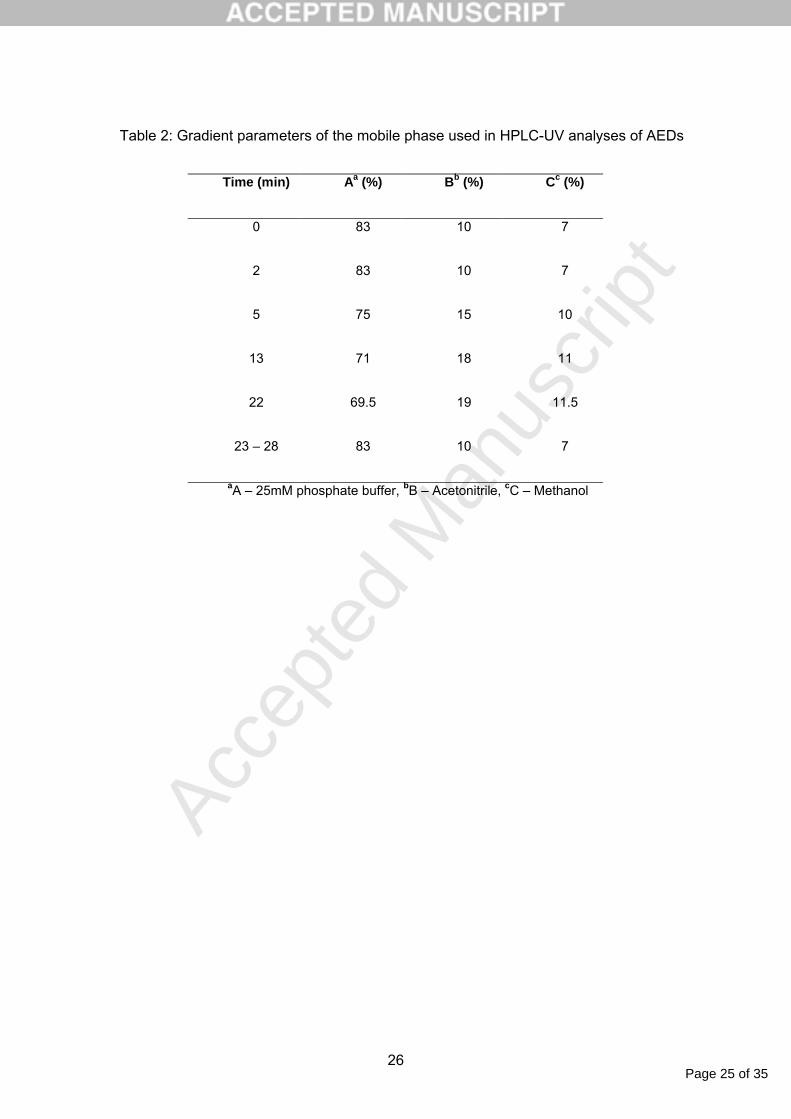
The mobile phase consisted of a mixture of 25mM phosphate buffer containing 12.5mM
sodium chloride, pH 6.2 (A), acetonitrile (B) and methanol (C) delivered using a gradient
method (Table 2) at a flow rate of 1mL/min. The mobile phase solutions were degassed and
filtered through a 0.45μm filter prior to use. The column temperature was maintained at 45ºC
and the wavelength for UV detection was set at 205nm. Total analysis run time was 28
minutes.
2.5. Assay characteristics for method validation
Validation of the developed method was performed to evaluate the following parameters:
selectivity, linearity, limits of detection and quantification, accuracy and precision, recovery
and stability. Experiments were also conducted to determine the effects of volume of blood
used to prepare the DBS on the measured concentration of the AEDs. Validation of the
analytical method developed in the present study was according to the guidelines of the
International Conference on Harmonisation (ICH) [34].
Page 9 of 35
Accep
ted
Man
uscr
ipt
10
2.5.1. Selectivity
Selectivity was investigated using six independent sources of blood from six volunteer
subjects. DBS samples were prepared from blank blood and from blood spiked with all of the
AEDs of interest at the lower limit of quantification (LLOQ). This was to ensure that there
were no interfering peaks present at the retention time of the AEDs of interest. Potential
interference from concomitant anti-epileptic medications commonly taken by paediatric
patients was investigated by analysing samples which had been spiked with the appropriate
drugs, i.e. clobazam, valproic acid, ethosuximide, phenytoin, gabapentin, vigabatrin and
topiramate.
2.5.2. Linearity
A five-day calibration was carried out to determine the linearity of the developed assay for
eight concentrations of the AEDs spiked in DBS samples. The AEDs were spiked in
combination for each of the concentrations as shown in Table 1. The calibration also
consisted of a blank and a zero sample (blank DBS with IS added). Calibration plots were
constructed for peak area ratio (analyte response/IS response) versus the analyte
concentration in order to assess the relationship between the two parameters. Linear
regression analysis was performed to determine the slope, intercept and correlation
coefficient of the calibration lines. The homoscedasticity assumption for each linear
regression analysis was tested using the F-test [35].
2.5.3. Accuracy and precision
Accuracy and precision were determined by replicate analysis of samples containing known
amounts of the analyte. They were the quality control (QC) samples prepared at four
concentrations (LLOQ, low QC, middle QC and high QC). Five replicates at each QC

Page 10 of 35
Accep
ted
Man
uscr
ipt
11
concentration were used to calculate within-day accuracy and precision. Between-day
accuracy and precision were determined at each QC concentration over five consecutive
days.
The QC samples were analysed against the calibration curve and the concentrations
obtained were compared with the known value. The accuracy and precision of the method
were expressed as the mean percent relative error (%RE) and percent coefficient of
variation (%CV) respectively. The mean accuracy (%RE) and precision (%CV) should be
within 15% of the actual value except for LLOQ which should not deviate by more than 20%
[36].
2.5.4. Limit of detection (LOD) and lower limit of quantification (LLOQ)
The LOD and the LLOQ were calculated using the following formulae:
LOD = 3.3 σ/ S LLOQ = 10 σ/S
where σ is the standard deviation of the response, S is the slope of the calibration curve.
The slope was estimated from the calibration curve of the analyte and σ from the residual
standard deviation of the regression line generated from the Empower™ software.
2.5.5. Recovery
The absolute recovery of an analytical process was determined by comparing the detector
response obtained from a known amount of analyte added to, and extracted from, the
biological matrix with the detector response obtained for the true concentration of the pure
authentic standard representing 100% recovery. Six replicates of three concentrations (low,
middle and high QCs) of DBS samples spiked with all AEDs for each of the concentrations
Page 11 of 35
Accep
ted
Man
uscr
ipt
12
were extracted and analysed. The detector response obtained was compared with the
detector response from solution standards.
2.5.6. Stability
Stability of the AEDs in DBS samples was assessed over a 6-week period at -80ºC and
room temperature (25ºC). Stability was also assessed for storage of the samples at 40ºC for
3 days using a GenLab® 50 litre oven with digital control (OV/50/DIG). Three replicates of
each AED at the high QC concentration were analysed and compared against freshly
prepared spiked blood spots.
2.5.7. The effect of the volume and haematocrit of blood used to prepare the DBS on the
measured concentration of AEDs
DBS samples were prepared using varying volumes (20-50μL) of blood, spiked with all the
AEDs together to give the final concentrations as follows: CBZ and LTG 12.5µg/mL, PHB
and LVT 25µg/mL and CBZE 6.25µg/mL. The samples were processed according to the
method described in section 2.3, by taking a 6mm disk from the centre of the DBS. The
measured concentrations of the AEDs were compared in triplicate.
In order to examine the effect of varying haematocrit (Hct) levels on the accurate
quantification of AEDs, various Hct levels of whole blood were created by adding plasma to
or removing plasma from fresh human blood. Blood was prepared at Hct levels of 30, 42.5
and 55% and then spiked with all AEDs at the concentrations described above. DBS
samples prepared from spiked blood were processed in the same way and measured
concentrations compared in triplicate.

Page 12 of 35
Accep
ted
Man
uscr
ipt
13
2.5.8. Statistical methods and data analysis
Analysis of the data was carried out using Microsoft® Excel 2007 (Microsoft Corporation,
USA). SPSS® software (version 17.0) was used to present the calibration curve plots.
Calibration curve regression analysis was performed using Empower™ software (Waters
Corporation, USA).
3. Results and discussion
3.1. Method development and optimisation
Initial analytical method development in this study was based on the article by Vermeij and
Edelbroek [32] for simultaneous determination of seven AEDs in serum.
HXB was used as the IS as it was well separated chromatographically from the AEDs of
interest. Other compounds were tested for suitability as an IS, i.e. 5-ethyl-(5-para)-2-thio-tolyl
barbituric acid and barbital, but were not selected for the final methodology due to poor
chromatographic separation.
During method development using standard solutions, chromatographic conditions
suggested by Vermeij and Edelbroek [32] were applied. Separation was performed using an
Xbridge™ C18 column 3.5μm particle size (15cm x 0.46cm) column, which was preceded by
an Xbridge™ guard column of similar chemistry. Xbridge™ C18 columns are designed using
Hybrid Particle Technology (HPT) – Ethylene-Bridged (BEH Technology™) Hybrids by
Waters®. Such columns are claimed to be superior to other reversed-phase columns using
silica-based packing materials, resulting in improved peak shapes for basic compounds and
enabling operation under wider pH ranges [37].
Chromatographic conditions, such as the column temperature of 45ºC and phosphate buffer
composition (12.5mM, pH 6.2) were used in the analytical method. Acetate and phosphate
Page 13 of 35
Accep
ted
Man
uscr
ipt
14
buffers prepared at pH 3 and 5 were also tested during optimisation of the mobile phase
compositions, however, phosphate buffer at pH 6.2 as described above was found to be the
most suitable in achieving resolution of all peaks of interest.
Initially, a mobile phase consisting of a mixture of methanol (14.5%), acetonitrile (19.5%) and
phosphate buffer (66%) delivered isocratically at a flow rate of 0.9mL/min was used. This
enabled good resolution of all compounds of interest with the exception of LVT. This was
mainly because LVT is highly polar, hence, requiring a mobile phase with very low organic
strength to be retained on a reversed phase column [38-39]. To achieve such
chromatographic conditions, whilst retaining conditions suitable for the other AEDs of
interest, a gradient elution approach was applied. Optimisation of the gradient conditions
was carried out and the best separation of the AEDs was attained with gradient parameters
as shown in Table 2. Without LVT included in the analysis, UV detection wavelengths of
215nm and 275nm were found to be appropriate. However, a wavelength of 205nm was
used to monitor the absorbance of all AEDs analysed, mainly because LVT lacks
chromophores and detection was only feasible using very short wavelengths [39].
The UV detection method was feasible in this assay since all of the AEDs of interest are
active at relatively high concentrations (µg/ml, rather than ng/ml), hence justifying the use of
UV detection as a good and cost-effective option. The use of LC mass-spectrometry [LC-
MS(/MS)], on the other hand, has recently gained more attention and acceptance as it offers
improved sensitivity (allow measurement of very low concentrations), with shorter run times
due to enhanced selectivity. For the purpose described in the current study, however, i.e.
routine therapeutic monitoring of AEDs, the use of LC-MS(/MS) technique may actually be
considered 'over-engineering' due to the high costs involved and lack of availability of the
instrumentation in all clinical laboratories.
Optimisation of AEDs’ extraction was carried out by testing mixtures of methanol:acetonitrile
at 1:1, v/v and 3:1, v/v as well as acetonitrile:water 1:1, v/v as the extraction solvent. The use
Page 14 of 35
Accep
ted
Man
uscr
ipt
15
of acetonitrile:water mixture has been suggested by Janis et al. [27] as the extraction solvent
of choice to extract AEDs from DBS samples. However, it has been reported that using
water for extraction of DBS samples increases the interference from endogenous
compounds and should be avoided where possible [8]. This was confirmed by visual
inspection of the DBS samples after extraction with the acetonitrile:water mixture (1:1, v/v),
which showed that the extract was coloured when compared with extraction using
methanol:acetonitrile mixtures. In addition to having a cleaner extract, the use of the
methanol:acetonitrile mixture results in protein denaturation and precipitation [8–9], which
could be a significant advantage when considering agents which are highly bound to plasma
proteins. In this study, it was found that extraction using methanol:acetonitrile (3:1, v/v) gave
rise to better recovery (extraction efficiency) of the AEDs when compared with
methanol:acetonitrile (1:1, v/v) extraction solvent.
The SPE procedure was optimised using Oasis® HLB cartridges in preference to Oasis®
Mixed-mode sorbent cartridges, which are specific for either acidic or basic compounds. This
was due to dissimilar chemistry of the AEDs: LVT and LTG are basic compounds, PHB
acidic and CBZ neutral [40]. Utilisation of Oasis® HLB cartridges, a hydrophilic-lipophilic
balanced copolymer, enabled high recoveries for all compounds of interest. Before loading
into the cartridges, the extracted sample was evaporated under a stream of nitrogen at 40ºC
using a Zymark TurboVap® LV Evaporator Workstation and reconstituted in water.
Reconstitution with 5% of methanolic solution resulted in the loss of the AEDs due to lack of
retention of the AEDs during the loading step. This was ascertained by collecting the load
sample after passing through the cartridge and injecting it onto the HPLC. For the washing
step, various percentages of methanol in water with 2% ammonia or 2% formic acid were
tested during the SPE method optimisation. No difference was observed in the recovery of
the AEDs indicating that ammonia or formic acid was not needed during the SPE sample
clean-up. Consequently, only water was used as the washing solvent.

Page 15 of 35
Accep
ted
Man
uscr
ipt
16
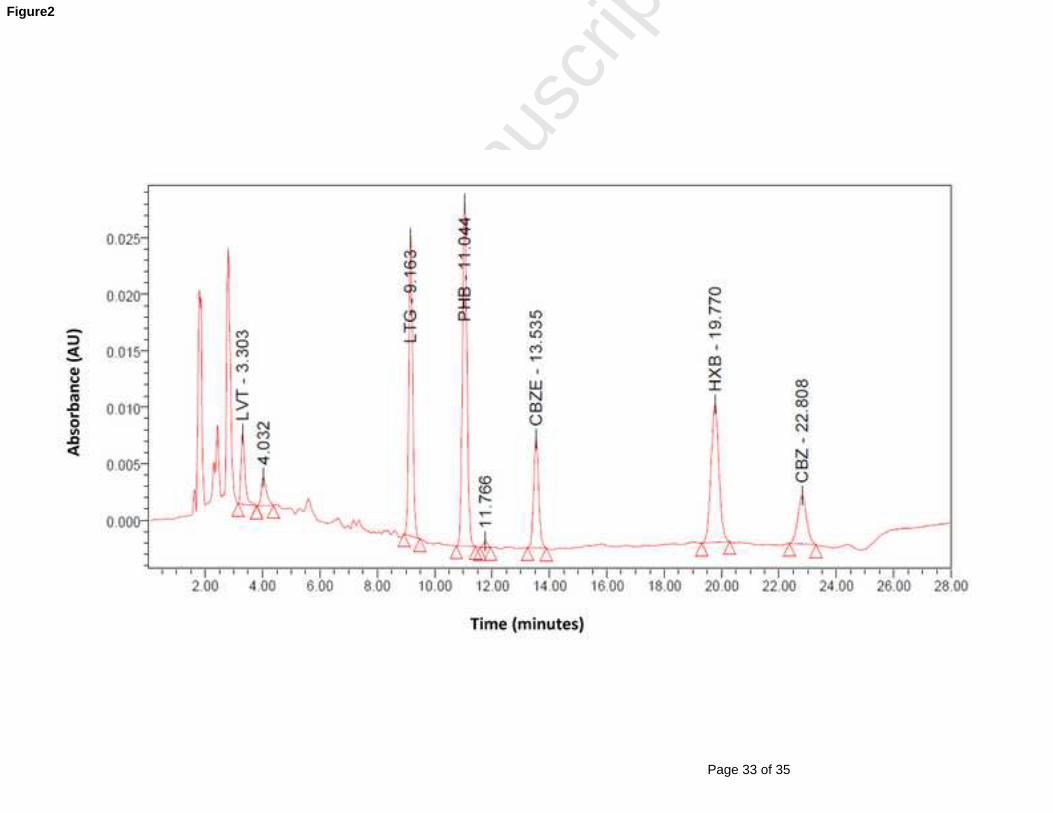
The chromatogram for the AEDs of interest, extracted from spiked DBS samples, together
with their retention times, is shown in Fig. 2.
3.2. Method validation
3.2.1. Selectivity
The AEDs were found to be well resolved (Fig. 2) using the chromatographic conditions
described above. No interfering peaks were observed in the extracted blank DBS
chromatograms when overlaid with chromatograms of extracted DBS samples spiked with
AEDs at the LLOQ. This indicated that the method exhibited selectivity and the individual
AEDs were not affected by the presence of endogenous compounds. Furthermore,
selectivity of the analytical method was also evaluated using blank blood samples from six
different blood sources. Peaks from endogenous compounds were seen close to the
retention time for LVT, which was expected as a result of the low UV detection wavelength
(205nm) selected. Nevertheless, this compound was able to be separated and quantified at
its LLOQ concentration with acceptable intra- and inter-day accuracy and precision ranging
from -0.45% to 13.74% (i.e. within the acceptable limits of <20%). No interferences from the
anti-epileptic drugs commonly given to the study patients were observed (see earlier).
3.2.2. Linearity
The F-test revealed a significant difference between the variances of highest and lowest QC
concentrations (experimental F-value was significantly higher than tabled F-value at 99%
confidence level), thus homoscedasticity assumption was not met. Several calibration
models were explored using the Empower™ software to ascertain the most suitable
calibration curve for each of the AEDs analysed. These included the non-weighted, 1/x and
1/x2 weighted linear regression models. Evaluation of the best fit and percentage deviation of
the calculated concentration from the nominal concentration of each of the AEDs indicated

Page 16 of 35
Accep
ted
Man
uscr
ipt
17
that the 1/x2 weighted linear regression model was the most suitable model. This approach
adequately described the relationship between the concentration and peak area response
(ratio of the peak area of the AED and peak area of the IS; PAR). The calibration curves for
all the AEDs were found to be linear over the concentration range selected. The mean
correlation coefficient, slope and intercept values from the five calibration curves are
presented in Table 3.
3.2.3. Accuracy and precision
Within and between day accuracy and precision data were determined for each of the AEDs
during the 5-day validation experiments at low, middle and high QC concentrations.
Precision and accuracy were found to be within ± 15% at all QC concentrations as shown in
Table 4.
3.2.4. Limit of detection (LOD) and lower limit of quantification (LLOQ)
The results obtained for the LOD and LLOQ for each compound are shown in Table 5. The
values of LOD and LLOQ presented are the highest values obtained from the 5-day
calibration results. The validated LLOQ is presented in Table 4 together with the calculated
intra- as well as inter-day accuracy and precision. The validated LLOQ for CBZE (0.5 μg/mL)
has been shown to be lower than the calculated value (0.78 μg/mL) for the compound. All
values were within the acceptable limit of ±20%.
3.2.5. Recovery
The calculated recoveries for each of the AEDs at each concentration of QC standards (n=6)
are presented in Table 6. Recovery was found to be consistent and precise with %CV less
than 12%. Recovery values at each concentration of QC standards were above 80% for all

Page 17 of 35
Accep
ted
Man
uscr
ipt
18
AEDs analysed except for LVT which had recovery values ranging from 61% to 72% (Table
6). However, using the DBS matrix, the percentage recovery was acceptable as the %CV for
this compound was consistently less than 12% at each QC concentration.
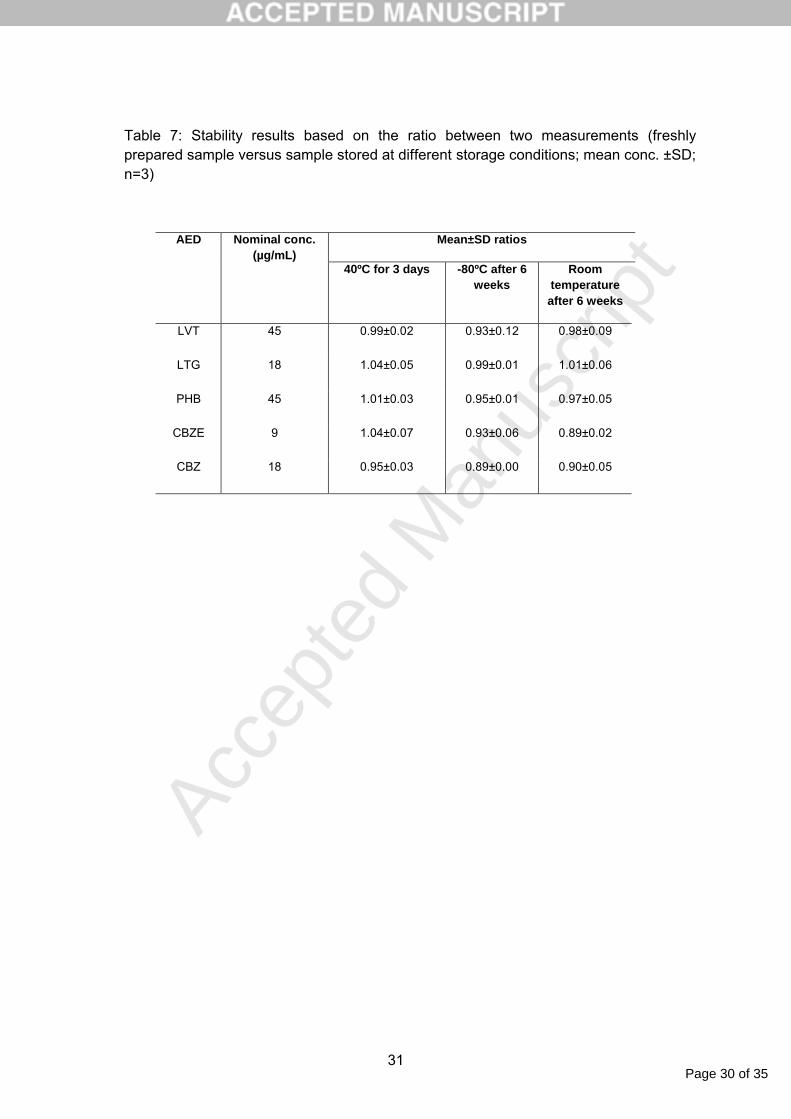
3.2.6. Stability
The result of the stability studies indicated that the AEDs in the DBS matrix were stable at -
80ºC and room temperature (25ºC) over a 6-week storage period. They were also found to
be stable after storage at 40ºC for three days. The values were found to range between
0.89±0.02 and 1.04±0.07 indicating stability of the AEDs at the storage conditions employed
(Table 7).
The temperature and duration of storage were selected to resemble the actual conditions
occurring during actual sample collection and handling in the clinical study. Stability
assessment after storage at room temperature was carried out as DBS samples collected in
the patients’ home would be stored at room temperature prior to mailing them to the
laboratory the next day. There would also be the possibility that these samples were
exposed to higher temperatures (e.g. storage over weekend in a sun-heated post-box or
near a heating device), hence the selection of 40ºC to ensure that the AEDs were stable
despite being stored at this temperature.
3.2.7. The effect of the volume and haematocrit of blood used to prepare the DBS on the
measured concentration of AEDs
The volume of blood spotted on to the Guthrie cards was varied to evaluate the effect of
spotted blood volume on the measured concentration of AEDs. Volumes ranging from 20 to
50μL of blood were chosen to mimic the actual collection of patient samples during the
adherence study. Volumes beyond 50μL were not evaluated as it was not expected that
volumes greater than 50μL would be obtained from a finger prick in children in the clinical
study.
Page 18 of 35
Accep
ted
Man
uscr
ipt
19
A fixed volume of 30μL was chosen as the standard volume of blood to be spotted on to the
Guthrie cards in the preparation of blood spot calibration standards and quality control
samples. This volume was selected as it filled the pre-printed circles on the Guthrie cards
and enabled a 6mm diameter punch to be utilised for sample processing.
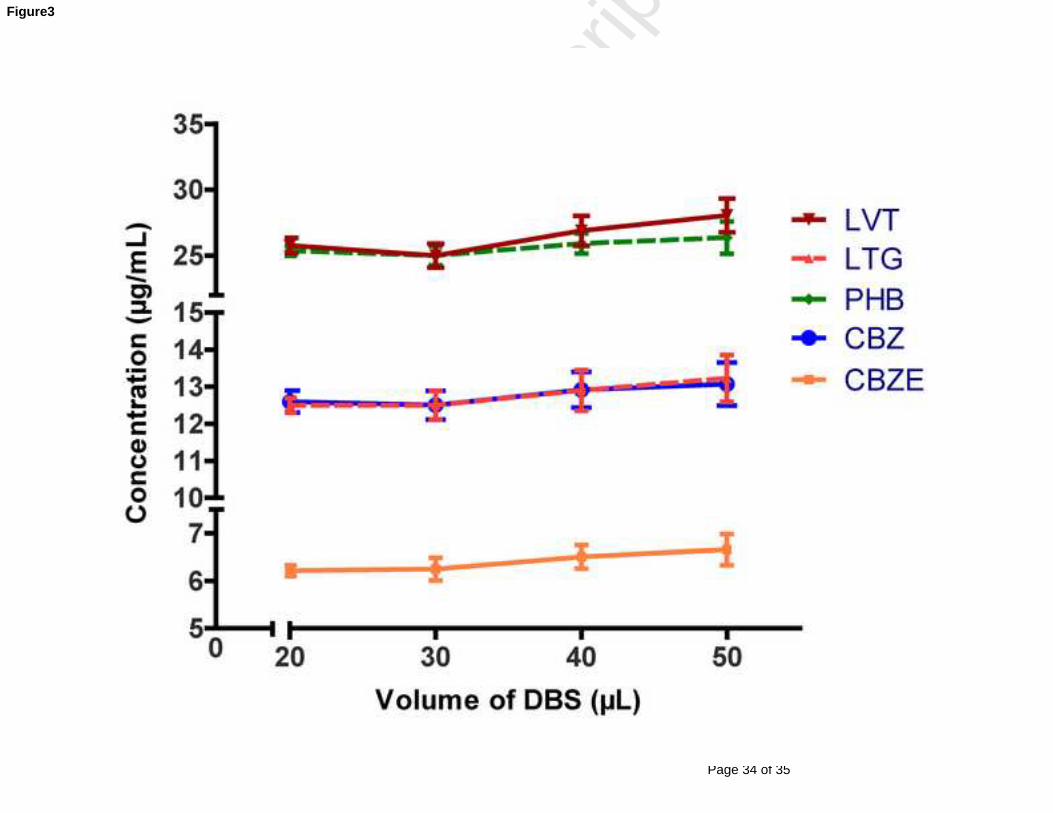
The measured concentration for each of the AEDs at the differing volumes displayed
accuracy and precision, presented as %RE and %CV respectively of less than ±5%. The
influence of blood spot volume on the measured concentration of the AEDs is presented
graphically in Figs. 3 and 4. In general, there was a slight increase in the concentration of
the AEDs at 50μL compared to 20μL of blood volume spotted. The highest percentage
difference in the measured concentration between 20μL and 50μL of blood volume spotted
was, however, only 5.85%, which was observed for LVT. This finding coincides with the
report of other investigators who have shown a minor effect of blood volume on measured
concentrations in DBS samples [41].
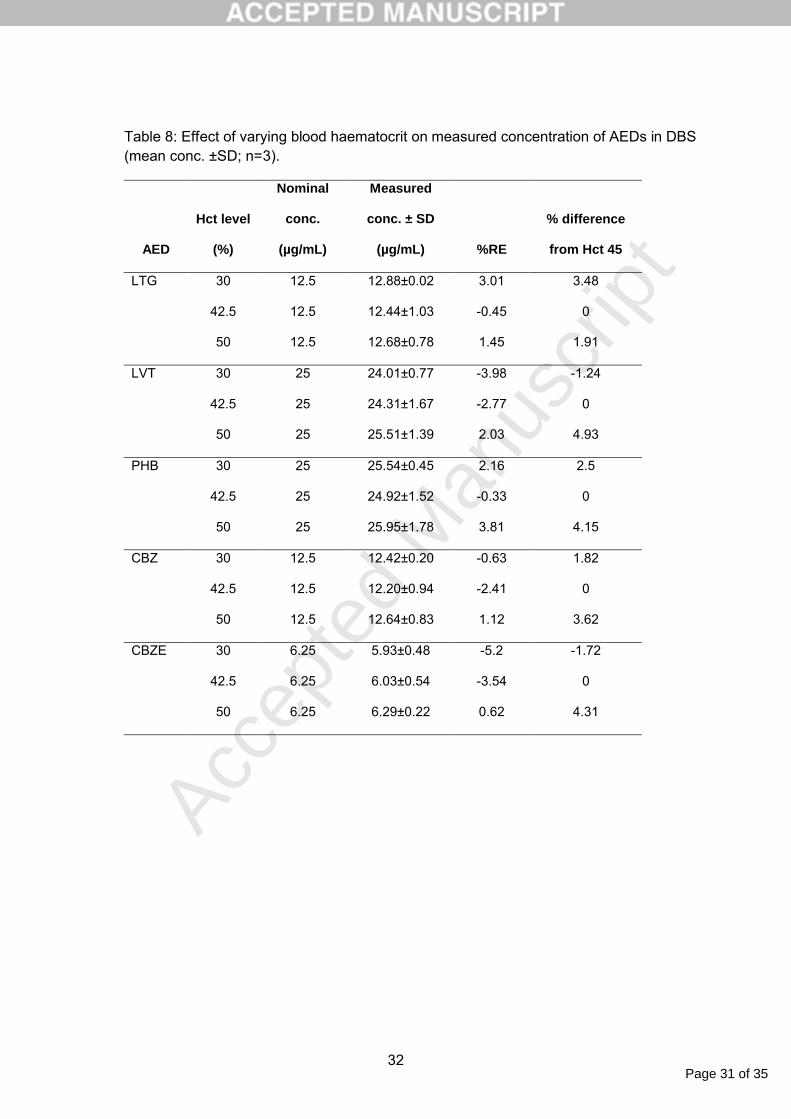
The effect of varying Hct levels on measured AED concentrations is shown in Table 8. The
results demonstrated minimal effect of Hct within the range of 30-55% on measured
concentration of AEDs in DBS. Each of the measured AEDs displayed a difference of less
than ±5% from that measured at the middle Hct level (42.5%) within the range studied; Hct
values below 30% or beyond 55% were not expected in the children studied.
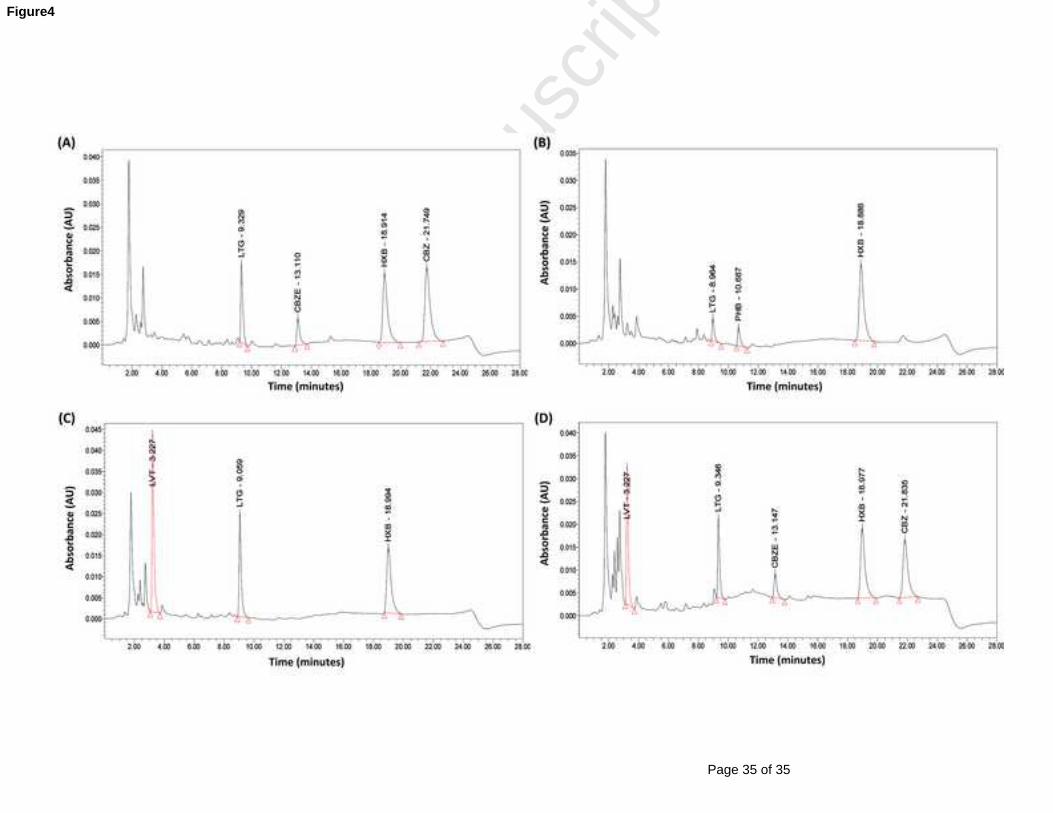
3.2.8. Clinical application
The developed method was applied to the analysis of LTG, PHB, LVT, CBZ and CBZE in
DBS samples collected from children with epilepsy as one of the methods for adherence
assessment. Fig. 4 illustrates representative chromatograms obtained from the analysis of
each of the AEDs of interest in DBS samples obtained from children at the clinic. Findings
from the adherence study using the method described above will be the subject of a
separate publication.
4. Conclusion
Page 19 of 35
Accep
ted
Man
uscr
ipt
20
A simple analytical procedure for simultaneous analysis of four AEDs and one metabolite in
DBS samples has been successfully developed and validated according to the
recommended guidelines. AEDs could be quantified with acceptable accuracy and precision
using the analytical method developed. The microanalytical method shown here has been
successfully applied in analysing DBS obtained from finger pricks in paediatric patients with
epilepsy as part of an adherence study. This minimally-invasive sample collection technique
has potential in the therapeutic drug monitoring of the AEDs to ascertain adherence or for
other relevant purposes, in the paediatric population in the clinical setting.
Acknowledgements
The authors gratefully acknowledge Dr Peter M. Edelbroek at the Epilepsy Institute, the
Netherlands, for his knowledge-sharing and advice on the DBS technique.
References
[1] NICE guideline. The epilepsies: The diagnosis and management of the epilepsies in
adults and children in primary and secondary care; National Institute for Health and
Clinical Excellence. Available at: http://www.nice.org.uk (2004) [Accessed August 1,
2011].
[2] S.M. Hadjiloizou, B.F. Bourgeois, Expert Rev. Neurother. 7 (2007) 179.
[3] M. Raspall-Chaure, B.G. Neville, R.C. Scott, Lancet Neurol. 7 (2008) 57.
[4] P.N. Patsalos, D.J. Berry, B.F. Bourgeois, J.C. Cloyd, T.A. Glauser, S.I. Johannessen,
I.E. Leppik, T. Tomson, E. Perucca, Epilepsia 49 (2008) 1239.
[5] R. Guthrie, A. Susi, Pediatr. (1963) 338.
[6] J.V. Mei, J.R. Alexander, B.W. Adam, W.H. Hannon, J. Nutr. 131 (2001) 1631.

Page 20 of 35
Accep
ted
Man
uscr
ipt
21
[7] T.W. McDade, S. Williams, J.J. Snodgrass, Demography 44 (2007) 899.
[8] P.M. Edelbroek, J. Heijden, L.M.L. Stolk, Ther. Drug Monit. 31 (2009) 327.
[9] W. Li, F.L.S. Tse, Biomed. Chromatogr. 24 (2010) 49.
[10] L.O. Henderson, M.K. Powell, W.H. Hannon, J.T. Bernert Jr, K.A. Pass, P. Fernhoff,
C.D. Ferre, L. Martin, E. Franko R.W. Rochat, Biochem. Mol. Med. 61 (1997) 143.
[11] R.G. Boy, J. Henseler, R. Mattern, G. Skopp, Ther. Drug Monit. 30 (2008) 733.
[12] Stove CP, Ingels AS, De Kesel PM, Lambert WE. Crit. Rev. Toxicol 42 (2012) 230.
[13] S.P. Parker, W.D. Cubitt, J. Clin. Pathol. 52 (1999) 633.
[14] G. la Marca, S. Malvagia, L. Filippi, P. Fiorini, M. Innocenti, F. Luceri, G. Pieraccini, G.
Moneti, S. Francese, F.R. Dani, R. Guerrini, J. Pharm. Biomed. Anal. 48 (2008) 1392.
[15] G. la Marca, S. Malvagia, L. Filippi, F. Luceri, G. Moneti, R. Guerrini, Epilepsia 50
(2009) 2658.
[16] J. Soons, M. Van Bree, J. Coumou, J. Hulsman, Nederlands Tijdschrift voor Klinische
Chemie en Laboratoriumgeneeskunde 31 (2006) 238.
[17] I. Wegner, P.M. Edelbroek, S. Bulk, D. Lindhout, Neurol. 73 (2009) 1388.
[18] I. Wegner, P. Edelbroek, G. De Haan, D. Lindhout, J.W. Sander, Epilepsia 51 (2010)
2500.
[19] S. AbuRuz, M. Al-Ghazawi, Y. Al-Hiari, Chromatographia 71 (2010) 1093.
[20] F. Kolocouri, Y. Dotsikas, Y.L. Loukas, Anal. Bioanal. Chem. 398 (2010) 1339.
[21] Coombes EJ, Gamlen TR, Batstone GF, Leigh PN. Ann Clin Biochem 21 (1984) 519.
[22] G. la Marca, S. Malvagia, L. Filippi, M. Innocenti, A. Rosati, M. Falchi, S. Pellacani, G.
Moneti, R. Guerrini, J. Pharm. Biomed. Anal. 54 (2011) 192.
[23] Déglon J, Versace F, Lauer E, Widmer C, Mangin P, Thomas A, Staub C. Bioanalysis
4 (2012) 1337.
[24] Maudens KE, Stove CP, Cocquyt VF, Denys H, Lambert WE. J Chromatogr B Analyt
Technol Biomed Life Sci 877 (2009) 3907.

Page 21 of 35
Accep
ted
Man
uscr
ipt
22
[25] T. Vermeij, P. Edelbroek P. Determination of anticonvulsant blood levels using the
blood spot method. Available at:
http://www.sein.nl/sites/default/images/laboratorium/Bloodspot%20UK%20Website%2
0SEIN.pdf. (2000) [Accessed August 1, 2011].
[26] G.C. Janis, K.J. Walker, J.A. Collins, Epilepsia 45 (2004) 145.
[27] G. Janis, K. Walker, J. Collins, MEDTOX® Laboratories, Inc., St. Paul, MN, USA, 2004.
[28] G.C. Janis, K.J. Walker, J.A. Collins, Epilepsia 46 (2005) 219.
[29] F. Bugamelli, C. Sabbioni, R. Mandrioli, E. Kenndler, F. Albani, M.A. Raggi, Anal.
Chim. Acta 472 (2002) 1.
[30] L. Franceschi, M. Furlanut, Pharmacol. Res. 51 (2005) 297.
[31] K.M. Patil, S.L. Bodhankar, J. Chrom. B: Anal. Technol. Biomed. Life Sci. 823 (2005)
152.
[32] T.A.C. Vermeij, P.M. Edelbroek, J. Chromatogr. B: Anal. Technol. Biomed. Life Sci.857
(2007) 40.
[33] L. Budakova, H. Brozmanova, M. Grundmann, J. Fischer, J. Sep. Sci. 31 (2008) 2.
[34] ICH [International Conference on Harmonisation] Expert Working Group. ICH
harmonised tripartite guideline Q2b: Validation of analytical procedures: Methodology.
Available at:
http://www.fda.gov/downloads/Drugs/GuidanceComplianceRegulatoryInformation/Guid
ances/ucm073384.pdf (1996) [Accessed August 1, 2011].
[35] Almeida AM, Castel-Branco MM, Falcão AC. J Chromatogr B Analyt Technol Biomed
Life Sci. 774 (2002) 215.
[36] FDA Guidance for industry: Bioanalytical method validation. US Department of Health
and Human Services, Food and Drug Administration (FDA), Rockville, USA. Available
at:
http://www.fda.gov/downloads/Drugs/GuidanceComplianceRegulatoryInformation/Guid
ances/ucm070107.pdf (2001) [Accessed August 1, 2011].

Page 22 of 35
Accep
ted
Man
uscr
ipt
23
[37] K.D. Wyndham, T.H. Walter, P.C. Iraneta, U.D. Neue, P.D. McDonald, D. Morrison, M.
Baynham, Waters Corporation, Massachusetts, USA. Available at:
http://www.waters.com/webassets/cms/library/docs/720001159en.pdf (2005)
[Accessed August 1, 2011].
[38] P. Patsalos, in: R. Levy, R. Mattson, B. Meldrum, E. Perucca (Eds.), Antiepileptic
Drugs, Lippincott Williams & Wilkins, Philadelphia, PA, USA, 2002, p. 428.
[39] J. Martens-Lobenhoffer, S.M. Bode-Böger, J. Chromatogr. B: Anal. Technol. Biomed.
Life Sci. 819 (2005) 197.
[40] D.F. Chollet, J. Chromatogr. B: Anal. Technol. Biomed. Life Sci. 767 (2002) 191.
[41] Vu DH, Koster RA, Alffenaar JW, Brouwers JR, Uges DR. J Chromatogr B
Analyt Technol Biomed Life Sci (2011) 1063.
Page 23 of 35
Accep
ted
Man
uscr
ipt
24
Figure Legends:
Fig. 1: Chemical structures of PHB, CBZ, CBZE, PHT, LVT, LTG and HXB (IS)
Fig. 2: Chromatogram showing the result of extraction and separation of spiked blood spot of
LVT (10µg/mL), LTG (15µg/mL), PHB (20µg/mL), CBZE (4.5µg/mL) and CBZ (4µg/mL) with
IS HXB (2µg/mL) monitored at 205nm
Fig. 3: Influence of blood spot volume on the measured concentration of LVT (25µg/mL),
LTG (12.5µg/mL), PHB (25µg/mL), CBZ (12.5µg/mL) and CBZE (6.25µg/mL) [mean conc.
±SD; n=3]
Fig. 4: Representative chromatograms of extracted DBS samples obtained from patients
treated with multiple AEDs; (A) LTG and CBZ (found concentrations were 7.4 and
12.7µg/mL, respectively and 2.4µg/mL for CBZE); (B) LTG and PHB (found concentrations
were 1.9 and 2.1µg/mL, respectively); (B) LVT and LTG (found concentrations were 45.2
and 10.6µg/mL, respectively); (C) LVT, LTG and CBZ (found concentrations were 35.3, 7.5
and 9.9µg/mL, respectively and 2.0µg/mL for CBZE).
Page 24 of 35
Accep
ted
Man
uscr
ipt
25
Table 1: Final AEDs concentrations of calibration standards and quality control samples
prepared (µg/mL)
AED C1 C2 C3 C4 C5 C6 C7 C8 LQC MQC HQC
LVT(12-46 µg/mL)
2 4 8 10 20 30 40 50 6 15 45
LTG(2.5-15 µg/mL)
1 2 4 8 10 15 17.5 20 3 9 18
PHB(10-40 µg/mL)
2 4 8 10 20 30 40 50 6 15 45
CBZ(4-12 µg/mL)
1 2 4 8 10 15 17.5 20 3 9 18
CBZE 0.5 1 2 3 4 6 8 10 1.5 5 9
aTherapeutic intervals of respective AEDs are shown within brackets (µg/mL) [4]
Page 25 of 35
Accep
ted
Man
uscr
ipt
26
Table 2: Gradient parameters of the mobile phase used in HPLC-UV analyses of AEDs
Time (min) Aa (%) Bb (%) Cc (%)
0 83 10 7
2 83 10 7
5 75 15 10
13 71 18 11
22 69.5 19 11.5
23 – 28 83 10 7
aA – 25mM phosphate buffer, bB – Acetonitrile, cC – Methanol

Page 26 of 35
Accep
ted
Man
uscr
ipt
27
Table 3: Mean slope, intercept and correlation coefficient according to the calibration
curves plotted (n=5)
AED Mean slope ± SD Mean intercept ± SD Mean correlation
coefficient (r) ± SD
LVT 0.034±0.003 0.032±0.015 0.995±0.003
LTG 0.305±0.005 0.044±0.037 0.998±0.001
PHB 0.147±0.004 0.050±0.026 0.996±0.002
CBZE 0.283±0.006 0.047±0.006 0.997±0.002
CBZ 0.188±0.005 0.020±0.026 0.998±0.001

Page 27 of 35
Accep
ted
Man
uscr
ipt
28
Table 4: Results of within day (intra-day) and between days (inter-day) accuracy and
precision measurements (n=5)
Within day Between dayAED Nominal
conc.
(µg/mL)Measured
conc. ± SD
(µg/mL)
Accuracy
%RE
Precision
%CV
Measured
conc. ± SD
(µg/mL)
Accuracy
%RE
Precision
%CV
2 (LLOQ) 2.27±0.30 13.74 13.25 1.99±0.10 -0.45 5.24
6 (LQC) 6.33±0.26 5.46 4.06 6.14±0.11 2.25 1.78
15 (MQC) 15.92±1.00 6.11 6.26 15.10±0.78 0.63 5.20
LVT
45 (HQC) 42.51±5.50 -5.54 12.94 44.41±5.33 -1.31 12.00
1 (LLOQ) 0.96±0.08 -4.40 8.29 1.00±0.02 -0.06 1.56
3 (LQC) 3.01±0.09 0.45 2.85 3.01±0.19 0.23 6.34
9 (MQC) 9.26±0.37 2.87 4.01 9.21±0.39 2.28 4.26
LTG
18 (HQC) 17.99±0.29 -0.07 1.62 17.73±0.64 -1.48 3.63
2 (LLOQ) 1.96±0.13 -1.81 6.42 1.92±0.08 -3.76 4.19
6 (LQC) 6.66±0.19 10.97 2.8 6.60±0.33 10.01 4.96
15 (MQC) 16.89±0.68 12.62 4.03 16.85±0.72 12.31 4.26
PHB
45 (HQC) 44.83±0.85 -0.38 1.9 44.27±1.51 -1.62 3.41
0.5 (LLOQ) 0.41±0.04 -17.08 9.36 0.48±0.02 -3.68 3.35
1.5 (LQC) 1.67±0.05 11.40 2.93 1.66±0.12 10.71 7.27
5 (MQC) 5.34±0.22 6.72 4.06 5.29±0.24 5.81 4.50
CBZE
9 (HQC) 8.82±0.17 -1.97 1.90 8.73±0.32 -3.01 3.68
1 (LLOQ) 0.99±0.06 -0.68 5.84 0.99±0.03 -1.36 3.36
3 (LQC) 3.11±0.08 3.55 2.67 3.11±0.16 3.75 5.09
9 (MQC) 9.50±0.39 5.54 4.12 9.37±0.44 4.10 4.75
CBZ
18 (HQC) 20.58±0.40 14.33 1.92 20.11±0.86 11.70 4.28

Page 28 of 35
Accep
ted
Man
uscr
ipt
29
Table 5: Calculated LOD and LOQ for AEDs in DBS samples
AED LOD (µg/mL) LOQ (µg/mL)
LVT 0.380 1.150
LTG 0.223 0.676
PHB 0.318 0.963
CBZE 0.300 0.908
CBZ 0.258 0.780

Page 29 of 35
Accep
ted
Man
uscr
ipt
30
Table 6: Recovery results for QC standards of the AEDs of interest (n=6)
AED Nominal conc. (µg/mL)
Percentage recovery ± SD
Precision
%CV
Overall percentage recovery ±
SD
Overall precision
%CV
6 71.60±2.98 4.15
15 61.05±2.28 3.73
LVT
45 65.54±7.77 11.86
66.07±5.30 8.02
3 97.93±3.13 3.20
9 99.13±7.16 7.22
LTG
18 94.51±1.70 1.80
97.19±2.40 2.47
6 99.04±3.41 3.44
15 96.89±6.67 6.89
PHB
45 87.08±1.41 1.62
94.34±6.38 6.76
1.5 94.39±3.18 3.37
5 95.51±6.46 6.77
CBZE
9 99.71±1.81 1.81
96.54±2.80 2.90
3 89.68±3.39 3.78
9 80.35±5.66 7.04
CBZ
18 93.95±1.74 1.86
87.99±6.96 7.91
Page 30 of 35
Accep
ted
Man
uscr
ipt
31
Table 7: Stability results based on the ratio between two measurements (freshly prepared sample versus sample stored at different storage conditions; mean conc. ±SD; n=3)
Mean±SD ratiosAED Nominal conc. (µg/mL)
40ºC for 3 days -80ºC after 6 weeks
Room temperature after 6 weeks
LVT 45 0.99±0.02 0.93±0.12 0.98±0.09
LTG 18 1.04±0.05 0.99±0.01 1.01±0.06
PHB 45 1.01±0.03 0.95±0.01 0.97±0.05
CBZE 9 1.04±0.07 0.93±0.06 0.89±0.02
CBZ 18 0.95±0.03 0.89±0.00 0.90±0.05
Page 31 of 35
Accep
ted
Man
uscr
ipt
32
Table 8: Effect of varying blood haematocrit on measured concentration of AEDs in DBS (mean conc. ±SD; n=3).
AED
Hct level
(%)
Nominal
conc.
(µg/mL)
Measured
conc. ± SD
(µg/mL) %RE
% difference
from Hct 45
LTG 30 12.5 12.88±0.02 3.01 3.48
42.5 12.5 12.44±1.03 -0.45 0
50 12.5 12.68±0.78 1.45 1.91
LVT 30 25 24.01±0.77 -3.98 -1.24
42.5 25 24.31±1.67 -2.77 0
50 25 25.51±1.39 2.03 4.93
PHB 30 25 25.54±0.45 2.16 2.5
42.5 25 24.92±1.52 -0.33 0
50 25 25.95±1.78 3.81 4.15
CBZ 30 12.5 12.42±0.20 -0.63 1.82
42.5 12.5 12.20±0.94 -2.41 0
50 12.5 12.64±0.83 1.12 3.62
CBZE 30 6.25 5.93±0.48 -5.2 -1.72
42.5 6.25 6.03±0.54 -3.54 0
50 6.25 6.29±0.22 0.62 4.31
Page 32 of 35
Accep
ted
Man
uscr
ipt
Figure1
Page 33 of 35
Accep
ted
Man
uscr
ipt
Figure2
Page 34 of 35
Accep
ted
Man
uscr
ipt
Figure3
Page 35 of 35
Accep
ted
Man
uscr
ipt
Figure4