a social–aware recommender system based on user’s personal
TRANSCRIPT
International Journal of
Geo-Information
Article
A Social–Aware Recommender System Based onUser’s Personal Smart Devices
Soroush Ojagh 1,2,* , Mohammad Reza Malek 1 and Sara Saeedi 2
1 Dept. of GIS, Faculty of Geodesy and Geomatics Engineering, K.N. Toosi University of Technology,Tehran 19967-15433, Iran; [email protected]
2 Department of Geomatics Engineering, University of Calgary, Calgary, AB T2N 4V8, Canada;[email protected]
* Correspondence: [email protected]
Received: 6 August 2020; Accepted: 29 August 2020; Published: 30 August 2020�����������������
Abstract: Providing recommendations in cold start situations is one of the most challenging problemsfor collaborative filtering based recommender systems (RSs). Although user social context informationhas largely contributed to the cold start problem, most of the RSs still suffer from the lack of initialsocial links for newcomers. For this study, we are going to address this issue using a proposed usersimilarity detection engine (USDE). Utilizing users’ personal smart devices enables the proposedUSDE to automatically extract real-world social interactions between users. Moreover, the proposedUSDE uses user clustering algorithm that includes contextual information for identifying similar usersbased on their profiles. The dynamically updated contextual information for the user profiles helpswith user similarity clustering and provides more personalized recommendations. The proposed RSis evaluated using movie recommendations as a case study. The results show that the proposed RScan improve the accuracy and personalization level of recommendations as compared to two otherwidely applied collaborative filtering RSs. In addition, the performance of the USDE is evaluatedin different scenarios. The conducted experimental results on USDE show that the proposed USDEoutperforms widely applied similarity measures in cold start and data sparsity situations.
Keywords: user similarity detection; cold start problem; context awareness (CA); recommendationsystem (RS); smart devices; artificial bee colony (ABC), social interactions; collaborative filtering (CF)
1. Introduction
With the tremendous growth of the Internet of things (IoT), smart devices, and social networks(SNs), information load is growing every day [1]. Mobile computing as indicated in [2,3] IoT, and sensingdevices are becoming more intelligent so that they can socially interact with each other like humansand generate a large amount of data on a daily basis [4]. Recent advances in localization techniqueshas made location-based SNs popular as the convergence of location-based services and SNs [5].Fast-developing location-related contents generated by location-based SNs has stimulated research intodeveloping novel filtering and exploring tools that provide users with more personalized information [5].Oceans of data generated by smart devices and SNs makes the fast development of recommendersystems (RS) inevitable [6–8]. The RS can be used as a tool to filter items that are more likely to bepreferred by users [9]. They have also been proposed as knowledge management services to analyzeand filter efficient information on users [10]. Due to their importance in the daily lives of users in recentdecades, RSs have gained attention especially from the social and computer science communities [6,11].
A challenge for RSs is providing personalized recommendations to users when there is not enoughinformation describing users or items, also known as the cold start problem (CSP) [12–17]. The similaritybetween users or items can be considered to be the most commonly applied approach for addressing
ISPRS Int. J. Geo-Inf. 2020, 9, 519; doi:10.3390/ijgi9090519 www.mdpi.com/journal/ijgi
ISPRS Int. J. Geo-Inf. 2020, 9, 519 2 of 28
the CSP [12,18]. For conventional RSs, the similarities between users were identified by either theiruser-created comments, or by ratings of different items. However, empirical research demonstratedthat only 15 percent of similar users can be identified by their created comments or ratings [13].Utilizing social relations to identify similar users for social-aware RSs can be considered a recentadvancements in SNs for addressing the CSP [12,19]. Although applying this approach can largelyeliminate the CSP, it imposes a new constraint on the RS, which relies on SNs to identify similar users.In addition, social-aware RSs still suffer from the lack of initial social links for newcomers (i.e., the CSPis still a bottleneck for RSs when there is no information describing the user’s social interactions).
Apart from the development of various feature-rich, location-based SNs, the CSP still persists in theprovision of highly personalized recommendations for new users and locations. Utilizing user mobilitypatterns and geographical properties such as movement trajectories and common check-ins, can beconsidered recent advancements in finding similar users for location-based RSs [20]. Torrijos et al. [20],demonstrated that applying the similarity detection technique based on user trajectories can resultin more reliable recommendations in comparison to other similarity approaches such as consideringsimilar ratings in order to find similar users. However, the trajectory-based similarity detectionapproach is more computationally expensive than the other competitive approaches [20,21].
In addition to the CSP, providing more personalized recommendations which are more in-linewith user preferences can be considered the underlying goal for social-aware RSs. Recommending morepersonalized items requires a deeper understanding of users’ dynamic behaviors [22]. User preferencescan be automatically reasoned and extracted using smart devices [23–25]. Different types ofcontextual information including user interests, activities, physical environments, social circles,devices, times, and locations have been considered for different RSs in order to provide morepersonalized recommendations. However, manually collecting user preferences is neither alwayspossible, nor sufficient. Investigated contexts in most of the recent studies are limited to those thatcan be extracted from embedded sensors in smartphones [26]. For this research, we are going to usedifferent smart devices in addition to smartphones to automatically extract profile information.
For this research, a combination of different technologies including smart devices, SNs, artificialintelligence (AI), and context awareness (CA), are integrated into a hybrid RS to address the CSP andprovide more personalized recommendations. To summarize, the main contributions of this researchare as follow:
1. Proposing a novel user similarity detection engine (USDE) that can model similarities betweenusers by considering social interactions created in the real world or virtually through SNs;
2. Integrating the potential of users’ personal smart devices with RSs to capture awide variety of contextual information about users and consequently provide morepersonalized recommendations;
3. Equipping the proposed USDE with a user clustering algorithm to enable the proposed RS to faceeven the most challenging cold start situations for which other RSs, including location-based RSs,fail to provide personalized recommendations.
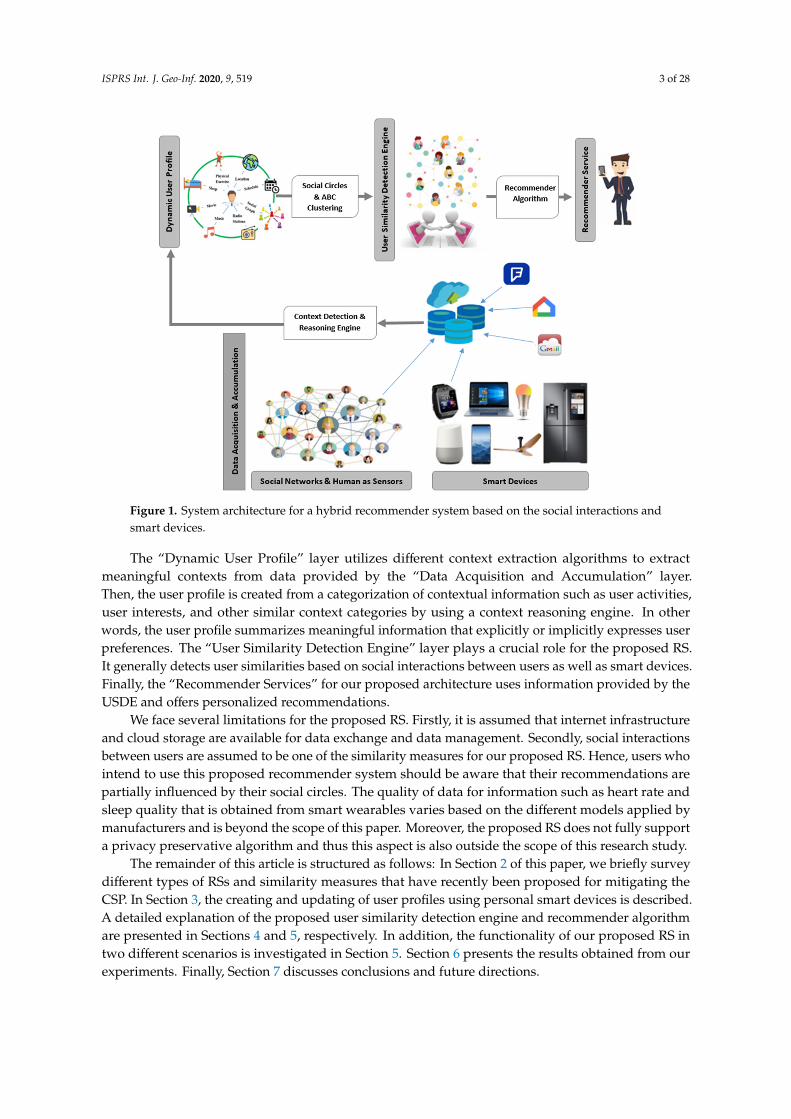
The architecture of the proposed hybrid RS consists of four different layers. As seen in Figure 1,the “Data Acquisition and Accumulation” layer is the bottom layer of this architecture. Smart devicessuch as Google Home, smart wearables, and smartphones are mainly responsible for collecting datathat can be used to extract user-related contextual information. The data acquisition layer also containsdifferent types of SNs that provides users social links that provides users social links that were madevirtually through SNs. A variety of common data types such as events, locations, tips, and multimediainformation are also extracted from different types of SNs. As various smart devices and sensorsexport their data in different formats, the accumulation layer is in charge of collecting and storingdata in the required format in a central data repository. Finally, providing access to various kinds ofonline RESTful (Representational State Transfer) Application Programming Interfaces (APIs), datasets,and databases is defined as the other responsibility of the accumulation layer.
ISPRS Int. J. Geo-Inf. 2020, 9, 519 3 of 28
ISPRS Int. J. Geo–Inf. 2020, 9, x FOR PEER REVIEW 3 of 29
various kinds of online RESTful (Representational State Transfer) Application Programming Interfaces (APIs), datasets, and databases is defined as the other responsibility of the accumulation layer.
The “Dynamic User Profile” layer utilizes different context extraction algorithms to extract meaningful contexts from data provided by the “Data Acquisition and Accumulation” layer. Then, the user profile is created from a categorization of contextual information such as user activities, user interests, and other similar context categories by using a context reasoning engine. In other words, the user profile summarizes meaningful information that explicitly or implicitly expresses user preferences. The “User Similarity Detection Engine” layer plays a crucial role for the proposed RS. It generally detects user similarities based on social interactions between users as well as smart devices. Finally, the “Recommender Services” for our proposed architecture uses information provided by the USDE and offers personalized recommendations.
We face several limitations for the proposed RS. Firstly, it is assumed that internet infrastructure and cloud storage are available for data exchange and data management. Secondly, social interactions between users are assumed to be one of the similarity measures for our proposed RS. Hence, users who intend to use this proposed recommender system should be aware that their recommendations are partially influenced by their social circles. The quality of data for information such as heart rate and sleep quality that is obtained from smart wearables varies based on the different models applied by manufacturers and is beyond the scope of this paper. Moreover, the proposed RS does not fully support a privacy preservative algorithm and thus this aspect is also outside the scope of this research study.
Figure 1. System architecture for a hybrid recommender system based on the social interactions and smart devices
The remainder of this article is structured as follows: In Section 2 of this paper, we briefly survey different types of RSs and similarity measures that have recently been proposed for mitigating the CSP. In Section 3, the creating and updating of user profiles using personal smart devices is described. A detailed explanation of the proposed user similarity detection engine and recommender algorithm
Figure 1. System architecture for a hybrid recommender system based on the social interactions andsmart devices.
The “Dynamic User Profile” layer utilizes different context extraction algorithms to extractmeaningful contexts from data provided by the “Data Acquisition and Accumulation” layer.Then, the user profile is created from a categorization of contextual information such as user activities,user interests, and other similar context categories by using a context reasoning engine. In otherwords, the user profile summarizes meaningful information that explicitly or implicitly expresses userpreferences. The “User Similarity Detection Engine” layer plays a crucial role for the proposed RS.It generally detects user similarities based on social interactions between users as well as smart devices.Finally, the “Recommender Services” for our proposed architecture uses information provided by theUSDE and offers personalized recommendations.
We face several limitations for the proposed RS. Firstly, it is assumed that internet infrastructureand cloud storage are available for data exchange and data management. Secondly, social interactionsbetween users are assumed to be one of the similarity measures for our proposed RS. Hence, users whointend to use this proposed recommender system should be aware that their recommendations arepartially influenced by their social circles. The quality of data for information such as heart rate andsleep quality that is obtained from smart wearables varies based on the different models applied bymanufacturers and is beyond the scope of this paper. Moreover, the proposed RS does not fully supporta privacy preservative algorithm and thus this aspect is also outside the scope of this research study.
The remainder of this article is structured as follows: In Section 2 of this paper, we briefly surveydifferent types of RSs and similarity measures that have recently been proposed for mitigating theCSP. In Section 3, the creating and updating of user profiles using personal smart devices is described.A detailed explanation of the proposed user similarity detection engine and recommender algorithmare presented in Sections 4 and 5, respectively. In addition, the functionality of our proposed RS intwo different scenarios is investigated in Section 5. Section 6 presents the results obtained from ourexperiments. Finally, Section 7 discusses conclusions and future directions.
ISPRS Int. J. Geo-Inf. 2020, 9, 519 4 of 28
2. Literature Review
Content-based (CB) and collaborative filtering (CF) algorithms are recognized as the two mostwidely used recommendation approaches [13,27]. Although their main purpose is estimating userinterest in new items, CB algorithms recommend items that are similar to the ones previously preferredby the user; whilst CF algorithms recommend items based on what like-minded people preferred inthe past. The generic nature of the CF was the underlying reason to achieve a broader success [8,27].CF algorithms are widely applied in Web and IoT services [28–30]. CF recommender algorithms canfurther be categorized into model-based and neighborhood-based approaches. Data mining techniques,such as matrix factorization [31] are mostly applied to figure out relationships between users and itemsin model-based approaches. The neighborhood approach, in comparison, utilizes statistical techniquesto find out neighborhoods between users (user-based CF [32]) or between items (item-based CF [33]).
Although the traditional CF algorithms have achieved great success, the CSP is still a challenge [34].This problem arises when a new user (referred to as “user CSP”) or item (referred to as “item CSP”)is added to the RS and there is no historical information to explicitly or implicitly express userpreferences [35]. Lack of sufficient information for new items will cause them to be ranked at thebottom of the recommendation list [36]. User CSP negatively affects the performance of the RS toprovide meaningful recommendations for new users. Providing prior ratings to new items by staff
members can largely eliminate the item CSP. However, privacy concerns in RSs do not allow applying asimilar approach to address the user CSP which greatly captured the attention of researchers. Note that,for the rest of this paper, the term CSP is used exclusively for the user CSP. The common approaches toaddress the user CSP can be classified into three main categories: (1) evaluating the interaction betweenusers and items to detect the most prominent groups of similar users [30], (2) using some additionalcontext information such as demographic data [37], and (3) using hybrid RSs or a combination ofrecommender algorithms to enhance the functionality of the prediction method [36].
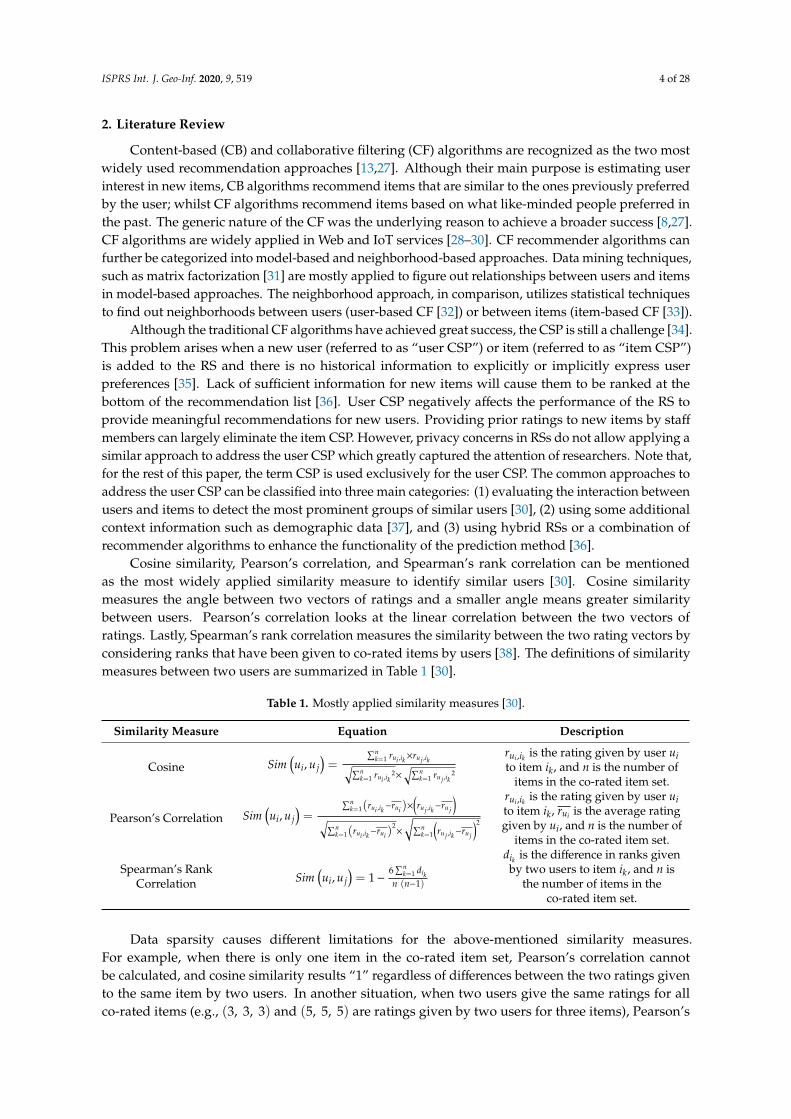
Cosine similarity, Pearson’s correlation, and Spearman’s rank correlation can be mentionedas the most widely applied similarity measure to identify similar users [30]. Cosine similaritymeasures the angle between two vectors of ratings and a smaller angle means greater similaritybetween users. Pearson’s correlation looks at the linear correlation between the two vectors ofratings. Lastly, Spearman’s rank correlation measures the similarity between the two rating vectors byconsidering ranks that have been given to co-rated items by users [38]. The definitions of similaritymeasures between two users are summarized in Table 1 [30].
Table 1. Mostly applied similarity measures [30].
Similarity Measure Equation Description
Cosine Sim(ui, u j
)=
∑nk=1 rui ,ik×ruj ,ik√∑n
k=1 rui ,ik2×
√∑nk=1 ruj ,ik
2
rui,ik is the rating given by user uito item ik, and n is the number of
items in the co-rated item set.
Pearson’s Correlation Sim(ui, u j
)=
∑nk=1(rui ,ik−rui )×
(ruj ,ik−ruj
)√∑n
k=1(rui ,ik−rui )2×
√∑nk=1
(ruj ,ik−ruj
)2
rui,ik is the rating given by user uito item ik, rui is the average ratinggiven by ui, and n is the number of
items in the co-rated item set.
Spearman’s RankCorrelation Sim
(ui, u j
)= 1−
6∑n
k=1 dikn (n−1)
dik is the difference in ranks givenby two users to item ik, and n is
the number of items in theco-rated item set.
Data sparsity causes different limitations for the above-mentioned similarity measures.For example, when there is only one item in the co-rated item set, Pearson’s correlation cannotbe calculated, and cosine similarity results “1” regardless of differences between the two ratings givento the same item by two users. In another situation, when two users give the same ratings for allco-rated items (e.g., (3, 3, 3) and (5, 5, 5) are ratings given by two users for three items), Pearson’s
ISPRS Int. J. Geo-Inf. 2020, 9, 519 5 of 28
correlation cannot be calculated and cosine similarity reports the maximum similarity between usersregardless of differences between rating values.
The user CSP and data sparsity are a serious issue for most real-world RSs [38].Considering historical interactions between users and items to identify similar users can partially resolvethis problem. However, when there is a limited number of co-ratings or semantically similar comments,the CSP becomes more serious. Empirical research demonstrated that only 15 percent of similar userscan be identified by their created comments or their ratings [13]. Simple experiments using publiclyavailable MovieLens dataset [39] showed that cosine similarity and Pearson’s correlation measures canbe applicable only for 26.2% and 15.9% of 7650 pairs of randomly chosen users respectively [38]. As aresult, relying only on the rating information to apply similarity measures is not sufficient for real-worldscenarios. Therefore, identifying similar users for solving the user CSP using some additional datasources is a popular topic in the RSs research community [8,37].
Contextual information plays an important role in providing additional information to identifysimilar users with regards to user preferences [37]. Context-aware algorithms provide users withmore personalized recommendations [27]. The location history context [40] or similarity betweenusers’ trajectories [41] can be mentioned as one of the mostly applied contexts. However, most ofthe context-aware algorithms impose a computationally expensive cost to the RS. Starting with theresearch of Adomavicius et al. [42], context-aware algorithms attempt to estimate user interests indifferent items by considering additional user/item contextual information. Using demographic datasuch as users’ age, occupation, and gender is one of the most popular approaches to identify similarusers and mitigate user CSP [36]. Alliouli Y.L. [36], proposed a novel approach based on usingdemographic data and classification techniques to address the CSP in a CF recommender algorithm.This approach can be summarized in three phases [36]: building C4.5 and Naïve Bayes classifier usingdemographic data, identifying similarity between the new cold start user and its neighbors inside theclass, and predicting ratings for the new user based on the users in that class. However, classificationtechniques require prior knowledge of data. Applying clustering techniques instead overcomesthe limitation of classification approaches [37]. Clustering similar users based on their contextualinformation is where context-awareness plays an important role to overcome the CSP raised in CFrecommender algorithms.
In the Hybrid RS category, Chatzidimitris et al. [37], designed and implemented an advancede—business RS, called SMARTBUY, that provides mobile users with location-based recommendationsfor retail products and services. CF is the core recommender algorithm in SMARTBUY.Applying different contextual information such as demographic data not only empowers the CFin mitigating the CSP; but also, provides more personalized recommendations. Carvalho et al. [35],proposed a Hybrid RS that uses association rules to identify similar users and overcome CSP.The objective of this research is to identify like-minded people and recommend to the target userthose items liked by other cluster members. Euclidian distance based on users’ historical locationsand also using demographic data including age, gender, nationality, and search history have beenapplied in SMARTBUY to cluster similar users [37]. In SMARTBUY [37], the context-aware RS relies onsmartphones and social networks (here only Facebook API) as the only source to provide contextualinformation. To cover some of the research gaps in the above-mentioned methods [35,37,40,41],we propose a hybrid RS to address the following issues:
• Although using additional data sources like users’ preferences can address the CSP, asking usersto manually provide such information is not always possible. In addition, this information ischanging over time. For example, users’ favorite music or movie genres can change over time.Asking users to regularly update their preferences is a limitation of some RSs that have beenrecently developed. With the tremendous growth of smart devices, we are no longer restricted toa limited number of context providers such as smartphones and tablets; therefore, in this research,we automatically update the user’s profile based on his/her personal smart devices.
ISPRS Int. J. Geo-Inf. 2020, 9, 519 6 of 28
• Relying on SNs to detect socially similar users imposes a new constraint for RSs (i.e., users haveto be members of a SN). In addition, RSs still suffer from the CSP when there is no informationexplicitly or implicitly express the user’s social interaction in SNs. In previous studies, only virtualinteractions were extracted from SNs to identify socially connected users [12]. However, in thisresearch, real-world social interactions extracted from users’ smart devices are added to our USDE.These real-world social interactions play an important role as an additional data source to identifythe similarity between users.
• Cosine and Pearson’s correlation similarity measures can be mentioned as the most widelyapplied similarity measures [30,37] in CF–based RSs. Similarity measures that have been proposedshow very low utilization under the harsh conditions of the CSP. In comparison with appliedsimilarity measures, a new trust-based similarity measure is proposed in this research. In thisstudy, a swarm-based clustering technique is used in the USDE to make the proposed RS morepowerful to address the CSP. In other words, the proposed USDE is empowered by a clusteringalgorithm to identify similar users based on their real-world social interactions and contextualinformation included in their profiles.
3. Updating User Profile Using Smart Devices
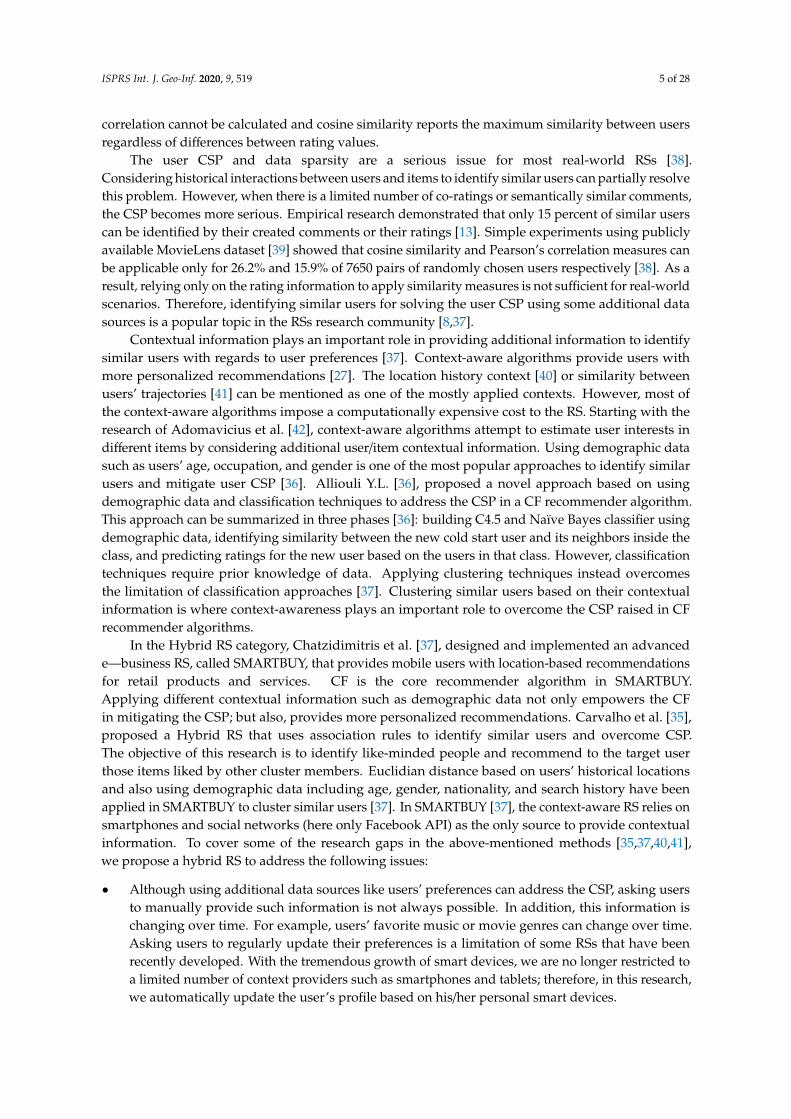
The user profile is a profile containing contextual information about the user’s identity, activity,location, social circle, and preferences in different aspects such as events and movies. These itemscan be considered as “user’s context” as well [43]. Most current RSs [37] manually collect userexplicit preferences, which is time-consuming. In addition, the dynamic aspects of the user’sprofile (i.e., contexts) cannot be addressed. Automatically creating a dynamic user profile leavesmany opportunities to enhance the functionality of RSs. Firstly, they can provide context-awarerecommendations that are more personalized than the recommendations provided by the conventionalRSs. Secondly, dynamically updating user profiles can better model changes that might happen in userpreferences over time. Finally, user profiles can be considered as a criterion to identify similar users insituations where other similarity measures like social interactions are not available. For this study,contextual information will be used to form a dynamic user profile. The categorization of contextualinformation in the user profile is summarized in Figure 2. The proposed conceptual categorizationprovides a flexible and structured method to organize and extend contexts.ISPRS Int. J. Geo–Inf. 2020, 9, x FOR PEER REVIEW 7 of 29
Figure 2. Context categorization applied to create the user profile.
A variety of contexts can be extracted from data collected by users’ smart devices. As an example, a smart speaker like Google Home provides data based on users’ voice commands. For example, playing a Google Play movie using Google Home to Google Chromecast requires following a specified voice command (i.e., “Watch/Play” ⟨𝑀𝑜𝑣𝑖𝑒 𝑛𝑎𝑚𝑒 𝑠𝑢𝑐ℎ 𝑎𝑠 𝐵𝑒𝑒 𝑀𝑜𝑣𝑖𝑒⟩ on 𝑃𝑎𝑟𝑡𝑛𝑒𝑟 𝑠𝑢𝑐ℎ 𝑎𝑠 𝐶ℎ𝑟𝑜𝑚𝑒𝑐𝑎𝑠𝑡 ) which is explicitly explained by Google LLC (https://support.google.com/googlehome/). By analyzing such information, user preferences can be extracted in different aspects such as their favorite movie genres, music styles, singers, and radio stations. In this research, three types of context providers have been considered including smart speakers, wearable devices, and smartphones.
Extracting desired contexts from smart speakers (e.g., Google Home) necessitates applying string matching algorithms [44,45]. There are different text mining methodologies such as Knuth–Morris–Pratt, Rabin–Karp, and brute-force [40]. It has been proved that the Knuth–Morris–Pratt algorithm solves a keyword matching problem in O(m+n) time whilst the other two similar algorithms solve it in O(mn) time, in which m and n are the number of characters in keyword and input string respectively [46]. Due to the better functionality of the Knuth–Morris–Pratt algorithm [44,45], this algorithm is applied to extract context from textual information collected by smart speakers. The applied Knuth–Morris–Pratt algorithm to extract movie names from textual information collected by Google Home smart speaker is shown in Table 2.
Table 2. Knuth–Morris–Pratt Algorithm to extract users’ played movies from Google Home’s textual dataset.
Algorithm extract—movie names: input:
a pattern include characters, W(the pattern used to extract the name of user's played movies) an array of characters, S (the raw data retrieved from Google Home)
Output: an array of integers, P (positions in S at which W is found) an integer nP (number of positions)
define variables: an integer, j ← 0 (the position of the current character in S)
Figure 2. Context categorization applied to create the user profile.
ISPRS Int. J. Geo-Inf. 2020, 9, 519 7 of 28
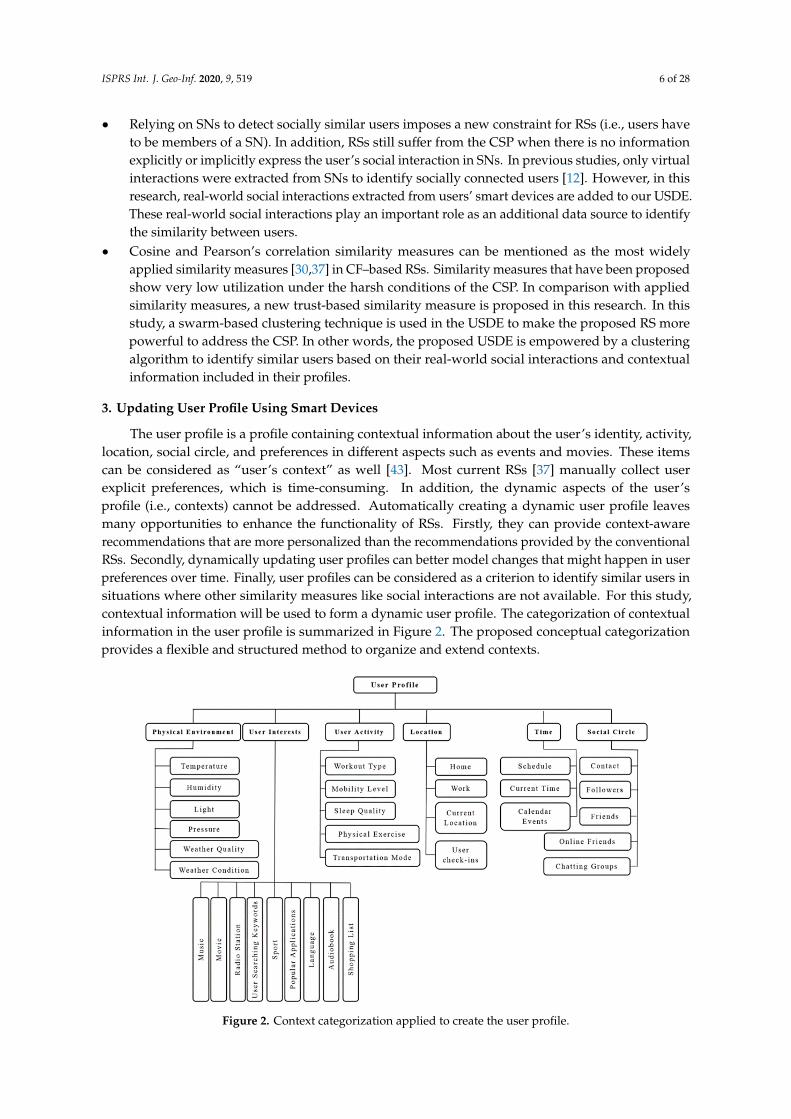
A variety of contexts can be extracted from data collected by users’ smart devices. As an example,a smart speaker like Google Home provides data based on users’ voice commands. For example, playinga Google Play movie using Google Home to Google Chromecast requires following a specified voicecommand (i.e., “Watch/Play” 〈Movie name such as Bee Movie〉 on [Partner such as Chromecast]) which isexplicitly explained by Google LLC (https://support.google.com/googlehome/). By analyzing suchinformation, user preferences can be extracted in different aspects such as their favorite movie genres,music styles, singers, and radio stations. In this research, three types of context providers have beenconsidered including smart speakers, wearable devices, and smartphones.
Extracting desired contexts from smart speakers (e.g., Google Home) necessitates applying stringmatching algorithms [44,45]. There are different text mining methodologies such as Knuth–Morris–Pratt,Rabin–Karp, and brute-force [40]. It has been proved that the Knuth–Morris–Pratt algorithm solves akeyword matching problem in O(m + n) time whilst the other two similar algorithms solve it in O(mn)time, in which m and n are the number of characters in keyword and input string respectively [46].Due to the better functionality of the Knuth–Morris–Pratt algorithm [44,45], this algorithm is applied toextract context from textual information collected by smart speakers. The applied Knuth–Morris–Prattalgorithm to extract movie names from textual information collected by Google Home smart speaker isshown in Table 2.
Table 2. Knuth–Morris–Pratt Algorithm to extract users’ played movies from Google Home’stextual dataset.
Algorithm Extract—Movie Names:
input:
a pattern include characters, W(the pattern used to extract the name of user’s played movies)an array of characters, S (the raw data retrieved from Google Home)
Output:an array of integers, P (positions in S at which W is found)
an integer nP (number of positions)define variables:
an integer, j← 0 (the position of the current character in S)an integer, k← 0 (the position of the current character in W)
an integer, l← 0 (the number of line in S)an array of integers, T (the table, computed elsewhere)an array of strings, O (extracted user’s played movies)
let nP ← 0while j < length(S) do
if W[k] = S[j] thenlet j← j + 1
let k← k + 1if k = length(W) then
T[nP]← the next word after found pattern (For example the next word after the word “Play or Watch”)let l← l + 1, nP ← nP + 1, P[nP]← j − k,
elselet k← T[k]
Wearable devices such as smart watches/bands, fitness trackers, and smart headsets are thesecond context provider considered in this research. Wearable devices are equipped with a diverserange of sensors such as the in-ear thermometer, Global positioning system (GPS), accelerometer,and gyroscope. These sensors provide users with the ability to monitor their daily activities andhealth-related information. In this study contextual information such as physical exercise, mobilitylevel, transportation mode, and sleep quality are extracted from wearable devices APIs.
Sensing and computing capabilities of smartphones and tablets [47] motivated us to utilize themas the third context providers. A variety of contexts can be extracted from smartphones sensors aswell as their installed apps such as social media, phone, calendar or emails. Check-ins information,
ISPRS Int. J. Geo-Inf. 2020, 9, 519 8 of 28
social graphs of connected users, physical environments, daily schedules, favorite applications,and favorite internet search topics are among the possible context information that can be extractedfrom smartphones [18]. A mobile application has been developed in this research to extract and accessdesired contexts from smartphones and tablets. A further explanation of our developed application toextract desired contexts is given in the Section 6. For example, the application extracts user’s socialcircles based on the social network’s friends, phone contacts, calendar invites, emails and text messages,frequent phone calls.
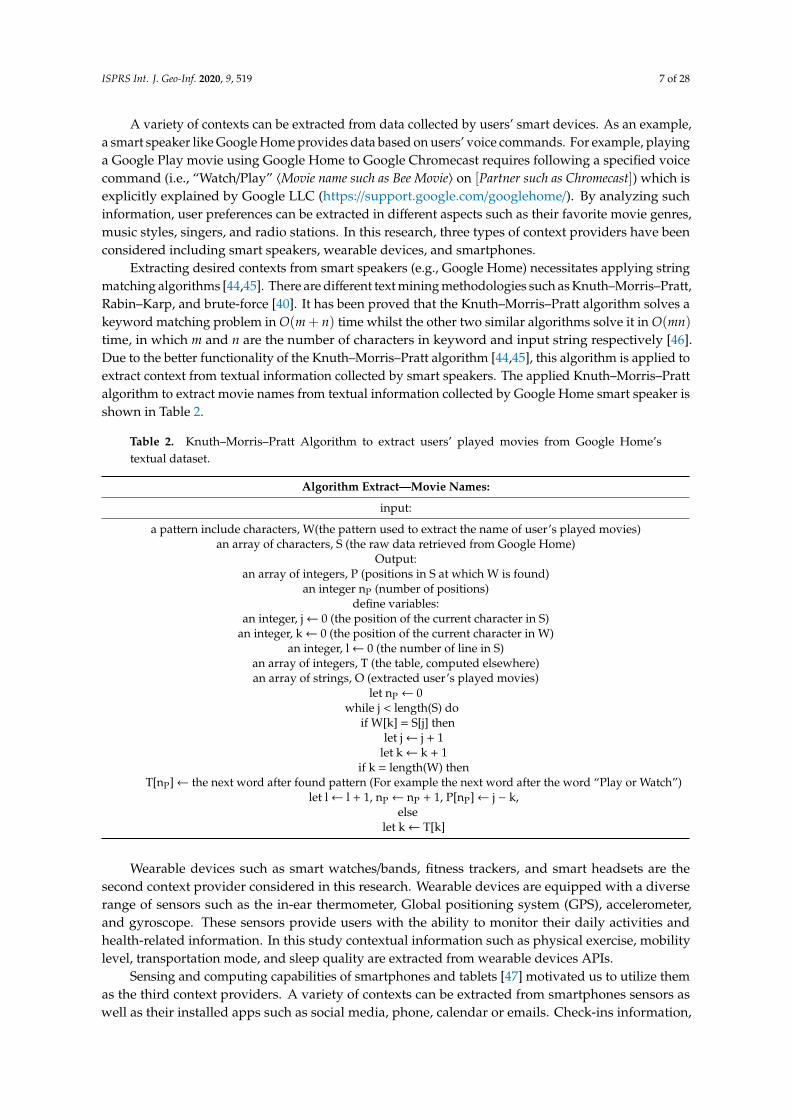
Finally, extracted contexts from all three types of smart devices can be integrated into thecontext reasoning layer. The main responsibility of this layer is to integrate primary context data(e.g., movie names, check-ins, and user activity) to infer high-level user context (e.g., preferences inmovie genres, semantic category of venues, and mobility levels) by incorporating various sourcesof information. To achieve this goal, a rule engine is designed and applied. Defining different rulesrequires basic knowledge that comes from expert suggestions in different areas. As an examplerule, if the number of user’s daily steps is more than 10,000, or if the total number of miles movedis more than four miles per day, and the user’s heartbeat is between 135–155 beats per minutes(https://www.verywellfit.com/target--heart--rate--calculator--3878160), then the user is having a highlevel of mobility. Three examples of rules applied in the context reasoning layer are shown in Table 3to extract higher level contexts.
Table 3. Examples of applied rules in the context reasoning layer.
Primary Context Context Source Rule-Based Inference Higher Level Context
Movie Names Google HomeIf user plays movie X and the movie
genre of movie X is G, then userinterests in movie genre G.
Movie Genre
Check-ins SmartphoneIf user visits venue V and its semantic
category is S, then user interests invenues with semantic category of S.
Semantic VenueCategory
Physical Activities Smart Watch
If the number of user’s daily steps isbetween 5000–10,000, or if the totalnumber of miles moved is betweentwo to four miles per day, and the
user’s heartbeat is between 110–130beats per minutes, then the user
mobility level is average.
Mobility level
User privacy is a big challenge in context-aware systems. There is a trade-off between efficiencyof context-aware computation and preserving privacy. Technology can help minimize trade-offs, but itcannot eliminate them. Although applying privacy protection techniques is outside the scope of thispaper, some considerations have been taken into account to protect user privacy in updating userprofiles using smart devices. We used a local memory approach for user context detection and profileupdating. The information from the user’s smart devices is privately stored on the user’s phone.To share every device’s data locally, every service uses basic authentication and asks for user’s privacypolicy rules to protect user’s data. Users are asked whether they are willing to incorporate their data toreceive more personalized recommendations. In other words, they have been given full control ofhow much of the data they want to be used in the recommendation process. Next, the RS providesusers with the option to manually edit their preferences in their profile if they are not willing to shareany of their personal data. However, if the user wants to collect his profile information automatically,their personal data will be permanently deleted after being used for the context reasoning engine.For example, communication with their Google Home devices will be deleted after their preferredmovie genres are extracted. Using this method, which is one of the most common techniques onboth academic and industry social applications (e.g., Facebook, Twitter), the user can control the rules
ISPRS Int. J. Geo-Inf. 2020, 9, 519 9 of 28
for sharing profile data and be accountable for the information revealed to other users, and it canchange dynamically.
4. User Similarity Detection Engine
To consider real-world social interactions and smart devices, two algorithms are used to groupsimilar users. These algorithms were added to the USDE to make the proposed RS more powerfulin addressing the CSP. The first method which makes a social-aware USDE is defined based on thestrength of bonds in users’ social interactions [48]. In this component, both social interactions createdeither in the real-world or virtual networks are considered as a similarity parameter. The secondmethod is using a clustering algorithm to identify similar users based on different contexts in theusers’ profile. For the proposed similarity detection approach it is worth mentioning that if we have asignificant number of people (the threshold is considered 30 persons [49]) in the social circle, then theuser preference can be inferred based on his/her social circle. Otherwise, the clustering method is usedto find similar users with common interests.
Another challenge here is how to use a USDE while protecting user’s privacy. Although detaileduser privacy research needs to be conducted especially on resource-restrained devices such as cellphones,in this paper we used user profile anonymization to support user’s privacy. The user’s ID and profileare shared using a secure hash algorithms (SHA)-512 approach for the user’s social circle. USDE utilizesa list of user profiles (with a constantly updated list) with hashed user IDs in the process of makingrecommendations. Using an anonymization technique, the user profiles and their social circles aredelivered without users’ real identity information in the case of user similarity clustering. In thisway, their identity remains anonymous on the server while similar user profiles can be used in theproposed RS.
4.1. Social Interaction Classification
The similarity between users can be identified by analyzing their social interactions such asemails, call logs, and bidirectional social relationships extracted from SNs. Inspired by Elsesser andPeplau [48], social interactions between users can be categorized into two different categories due tothe strength of bonds existing in their social interactions. The first category is called primary socialinteractions (PSIs), that includes real-world relationships between users such as making a call andsending or receiving messages and emails. The number of members placed in the group of similar userswith PSIs is usually small and characterized by extensive and real-world interactions between groupmembers on a regular basis. The second category is called secondary social interactions (SSIs) includesinteractions made in the virtual world such as relationships between users on social networking sitessuch as Facebook. Similar users with SSIs can be characterized by almost larger numbers of membersand more impersonal and virtual interactions.
Using this classification, users placed in the social circle of the target user can be seen as a group ofsimilar users with PSIs or SSIs. The social circle of the target user is created from the contact list of theuser’s smartphone, list of the user’s friends in SNs, senders and receivers of emails and text messages.The frequency and number of times that a user contacts the target user can define the strength of bondsexisting in their social interactions. Although the social interaction can be further expanded in futureresearch, in this paper, we considered only two categories (i.e., PSI and SSI) based on the frequentcontact concept. If a person in the social circle of the target user contacts him/her more than once aweek; then, the RS considers this person as a user with PSIs with the target user. After the labelingof target user’s PSIs, the rest of the target user’s social circle are classified as users with SSIs. As anexample, consider the situation that {u1, u2, u3, u4} is extracted as the social circle of the target user X.If u2 has made a phone call to the user X three times a week, and u3 frequently sent an email to theuser X last week, then, u2 and u3 are classified as the target user X’s PSIs. While u1 and u4 are labeledas users with SSIs.
ISPRS Int. J. Geo-Inf. 2020, 9, 519 10 of 28
It is assumed in this paper that the similarity between the target user and users with PSIs isgreater than the similarity of users with SSIs. It appears obvious that the recommendations made bypeople who are in the group of similar users with PSIs would be considered more reliable than thosemade by the group of similar users with SSIs. Based on this assumption, we consider the trust in therecommendations made by the group of similar users with PSIs as being twice as much as those fromthe group of similar users with SSIs. However, if we don’t have a significant number (i.e., 30 [49])of people in the social circle, the user clustering method is used and the trust weight is considered 1again. Hence, the trust weights are considered as follows:
ω j =
2 i f the user j has a similar PSI user group1 i f the user j has a similar SSI user group1 i f the user j has a similar pro f ile− based user group
(1)
This trust weight can be used in computing the average rating for the new user based on the othersimilar users. The trust weight of the group of similar users with PSIs is set to twice as much as thosefrom the group of similar users with SSIs for this paper, however, this value can be modified by users ifthey want to trust their social contacts more than their group of similar users. If the target user ut hastwo users u1 and u2 in his/her social circle of similar users with SSIs and PSIs respectively, the effect ofthe trust weight on their recommendation can be measured. Consider the case that user u1 and u2 gaveratings 4 and 5 to item i and the trust weight is set to 3 instead of 2 for users with PSIs, here the user u2.In this situation, the final recommendation will be 9% closer to the rating given by user u2 compared tothat given in the situation that the trust weight has been set to 2 for users with PSIs. This value is 6%more than the rating from user u2 in situation that the trust weight is set to 1.5 instead of 2 for userswith PSIs.
4.2. User Profile Clustering
A variety of attributes can be included in the user profile to describe a user as context information.The greater the number of profile attributes, the better the understanding of the user. When the CSPoccurs, finding implicit similarities between users addresses profile matching and user clustering.User profile clustering is an analytic process designed to explore users by discovering consistentpatterns and/or systematic relationships between contexts, and then validate the findings by applyingthe detected patterns to new subsets of users. Generally, clustering algorithms can be categorizedinto partitioning methods, hierarchical methods, density-based methods, grid-based methods, andmodel-based methods. An excellent survey of clustering techniques can be found in a study done byKameshwaran et al. [50].
Given a data set Z ={z1, z2, . . . , zp, . . . , zNp
}where zp is a pattern in the Nd–dimensional feature
space, and Np is the number of patterns in Z, then the clustering of Z is the partitioning of Z into kclusters {c1, c2, . . . , ck} that satisfies the following conditions:
• Each pattern should be assigned to a user cluster, i.e., ∪kj=1c j = Z.
• Each user cluster has at least one context pattern assigned to it, i.e., ck , 0, k = 1, . . . , K.• Each context pattern is assigned to one and only one user cluster, i.e., ck ∩ cj = 0, where k , j.
Clustering is the process of identifying clusters of users within multidimensional user profiledata (contexts) based on feature space (i.e., user profile items) through similarity measure. The mostpopular way to evaluate a similarity measure is through the use of distance measures [51]. The mostwidely used distance measure is the Euclidean distance, defined as:
d(zi, z j
)=
√∑Nd
k=1
(zi,k − z j,k
)2=‖ zi − z j ‖ (2)
ISPRS Int. J. Geo-Inf. 2020, 9, 519 11 of 28
Recently, a huge increase in the use of Swarm-based optimization techniques for clustering hasbeen observed [52]. Swarm Intelligence is an innovative distributed intelligent paradigm for solvingoptimization problems that were originally inspired by the biological examples of the swarming,flocking, and herding phenomena in vertebrates [53]. These techniques incorporate swarmingbehaviors observed in flocks of birds, schools of fish, swarms of bees, or even human social behavior,from which the idea emerged [54–56]. They can also be used especially when other methods aretoo expensive or difficult to implement [57]. For clustering of massive user profile data, we usedartificial bee colony (ABC) algorithm because of its potential in solving complex optimization problems,flexibility, simplicity, self-organizing and extensibility [53,58]. To evaluate the performance of ABC,its performance is compared with K-means as a popular clustering algorithm in data mining [51].
A colony of honey bees can spread itself out over long distances to exploit a large number offood sources [53]. The foraging process begins in a colony by scout bees sent to search for promisingflower patches. Flower patches with large amounts of nectar or pollen that can be collected with lesseffort tend to be visited by more bees, whereas patches with less nectar or pollen receive fewer visitsfrom bees [57]. The artificial swarm bee colony clustering method exploits the search capability of thebee algorithm to overcome the local optimum problem of the K–means algorithm. More specifically,its task is to search for the appropriate cluster centers (c1, c2, . . . , ck) so that the clustering metric d (2) isminimized. The basic steps of this clustering operation are listed in the Table 4.
Table 4. The basic steps of the artificial bee colony clustering method.
1. Initialize the solution population.2. Evaluate the fitness of the population.3. While (stopping criterion is not met)
a. Form a new population.b. Select sites for neighborhood search by means of information from the present neighborhood.c. Recruit bees for selected sites (more bees for the best e sites) and evaluate fitness values.d. Select the fittest bee from each site.e. Assign remaining bees to search randomly and evaluate their fitness values.
End While.
In the initialization stage (Step 1 in Table 4), a set of scout bee population (n) is randomly selectedto define the k clusters. The Euclidean distances between each user profile data pattern and all centersare calculated to determine the assigned cluster to each user profile. For example, in the case of themovie RS, user profile items such as movie genres and social circles are considered for the clustering.This way, initial clusters can be constructed. After the clusters have been formed, the original clustercenters are replaced by the actual centroids of the clusters to define a particular clustering solution(i.e., a bee). This initialization process is applied each time new bees are created.
In Step 2 of Table 4, the fitness computation process is carried out for each site visited by a bee bycalculating the clustering metric d (2), which is inversely related to fitness.
Step 3 is the main step of bee colony optimization, which starts by forming a new population(Step 3a). In Step 3b, m sites with the highest fitness are designated as “selected sites” and chosen forthe neighborhood search. In Steps 3c and 3d, the algorithm conducts searches around the selectedsites, assigning more bees to search in the area of the best e sites. Selection of the best sites can be madedirectly according to their associated fitness. Alternatively, the fitness values are used to determinethe probability of the sites being selected. Searches in the neighborhood of the best e sites—those thatrepresent the most promising solutions—are carried out in greater detail. As mentioned previously,this is done by recruiting more bees for the best e sites than for the other selected sites. Together withscouting, this differential recruitment is a key operation of the bee algorithm. In Step 3d, only the beethat has found the site with the highest fitness (i.e., the “fittest” bee) will be selected to form part of thenext bee population. In nature, there is no such restriction. The restriction is introduced here to reduce
ISPRS Int. J. Geo-Inf. 2020, 9, 519 12 of 28
the number of points to be explored. In Step 3e, the remaining bees in the population are randomlyassigned to the search space to scout for new potential solutions.
At the end of each loop, the colony will have two parts to its new population: representativesfrom the selected sites, and scout bees assigned to conduct random searches. These steps are repeateduntil the stopping criterion is met.
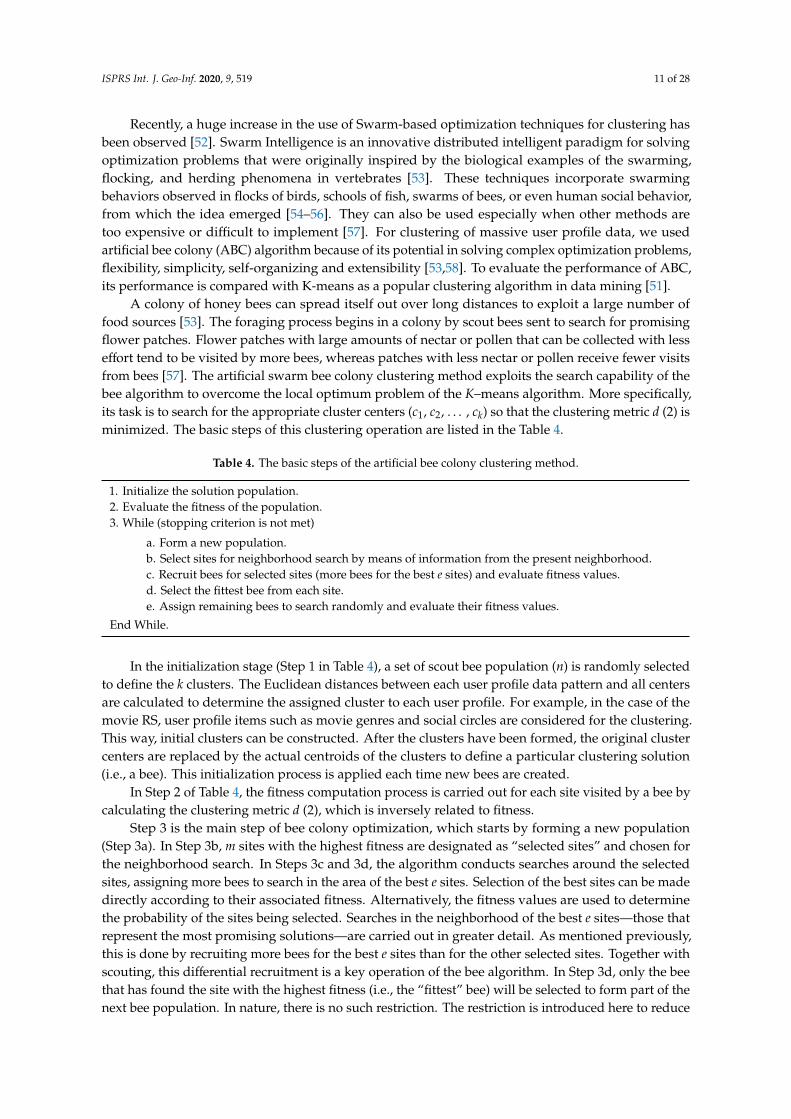
Each bee represents a potential user similarity clustering solution as a set of k cluster centers, andeach site represents the patterns or user profile data objects. The algorithm requires some parametersto be set, namely: number of scout bees (n), number of sites selected for neighborhood searching (m),number of top-rated (elite) sites among m selected sites (e), number of bees recruited for the best e sites(nep), number of bees recruited for the other (m) selected sites (nsp), and the stopping criterion for theloop. In the Table 5, the list of initial values for the parameters are presented.
Table 5. Parameters used in the user clustering using swarm artificial bee colony (ABC) algorithm.
Parameters Parameters Value
Number of Scout Bees, n 35
Number of Sites Selected for Neighborhood Search, m 11
Number of Best “Elite” Sites Out of m Selected Sites, e 2
Number of Bees Recruited for Best e Sites, nep 7
Number of Bees Recruited for the Other (me) Selected Sites, nsp 3
Number of Iterations, R 200
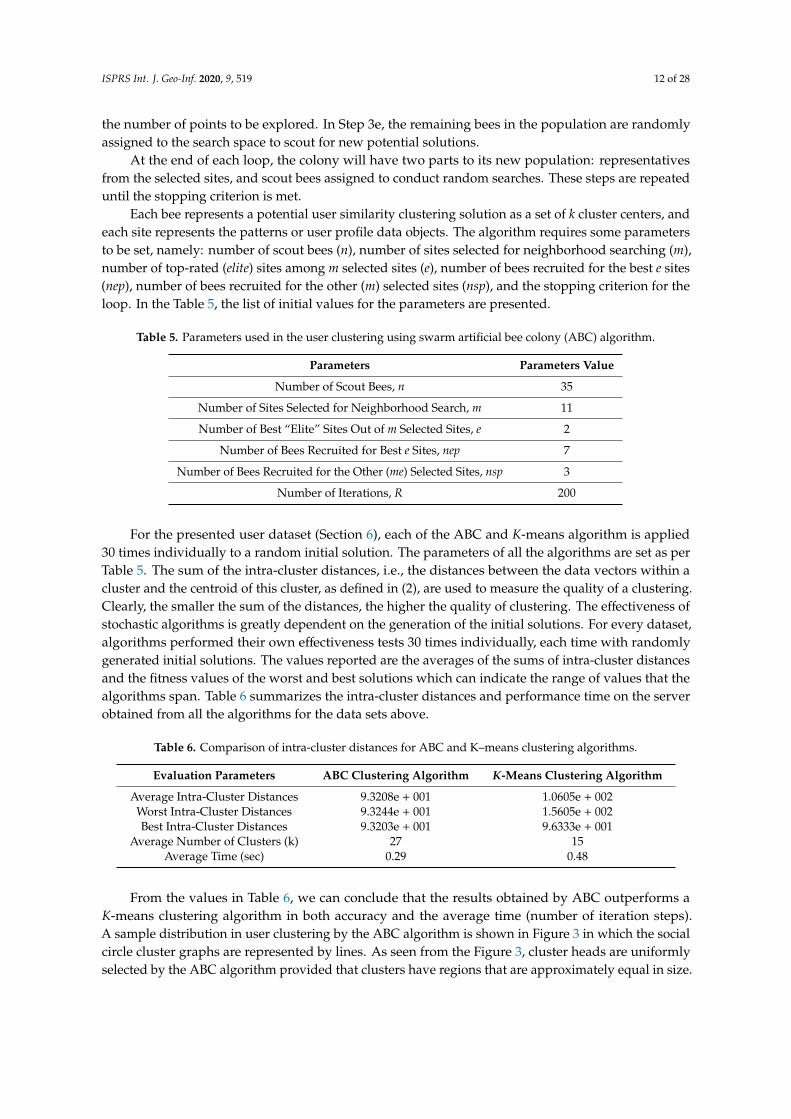
For the presented user dataset (Section 6), each of the ABC and K-means algorithm is applied30 times individually to a random initial solution. The parameters of all the algorithms are set as perTable 5. The sum of the intra-cluster distances, i.e., the distances between the data vectors within acluster and the centroid of this cluster, as defined in (2), are used to measure the quality of a clustering.Clearly, the smaller the sum of the distances, the higher the quality of clustering. The effectiveness ofstochastic algorithms is greatly dependent on the generation of the initial solutions. For every dataset,algorithms performed their own effectiveness tests 30 times individually, each time with randomlygenerated initial solutions. The values reported are the averages of the sums of intra-cluster distancesand the fitness values of the worst and best solutions which can indicate the range of values that thealgorithms span. Table 6 summarizes the intra-cluster distances and performance time on the serverobtained from all the algorithms for the data sets above.
Table 6. Comparison of intra-cluster distances for ABC and K–means clustering algorithms.
Evaluation Parameters ABC Clustering Algorithm K-Means Clustering Algorithm
Average Intra-Cluster Distances 9.3208e + 001 1.0605e + 002Worst Intra-Cluster Distances 9.3244e + 001 1.5605e + 002Best Intra-Cluster Distances 9.3203e + 001 9.6333e + 001
Average Number of Clusters (k) 27 15Average Time (sec) 0.29 0.48
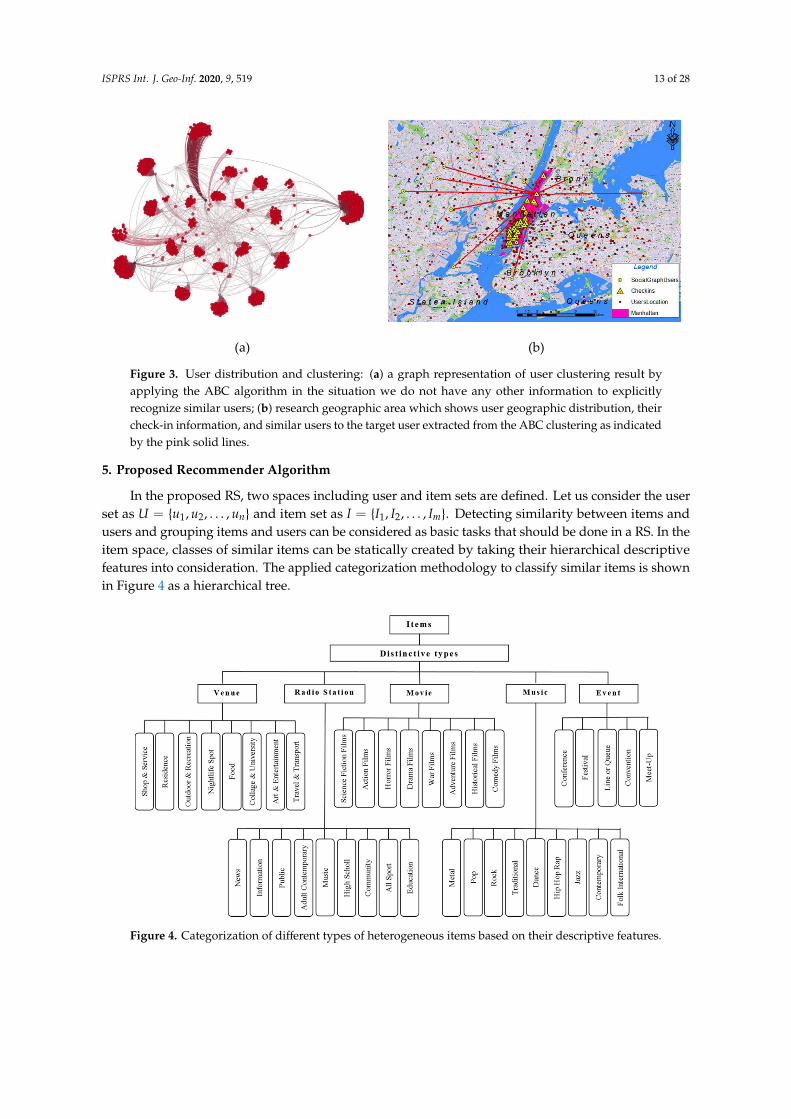
From the values in Table 6, we can conclude that the results obtained by ABC outperforms aK-means clustering algorithm in both accuracy and the average time (number of iteration steps).A sample distribution in user clustering by the ABC algorithm is shown in Figure 3 in which the socialcircle cluster graphs are represented by lines. As seen from the Figure 3, cluster heads are uniformlyselected by the ABC algorithm provided that clusters have regions that are approximately equal in size.
ISPRS Int. J. Geo-Inf. 2020, 9, 519 13 of 28
ISPRS Int. J. Geo–Inf. 2020, 9, x FOR PEER REVIEW 13 of 29
Evaluation Parameters ABC Clustering Algorithm
𝑲-Means Clustering Algorithm
Average Intra-Cluster Distances 9.3208e + 001 1.0605e + 002 Worst Intra-Cluster Distances 9.3244e + 001 1.5605e + 002 Best Intra-Cluster Distances 9.3203e + 001 9.6333e + 001
Average Number of Clusters (k) 27 15 Average Time (sec) 0.29 0.48
From the values in Table 6, we can conclude that the results obtained by ABC outperforms a 𝐾-means clustering algorithm in both accuracy and the average time (number of iteration steps). A sample distribution in user clustering by the ABC algorithm is shown in Figure 3 in which the social circle cluster graphs are represented by lines. As seen from the Figure 3, cluster heads are uniformly selected by the ABC algorithm provided that clusters have regions that are approximately equal in size.
(a) (b)
Figure 3. User distribution and clustering: (a) a graph representation of user clustering result by applying the ABC algorithm in the situation we do not have any other information to explicitly recognize similar users; (b) research geographic area which shows user geographic distribution, their check-in information, and similar users to the target user extracted from the ABC clustering as indicated by the pink solid lines.
5. Proposed Recommender Algorithm
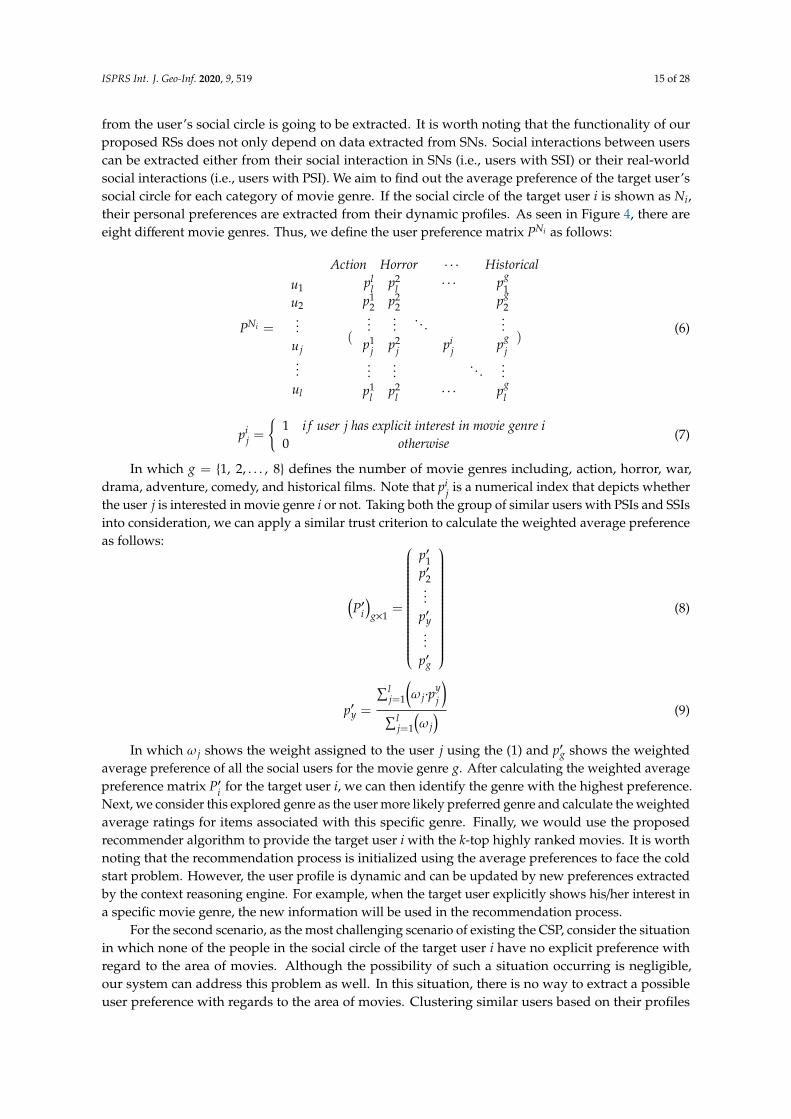
In the proposed RS, two spaces including user and item sets are defined. Let us consider the user set as 𝑈 = {𝑢 , 𝑢 , … , 𝑢 } and item set as 𝐼 = {𝐼 , 𝐼 , … , 𝐼 }. Detecting similarity between items and users and grouping items and users can be considered as basic tasks that should be done in a RS. In the item space, classes of similar items can be statically created by taking their hierarchical descriptive features into consideration. The applied categorization methodology to classify similar items is shown in Figure 4 as a hierarchical tree.
Figure 3. User distribution and clustering: (a) a graph representation of user clustering result byapplying the ABC algorithm in the situation we do not have any other information to explicitlyrecognize similar users; (b) research geographic area which shows user geographic distribution, theircheck-in information, and similar users to the target user extracted from the ABC clustering as indicatedby the pink solid lines.
5. Proposed Recommender Algorithm
In the proposed RS, two spaces including user and item sets are defined. Let us consider the userset as U = {u1, u2, . . . , un} and item set as I = {I1, I2, . . . , Im}. Detecting similarity between items andusers and grouping items and users can be considered as basic tasks that should be done in a RS. In theitem space, classes of similar items can be statically created by taking their hierarchical descriptivefeatures into consideration. The applied categorization methodology to classify similar items is shownin Figure 4 as a hierarchical tree.ISPRS Int. J. Geo–Inf. 2020, 9, x FOR PEER REVIEW 14 of 29
Figure 4. Categorization of different types of heterogeneous items based on their descriptive features
For the proposed recommender algorithm, we consider five different heterogeneous subsets of items in the main item set including movies, venues, events, music, and radio stations. Therefore, the combination of all the subsets is stated as follows:
𝐼 = ⋃ 𝐼 = {𝐼 , 𝐼 , … , 𝐼 } (3)
(4)
In which, 𝑖 ∈ {1, 2, … ,5} and 𝐼 define all of the items with a specific tag 𝑖 such as movie, venue, music, event, and radio station set. In addition, 𝑚 defines the number of items in a specific subset. If we consider the movie items recommender service, all of 𝑚 items placed in the movie set are categorized into eight different categories based on their genres as shown in Figure 4. If we explicitly recognize the movie genre that is interesting to the target user, then the CF recommender algorithm is used to recommend the target user the 𝑘-top highly ranked movies in the desired genre. Let us consider this 𝑘-top highly ranked list of recommended movies as matrix, 𝑅 × . Given people in the social circle of the target user 𝑖 as a set defined by 𝑁 = 𝑢 𝑗 = 1,2, … , 𝑙; 𝑖 ≠ 𝑗 𝑎𝑛𝑑 𝑢 ∈ 𝑈}. Using their ratings for the item 𝑘, a neighbor rating matrix is defined as follows:
𝑅 =⎝⎜⎜⎜⎛
𝑟𝑟 ⋮𝑟⋮𝑟 ⎠⎟⎟⎟⎞ (4) (5)
In which 𝑟 is the ranking considered for item 𝑘 by user 𝑗 who is part of the similar user circle of user 𝑖. For the proposed RS, if we have a significant number of people (the threshold is considered 30 persons [49]) in the social circle, social circle is used for user similarity evaluation. Otherwise, the user clustering method is used to find similar users with common interests.
It appears obvious that the recommendations made by people who are in the group of similar users with PSIs would be considered more reliable than those made by the group of similar users with SSIs. Based on the trust weight (1), the trust based average ranking for item 𝑘 is defined by 𝑟 as: 𝑟 = ∑ .∑ (5) (6)
where 𝜔 is the trust weight for the user 𝑗 based on (1). After calculating the average ranking for all of the items, the preferred items are sorted. Recommending duplicated items which users have
Figure 4. Categorization of different types of heterogeneous items based on their descriptive features.

ISPRS Int. J. Geo-Inf. 2020, 9, 519 14 of 28
For the proposed recommender algorithm, we consider five different heterogeneous subsetsof items in the main item set including movies, venues, events, music, and radio stations.Therefore, the combination of all the subsets is stated as follows:
I = ∪5i=1Ii =
{Ii1
i, Ii2i, . . . , Iim
i}
(3)
In which, i ∈ {1, 2, . . . , 5} and Ii define all of the items with a specific tag i such as movie, venue,music, event, and radio station set. In addition, m defines the number of items in a specific subset. If weconsider the movie items recommender service, all of m items placed in the movie set are categorizedinto eight different categories based on their genres as shown in Figure 4. If we explicitly recognizethe movie genre that is interesting to the target user, then the CF recommender algorithm is used torecommend the target user the k-top highly ranked movies in the desired genre. Let us consider thisk-top highly ranked list of recommended movies as matrix, Rk×1. Given people in the social circle ofthe target user i as a set defined by Ni =
{u j
i| j = 1, 2, . . . , l; i , j and u j ∈ U
}. Using their ratings for
the item k, a neighbor rating matrix is defined as follows:
R jki =
r1ki
r2ki
...r jk
i
...rlk
i
(4)
In which r jki is the ranking considered for item k by user j who is part of the similar user circle of
user i. For the proposed RS, if we have a significant number of people (the threshold is considered30 persons [49]) in the social circle, social circle is used for user similarity evaluation. Otherwise, the userclustering method is used to find similar users with common interests.
It appears obvious that the recommendations made by people who are in the group of similarusers with PSIs would be considered more reliable than those made by the group of similar users withSSIs. Based on the trust weight (1), the trust based average ranking for item k is defined by r′k as:
r′k =
∑lj=1
(ω j·r jk
i)
∑lj=1
(ω j
) (5)
where ω j is the trust weight for the user j based on (1). After calculating the average ranking forall of the items, the preferred items are sorted. Recommending duplicated items which users havealready interacted with is considered inefficient recommendations [59]. For example, if the targetuser has already watched a movie, recommending the same movie is ineffective. To overcomethis problem, we consider a post-processing mechanism based on historical information to removeduplicated items. If a user has already watched a movie, that information is stored in the database.After preparing the k-top highly ranked recommendations, we will compare the recommendation listwith historical information in the database. For the duplicated item, we will replace it with the nexthighly ranked recommendation.
Challenging Scenario Examples
In the first scenario, consider the situation that a user has no explicit preferences in relation tomovies genres or the user signs up for our RS for the first time. This means that data collected by theuser’s personal network was not explicitly express user’s preferences. This problem is a widely knownas the CSP. In this situation instead of relying on explicit user preferences, the likeliest preferred option
ISPRS Int. J. Geo-Inf. 2020, 9, 519 15 of 28
from the user’s social circle is going to be extracted. It is worth noting that the functionality of ourproposed RSs does not only depend on data extracted from SNs. Social interactions between userscan be extracted either from their social interaction in SNs (i.e., users with SSI) or their real-worldsocial interactions (i.e., users with PSI). We aim to find out the average preference of the target user’ssocial circle for each category of movie genre. If the social circle of the target user i is shown as Ni,their personal preferences are extracted from their dynamic profiles. As seen in Figure 4, there areeight different movie genres. Thus, we define the user preference matrix PNi as follows:
PNi =
Action Horror · · · Historicalu1
u2...
u j...
ul
(
pll p2
l · · · pg1
p12 p2
2 pg2
......
. . ....
p1j p2
j pij pg
j...
.... . .
...p1
l p2l · · · pg
l
)(6)
pij =
{1 i f user j has explicit interest in movie genre i0 otherwise
(7)
In which g = {1, 2, . . . , 8} defines the number of movie genres including, action, horror, war,drama, adventure, comedy, and historical films. Note that pi
j is a numerical index that depicts whetherthe user j is interested in movie genre i or not. Taking both the group of similar users with PSIs and SSIsinto consideration, we can apply a similar trust criterion to calculate the weighted average preferenceas follows:
(P′i
)g×1
=
p′1p′2...
p′y...
p′g
(8)
p′y =
∑lj=1
(ω j·p
yj
)∑l
j=1
(ω j
) (9)
In which ω j shows the weight assigned to the user j using the (1) and p′g shows the weightedaverage preference of all the social users for the movie genre g. After calculating the weighted averagepreference matrix P′i for the target user i, we can then identify the genre with the highest preference.Next, we consider this explored genre as the user more likely preferred genre and calculate the weightedaverage ratings for items associated with this specific genre. Finally, we would use the proposedrecommender algorithm to provide the target user i with the k-top highly ranked movies. It is worthnoting that the recommendation process is initialized using the average preferences to face the coldstart problem. However, the user profile is dynamic and can be updated by new preferences extractedby the context reasoning engine. For example, when the target user explicitly shows his/her interest ina specific movie genre, the new information will be used in the recommendation process.
For the second scenario, as the most challenging scenario of existing the CSP, consider the situationin which none of the people in the social circle of the target user i have no explicit preference withregard to the area of movies. Although the possibility of such a situation occurring is negligible,our system can address this problem as well. In this situation, there is no way to extract a possibleuser preference with regards to the area of movies. Clustering similar users based on their profiles
ISPRS Int. J. Geo-Inf. 2020, 9, 519 16 of 28
using the ABC approach can address this problem. Thus, people placed in the same cluster with thetarget user i are not necessarily people in his or her social circle. This means that the social circledefines the interaction between people, whereas people placed in the same cluster do not possesssuch interaction and similarity. In other words, we applied ABC to cluster all the users based ontheir implicit similarities in terms of contextual information extracted from the dynamic user profiles.The integration of ABC user clustering in USDE can be considered as an alternative solution to addressthe CSP in situations that there are no information explicitly express user preferences to initialize therecommendation process. After identifying similar users, we can then deal with this scenario in a waysimilar to the first scenario.
6. Experiments and Results
To evaluate the functionality of the proposed RS, after describing the datasets and data providedby user’s smart devices, we evaluate the proposed RS in comparison with the other two of the mostwidely applied recommender algorithms. Finally, the CSP is considered to examine the ability of theproposed USDE in different scenarios.
6.1. Updating User Profile
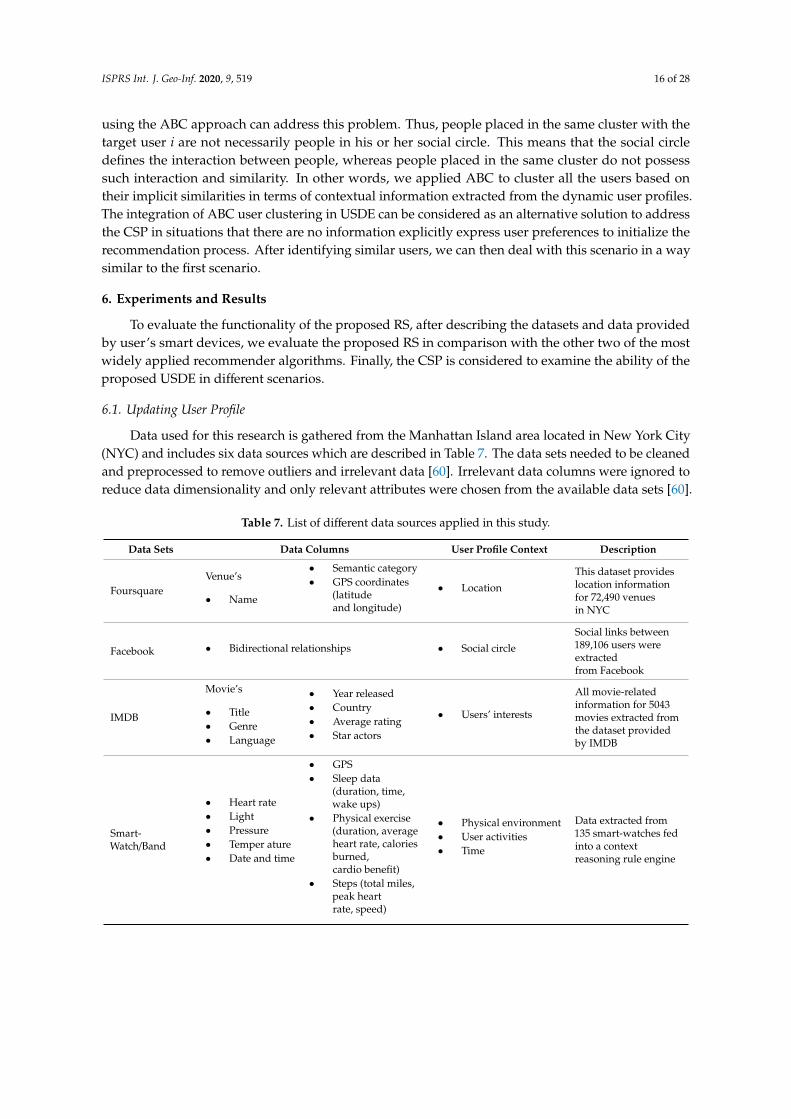
Data used for this research is gathered from the Manhattan Island area located in New York City(NYC) and includes six data sources which are described in Table 7. The data sets needed to be cleanedand preprocessed to remove outliers and irrelevant data [60]. Irrelevant data columns were ignored toreduce data dimensionality and only relevant attributes were chosen from the available data sets [60].
Table 7. List of different data sources applied in this study.
Data Sets Data Columns User Profile Context Description
FoursquareVenue’s
• Name
• Semantic category• GPS coordinates
(latitudeand longitude)
• Location
This dataset provideslocation informationfor 72,490 venuesin NYC
Facebook • Bidirectional relationships • Social circle
Social links between189,106 users wereextractedfrom Facebook
IMDB
Movie’s
• Title• Genre• Language
• Year released• Country• Average rating• Star actors
• Users’ interests
All movie-relatedinformation for 5043movies extracted fromthe dataset providedby IMDB
Smart-Watch/Band
• Heart rate• Light• Pressure• Temper ature• Date and time
• GPS• Sleep data
(duration, time,wake ups)
• Physical exercise(duration, averageheart rate, caloriesburned,cardio benefit)
• Steps (total miles,peak heartrate, speed)
• Physical environment• User activities• Time
Data extracted from135 smart-watches fedinto a contextreasoning rule engine
ISPRS Int. J. Geo-Inf. 2020, 9, 519 17 of 28
Table 7. Cont.
Data Sets Data Columns User Profile Context Description
Google Home• ID• History of
user orders
• History ofuser search
• Physical environment• User activities• Time• Social circle• Location• User interests
Extracted andanalyzed 56,769 datarows collected byGoogle Homes toprovide usercontextual information
Smartphone/Tablet
• Call log• Schedule• Temperature• Light• Pressure• GPS
• Web search history• Gmail information• Message• History of
used applications• Visited venues
• User activities• Location• Time• Social circle• Physical environment
Developed an androidapplication to extractthe desired data from asmartphone or tablet
The datasets described in Table 7 are considered general-purpose datasets that will be used forevaluating the performance of both the proposed movie RS and the USDE. Different datasets in thispaper can be classified into two main categories. The first category is collected by smartphones toextract desired contexts, so called context related datasets. These contexts will then be used to updateuser profiles. The second category will be stored in the cloud database as the metadata information, socalled meta datasets.
6.1.1. Context Related Datasets
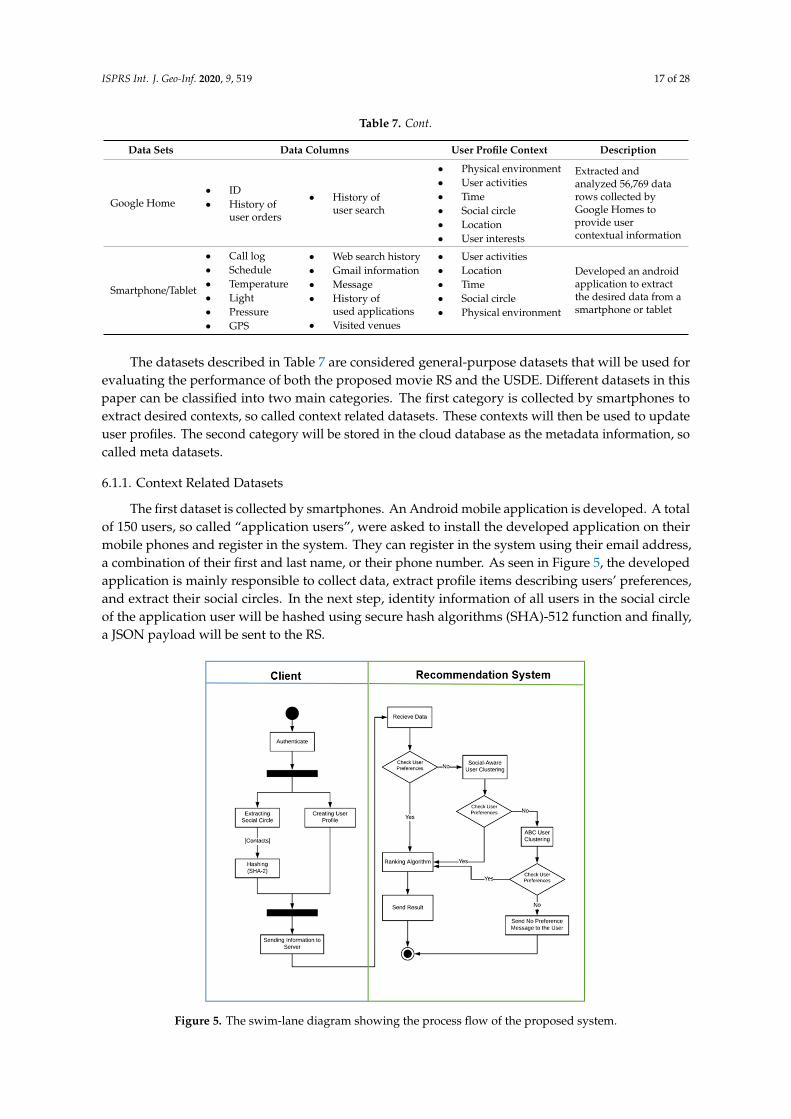
The first dataset is collected by smartphones. An Android mobile application is developed. A totalof 150 users, so called “application users”, were asked to install the developed application on theirmobile phones and register in the system. They can register in the system using their email address,a combination of their first and last name, or their phone number. As seen in Figure 5, the developedapplication is mainly responsible to collect data, extract profile items describing users’ preferences,and extract their social circles. In the next step, identity information of all users in the social circleof the application user will be hashed using secure hash algorithms (SHA)-512 function and finally,a JSON payload will be sent to the RS.ISPRS Int. J. Geo–Inf. 2020, 9, x FOR PEER REVIEW 17 of 29
Figure 5. The swim-lane diagram showing the process flow of the proposed system.
In this experiment, 63 of application users have used their Google Home smart speakers. This dataset, as the second dataset, consists of users’ communications with their personal Google Home smart speaker. The My Google Activity platform (https://myactivity.google.com/myactivity) is the Google cloud storage that is helping users rediscover translations of their communication with their Google Assistants including, Google Home smart speakers. We extracted 56,769 rows of information from July 01, 2018 to August 30, 2018, from the data provided by Google Home devices. In addition, 135 of application users have utilized their smart watches. This dataset, as the third dataset, is then processed by the developed application to extract desired contexts such as mobility level. In this research, Google Fit APIs (https://developers.google.com/fit) is used to access historical data provided by smart wearables paired with Android devices. Totally 7832 rows of information are extracted from users’ smart watches/bands which were including diverse attributes ranging from their total burned calories to average heart rate. More details about the data collected from smart watches and speakers are given in Table 7. A rule engine is then applied to extract contextual information such as user activities from the data collected by smart-watches/bands.
Different services are developed in the proposed mobile application to extract the social circle of the user. The social circle dataset, as the fourth dataset, includes users who are either in the contact list of the user’s smart phone, call log history, or extracted from social networks (e.g., Facebook using the Facebook API [61]). We extracted 2,813,940 social links between 189,106 users by using the Graph API [61]. This group of users is called “contact users”. For example, if the user “X” installed the mobile application, this user is called the application user. As an example, the user “X” might have a contact like “John W: +1 (123) 456–1111” in his/her contact list. Therefore, “John W” is recognized as the contact user for the application user “X”. It is worth mentioning that users are required to grant the Android application permission to access each of the aforementioned services ranging from their Google activities to internally stored data in their smartphones. In this experiment, totally 189,106 users (including 150 application users and 188,956 contact users) are extracted by using the proposed mobile application on all 150 application users’ mobile phones.
The Google Home and smart watch datasets are used to create and update the user profile. In other words, profile items are assigned to the application users and then a JSON payload including the user profile and his/her social circle is sent by application users. As the application user requests for movie recommendations, a list of hashed information of the user social circle and also his/her updated profile information will be sent to the server. Three different keys have been used to secure
Figure 5. The swim-lane diagram showing the process flow of the proposed system.
ISPRS Int. J. Geo-Inf. 2020, 9, 519 18 of 28
In this experiment, 63 of application users have used their Google Home smart speakers.This dataset, as the second dataset, consists of users’ communications with their personal Google Homesmart speaker. The My Google Activity platform (https://myactivity.google.com/myactivity) is theGoogle cloud storage that is helping users rediscover translations of their communication with theirGoogle Assistants including, Google Home smart speakers. We extracted 56,769 rows of informationfrom July 01, 2018 to August 30, 2018, from the data provided by Google Home devices. In addition,135 of application users have utilized their smart watches. This dataset, as the third dataset, is thenprocessed by the developed application to extract desired contexts such as mobility level. In thisresearch, Google Fit APIs (https://developers.google.com/fit) is used to access historical data providedby smart wearables paired with Android devices. Totally 7832 rows of information are extracted fromusers’ smart watches/bands which were including diverse attributes ranging from their total burnedcalories to average heart rate. More details about the data collected from smart watches and speakersare given in Table 7. A rule engine is then applied to extract contextual information such as useractivities from the data collected by smart-watches/bands.
Different services are developed in the proposed mobile application to extract the social circle ofthe user. The social circle dataset, as the fourth dataset, includes users who are either in the contactlist of the user’s smart phone, call log history, or extracted from social networks (e.g., Facebook usingthe Facebook API [61]). We extracted 2,813,940 social links between 189,106 users by using the GraphAPI [61]. This group of users is called “contact users”. For example, if the user “X” installed themobile application, this user is called the application user. As an example, the user “X” might have acontact like “John W: +1 (123) 456–1111” in his/her contact list. Therefore, “John W” is recognized asthe contact user for the application user “X”. It is worth mentioning that users are required to grantthe Android application permission to access each of the aforementioned services ranging from theirGoogle activities to internally stored data in their smartphones. In this experiment, totally 189,106 users(including 150 application users and 188,956 contact users) are extracted by using the proposed mobileapplication on all 150 application users’ mobile phones.
The Google Home and smart watch datasets are used to create and update the user profile. In otherwords, profile items are assigned to the application users and then a JSON payload including the userprofile and his/her social circle is sent by application users. As the application user requests for movierecommendations, a list of hashed information of the user social circle and also his/her updated profileinformation will be sent to the server. Three different keys have been used to secure user identity usingsecure hash algorithms (SHA)-512 function. These keys can be “first name +’ ‘+ last name”, “phonenumber”, and “email address”. For example, the user “X” as an application user might have a contactuser in the contact list of his/her smart phone like “Y: +1 587 664 XXXX”. In this case, both “first name+ ‘ ‘ + last name” and the “phone number” will be hashed separately using the SHA-512 hash function.In addition, user “Y” registered in the system using his phone number, as an example. Therefore, hisphone number will be hashed, and, it will be assigned to the user as his userID. This userID refersto the user “Y” for any further communication with the server. Since user “Y” identity information(i.e., his phone number) is hashed using the same SHA-512 function in both smartphones, userID willbe the same in both datasets. The cloud database is designed in such a way that when user informationis sent to the cloud, it will firstly look for the same hashed information in all three different keys. If itfinds the same hashed information in each of those three keys, it does not create a new user and onlyupdates information. Otherwise, it will create a new user and store information for this user. Using theabove algorithm assures that the identity of users will be kept anonymized in the cloud database.In addition, the system can recognize two or more users as the same user in different JSON payloads aslong as their hashed information is the same.
6.1.2. Meta Datasets
The fifth data source was collected by Foursquare LBSN (https://foursquare.com/). This dataset wascreated using the collection of data for user check-ins in NYC over a period of approximately 10 months
ISPRS Int. J. Geo-Inf. 2020, 9, 519 19 of 28
between April 12, 2012 to February 16, 2013 [10]. Although this dataset consists of informationsuch as User ID, Venue ID, and coordinated universal time (UTC), for all of the check-ins, we onlyconsidered the name, semantic category, and GPS coordinates of venues as relevant information.In other words, this dataset contains metadata of venues located in NYC. Finally, the movie dataset, asthe sixth dataset, was extracted from the Internet Movie Database (IMDb (https://www.imdb.com/)) inJune 2018. Although this dataset covers all the movies from the last century, only movies that werereleased between 2016 to 2018 were selected. This database is freely available in [62] and containsdifferent attributes such as movie_title, director_name(s), genres, language, country, year, actor_1_name,actor_2_name, actor_3_name, and average user ratings. In other words, this dataset contains metadataof movies.
The profile information is only extracted and updated for application users using their mobilephones. Therefore, it is obvious that there is no profile information with regards to the most of contactusers in the cloud database. We used the word “most” because some of the users who are in the socialcircle of application users are application users as well. For example, “Sarah” has “Steve” in her socialcircle. “Steve” is an application user as well. Steve’s profile should be empty as a contact user in Sara’ssocial circle. However, Steve’s profile is not empty because he is an application user at the same time.
To fill empty profile information of contact users in terms of their preferences in movie genres,other publicly available datasets are used as Meta datasets. This dataset is used to fill empty profileinformation with real data. This dataset, called “Movie Dataset” (https://www.kaggle.com/rounakbanik/
the--movies--dataset), contains 26 million ratings from 270,000 users for 45,000 IMDB movies andextracted from the official GroupLens website. A random unique ID between 1 and 188,956 is assignedto each of the contact users that do not have any information showing their preferences in moviegenres. Then, all rated movies in the “Movie Dataset” is extracted where the userID equals to theunique randomly assigned userID for the contact users. The second meta dataset is the Foursquareuser check-ins dataset (i.e., Foursquare dataset). A similar process will be done to fill user check-insinformation for the contact users who do not have any information showing their check-ins information.By doing these two procedures, it is assumed that the profile information is filled out for the contact usersusing real data extracted from the official GroupLens website and Foursquare LBSN. Finally, MySQL ischosen as one of the most popular open-source relational database management systems to store thecollected data [26]. Detailed information on datasets that have been used in this study is summarizedin Table 7.
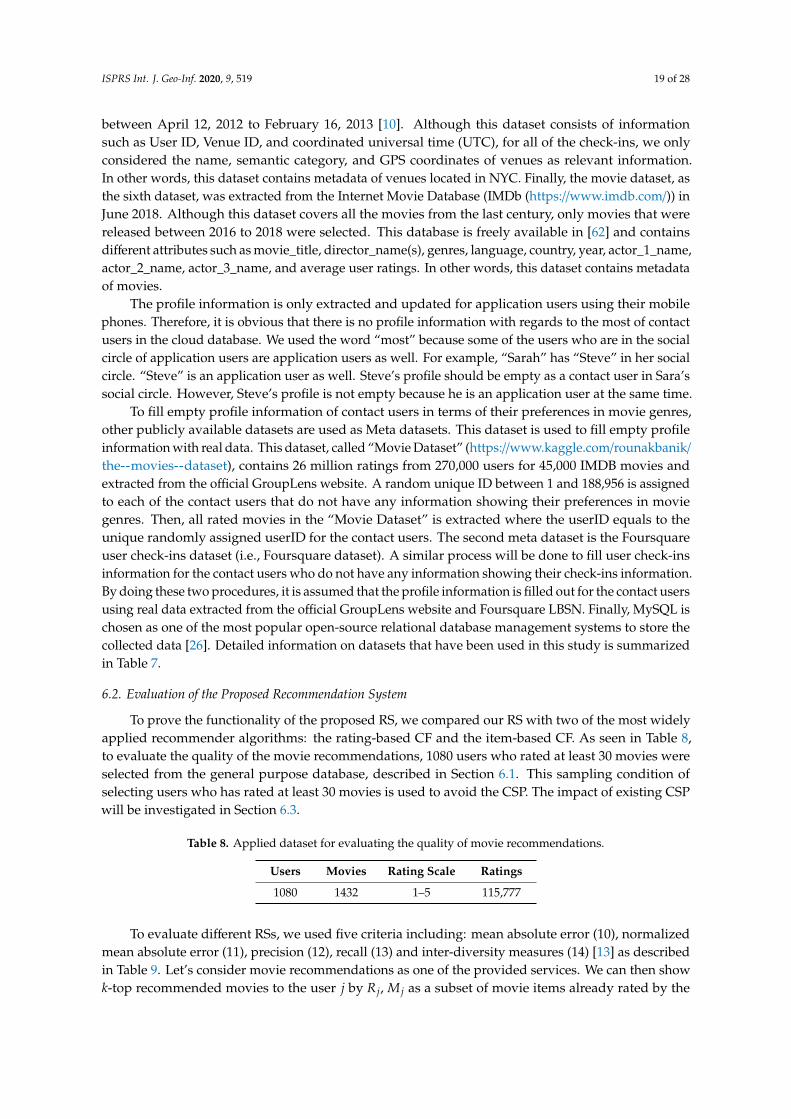
6.2. Evaluation of the Proposed Recommendation System
To prove the functionality of the proposed RS, we compared our RS with two of the most widelyapplied recommender algorithms: the rating-based CF and the item-based CF. As seen in Table 8,to evaluate the quality of the movie recommendations, 1080 users who rated at least 30 movies wereselected from the general purpose database, described in Section 6.1. This sampling condition ofselecting users who has rated at least 30 movies is used to avoid the CSP. The impact of existing CSPwill be investigated in Section 6.3.
Table 8. Applied dataset for evaluating the quality of movie recommendations.
Users Movies Rating Scale Ratings
1080 1432 1–5 115,777
To evaluate different RSs, we used five criteria including: mean absolute error (10), normalizedmean absolute error (11), precision (12), recall (13) and inter-diversity measures (14) [13] as describedin Table 9. Let’s consider movie recommendations as one of the provided services. We can then showk-top recommended movies to the user j by R j, M j as a subset of movie items already rated by the
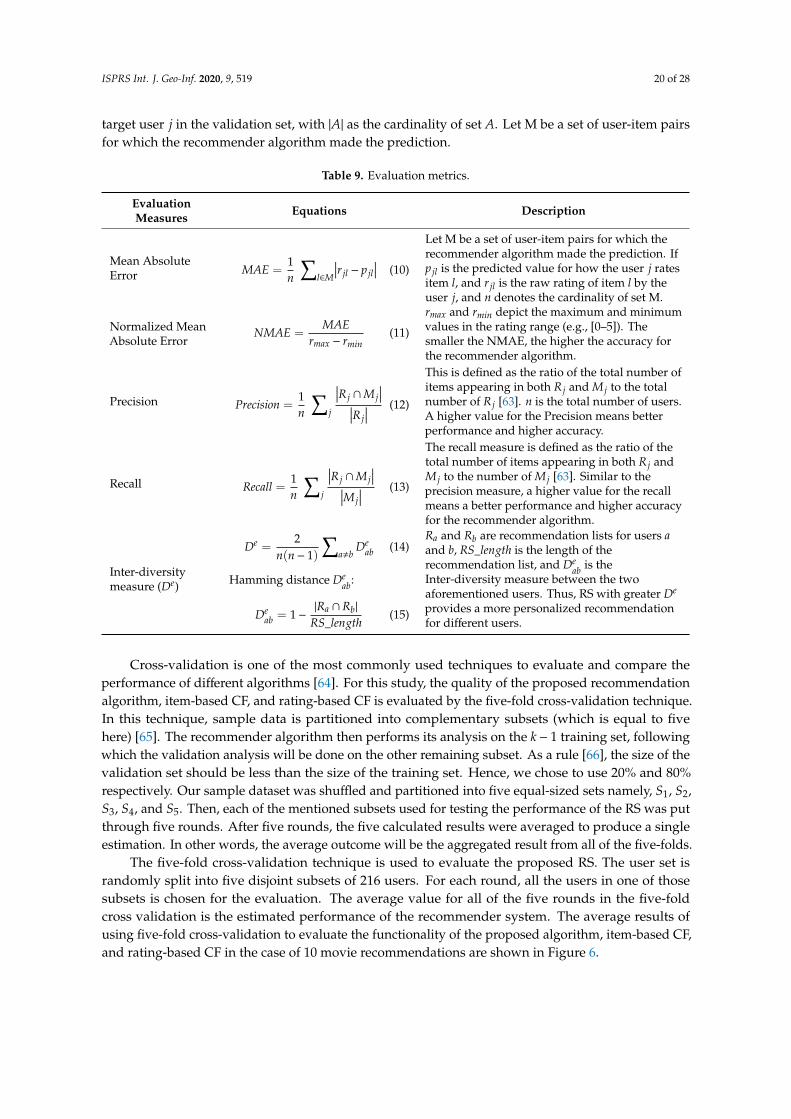
ISPRS Int. J. Geo-Inf. 2020, 9, 519 20 of 28
target user j in the validation set, with |A| as the cardinality of set A. Let M be a set of user-item pairsfor which the recommender algorithm made the prediction.
Table 9. Evaluation metrics.
EvaluationMeasures Equations Description
Mean AbsoluteError MAE =
1n
∑l∈M
∣∣∣r jl − p jl∣∣∣ (10)
Let M be a set of user-item pairs for which therecommender algorithm made the prediction. Ifp jl is the predicted value for how the user j ratesitem l, and r jl is the raw rating of item l by theuser j, and n denotes the cardinality of set M.
Normalized MeanAbsolute Error
NMAE =MAE
rmax − rmin(11)
rmax and rmin depict the maximum and minimumvalues in the rating range (e.g., [0–5]). Thesmaller the NMAE, the higher the accuracy forthe recommender algorithm.
Precision Precision =1n
∑j
∣∣∣R j ∩M j∣∣∣∣∣∣R j
∣∣∣ (12)
This is defined as the ratio of the total number ofitems appearing in both R j and M j to the totalnumber of R j [63]. n is the total number of users.A higher value for the Precision means betterperformance and higher accuracy.
Recall Recall =1n
∑j
∣∣∣R j ∩M j∣∣∣∣∣∣M j
∣∣∣ (13)
The recall measure is defined as the ratio of thetotal number of items appearing in both R j andM j to the number of M j [63]. Similar to theprecision measure, a higher value for the recallmeans a better performance and higher accuracyfor the recommender algorithm.
Inter-diversitymeasure (De)
De =2
n(n− 1)
∑a,b
Deab (14)
Hamming distance Deab:
Deab = 1−
|Ra ∩Rb|
RS_length(15)
Ra and Rb are recommendation lists for users aand b, RS_length is the length of therecommendation list, and De
ab is theInter-diversity measure between the twoaforementioned users. Thus, RS with greater De
provides a more personalized recommendationfor different users.
Cross-validation is one of the most commonly used techniques to evaluate and compare theperformance of different algorithms [64]. For this study, the quality of the proposed recommendationalgorithm, item-based CF, and rating-based CF is evaluated by the five-fold cross-validation technique.In this technique, sample data is partitioned into complementary subsets (which is equal to fivehere) [65]. The recommender algorithm then performs its analysis on the k− 1 training set, followingwhich the validation analysis will be done on the other remaining subset. As a rule [66], the size of thevalidation set should be less than the size of the training set. Hence, we chose to use 20% and 80%respectively. Our sample dataset was shuffled and partitioned into five equal-sized sets namely, S1, S2,S3, S4, and S5. Then, each of the mentioned subsets used for testing the performance of the RS was putthrough five rounds. After five rounds, the five calculated results were averaged to produce a singleestimation. In other words, the average outcome will be the aggregated result from all of the five-folds.
The five-fold cross-validation technique is used to evaluate the proposed RS. The user set israndomly split into five disjoint subsets of 216 users. For each round, all the users in one of thosesubsets is chosen for the evaluation. The average value for all of the five rounds in the five-foldcross validation is the estimated performance of the recommender system. The average results ofusing five-fold cross-validation to evaluate the functionality of the proposed algorithm, item-based CF,and rating-based CF in the case of 10 movie recommendations are shown in Figure 6.

ISPRS Int. J. Geo-Inf. 2020, 9, 519 21 of 28
ISPRS Int. J. Geo–Inf. 2020, 9, x FOR PEER REVIEW 21 of 29
number of 𝑀 [63]. Similar to the precision measure, a higher value for the recall means a better performance and higher accuracy for the recommender algorithm.
Inter-diversity measure (𝐷 )
𝐷 = ( ) ∑ 𝐷 (14) Hamming distance 𝐷 : 𝐷 = 1 − | ∩ |_ (15)
𝑅 and 𝑅 are recommendation lists for users 𝑎 and 𝑏 , 𝑅𝑆_𝑙𝑒𝑛𝑔𝑡ℎ is the length of the recommendation list, and 𝐷 is the Inter-diversity measure between the two aforementioned users. Thus, RS with greater 𝐷 provides a more personalized recommendation for different users.
Cross-validation is one of the most commonly used techniques to evaluate and compare the performance of different algorithms [64]. For this study, the quality of the proposed recommendation algorithm, item-based CF, and rating-based CF is evaluated by the five-fold cross-validation technique. In this technique, sample data is partitioned into complementary subsets (which is equal to five here) [65]. The recommender algorithm then performs its analysis on the 𝑘 − 1 training set, following which the validation analysis will be done on the other remaining subset. As a rule [66], the size of the validation set should be less than the size of the training set. Hence, we chose to use 20% and 80% respectively. Our sample dataset was shuffled and partitioned into five equal-sized sets namely, 𝑆 , 𝑆 , 𝑆 , 𝑆 , and 𝑆 . Then, each of the mentioned subsets used for testing the performance of the RS was put through five rounds. After five rounds, the five calculated results were averaged to produce a single estimation. In other words, the average outcome will be the aggregated result from all of the five-folds.
The five-fold cross-validation technique is used to evaluate the proposed RS. The user set is randomly split into five disjoint subsets of 216 users. For each round, all the users in one of those subsets is chosen for the evaluation. The average value for all of the five rounds in the five-fold cross validation is the estimated performance of the recommender system. The average results of using five-fold cross-validation to evaluate the functionality of the proposed algorithm, item-based CF, and rating-based CF in the case of 10 movie recommendations are shown in Figure 6.
Figure 6. The average performance of the proposed algorithm in comparison with item-based collaborative filtering (CF) and rating-based CF
The length of the recommendation list plays an important role in the performance analysis [13]. In this paper, we evaluate the performance of all three RSs (i.e., the proposed algorithm, item-based CF, and rating-based CF) with different numbers of recommended items (i.e., 𝑄). The number of items on the recommendation list varies from ten to 50 with intervals of ten. Figure 7a–c show the accuracy comparison between three RSs.
Figure 6. The average performance of the proposed algorithm in comparison with item-basedcollaborative filtering (CF) and rating-based CF.
The length of the recommendation list plays an important role in the performance analysis [13].In this paper, we evaluate the performance of all three RSs (i.e., the proposed algorithm, item-based CF,and rating-based CF) with different numbers of recommended items (i.e., Q). The number of items onthe recommendation list varies from ten to 50 with intervals of ten. Figure 7a–c show the accuracycomparison between three RSs.ISPRS Int. J. Geo–Inf. 2020, 9, x FOR PEER REVIEW 22 of 29
(a) (b)
(c) (d)
Figure 7. Performance evaluation of the proposed algorithm versus rating-based CF and item-based CF algorithm where Q is the number of recommended items; (a) normalized mean absolute error (NMAE); (b) precision; (c) recall; and (d) inter-diversity criteria comparison.
Figure 7a illustrates how the proposed algorithm achieves better NMAE when the number of recommended items is lower than 30. Although increasing the number of recommended items results in reducing the accuracy of our proposed algorithm, the accuracy of the proposed algorithm does not differ significantly from the other two methods. We believe that the underlying reason for this gradual decline of the accuracy of our proposed algorithm lies in the utilization of more personalized features to find similar users. In other words, when the user personalized features become larger, the number of recognized similar users is reduced. On the other hand, a larger desired number of recommendation items requires finding more users similar to the target user. Although applying more personalized descriptive features to find similar users results in a higher level of personalization, recognizing larger numbers of populations of similar users is also more difficult. Hence by increasing the number of expected items in the recommendation list, the accuracy of the proposed method gradually declines. As both item-based and rating-based CF follows the same approach to identify similar users, the value of the NMAE for both is similar. Figure 7b–c show that the accuracy of our proposed recommender algorithm is better than the others for when 𝑄 30. The best precision and recall values are when the desired number of recommended items is ten. In this case, we can conclude that the three methods present the maximum discrepancy in their accuracy. Besides the accuracy evaluation of three RSs, Figure 7d depicts the personalization level of RSs. Figure 7d illustrates that the proposed method provides the most personalized recommendations for different users.
6.3. Evaluation of the Proposed USDE under CSP
The previous experiments have been carried out in a situation in which there were no cold start problems in the evaluation process. For example, let us look at the situation in which there are three users in our proposed RS namely, 𝐴, 𝐵, and 𝐶. Their preferences in movies are clearly detected and
Figure 7. Performance evaluation of the proposed algorithm versus rating-based CF and item-based CFalgorithm where Q is the number of recommended items; (a) normalized mean absolute error (NMAE);(b) precision; (c) recall; and (d) inter-diversity criteria comparison.
Figure 7a illustrates how the proposed algorithm achieves better NMAE when the number ofrecommended items is lower than 30. Although increasing the number of recommended items resultsin reducing the accuracy of our proposed algorithm, the accuracy of the proposed algorithm does notdiffer significantly from the other two methods. We believe that the underlying reason for this gradualdecline of the accuracy of our proposed algorithm lies in the utilization of more personalized features
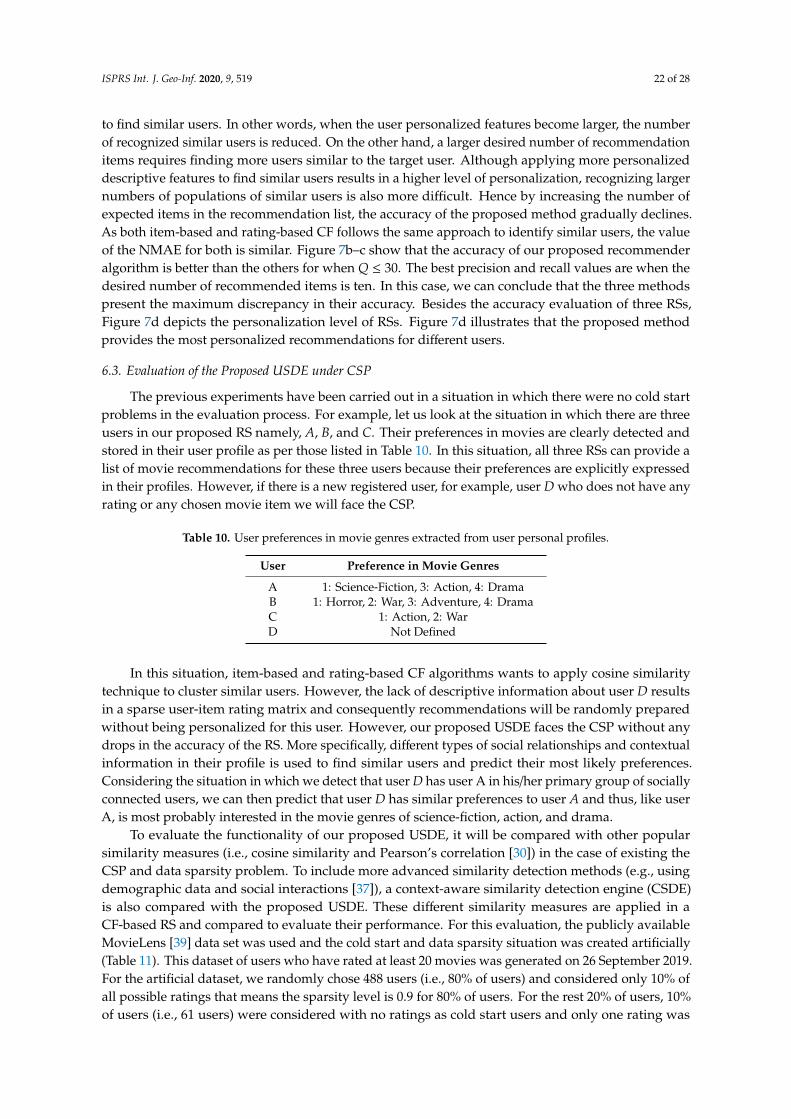
ISPRS Int. J. Geo-Inf. 2020, 9, 519 22 of 28
to find similar users. In other words, when the user personalized features become larger, the numberof recognized similar users is reduced. On the other hand, a larger desired number of recommendationitems requires finding more users similar to the target user. Although applying more personalizeddescriptive features to find similar users results in a higher level of personalization, recognizing largernumbers of populations of similar users is also more difficult. Hence by increasing the number ofexpected items in the recommendation list, the accuracy of the proposed method gradually declines.As both item-based and rating-based CF follows the same approach to identify similar users, the valueof the NMAE for both is similar. Figure 7b–c show that the accuracy of our proposed recommenderalgorithm is better than the others for when Q ≤ 30. The best precision and recall values are when thedesired number of recommended items is ten. In this case, we can conclude that the three methodspresent the maximum discrepancy in their accuracy. Besides the accuracy evaluation of three RSs,Figure 7d depicts the personalization level of RSs. Figure 7d illustrates that the proposed methodprovides the most personalized recommendations for different users.
6.3. Evaluation of the Proposed USDE under CSP
The previous experiments have been carried out in a situation in which there were no cold startproblems in the evaluation process. For example, let us look at the situation in which there are threeusers in our proposed RS namely, A, B, and C. Their preferences in movies are clearly detected andstored in their user profile as per those listed in Table 10. In this situation, all three RSs can provide alist of movie recommendations for these three users because their preferences are explicitly expressedin their profiles. However, if there is a new registered user, for example, user D who does not have anyrating or any chosen movie item we will face the CSP.
Table 10. User preferences in movie genres extracted from user personal profiles.
User Preference in Movie Genres
A 1: Science-Fiction, 3: Action, 4: DramaB 1: Horror, 2: War, 3: Adventure, 4: DramaC 1: Action, 2: WarD Not Defined
In this situation, item-based and rating-based CF algorithms wants to apply cosine similaritytechnique to cluster similar users. However, the lack of descriptive information about user D resultsin a sparse user-item rating matrix and consequently recommendations will be randomly preparedwithout being personalized for this user. However, our proposed USDE faces the CSP without anydrops in the accuracy of the RS. More specifically, different types of social relationships and contextualinformation in their profile is used to find similar users and predict their most likely preferences.Considering the situation in which we detect that user D has user A in his/her primary group of sociallyconnected users, we can then predict that user D has similar preferences to user A and thus, like userA, is most probably interested in the movie genres of science-fiction, action, and drama.
To evaluate the functionality of our proposed USDE, it will be compared with other popularsimilarity measures (i.e., cosine similarity and Pearson’s correlation [30]) in the case of existing theCSP and data sparsity problem. To include more advanced similarity detection methods (e.g., usingdemographic data and social interactions [37]), a context-aware similarity detection engine (CSDE)is also compared with the proposed USDE. These different similarity measures are applied in aCF-based RS and compared to evaluate their performance. For this evaluation, the publicly availableMovieLens [39] data set was used and the cold start and data sparsity situation was created artificially(Table 11). This dataset of users who have rated at least 20 movies was generated on 26 September 2019.For the artificial dataset, we randomly chose 488 users (i.e., 80% of users) and considered only 10% ofall possible ratings that means the sparsity level is 0.9 for 80% of users. For the rest 20% of users, 10%of users (i.e., 61 users) were considered with no ratings as cold start users and only one rating was
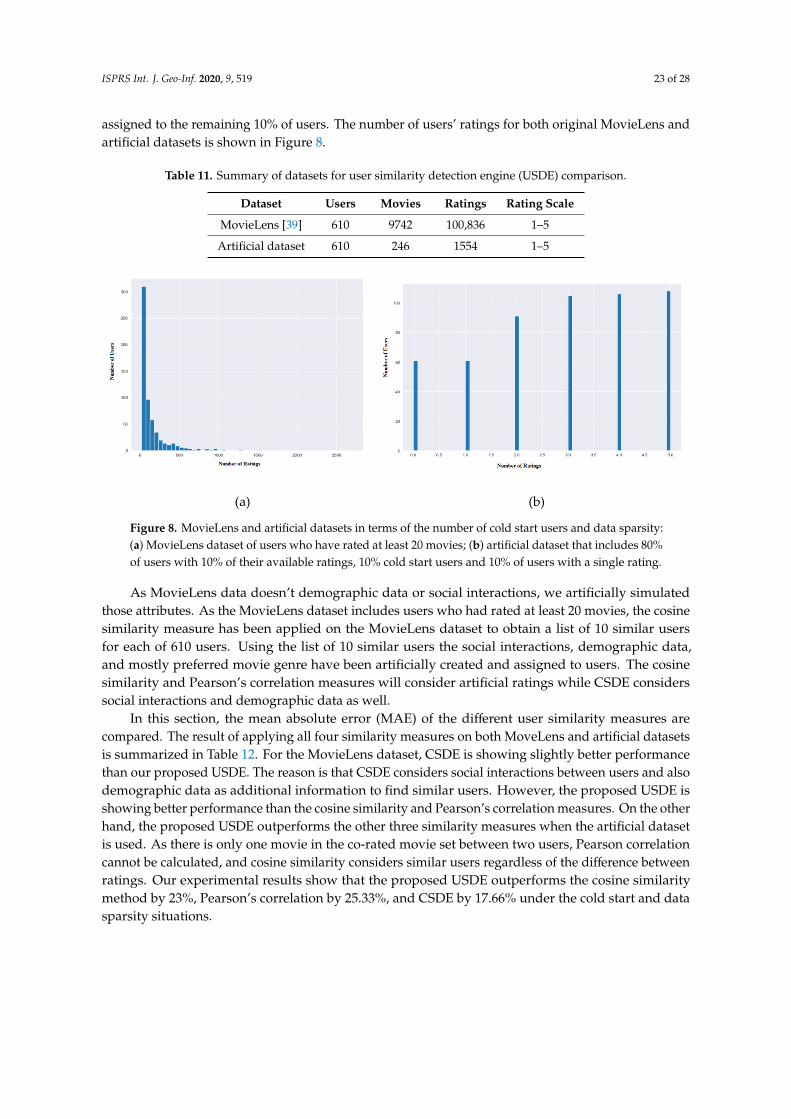
ISPRS Int. J. Geo-Inf. 2020, 9, 519 23 of 28
assigned to the remaining 10% of users. The number of users’ ratings for both original MovieLens andartificial datasets is shown in Figure 8.
Table 11. Summary of datasets for user similarity detection engine (USDE) comparison.
Dataset Users Movies Ratings Rating Scale
MovieLens [39] 610 9742 100,836 1–5
Artificial dataset 610 246 1554 1–5ISPRS Int. J. Geo–Inf. 2020, 9, x FOR PEER REVIEW 24 of 29
(a) (b)
Figure 8. MovieLens and artificial datasets in terms of the number of cold start users and data sparsity: (a) MovieLens dataset of users who have rated at least 20 movies; (b) artificial dataset that includes 80% of users with 10% of their available ratings, 10% cold start users and 10% of users with a single rating.
As MovieLens data doesn’t demographic data or social interactions, we artificially simulated those attributes. As the MovieLens dataset includes users who had rated at least 20 movies, the cosine similarity measure has been applied on the MovieLens dataset to obtain a list of 10 similar users for each of 610 users. Using the list of 10 similar users the social interactions, demographic data, and mostly preferred movie genre have been artificially created and assigned to users. The cosine similarity and Pearson’s correlation measures will consider artificial ratings while CSDE considers social interactions and demographic data as well.
In this section, the mean absolute error (MAE) of the different user similarity measures are compared. The result of applying all four similarity measures on both MoveLens and artificial datasets is summarized in Table 12. For the MovieLens dataset, CSDE is showing slightly better performance than our proposed USDE. The reason is that CSDE considers social interactions between users and also demographic data as additional information to find similar users. However, the proposed USDE is showing better performance than the cosine similarity and Pearson’s correlation measures. On the other hand, the proposed USDE outperforms the other three similarity measures when the artificial dataset is used. As there is only one movie in the co-rated movie set between two users, Pearson correlation cannot be calculated, and cosine similarity considers similar users regardless of the difference between ratings. Our experimental results show that the proposed USDE outperforms the cosine similarity method by 23%, Pearson’s correlation by 25.33%, and CSDE by 17.66% under the cold start and data sparsity situations.
Table 12. Summary of mean absolute error (MAE) for various datasets
Measure Full ratings Users with 2 to 5
ratings Users with 1
rating Cold start users
Cosine 0.78 0.81 0.91 0.97 Pearson’s
Correlation 0.69 0.84 0.93 0.99
CSDE 0.62 0.79 0.87 0.87 USDE 0.65 0.68 0.67 0.65
7. Conclusion and Future Work
In this paper, we proposed a mobile recommender system as a single framework for integrating the potential of smart devices together with social networks. Utilizing the potential of smart devices in our proposed RS opens up new windows of opportunity for RSs. Using the primary contexts
Figure 8. MovieLens and artificial datasets in terms of the number of cold start users and data sparsity:(a) MovieLens dataset of users who have rated at least 20 movies; (b) artificial dataset that includes 80%of users with 10% of their available ratings, 10% cold start users and 10% of users with a single rating.
As MovieLens data doesn’t demographic data or social interactions, we artificially simulatedthose attributes. As the MovieLens dataset includes users who had rated at least 20 movies, the cosinesimilarity measure has been applied on the MovieLens dataset to obtain a list of 10 similar usersfor each of 610 users. Using the list of 10 similar users the social interactions, demographic data,and mostly preferred movie genre have been artificially created and assigned to users. The cosinesimilarity and Pearson’s correlation measures will consider artificial ratings while CSDE considerssocial interactions and demographic data as well.
In this section, the mean absolute error (MAE) of the different user similarity measures arecompared. The result of applying all four similarity measures on both MoveLens and artificial datasetsis summarized in Table 12. For the MovieLens dataset, CSDE is showing slightly better performancethan our proposed USDE. The reason is that CSDE considers social interactions between users and alsodemographic data as additional information to find similar users. However, the proposed USDE isshowing better performance than the cosine similarity and Pearson’s correlation measures. On the otherhand, the proposed USDE outperforms the other three similarity measures when the artificial datasetis used. As there is only one movie in the co-rated movie set between two users, Pearson correlationcannot be calculated, and cosine similarity considers similar users regardless of the difference betweenratings. Our experimental results show that the proposed USDE outperforms the cosine similaritymethod by 23%, Pearson’s correlation by 25.33%, and CSDE by 17.66% under the cold start and datasparsity situations.
ISPRS Int. J. Geo-Inf. 2020, 9, 519 24 of 28
Table 12. Summary of mean absolute error (MAE) for various datasets.
Measure Full Ratings Users with 2 to5 Ratings
Users with 1Rating Cold Start Users
Cosine 0.78 0.81 0.91 0.97
Pearson’s Correlation 0.69 0.84 0.93 0.99
CSDE 0.62 0.79 0.87 0.87
USDE 0.65 0.68 0.67 0.65
7. Conclusions and Future Work
In this paper, we proposed a mobile recommender system as a single framework for integratingthe potential of smart devices together with social networks. Utilizing the potential of smart devicesin our proposed RS opens up new windows of opportunity for RSs. Using the primary contextsprovided by users’ smart devices, the proposed RS does not rely anymore on a limited number ofcontext providers (i.e., smartphones and tablets). Instead, all smart devices registered by users can beadded to the RS daily. Creating an updated user profile that contains contexts extracted from users’smart devices creates several advantages for our system. Firstly, by using data that is constantly beingupdated by the user’s smart devices, the issue of the changing nature of user preferences is addressed.Secondly, the proposed system is able to extract context (i.e., user heartbeat whilst performing differentphysical activities) that users were previously unable to report. Finally, the use of smart deviceseliminates the need for any human intervention in data collection.
Providing more personalized recommendations and addressing the CSP are known as themost challenging issues for RSs. Reaching a better understanding of users can result in providingrecommendations that are more in line with user preferences. Recent advances in RSs that includethe integrating of context-awareness with traditional RSs have largely improved the functionalityof RSs in relation to providing users with more personalized recommendations. However, the levelof personalization provided by RSs can be further improved. For this research, a novel similaritydetection engine is proposed and integrated into the CF-based RS in order to further improve thefunctionality of RSs.
In comparison to other studies that solely identify similar users by considering their interactionswith items, we believe that social relationships can also be used to identify similar users. By utilizingthe data provided by users’ smart devices for our proposed RS, our definition of similarity surpasseswhat has recently been provided by previous studies. In addition to the common social relationships(i.e., bidirectional social relationships in Facebook), we also consider closer relationships that users canhave with phone calls and emails. In comparison to other similar studies, the similarity engine canidentify the similarity between users by considering their close relationships that have been identifiedusing data provided by their smart devices. Therefore, unlike other SN-based similarity detectionengines, our proposed USDE identifies similar users even when the user does not have any socialinteractions on SNs. The results show that the proposed USDE outperforms the cosine similaritymethod by 23%, Pearson’s correlation by 25.33%, and the CSDE by 17.66%, in cold start and datasparsity situations.
In the other case with an existing CSP (i.e., the conditions in which the new user has just signedup with the RS, his/her preferences are not explicitly identified, and he/she has no social relations onSNs, or who are using smart devices), our USDE identifies similar users by using swarm artificialintelligence. By considering user profiles and applying the artificial bee colony method, the similaritydetection engine is able to find similar users based on the minimum contextual information reportedin their profiles. The comparison between the ABC and a K-means clustering method shows that thequality of the clustering is increased by 9.3%, whilst the average time is decreased. The effectiveness ofstochastic algorithms is greatly dependent on the generation of the initial solutions. For every dataset,
ISPRS Int. J. Geo-Inf. 2020, 9, 519 25 of 28
algorithms performed their own effectiveness tests 30 times individually, each time with randomlygenerated initial solutions.
Although our system provides recommendations for five different areas simultaneously, we choseto evaluate the performance of our system in the area of movie recommendations for this paper.We compared the performance of the proposed recommender algorithm with two widely usedrecommender algorithms: the rating-based CF and the item-based CF. In comparison to thoseRSs, the precision and personalization levels of the proposed RS increased by four percent and4.5 percent respectively.
Although increasing the level of personalization would result in greater user satisfaction, findingan increased number of similar users would be more arduous. As a result, when the numberof recommended items increases, the performance of the proposed algorithm would be affected.Thus, proposing a suitable level of personalization related to the number of required recommendationitems will be a challenging topic for future studies on context-aware RS. For this study, the simplestuser-related contextual information (e.g., time, location, and user activity) is extracted. However, byadding more complex rules to the context reasoning engine, it is possible to infer more complicatedcontextual information. Association rules between the users and their respective dynamic informationfrom their smart devices can be mined; such rules provide learning capability for the system which inturn improves system reliability and robustness. As the quality of data provided by smart wearablesvaries depending on different manufacturers, improving the methods used in [2,3] on USDE and RSis on hold for future work. User privacy and data secrecy protection is another direction for futureresearch, especially in relation to user privacy in the cloud [67]. To apply the proposed recommendersystem to large scale and industry-ready products, a detailed scalable user privacy research needs tobe conducted especially on cloud and resource-constrained devices. Although privacy protection isout of the scope of this paper, we applied basic authentication and authorization security preservingtechniques and user ID anonymization in different aspects of the proposed RS. Investigation of allexisting security mechanisms to protect user privacy is also on hold for future work.
Author Contributions: This paper is part of a Ph.D. thesis written by Soroush Ojagh under the supervisionof Mohammad Reza Malek. Soroush Ojagh jointly designed and developed the architecture and conceptualmodel of the proposed recommendation system. He implemented the user similarity detection engine basedon social interactions and investigated experimental results. Mohammad Reza Malek conceived the main ideapresented in this paper. He contributed to the architecture design and reviewed experimental results. Sara Saeedidesigned, developed, and investigated the Artificial Bee Colony method in user profile clustering and contributedregarding experimental design. Soroush Ojagh took the lead in writing the manuscript. All authors providedcritical feedback and helped shape the research, analysis, and manuscript. Also, All authors have read and agreedto the published version of the manuscript.
Funding: This research was supported by the K.N.Toosi University of Technology, grant number 107/1292, and inpart by the GeoSensorWeb Lab at the University of Calgary.
Acknowledgments: The authors would like to acknowledge Steve Liang, director of the GeoSensorWeb lab at theUniversity of Calgary for supporting this research, providing guidance and constructive comments while SoroushOjagh was at the GeoSensorWeb Lab as a visiting Ph.D. student.
Conflicts of Interest: The authors declare no conflict of interest.
References
1. Roopa, M.; Pattar, S.; Buyya, R.; Venugopal, K.R.; Iyengar, S.; Patnaik, L. Social Internet of Things (SIoT):Foundations, thrust areas, systematic review and future directions. Comput. Commun. 2019, 139, 32–57.
2. Malek, M.R.; Frank, A.U. A mobile computing approach for navigation purposes. In International Symposiumon Web and Wireless Geographical Information Systems; Springer: Berlin/Heidelberg, Germany, 2006; pp. 123–134.
3. Mohammadi, N.; Malek, M. VGI and reference data correspondence based on location-orientation rotarydescriptor and segment matching. Trans. GIS 2015, 19, 619–639. [CrossRef]
4. Ursino, D.; Virgili, L. Humanizing IoT: Defining the Profile and the Reliability of a Thing in a Multi-IoTScenario. In Toward Social Internet of Things (SIoT): Enabling Technologies, Architectures and Applications;Springer: Cham, Switzerland, 2020; pp. 51–76.
ISPRS Int. J. Geo-Inf. 2020, 9, 519 26 of 28
5. Bao, J.; Zheng, Y.; Wilkie, D.; Mokbel, M. Recommendations in location-based social networks: A survey.GeoInformatica 2015, 19, 525–565. [CrossRef]
6. Erdeniz, S.P.; Menychtas, A.; Maglogiannis, I.; Felfernig, A.; Tran, T.N.T. Recommender systems for IoTenabled quantified-self applications. Evol. Syst. 2019, 11, 291–304. [CrossRef]
7. Raghuwanshi, S.K.; Pateriya, R. Recommendation Systems: Techniques, Challenges, Application, andEvaluation. In Soft Computing for Problem Solving; Springer: Singapore, 2019; pp. 151–164.
8. Shao, Y.; Xie, Y.-H. Research on cold-start problem of collaborative filtering algorithm. In Proceedings of the2019 3rd International Conference on Big Data Research, Paris, France, 27–29 November 2019; pp. 67–71.
9. Rodas-Silva, J.; Galindo, J.A.; García-Gutiérrez, J.; Benavides, D.J.I.A. Selection of software product lineimplementation components using recommender systems: An application to Wordpress. IEEE Access 2019,7, 69226–69245. [CrossRef]
10. Yang, D.; Zhang, D.; Yu, Z.; Yu, Z. Fine-grained preference-aware location search leveraging crowdsourceddigital footprints from LBSNs. In Proceedings of the 2013 ACM International Joint Conference on Pervasiveand Ubiquitous Computing, Zurich, Switzerland, 8–12 September 2013; pp. 479–488.
11. Serrat, O. Social network analysis. In Knowledge Solutions; Springer: Singapore, 2017; pp. 39–43.12. Zhang, Y.; Shi, Z.; Zuo, W.; Yue, L.; Liang, S.; Li, X.J.N. Joint Personalized Markov Chains with Social Network
Embedding for Cold-Start Recommendation. Neurocomputing 2019, 386, 208–220. [CrossRef]13. Zhang, J.; Peng, Q.; Sun, S.; Liu, C. Collaborative filtering recommendation algorithm based on user
preference derived from item domain features. Phys. A Stat. Mech. Appl. 2014, 396, 66–76. [CrossRef]14. Zhang, S.; Lv, Q. Hybrid EGU-based group event participation prediction in event-based social networks.
Knowl. Based Syst. 2018, 143, 19–29. [CrossRef]15. Khrouf, H.; Troncy, R. Hybrid event recommendation using linked data and user diversity. In Proceedings of
the 7th ACM Conference on Recommender Systems, Hong Kong, China, 12–16 October 2013; pp. 185–192.16. Ramirez-Garcia, X.; García-Valdez, M. Post-filtering for a restaurant context-aware recommender system. In
Recent Advances on Hybrid Approaches for Designing Intelligent Systems; Springer: Cham, Switzerland, 2014;pp. 695–707.
17. Xu, M.; Liu, S. Semantic-enhanced and Context-aware Hybrid Collaborative Filtering for EventRecommendation in Event-based Social Networks. IEEE Access 2019, 7, 17493–17502. [CrossRef]
18. Ojagh, S.; Malek, M.R.; Saeedi, S.; Liang, S. A location-based orientation-aware recommender system usingIoT smart devices and Social Networks. Future Gener. Comput. Syst. 2020, 108, 97–118. [CrossRef]
19. Hosseinpour, M.; Malek, M.R.; Claramunt, C. Socio-spatial influence maximization in location-based socialnetworks. Future Gener. Comput. Syst. 2019, 101, 304–314. [CrossRef]
20. Torrijos, S.; Bellogín, A.; Sánchez, P. Discovering Related Users in Location-Based Social Networks.In Proceedings of the User Modeling, Adaptation, and Personalization-28th International Conference,UMAP, Genoa, Italy, 12–18 July 2020; pp. 12–18.
21. Ravi, L.; Subramaniyaswamy, V.; Vijayakumar, V.; Chen, S.; Karmel, A.; Devarajan, M. Hybrid location-basedrecommender system for mobility and travel planning. Mob. Netw. Appl. 2019, 24, 1226–1239. [CrossRef]
22. Braunhofer, M.; Ricci, F. Context-aware recommender systems are information filtering and decision supportapplications that generate recommendations by exploiting context-dependent user preference data, such asratings augmented with the description of the contextual situation detected when the user experienced theitem. In fact, many contextual factors (e.g., weather, season, mood or companion) may potentially affect the.Inf. Technol. Tour. 2017, 17, 101–119.
23. Wu, W.; Zhao, J.; Zhang, C.; Meng, F.; Zhang, Z.; Zhang, Y.; Sun, Q. Improving performance oftensor-based context-aware recommenders using Bias Tensor Factorization with context feature auto-encoding.Knowl. Based Syst. 2017, 128, 71–77. [CrossRef]
24. Panniello, U.; Tuzhilin, A.; Gorgoglione, M. Comparing context-aware recommender systems in terms ofaccuracy and diversity. User Modeling UserAdapt. Interact. 2014, 24, 35–65. [CrossRef]
25. Adomavicius, G.; Tuzhilin, A. Context-aware recommender systems. In Recommender Systems Handbook;Springer: Boston, MA, USA, 2011; pp. 217–253.
26. Colombo-Mendoza, L.O.; Valencia-García, R.; Rodríguez-González, A.; Alor-Hernández, G.;Samper-Zapater, J.J. RecomMetz: A context-aware knowledge-based mobile recommender system formovie showtimes. Expert Syst. Appl. 2015, 42, 1202–1222. [CrossRef]
ISPRS Int. J. Geo-Inf. 2020, 9, 519 27 of 28
27. Eirinaki, M.; Gao, J.; Varlamis, I.; Tserpes, K. Recommender Systems for Large-Scale Social Networks: A Review ofChallenges and Solutions; Elsevier: Amsterdam, The Netherlands, 2018.
28. Liu, L. Services computing: From cloud services, mobile services to internet of services. IEEE Trans.Serv. Comput. 2016, 9, 661–663. [CrossRef]
29. Cui, Z.; Xu, X.; Xue, F.; Cai, X.; Cao, Y.; Zhang, W.; Chen, J. Personalized Recommendation System based onCollaborative Filtering for IoT Scenarios. IEEE Trans. Serv. Comput. 2020, 13, 685–695. [CrossRef]
30. Ahn, H.J. A new similarity measure for collaborative filtering to alleviate the new user cold-starting problem.Inf. Sci. 2008, 178, 37–51. [CrossRef]
31. Fernández-Tobías, I.; Cantador, I.; Tomeo, P.; Anelli, V.W.; Di Noia, T. Addressing the user cold startwith cross-domain collaborative filtering: Exploiting item metadata in matrix factorization. User ModelingUserAdapt. Interact. 2019, 29, 443–486. [CrossRef]
32. Akama, S.; Kudo, Y.; Murai, T. Neighbor Selection for User-Based Collaborative Filtering UsingCovering-Based Rough Sets. In Topics in Rough Set Theory; Springer: Cham, Switzerland, 2020; pp. 141–159.
33. Xue, F.; He, X.; Wang, X.; Xu, J.; Liu, K.; Hong, R. Deep item-based collaborative filtering for top-nrecommendation. ACM Trans. Inf. Syst. (TOIS) 2019, 37, 1–25. [CrossRef]
34. Amato, F.; Moscato, V.; Picariello, A.; Piccialli, F. SOS: A multimedia recommender System for Online Socialnetworks. Future Gener. Comput. Syst. 2017, 93, 914–9223. [CrossRef]
35. de Carvalho, L.C.; Rodrigues, F.; Oliveira, P. A Hybrid Recommendation Algorithm to Address the ColdStart Problem. In Proceedings of the International Conference on Hybrid Intelligent Systems; Springer: Cham,Switzerland, 2018; pp. 260–271.
36. Allioui, Y.E. A novel approach to solve the new user cold-start problem in recommender systems usingcollaborative filtering. Int. J. Sci. Eng. Res. 2017, 8, 273–281.
37. Chatzidimitris, T.; Gavalas, D.; Kasapakis, V.; Konstantopoulos, C.; Kypriadis, D.; Pantziou, G.;Zaroliagis, C.J.P.; Computing, U. A Location History-Aware Recommender System for Smart Retail Environments;Personal and Ubiquitous Computing: London, UK, 2020; pp. 1–12.
38. Herlocker, J.L.; Konstan, J.A.; Terveen, L.G.; Riedl, J.T. Evaluating collaborative filtering recommendersystems. ACM Trans. Inf. Syst. (TOIS) 2004, 22, 5–53. [CrossRef]
39. Harper, F.M.; Konstan, J.A. The MovieLens Datasets: History and Context. ACM Trans. Interact. Intell. Syst.2015, 5, 1–19. [CrossRef]
40. Yu, X.; Pan, A.; Tang, L.-A.; Li, Z.; Han, J. Geo-friends recommendation in gps-based cyber-physical socialnetwork. In Proceedings of the 2011 International Conference on Advances in Social Networks Analysis andMining, Kaohsiung, Taiwan, 25–27 July 2011; pp. 361–368.
41. Xiao, X.; Zheng, Y.; Luo, Q.; Xie, X. Inferring social ties between users with human location history. J. AmbientIntell. Humaniz. Comput. 2014, 5, 3–19. [CrossRef]
42. Adomavicius, G.; Sankaranarayanan, R.; Sen, S.; Tuzhilin, A. Incorporating contextual information inrecommender systems using a multidimensional approach. ACM Trans. Inf. Syst. (TOIS) 2005, 23, 103–145.[CrossRef]
43. Saeedi, S.; Moussa, A.; El-Sheimy, N. Context-aware personal navigation using embedded sensor fusion insmartphones. Sensors 2014, 14, 5742–5767. [CrossRef]
44. Alfred, V. Algorithms for finding patterns in strings. Algorithms Complex. 2014, 1, 255.45. Nusret Bulus, H.; Uzun, E.; Doruk, A. Comparison of String Matching Algorithms in Web Documents.
In Proceedings of the 2017 International Scientific, Gabrovo, Bulgaria, 17–18 November 2017; Volume 2,pp. 279–282.
46. Pandiselvam, P.; Marimuthu, T.; Lawrance, R. A Comparative Study on String Matching Algorithm ofBiological Sequences. In Proceedings of the International Conference on Intelligent Computing, Taiyuan,China, 3–6 August 2014.
47. Ehatisham-ul-Haq, M.; Azam, M.A.; Naeem, U.; Amin, Y.; Loo, J. Continuous authentication of smartphoneusers based on activity pattern recognition using passive mobile sensing. J. Netw. Comput. Appl. 2018, 109,24–35. [CrossRef]
48. Elsesser, K.; Peplau, L.A. The glass partition: Obstacles to cross-sex friendships at work. Hum. Relat. 2006,59, 1077–1100. [CrossRef]
49. Kar, S.S.; Ramalingam, A. Is 30 the magic number? Issues in sample size estimation. Natl. J. Community Med.2013, 4, 175–179.
ISPRS Int. J. Geo-Inf. 2020, 9, 519 28 of 28
50. Kameshwaran, K.; Malarvizhi, K. Survey on clustering techniques in data mining. Int. J. Comput. Sci.Inf. Technol. 2014, 5, 2272–2276.
51. Abraham, A.; Grosan, C.; Ramos, V. Swarm Intelligence in Data Mining (Studies in Computational Intelligence);Springer: Berlin/Heidelberg, Germany, 2006; Volume 34.
52. Katarya, R. Movie recommender system with metaheuristic artificial bee. Neural Comput. Appl. 2018, 30,1983–1990. [CrossRef]
53. Saeedi, S.; Samadzadegan, F.; El-Sheimy, N. Object extraction from lidar data using an artificial swarm beecolony clustering algorithm. CMRT09 IAPRS 2009, 38, 133–138.
54. Zhongzhi, S. A clustering algorithm based on swarm intelligence. In Proceedings of the Info-tech andInfo-net, 2001. ICII 2001-Beijing. 2001 International Conferences, Beijing, China, 29 October–01 November2001; pp. 58–66.
55. Pham, D.T.; Ghanbarzadeh, A.; Koç, E.; Otri, S.; Rahim, S.; Zaidi, M. The Bees Algorithm—A Novel Toolfor Complex Optimisation Problems. In Intelligent Production Machines Systems; Elsevier: Amsterdam,The Netherlands, 2006; pp. 454–459.
56. Paterlini, S.; Krink, T. Differential evolution and particle swarm optimisation in partitional clustering.Comput. Stat. Data Anal. 2006, 50, 1220–1247. [CrossRef]
57. Roy, A.; Tavana, M.; Banerjee, S.; Caprio, D.D. A secured context-aware tourism recommender system usingartificial bee colony and simulated annealing. Int. J. Appl. Manag. Sci. 2016, 8, 93–113. [CrossRef]
58. Gao, W. Improved ant colony clustering algorithm and its performance study. Comput. Intell. Neurosci. 2016,2016, 1–14. [CrossRef]
59. Zhou, T.; Su, R.Q.; Liu, R.R.; Jiang, L.L.; Wang, B.H.; Zhang, Y.C. Accurate and diverse recommendations viaeliminating redundant correlations. New J. Phys. 2009, 11, 123008. [CrossRef]
60. Han, J.; Pei, J.; Kamber, M. Data Mining: Concepts and Techniques; Elsevier: Amsterdam, The Netherlands, 2011.61. Facebook. Facebook for Developers, Graph API. Available online: https://developers.facebook.com/docs/
graph-api/overview (accessed on 1 March 2020).62. IMDB. IMBD Datasets. Available online: https://www.imdb.com/interfaces/ (accessed on 1 June 2020).63. Goldberg, K.; Roeder, T.; Gupta, D.; Perkins, C. Eigentaste: A constant time collaborative filtering algorithm.
Inf. Retr. 2001, 4, 133–151. [CrossRef]64. Salam Patrous, Z.; Najafi, S. Evaluating Prediction Accuracy for Collaborative Filtering Algorithms in Recommender
Systems; KTH Royal Institute of Technology: Stockholm, Sweden, 2016.65. Refaeilzadeh, P.; Tang, L.; Liu, H. Cross-validation. In Encyclopedia of Database Systems; Springer: New York,
NY, USA, 2009; pp. 532–538.66. Ignatov, D.I.; Poelmans, J.; Dedene, G.; Viaene, S. A new cross-validation technique to evaluate quality of
recommender systems. In Perception and Machine Intelligence; Springer: Berlin/Heidelberg, Germany, 2012;pp. 195–202.
67. Au, M.H.; Liang, K.; Liu, J.K.; Lu, R.; Ning, J. Privacy-preserving personal data operation on mobilecloud—Chances and challenges over advanced persistent threat. Future Gener. Comput. Syst. 2018, 79,337–349. [CrossRef]
© 2020 by the authors. Licensee MDPI, Basel, Switzerland. This article is an open accessarticle distributed under the terms and conditions of the Creative Commons Attribution(CC BY) license (http://creativecommons.org/licenses/by/4.0/).