a standardised method for interpreting the association ... · a standardised method for...
TRANSCRIPT
A standardised method for interpretingthe association between mutations andphenotypic drug resistance inMycobacterium tuberculosis
Paolo Miotto 1, Belay Tessema2, Elisa Tagliani1, Leonid Chindelevitch3,Angela M. Starks4, Claudia Emerson5, Debra Hanna6, Peter S. Kim7,Richard Liwski6, Matteo Zignol8, Christopher Gilpin8, Stefan Niemann9,10,Claudia M. Denkinger11, Joy Fleming12, Robin M. Warren13, Derrick Crook14,15,James Posey4, Sebastien Gagneux16,17, Sven Hoffner18,19, Camilla Rodrigues20,Iñaki Comas21,22,23, David M. Engelthaler24, Megan Murray25, David Alland26,Leen Rigouts27, Christoph Lange28,29,30,31, Keertan Dheda32, Rumina Hasan33,Uma Devi K. Ranganathan34, Ruth McNerney35, Matthew Ezewudo6,Daniela M. Cirillo1, Marco Schito6, Claudio U. Köser36 and Timothy C. Rodwell11,37
@ERSpublicationsA comprehensive basis for interpreting mutations to predict antibiotic resistance in tuberculosishttp://ow.ly/hhwJ30g9jCY
Cite this article as: Miotto P, Tessema B, Tagliani E, et al. A standardised method for interpreting theassociation between mutations and phenotypic drug resistance in Mycobacterium tuberculosis. Eur Respir J2017; 50: 1701354 [https://doi.org/10.1183/13993003.01354-2017].
ABSTRACT A clear understanding of the genetic basis of antibiotic resistance in Mycobacteriumtuberculosis is required to accelerate the development of rapid drug susceptibility testing methods based ongenetic sequence.
Raw genotype–phenotype correlation data were extracted as part of a comprehensive systematic reviewto develop a standardised analytical approach for interpreting resistance associated mutations forrifampicin, isoniazid, ofloxacin/levofloxacin, moxifloxacin, amikacin, kanamycin, capreomycin,streptomycin, ethionamide/prothionamide and pyrazinamide. Mutation frequencies in resistant andsusceptible isolates were calculated, together with novel statistical measures to classify mutations as high,moderate, minimal or indeterminate confidence for predicting resistance.
We identified 286 confidence-graded mutations associated with resistance. Compared to phenotypicmethods, sensitivity (95% CI) for rifampicin was 90.3% (89.6–90.9%), while for isoniazid it was 78.2%(77.4–79.0%) and their specificities were 96.3% (95.7–96.8%) and 94.4% (93.1–95.5%), respectively. Forsecond-line drugs, sensitivity varied from 67.4% (64.1–70.6%) for capreomycin to 88.2% (85.1–90.9%) formoxifloxacin, with specificity ranging from 90.0% (87.1–92.5%) for moxifloxacin to 99.5% (99.0–99.8%)for amikacin.
This study provides a standardised and comprehensive approach for the interpretation of mutations aspredictors of M. tuberculosis drug-resistant phenotypes. These data have implications for the clinicalinterpretation of molecular diagnostics and next-generation sequencing as well as efficient individualisedtherapy for patients with drug-resistant tuberculosis.
Copyright ©ERS 2017. This ERJ Open article is open access and distributed under the terms of the Creative CommonsAttribution Licence 4.0.
https://doi.org/10.1183/13993003.01354-2017 Eur Respir J 2017; 50: 1701354
| ORIGINAL ARTICLETUBERCULOSIS

Affiliations: 1Emerging Bacterial Pathogens Unit, IRCCS San Raffaele Scientific Institute, Milan, Italy.2Department of Medical Microbiology, University of Gondar, Gondar, Ethiopia. 3School of Computing Science,Simon Fraser University, Burnaby, BC, Canada. 4Division of Tuberculosis Elimination, National Center for HIV/AIDS, Viral Hepatitis, STD, and TB Prevention, Centers for Disease Control and Prevention, Atlanta, GA, USA.5Institute on Ethics & Policy for Innovation, Department of Philosophy, McMaster University, Hamilton, ON,Canada. 6Critical Path Institute, Tucson, AZ, USA. 7Office of AIDS Research, National Institutes of Health,Rockville, MD, USA. 8Global Tuberculosis Programme, World Health Organization, Geneva, Switzerland.9Molecular and Experimental Mycobacteriology, Priority Area Infections, Research Center Borstel, Borstel,Germany. 10German Center for Infection Research, Borstel, Germany. 11Foundation for Innovative NewDiagnostics, Campus Biotech, Geneva, Switzerland. 12Key Laboratory of RNA Biology, Institute of Biophysics,Chinese Academy of Sciences, Beijing, China. 13DST/NRF Centre of Excellence for Biomedical TuberculosisResearch/SAMRC Centre for Tuberculosis Research, Division of Molecular Biology and Human Genetics,Faculty of Medicine and Health Sciences, Stellenbosch University, Stellenbosch, South Africa. 14NuffieldDepartment of Medicine, John Radcliffe Hospital, University of Oxford, Oxford, UK. 15National InfectionService, Public Health England, London, UK. 16Swiss Tropical and Public Health Institute, Basel, Switzerland.17University of Basel, Basel, Switzerland. 18Microbiology, Tumour and Cell Biology, Karolinska Institute,Stockholm, Sweden. 19Public Health Agency of Sweden, Solna, Sweden. 20Hinduja Hospital, Veer SavarkarMarg, Mumbai, India. 21Tuberculosis Genomics Unit, Biomedicine Institute of Valencia (IBV-CSIC), Valencia,Spain. 22Foundation for the Promotion of Health and Biomedical Research in the Valencian Community(FISABIO), Valencia, Spain. 23CIBER (Centros de Investigación Biomédica en Red) in Epidemiology and PublicHealth, Madrid, Spain. 24Translational Genomics Research Institute, Flagstaff, AZ, USA. 25Harvard School ofPublic Health, Department of Epidemiology, Boston, MA, USA. 26Center for Emerging Pathogens, Rutgers-New Jersey Medical School, Newark, NJ, USA. 27Department of Biomedical Sciences, Institute of TropicalMedicine, Antwerp, Belgium. 28Division of Clinical Infectious Diseases and German Center for InfectionResearch Tuberculosis Unit, Research Center Borstel, Borstel, Germany. 29International Health/InfectiousDiseases, University of Lübeck, Lübeck, Germany. 30Department of Medicine, Karolinska Institute, Stockholm,Sweden. 31Department of Internal Medicine, University of Namibia School of Medicine, Windhoek, Namibia.32Lung Infection and Immunity Unit, Department of Medicine, Division of Pulmonology and UCT Lung Institute,University of Cape Town, Groote Schuur Hospital, Cape Town, South Africa. 33Department of Pathology andLaboratory Medicine, Aga Khan University, Karachi, Pakistan. 34National Institute for Research in Tuberculosis(ICMR), No 1, Chennai, India. 35Department of Medicine, Division of Pulmonology, University of Cape Town,Groote Schuur Hospital, Cape Town, South Africa. 36Department of Genetics, University of Cambridge,Cambridge, UK. 37Department of Medicine, University of California, San Diego, CA, USA.
Correspondence: Paolo Miotto, Emerging Bacterial Pathogens Unit, Division of Immunology, Transplantation andInfectious Diseases, IRCCS Ospedale San Raffaele, Via Olgettina 58, 20132 Milan, Italy. E-mail: [email protected]
IntroductionIn 2015, only 20% of the 580000 people eligible for multidrug-resistant tuberculosis (MDR-TB) treatmentreceived an appropriate drug regimen [1]. Treatment of MDR-TB is long, expensive and toxic; errors inthe design of the regimen are associated with increased rates of failure and death [2, 3]. Drug-resistanttuberculosis regimens need to include a sufficient number of effective drugs, a significant challenge forclinicians worldwide, as most are forced to make therapy decisions without any drug susceptibility testing(DST) information. Additionally, the World Health Organization (WHO) policy guidance for the use ofnovel antituberculosis drugs (bedaquiline and delamanid) and newly developed shorter regimens for thetreatment of drug-resistant TB requires rapid diagnosis and triaging of patients to identify those who aremost likely to benefit from the new treatment options [4–8]. Phenotypic DST is not suitable for thispurpose, as it takes weeks to complete due to the slow growth rate of Mycobacterium tuberculosis complex(MTBC) strains, and requires both expensive infrastructure and considerable technical expertise [9]. Astargeted genotypic DST assays (that provide results within hours to days) have been shown to be accurate,
This article has supplementary material available from erj.ersjournals.com
Received: July 06 2017 | Accepted after revision: Oct 13 2017
Use of trade names is for identification only and does not constitute endorsement by the US Department of Health andHuman Services, the US Public Health Service, or the Centers for Disease Control and Prevention. The findings andconclusions in this report are those of the authors and do not necessarily represent the views of the funding agency.
Support statement: This study was supported by the Bill and Melinda Gates Foundation under grant agreement FINDOPP1115209 to address how to score mutations in the ReSeqTB data sharing platform initiative. The funder of thestudy had no role in study design, data collection, data analysis, data interpretation, or writing of the report. K. Dheda issupported by the South African MRC and the EDCTP. I. Comas is supported by the Ministerio de Economía yCompetitividad (Spanish Government) research grant SAF2016–77346-R and the European Research Council (ERC)(638553-TB-ACCELERATE). L. Chindelevitch is supported by a Sloan Fellowship. S. Niemann is supported by grants ofthe German Center for Infection Research. Funding information for this article has been deposited with the CrossrefFunder Registry.
Conflict of interest: Disclosures can be found alongside this article at erj.ersjournals.com
https://doi.org/10.1183/13993003.01354-2017 2
TUBERCULOSIS | P. MIOTTO ET AL.

increasingly automated and cost-effective, they are proving to be a viable alternative or effectivecomplement to phenotypic DST [9]. However, continuing technical constraints of the current molecularassays restrict the number of resistance determinants and genomic regions that can be evaluated, whichlimit the clinical value of the assays. By contrast, whole-genome sequencing (WGS) has the potential toprovide near-complete information as it includes almost the entire genetic repertoire of a given clinicalMTBC strain. However, the data analysis is more complex, and in order to maximise clinical utility ofWGS, healthcare workers need clear rules to interpret the clinical relevance of genetic changes that aredetected [10]. A high-quality and comprehensive catalogue of genetic markers of resistance (i.e. mutationsthat either cause resistance or compensate for resistance) is needed to distinguish significant resistantvariants from those that are not. For some drugs this requires a precise understanding of the level ofresistance conferred by the mutation in question, which is expressed as a range of minimum inhibitoryconcentrations (MICs) found in strains harbouring a specific mutation, as well as an understanding of thedegree of cross-resistance conferred for antibiotics with shared modes of action [11, 12]. Although in vitroallelic exchange experiments prove conclusively that a particular mutation is both necessary and sufficientto confer phenotypic resistance, these approaches are expensive, slow and technically demanding, and theyare only suitable to investigate the function of novel resistance genes or, at best, a limited number ofresistance mutations per gene [13]. Consequently, in silico association studies are indispensable toinvestigate the vast majority of suspected resistance mutations, particularly in nonessential genes, wherehundreds of loss-of-function mutations can result in resistance [14].
Attempts have been made to combine disparate datasets to collect the necessary evidence for theseassociations. Unfortunately, most of these databases are not actively curated or lack significant clinicalmetadata [15]. Moreover, these databases focus mainly on collecting and presenting published data,leaving the final interpretation of the genotype–phenotype correlation to the user [16, 17]. Morefundamentally, there is no consensus regarding the threshold of evidence required to classify a mutation asa valid marker for phenotypic resistance.
TABLE 1 Overview of the data included in the study
Collected data Studies
Loci ofinterest
Totalisolates
Isolationtime frame
years
Countriesrepresented
Screened Included
Rifampicin (R) rpoB 13424 1999–2014 37 459 95Isoniazid (H) katG 11847 1992–2014 42 650 127
inhA-mabA 9407furA 361mshA 288
Ethionamide andprothionamide(ETO/PTO)
inhA-mabA 346ethA 181mshA 117
Ofloxacin (OFX) gyrA 5911 1991–2013 36 243 75gyrB 3078
Moxifloxacin (MFX) gyrA 1019gyrB 735
Levofloxacin (LFX) gyrA 449gyrB 218
Pyrazinamide (Z) pncA 4949 1990–2014 36 378 81Streptomycin (S) rpsL 3263 1985–2013 43 423 104
tap 0rrs 2598
whiB7 0gidB 812
Amikacin (AM) rrs 2105Capreomycin (CM) rrs 2533
tlyA 1854Kanamycin (KM) rrs 1727
eis 2029whiB7 56
Data are presented as n. Inclusion and exclusion criteria for individual studies are reported in onlinesupplementary material 2.
https://doi.org/10.1183/13993003.01354-2017 3
TUBERCULOSIS | P. MIOTTO ET AL.

In this study we 1) describe a standardised analytical approach for assessing and quantifying the strengthof the association of a particular mutation or group of mutations with phenotypic antibiotic resistance; 2)demonstrate how this approach can be used by applying it to data from the most comprehensivesystematic review of MTBC drug resistance mutations conducted to date; and 3) apply the resulting gradedmutation list to the interpretation guidelines for the WHO-endorsed, targeted genotypic DST assays HainGenoType MTBDRplus v2.0 and MTBDRsl v2.0 [9]. This study has implications for the clinicalinterpretation of both targeted molecular and WGS-based diagnostics for drug-resistant TB, and isintended to provide clarity and build confidence regarding the genetic basis of resistance in MTBC forboth molecular assay developers and the clinicians interpreting those assays.
Materials and methodsData collectionA systematic literature review on the association of sequencing and phenotypic DST data for MTBC wasundertaken for selected anti-TB drugs and resistance genes (table 1). Expert consensus from the globalReSeqTB Data Sharing Platform was utilised to define the loci with the highest likelihood of associationwith resistance, and the review was limited to those loci (online supplementary material 1) [18]. Acomprehensive search of the National Center for Biotechnology Information (NCBI) PubMed database forrelevant citations was performed; the list of search terms and the data collection form are available asonline supplementary material 2 and 3. The quality of the studies included was appraised using a modifiedQuality Assessment of Diagnostic Accuracy Studies (QUADAS)-2 tool (online supplementary material 4)[19]. The sensitivity and specificity of predicting phenotypic ofloxacin (OFX) and levofloxacin (LFX)resistance by sequencing were found to be independent of the phenotypic method used, whereas therewere substantial differences in specificity for moxifloxacin (MFX) resistance prediction, depending onwhether liquid or solid DST was used as the reference method (data not shown). Results for OFX and LFXfrom both testing methods were therefore pooled, whereas MFX results were analysed separately for eachDST method. To maximise the number of isolates studied and thus increase statistical power, results forethionamide (ETO) and prothionamide (PTO) were also pooled.
Development of a standardised methodology for the statistical validation of the association of amutation with resistanceAn expert, consensus-driven approach was used to develop a standardised procedure for grading drugresistance-associated mutations. The collated data were used to calculate the frequency of each mutation in
TABLE 2 Overview of proposed confidence levels for grading mutations associated withphenotypic resistance
Symbol LR+ and OR
p-value value
High (Hi) confidence for association with resistanceStrong association of the mutation with phenotypic drugresistance; sufficient evidence that the mutation confers or isstrongly associated with drug resistance
#• <0.05 >10
Moderate (Mo) confidence for association with resistanceModerate association of the mutation with phenotypic drug resistance;additional data desirable for improved evidence that the mutationconfers or is strongly associated with drug resistance
#• <0.05 5< … ⩽10
Minimal (Mi) confidence for association with resistanceWeak association of the mutation with phenotypic drug resistance;inconclusive evidence that the mutation confers or is stronglyassociated with drug resistance. Substantial additional data required
#• <0.05 1< … ⩽5
No association with resistanceNo evidence of association between the mutation and drug resistance
#• <0.05 <1
IndeterminateNo statistically significant threshold reached; additional data required
Indeter ⩾0.05
The table shows the thresholds applied to likelihood ratios (LR) and odds ratios (OR) to grade theassociation of mutations with phenotypic drug resistance. LR+: positive likelihood ratio. “Additional data” isdefined as a requirement for 1) more phenotypically drug resistant and susceptible isolates tested with themutation in question; and/or 2) better understanding of the mechanism of drug resistance (e.g. toinvestigate epistasis, or the interactions between drug-resistance conferring mutations, lineage-specificgenetic factors and compensatory mutations [23, 24] or synergistic factors when more than one mutationis required to confer resistance [25]).
https://doi.org/10.1183/13993003.01354-2017 4
TUBERCULOSIS | P. MIOTTO ET AL.

resistant and susceptible MTBC isolates and to derive a likelihood ratio. In this approach, likelihood ratioswere used for objectively evaluating whether mutations were positively or negatively associated withphenotypic resistance. Moreover, odds ratios were considered when evaluating the association of thegenotypic and phenotypic data. Using this rationale, the thresholds commonly adopted in evidence-basedmedicine were adapted to grade the MTBC mutations [20–22]. Details of the statistical analysis areprovided in online supplementary material 5. Mutations were classified as having either high, moderate orminimal confidence for being associated with resistance, or as indeterminate or “not associated withresistance” (see table 2 for the definitions of each category). The procedure used for nonsense mutations,insertions/deletions and silent mutations is described in detail in online supplementary material 5. Resultsfrom the three types of phenotypic reference standards used (liquid, solid and combined-media DST) werecompared using a series of rules that are outlined in online supplementary material 5 to yield confidencevalues for individual mutations (“individual confidence values” (ICVs)), associations with a specificmedium (“medium confidence values” (MCVs)) and an overall, best confidence value (BCV). Moreover,interpretive confidence values for each of the aforementioned categories (i.e. iICVs, iMCVs and iBCV,respectively) were calculated to extrapolate the confidence values of individual mutations and the pooledresults for insertions/deletions and nonsense mutations.
Results were stratified according to the following reference standards for each target-drug combination,given that systematic differences between media have been observed previously. 1) Liquid-mediaphenotypic DST performed according to WHO guidelines; 2) solid-media phenotypic DST performedaccording to WHO guidelines (for pyrazinamide (Z), the Wayne enzymatic assay, which is notWHO-endorsed, was also considered in this category); and 3) liquid- and solid-media DST combined (thiscategory included DST results for which the medium used was unclear, which meant that the number inthis category was sometimes larger than the sum of categories 1 and 2).
ResultsOverview of the datasets included in the systematic reviewTable 1 summarises the main features of the datasets considered. Data from up to 43 countries and up to13424 isolates per gene locus or antimycobacterial drug were included. PRISMA (Preferred ReportingItems for Systematic Reviews and Meta-Analyses) diagrams for each drug and a detailed breakdown ofexclusion criteria, types of studies included, global representativeness of datasets and phenotypic DSTmethods can be found in online supplementary material 6.
The majority of the phenotypically resistant isolates harboured either single point mutations or, morerarely, insertions/deletions in the resistance genes/loci that were studied (mean 82.6%, range 69.8–95.6%;online supplementary material 6, figure S6.20A). Conversely, phenotypically susceptible isolates had mostlywild-type results (mean 85.6%, range 70.9–97.3%; online supplementary material 6, figure S6.20B).However, both frequencies probably represent an underestimate, given that some studies only reported thevariants that were thought to be responsible for the resistant phenotype. Well-known nonsynonymouspolymorphisms that do not confer resistance, such as katG R463L, or synonymous mutations were notalways reported [26] (online supplementary material 4).
Overview of confidence graded mutationsA full list of confidence values for associations of ICVs, MCVs or the overall BCVs and their correspondinginterpretative confidence values can be found in online supplementary material 7 and 9. Figure 1 provides anoverview of the proportion of isolates with different confidence levels for MCVs. For all drugs, data for themajority of variants were only available from one medium (solid or liquid). Where mutations were tested onboth media, the MCVs were usually identical. However, there were also variants, for which the confidence levelsdiffered (online supplementary material 9). The number of these discrepancies varied from just one variant fordrugs such as amikacin (AM), to 56 for pyrazinamide (Z). Some of these discrepancies were minor (e.g. thegyrA D94N variant had minimal confidence on solid medium for OFX/LFX, but high confidence for liquidmedium), whereas others were major. Important differences included 1) gyrA A90V, which was not associatedwith resistance when the phenotypic reference standard was liquid medium but had a high-confidence MCVfor MFX resistance when associated with phenotypic resistance determined in solid media; and 2) rpoB L511P,which was not associated with resistance in liquid medium, but had minimal confidence on solid medium. Inorder to be conservative in the interpretation of these cases, the lower statistical confidence was overruled by thehigher MCV to yield a BCV (see online supplementary material 5 for more details). Similarly, MCVs for whichevidence was available on one medium only were used as the BCVs.
Overview of BCVsTable 3 lists all of the 394 MTBC genetic variants with high, moderate (192 mutations plus 202 frameshiftsand premature stop codons) or minimal BCVs, as well as 40 changes that were found not to be associated
https://doi.org/10.1183/13993003.01354-2017 5
TUBERCULOSIS | P. MIOTTO ET AL.

with resistance according to nominal p-values (online supplementary material 5). Six of these variantsidentified with our association method had to be graded as not associated with phenotypic resistancemanually based on expert knowledge. For example, the a514c and c517t mutations in rrs hadhigh-confidence BCVs for predicting kanamycin (KM) resistance, but were excluded from further analysisbecause there was no known causative link between these mutations and KM resistance [27, 28]. Othermutations (e.g. inhA g-102a) were excluded as they are known markers for particular MTBC genotypes(lineage or sublineages) and do not confer resistance [26, 29]. We highlighted the 286 variants with high,moderate or minimal BCVs (111 mutations plus 150 frameshifts and 25 premature stop codons), as well as18 changes that were found to be “not associated” with resistance (likelihood ratio <1) that remainedstatistically significant after correcting the p-value for the false discovery rate (see online supplementarymaterial 5 for details). The resulting subset of 304 BCVs is referred to as the corrected BCVs forthe remainder of this article. Overall, we identified 286 confidence-graded (high + moderate + minimal(Hi+Mo+Mi)) mutations associated with phenotypic resistance.
Diagnostic performance of corrected iBCVsOnline supplementary material 10 provides a comprehensive overview of the performance characteristics(sensitivity, specificity and diagnostic accuracy) for different categories of corrected iBCVs (see onlinesupplementary material 5 for a detailed explanation of the differences between BCV and iBCV): 1) high,moderate and minimal confidence mutations individually; 2) Hi+Mo+Mi confidence mutations combined;3) indeterminate (I) mutations; and 4) a combination of Hi+Mo+Mi+I confidence mutations as well asmutations that are “not associated with phenotypic resistance” (referred herewith as “all mutations”).
The sensitivities (95% CI) of mutations with high-confidence corrected iBCVs compared with phenotypic DST(i.e. the observed resistant phenotype) ranged from 0.0% (0.0–0.01%) for ETO/PTO to 88.2% (85.1–90.9%) forMFX (figure 2a). Specificities (95% CI) varied from 95.6% (94.7–96.4%) for capreomycin (CM) to 99.5%(99.0–99.8%) for AM. The inclusion of Mo and Mo+Mi confidence mutations resulted in a gain in sensitivityof 0–47.3% with only marginal decreases in specificity (i.e. 0–3.8%). The performance of the Hi+Mo+Miconfidence mutations identified in this study performed as well or better than a set of diagnostic mutationsrecently proposed by FARHAT et al. [30] that were based on detecting resistance-associated mutations usingrandom forest modelling on a set of 1400 MTBC isolates (online supplementary material 11, table S11.1).
Assuming that mutations with high, moderate and minimal confidence corrected iBCVs are true markersor resistance, a “corrected phenotype” was calculated for each drug (i.e. the sum of the phenotypically
Concordant
Discrepant
Genetic variants:
27 7 5 9 1 3 7 1 2 56
47 62 16 33 5 10 0 30 0 265
Unique
Iso
late
s h
arb
ou
rin
g m
uta
tio
ns %
100
90
80
70
60
50
40
30
20
H (
so
lid
) -
ka
tG,
inh
A,
furA
, m
sh
A
R (
liq
uid
) -
rpo
B
R (
so
lid
) -
rpo
B
H (
liq
uid
) -
ka
tG,
inh
A,
furA
, m
sh
A
MF
X (
liq
uid
) -
gyr
A
MF
X (
so
lid
) -
gyr
A
OF
X/L
FX
(li
qu
id)
- g
yrA
, g
yrB
OF
X/L
FX
(so
lid
) -
gyr
A,
gyr
B
Drug–gene combinations
AM
(li
qu
id)
- rr
s
AM
(so
lid
) -
rrs
KM
(li
qu
id)
- rr
s,
eis
, w
hiB
7
KM
(so
lid
) -
rrs,
eis
, w
hiB
7
CM
(li
qu
id)
- rr
s,
tlyA
CM
(so
lid
) -
rrs,
tlyA
S (
liq
uid
) -
rpsL
, rr
s,
gid
B,
tap
, w
hiB
7
S (
so
lid
) -
rpsL
, rr
s,
gid
B,
tap
, w
hiB
7
ET
O/P
TO
(li
qu
id)
- in
hA
, e
thA
, m
sh
A
ET
O/P
TO
(so
lid
) -
inh
A,
eth
A,
msh
A
Z (
liq
uid
) -
pn
cA
Pza
se
(so
lid
) -
pn
cA
10
0
63 194 110 306 5 16 74 262 5 16 7 59 10 57 46 97 24 68 245 82
Not associated
Indeterminate
Minimal confidence
Moderate confidence
High confidence
FIGURE 1 Medium confidence values (MCVs) stratified by confidence value, drug susceptibility testing medium and antibiotic-resistance genecombination. In the three rows above the graph we show variants that were concordant on both media, the number of variants that had differentconfidence levels on liquid and solid (these are marked as “discrepant variants” and are listed in full in online supplementary material 9) andunique variants for which confidence levels were available on only one of the two media.
https://doi.org/10.1183/13993003.01354-2017 6
TUBERCULOSIS | P. MIOTTO ET AL.
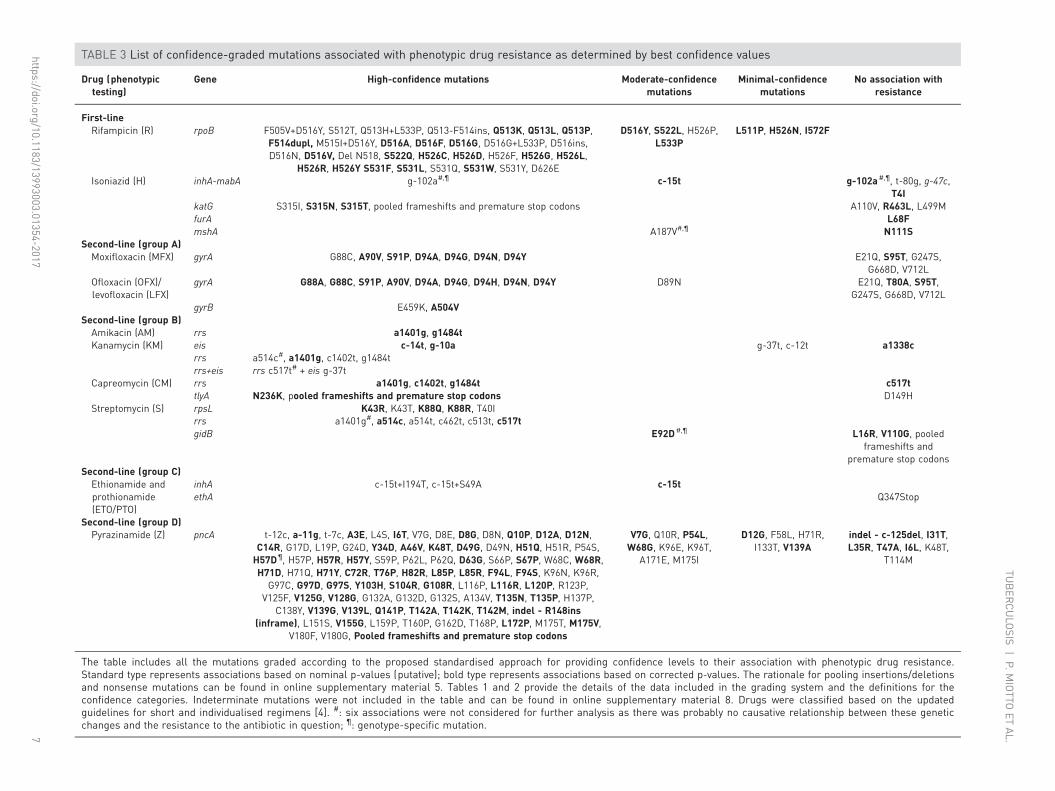
TABLE 3 List of confidence-graded mutations associated with phenotypic drug resistance as determined by best confidence values
Drug (phenotypictesting)
Gene High-confidence mutations Moderate-confidencemutations
Minimal-confidencemutations
No association withresistance
First-lineRifampicin (R) rpoB F505V+D516Y, S512T, Q513H+L533P, Q513-F514ins, Q513K, Q513L, Q513P,
F514dupl, M515I+D516Y, D516A, D516F, D516G, D516G+L533P, D516ins,D516N, D516V, Del N518, S522Q, H526C, H526D, H526F, H526G, H526L,
H526R, H526Y S531F, S531L, S531Q, S531W, S531Y, D626E
D516Y, S522L, H526P,L533P
L511P, H526N, I572F
Isoniazid (H) inhA-mabA g-102a#,¶ c-15t g-102a#,¶, t-80g, g-47c,T4I
katG S315I, S315N, S315T, pooled frameshifts and premature stop codons A110V, R463L, L499MfurA L68FmshA A187V#,¶ N111S
Second-line (group A)Moxifloxacin (MFX) gyrA G88C, A90V, S91P, D94A, D94G, D94N, D94Y E21Q, S95T, G247S,
G668D, V712LOfloxacin (OFX)/levofloxacin (LFX)
gyrA G88A, G88C, S91P, A90V, D94A, D94G, D94H, D94N, D94Y D89N E21Q, T80A, S95T,G247S, G668D, V712L
gyrB E459K, A504VSecond-line (group B)Amikacin (AM) rrs a1401g, g1484tKanamycin (KM) eis c-14t, g-10a g-37t, c-12t a1338c
rrs a514c#, a1401g, c1402t, g1484trrs+eis rrs c517t# + eis g-37t
Capreomycin (CM) rrs a1401g, c1402t, g1484t c517ttlyA N236K, pooled frameshifts and premature stop codons D149H
Streptomycin (S) rpsL K43R, K43T, K88Q, K88R, T40Irrs a1401g#, a514c, a514t, c462t, c513t, c517tgidB E92D#,¶ L16R, V110G, pooled
frameshifts andpremature stop codons
Second-line (group C)Ethionamide andprothionamide(ETO/PTO)
inhA c-15t+I194T, c-15t+S49A c-15tethA Q347Stop
Second-line (group D)Pyrazinamide (Z) pncA t-12c, a-11g, t-7c, A3E, L4S, I6T, V7G, D8E, D8G, D8N, Q10P, D12A, D12N,
C14R, G17D, L19P, G24D, Y34D, A46V, K48T, D49G, D49N, H51Q, H51R, P54S,H57D¶, H57P, H57R, H57Y, S59P, P62L, P62Q, D63G, S66P, S67P, W68C, W68R,H71D, H71Q, H71Y, C72R, T76P, H82R, L85P, L85R, F94L, F94S, K96N, K96R,
G97C, G97D, G97S, Y103H, S104R, G108R, L116P, L116R, L120P, R123P,V125F, V125G, V128G, G132A, G132D, G132S, A134V, T135N, T135P, H137P,
C138Y, V139G, V139L, Q141P, T142A, T142K, T142M, indel - R148ins(inframe), L151S, V155G, L159P, T160P, G162D, T168P, L172P, M175T, M175V,
V180F, V180G, Pooled frameshifts and premature stop codons
V7G, Q10R, P54L,W68G, K96E, K96T,
A171E, M175I
D12G, F58L, H71R,I133T, V139A
indel - c-125del, I31T,L35R, T47A, I6L, K48T,
T114M
The table includes all the mutations graded according to the proposed standardised approach for providing confidence levels to their association with phenotypic drug resistance.Standard type represents associations based on nominal p-values (putative); bold type represents associations based on corrected p-values. The rationale for pooling insertions/deletionsand nonsense mutations can be found in online supplementary material 5. Tables 1 and 2 provide the details of the data included in the grading system and the definitions for theconfidence categories. Indeterminate mutations were not included in the table and can be found in online supplementary material 8. Drugs were classified based on the updatedguidelines for short and individualised regimens [4]. #: six associations were not considered for further analysis as there was probably no causative relationship between these geneticchanges and the resistance to the antibiotic in question; ¶: genotype-specific mutation.
https://doi.org/10.1183/13993003.01354-20177
TUBER
CULO
SIS|P.M
IOTTO
ETAL.
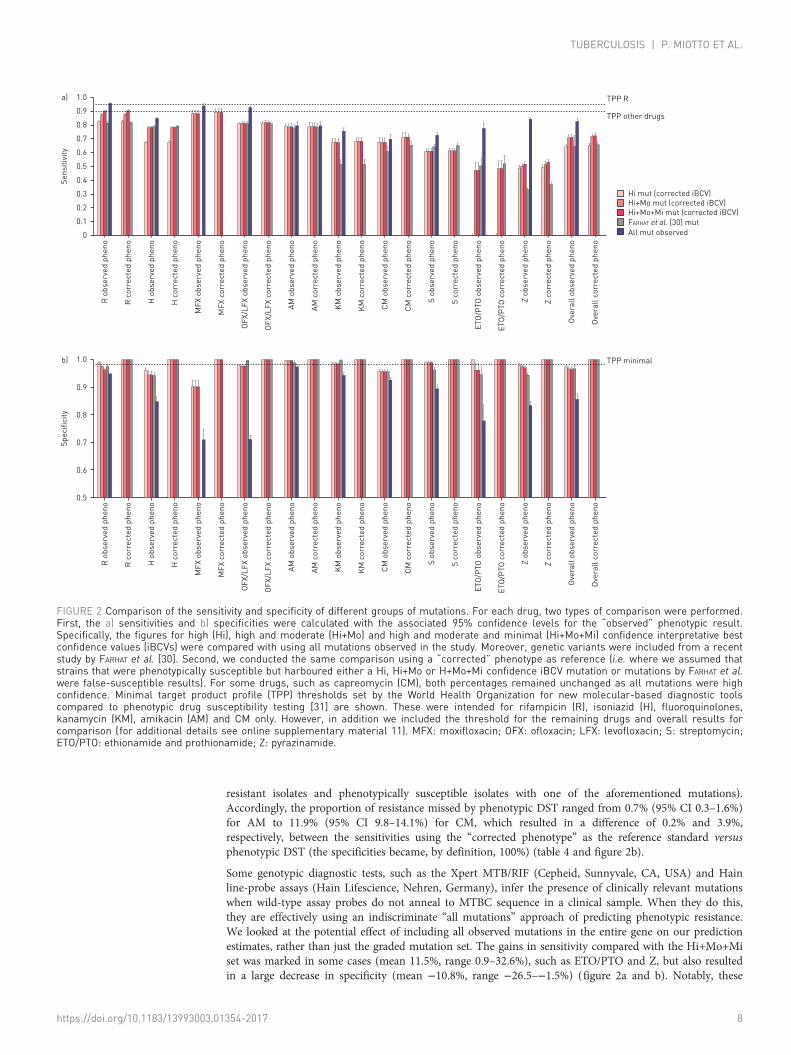
resistant isolates and phenotypically susceptible isolates with one of the aforementioned mutations).Accordingly, the proportion of resistance missed by phenotypic DST ranged from 0.7% (95% CI 0.3–1.6%)for AM to 11.9% (95% CI 9.8–14.1%) for CM, which resulted in a difference of 0.2% and 3.9%,respectively, between the sensitivities using the “corrected phenotype” as the reference standard versusphenotypic DST (the specificities became, by definition, 100%) (table 4 and figure 2b).
Some genotypic diagnostic tests, such as the Xpert MTB/RIF (Cepheid, Sunnyvale, CA, USA) and Hainline-probe assays (Hain Lifescience, Nehren, Germany), infer the presence of clinically relevant mutationswhen wild-type assay probes do not anneal to MTBC sequence in a clinical sample. When they do this,they are effectively using an indiscriminate “all mutations” approach of predicting phenotypic resistance.We looked at the potential effect of including all observed mutations in the entire gene on our predictionestimates, rather than just the graded mutation set. The gains in sensitivity compared with the Hi+Mo+Miset was marked in some cases (mean 11.5%, range 0.9–32.6%), such as ETO/PTO and Z, but also resultedin a large decrease in specificity (mean −10.8%, range −26.5–−1.5%) (figure 2a and b). Notably, these
TPP R
TPP other drugs
Se
nsit
ivit
y
1.0a)
b)
0.9
0.8
0.7
0.6
0.5
0.4
0.3
0.2
R o
bse
rve
d p
he
no
R c
orr
ecte
d p
he
no
H o
bse
rve
d p
he
no
H c
orr
ecte
d p
he
no
MF
X c
orr
ecte
d p
he
no
MF
X o
bse
rve
d p
he
no
OF
X/L
FX
co
rre
cte
d p
he
no
OF
X/L
FX
ob
se
rve
d p
he
no
AM
co
rre
cte
d p
he
no
AM
ob
se
rve
d p
he
no
KM
co
rre
cte
d p
he
no
KM
ob
se
rve
d p
he
no
CM
co
rre
cte
d p
he
no
CM
ob
se
rve
d p
he
no
S c
orr
ecte
d p
he
no
S o
bse
rve
d p
he
no
ET
O/P
TO
co
rre
cte
d p
he
no
ET
O/P
TO
ob
se
rve
d p
he
no
Z c
orr
ecte
d p
he
no
Z o
bse
rve
d p
he
no
Ove
rall
co
rre
cte
d p
he
no
Ove
rall
ob
se
rve
d p
he
no
0.1
0
Hi mut (corrected iBCV)
Hi+Mo mut (corrected iBCV)
Hi+Mo+Mi mut (corrected iBCV)
All mut observed
FARHAT et al. [30] mut
TPP minimal
Sp
ecifi
cit
y
1.0
0.9
0.8
0.7
0.6
0.5
R o
bse
rve
d p
he
no
R c
orr
ecte
d p
he
no
H o
bse
rve
d p
he
no
H c
orr
ecte
d p
he
no
MF
X c
orr
ecte
d p
he
no
MF
X o
bse
rve
d p
he
no
OF
X/L
FX
co
rre
cte
d p
he
no
OF
X/L
FX
ob
se
rve
d p
he
no
AM
co
rre
cte
d p
he
no
AM
ob
se
rve
d p
he
no
KM
co
rre
cte
d p
he
no
KM
ob
se
rve
d p
he
no
CM
co
rre
cte
d p
he
no
CM
ob
se
rve
d p
he
no
S c
orr
ecte
d p
he
no
S o
bse
rve
d p
he
no
ET
O/P
TO
co
rre
cte
d p
he
no
ET
O/P
TO
ob
se
rve
d p
he
no
Z c
orr
ecte
d p
he
no
Z o
bse
rve
d p
he
no
Ove
rall
co
rre
cte
d p
he
no
Ove
rall
ob
se
rve
d p
he
no
FIGURE 2 Comparison of the sensitivity and specificity of different groups of mutations. For each drug, two types of comparison were performed.First, the a) sensitivities and b) specificities were calculated with the associated 95% confidence levels for the “observed” phenotypic result.Specifically, the figures for high (Hi), high and moderate (Hi+Mo) and high and moderate and minimal (Hi+Mo+Mi) confidence interpretative bestconfidence values (iBCVs) were compared with using all mutations observed in the study. Moreover, genetic variants were included from a recentstudy by FARHAT et al. [30]. Second, we conducted the same comparison using a “corrected” phenotype as reference (i.e. where we assumed thatstrains that were phenotypically susceptible but harboured either a Hi, Hi+Mo or H+Mo+Mi confidence iBCV mutation or mutations by FARHAT et al.were false-susceptible results). For some drugs, such as capreomycin (CM), both percentages remained unchanged as all mutations were highconfidence. Minimal target product profile (TPP) thresholds set by the World Health Organization for new molecular-based diagnostic toolscompared to phenotypic drug susceptibility testing [31] are shown. These were intended for rifampicin (R), isoniazid (H), fluoroquinolones,kanamycin (KM), amikacin (AM) and CM only. However, in addition we included the threshold for the remaining drugs and overall results forcomparison (for additional details see online supplementary material 11). MFX: moxifloxacin; OFX: ofloxacin; LFX: levofloxacin; S: streptomycin;ETO/PTO: ethionamide and prothionamide; Z: pyrazinamide.
https://doi.org/10.1183/13993003.01354-2017 8
TUBERCULOSIS | P. MIOTTO ET AL.
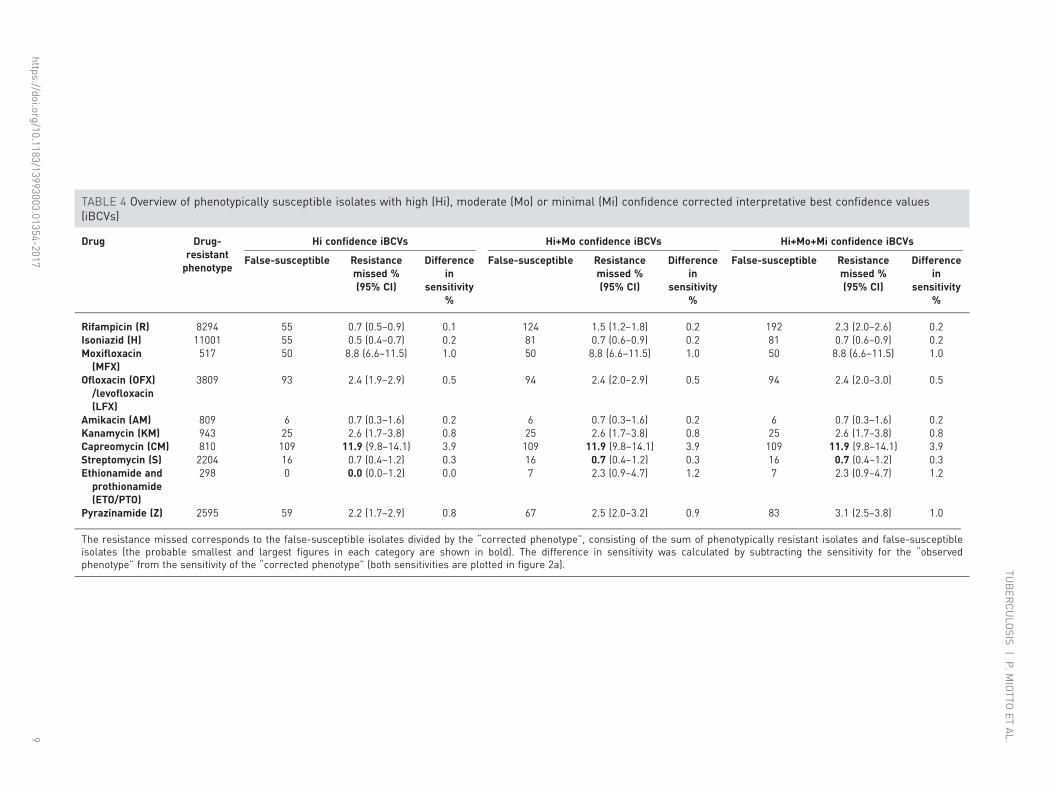
TABLE 4 Overview of phenotypically susceptible isolates with high (Hi), moderate (Mo) or minimal (Mi) confidence corrected interpretative best confidence values(iBCVs)
Drug Drug-resistantphenotype
Hi confidence iBCVs Hi+Mo confidence iBCVs Hi+Mo+Mi confidence iBCVs
False-susceptible Resistancemissed %(95% CI)
Differencein
sensitivity%
False-susceptible Resistancemissed %(95% CI)
Differencein
sensitivity%
False-susceptible Resistancemissed %(95% CI)
Differencein
sensitivity%
Rifampicin (R) 8294 55 0.7 (0.5–0.9) 0.1 124 1.5 (1.2–1.8) 0.2 192 2.3 (2.0–2.6) 0.2Isoniazid (H) 11001 55 0.5 (0.4–0.7) 0.2 81 0.7 (0.6–0.9) 0.2 81 0.7 (0.6–0.9) 0.2Moxifloxacin(MFX)
517 50 8.8 (6.6–11.5) 1.0 50 8.8 (6.6–11.5) 1.0 50 8.8 (6.6–11.5) 1.0
Ofloxacin (OFX)/levofloxacin(LFX)
3809 93 2.4 (1.9–2.9) 0.5 94 2.4 (2.0–2.9) 0.5 94 2.4 (2.0–3.0) 0.5
Amikacin (AM) 809 6 0.7 (0.3–1.6) 0.2 6 0.7 (0.3–1.6) 0.2 6 0.7 (0.3–1.6) 0.2Kanamycin (KM) 943 25 2.6 (1.7–3.8) 0.8 25 2.6 (1.7–3.8) 0.8 25 2.6 (1.7–3.8) 0.8Capreomycin (CM) 810 109 11.9 (9.8–14.1) 3.9 109 11.9 (9.8–14.1) 3.9 109 11.9 (9.8–14.1) 3.9Streptomycin (S) 2204 16 0.7 (0.4–1.2) 0.3 16 0.7 (0.4–1.2) 0.3 16 0.7 (0.4–1.2) 0.3Ethionamide andprothionamide(ETO/PTO)
298 0 0.0 (0.0–1.2) 0.0 7 2.3 (0.9–4.7) 1.2 7 2.3 (0.9–4.7) 1.2
Pyrazinamide (Z) 2595 59 2.2 (1.7–2.9) 0.8 67 2.5 (2.0–3.2) 0.9 83 3.1 (2.5–3.8) 1.0
The resistance missed corresponds to the false-susceptible isolates divided by the “corrected phenotype”, consisting of the sum of phenotypically resistant isolates and false-susceptibleisolates (the probable smallest and largest figures in each category are shown in bold). The difference in sensitivity was calculated by subtracting the sensitivity for the “observedphenotype” from the sensitivity of the “corrected phenotype” (both sensitivities are plotted in figure 2a).
https://doi.org/10.1183/13993003.01354-20179
TUBER
CULO
SIS|P.M
IOTTO
ETAL.
decreases in specificity were probably an underestimate, since synonymous mutations that can causesystematic false-resistance results were excluded from this study [32].
Assessment of the interpretation guidelines of the Hain GenoType MTBDRplus v2.0 andMTBDRsl v2.0Based on the package inserts of the Hain GenoType MTBDRplus v2.0, 32 mutations are identified asmutations that confer resistance to isoniazid (H) or rifampicin (R) [33]. 18 of these mutations had eitherhigh, moderate or minimal confidence iBCVs, whereas the remaining 14 where either indeterminate,occurred only in combination with other mutations or were not evaluated in this review (onlinesupplementary material 12, table S12.1). Of the 19 genetic markers identified as predictors of resistance tofluoroquinolones, KM, AM or CM, as defined by the package insert for the GenoType MTBDRsl v2.0[34], 10 mutations were found to be indeterminate in our study, were only found in combination withother mutations or were located in a region not considered for at least one antibiotic in this review (onlinesupplementary material 12, table S12.1).
DiscussionRapid evidence-based triaging of patients with drug resistant MTBC strains to appropriate drug-resistant TBtreatment regimens can only be achieved using genotypic DST methods. Yet, in practice, our understandingof the consequences of classifying patient MTBC strains as “resistant” based on the detection of certainmutations is biased by subjective methods and limited datasets. A case point is the rapid detection of Rresistance in clinical MTBC samples. This is now largely achieved using molecular tests, but the emergenceof data on discrepancies between genotypic and phenotypic DST, and some systematic false-positive resultshave created some uncertainty regarding the use of molecular data for early management of patients [35–39].Using an expert, consensus-driven approach, we developed and verified a standardised procedure to assessthe level of confidence in the association between individual mutations and clinically relevant phenotypicdrug resistance in MTBC. Our comprehensive approach provides clear, objective and quantitative estimatesof the correlation of genotype with phenotypic resistance that is consistent with methods previouslyestablished for evidence-based medicine. These findings have immediate implications for molecular andWGS diagnostic assays currently under development, as well as for the interpretation of existingcommercially available molecular DST assays. For example, to our knowledge, the eis c-2a mutation, which isinterpreted as conferring KM resistance in the package insert of the MTBDRsl v2.0 assay, has only ever beenobserved in two KM-resistant strains that also harbour the high-confidence eis c-14t mutation (onlinesupplementary material 12) [34, 40]. Consequently, there is currently no convincing evidence that the eisc-2a mutation alone is a valid marker for phenotypic KM resistance and the interpretation of the assayshould probably be changed to remove this mutation from consideration or require co-occurrence of the eisc-14t mutation for clinically relevant interpretation. This example illustrates the potential value of ourfindings to guide molecular diagnostics developers in terms of which mutations to include and exclude intheir assays and interpretation guides, as well as to help regulators evaluating manufacturer claims andclinicians to minimise systematic false-positive and false-negative results [32]. In addition, our resultsconfirmed previous findings that some potentially clinically relevant resistance mutations could besystematically overlooked if certain phenotypic methods are used for DST [35].
Likelihood ratios are not only useful in computing the (post-test) probability of a diagnosis, but can also beused to evaluate the association between a mutation and a given phenotype of interest, in this case drugresistance [20, 41]. Using likelihood ratio thresholds, we classified observed variants as high, moderate orminimal confidence resistance mutations (table 2). While likelihood ratios are commonly used to refineclinical judgements and pretest probabilities, they have not been used previously in this manner forpredicting phenotypic TB drug resistance. This approach has two main strengths. First, the likelihood ratio isa universal measure of association in diagnostics that is not affected by local or regional prevalence of drugresistance [42]. Second, unlike sensitivity and specificity, which are often used to assess resistance mutationsas predictors of phenotypic resistance, likelihood ratios do not lead to an exaggeration of the benefits of atest or the strength of an association [43], since they simply provide a multiplier for the pretest probability ofresistance. In particular, a high sensitivity and a high specificity do not ensure that the positive result of adiagnosis is correct if the underlying condition is exceedingly rare. However, the grading system actually doesnot take into account the uncertainty (95% confidence intervals) around the likelihood ratio estimate formutations that are positively associated with resistance. This means that mutations can be graded as highconfidence, despite having been observed in only few resistant isolates (e.g. the tlyA N236K mutation wasassigned a high confidence ICV despite occurring in just three resistant and one susceptible isolates; onlinesupplementary material S7). However, the confidence level in the grading of each mutation from this studymust necessarily be regarded as provisional, since it could change in either direction as more data areaccumulated. This is an inevitable attribute of any evidence-based approach, as any conclusion is open torevision when new evidence comes to light [44].
https://doi.org/10.1183/13993003.01354-2017 10
TUBERCULOSIS | P. MIOTTO ET AL.

Applying our grading scheme to a large, systematically collected set of MTBC sequencing and phenotypicdata, we were able to identify a total of 286 high, moderate and minimal confidence corrected BCVs(table 3). The resulting diagnostic sensitivities and specificities compared with phenotypic DST can befound in figure 2a and b.
The WHO has defined a specificity of ⩾98% and a sensitivity of >95% (for R) or >90% (for H,fluoroquinolones, KM, AM and CM) compared to phenotypic reference standards as a requirement fordiagnosing drug-resistant TB [31]. While the diagnostic sensitivities we observed in this study were lowerthan the WHO thresholds using only the graded mutations to predict resistant phenotypes, this is probablyan underestimate of maximum potential sensitivity of genotypic prediction of resistance due to acombination of five important limitations. First, and most fundamental, are the genes and mutationsconsidered. In this systematic review, we were limited to including only those genes and mutationspreviously documented to be associated with resistance and included in the published literature. While toour knowledge, our review is one of the most comprehensive yet completed, the global knowledge base on allgenes associated with resistance is still growing, and we know that certain genes, for example, ahpC were notincluded as potential predictors of H resistance. Additionally, not all studies included data on all knownresistance associated genes, which limited the sensitivity. Second, current sequencing technologies havevarying capabilities to detect low frequencies (<20%) of resistant strains mixed with susceptible stains relativeto phenotypic testing that can detect resistant strains making up only 1% of the total population [45]. Thiscan be a major source of discordance between the detected genotype (apparently wild-type) and a resistantphenotype for some drugs, particularly the fluoroquinolones [9]. Third, breakpoint artefacts (i.e.inappropriately high critical concentrations) can be a major source of misclassification of phenotypes. This iswell illustrated for CM, for which 11.9% (95% CI 9.8–14.1%) of strains harbouring markers of resistancewere missed by phenotypic DST (table 4) [28]. Fourth, the specific biology and genetics of some resistancemechanisms occasionally limited the sensitivity of our method. For resistance caused by loss-of-functionmutation in a nonessential gene (e.g. pncA), the number of different resistance mutations was very large and,consequently individual mutations were infrequent [11]. Our grading scheme scored such mutations asindeterminate until sufficient evidence can be gathered. Additionally, resistance mutations with MICdistributions that overlap substantially with the MIC distribution of susceptible strains are inherently difficultto distinguish from mutations not associated with resistance. This is because the MIC distributions of thesemutations are truncated by the CC, which means that a mutant strain will not consistently test resistant dueto the inherent variation in phenotypic testing. This phenomenon was most noticeable for the eis g-37t andc-12t mutations, which reduced confidence in the association and did not meet statistical significance for anassociation with KM resistance after the more conservative p-value correction was applied (table 3) [46].Fifth, synonymous mutations were excluded from this analysis because these are not reported routinely inassociation studies. However, it is known that these mutations can sometimes confer resistance [47, 48].
The specificities of the corrected iBCVs were usually superior to the sensitivities and would be 100% if anexpert rule was adopted for the genotype to overrule the phenotype whenever a high, moderate or minimalconfidence mutation was detected (figure 2a and b). This is especially relevant for mutations affected bybreakpoint artefacts, mutations that confer modest MIC increases, such as the “disputed” rpoB mutations[49], and drugs for which resistance is currently defined inconsistently on the phenotypic level. The latterpoint is best illustrated with the gyrA A90V mutation, which confers low-level resistance to MFX [50].Consequently, it has a high specificity as predictor of phenotypic resistance when the phenotypic standard isthe Clinical and Laboratory Standards Institute critical concentration of 0.5 mg·L−1 with 7H10, but not whenthe WHO critical concentration of 2 mg·L−1 on 7H10 medium is used as the reference [51]. Until criticalconcentrations are harmonised (which is particularly important for fluoroquinolones, where the evidence ismounting that strains with slightly elevated MICs might still be treatable [52]), and genotypic interpretationsadjusted accordingly, this mutation and related mutations will continue to pose diagnostic challenges.
Additional improvements to the graded mutation list could be implemented based on lessons learned fromlimitations of our study. Our study was limited by the fact that it mostly relied on amplicon-based sequencingdata, which meant that the underlying population structure could not be taken into account. If WGS data hadbeen available for all strains, resistance mutations that are currently classified as indeterminate or potentiallyeven as not associated with resistance because they only confer modest MIC increases, as was the case for eisg-37t and c-12t, could be identified as resistance associated by the virtue of them being homoplastic (i.e.arising in unrelated isolates independently [26]). Such observations could help focus future MIC testing and/or allelic exchange experiments to clarify their MIC ranges and confirm or refute an association withresistance [46]. Conversely, mutations that are not homoplastic, such as gidB E92D, that are known lineagemarkers for particular genotypes and not markers for resistance could be excluded [26]. However, even usingWGS, some manual curation based on an assessment of the mode of action of the antibiotic may still berequired to remove spurious associations, as was the case for the rrs a1401g mutation.
https://doi.org/10.1183/13993003.01354-2017 11
TUBERCULOSIS | P. MIOTTO ET AL.

The methods presented in this study will be used as a standardised analytical approach for assessingpotential resistance mutations in the Relational Sequencing TB Data Sharing Platform currently availableat https://platform.reseqtb.org/. The ReSeqTB platform serves as a globally harmonised knowledge base forthe curation, validation and interpretation of existing and newly created genotypic and phenotypic data forTB drug resistance correlations [18]. In this context, the grading system presented here will be refinedfurther by taking the following criteria into consideration: phylogenetic information, laboratory evidence(e.g. MIC values, epidemiological cut-offs and/or pharmacokinetics/pharmacodynamics-driven thresholds,biochemical assays and site-directed mutagenesis) and clinical evidence.
This study establishes the first confidence-graded list of mutations for predicting drug resistance, and assuch should serve as a gene target guide for developing new molecular diagnostics, and as a tool forsupporting the clinical interpretation of existing molecular diagnostics such as the Hain GenoType assays.Once incorporated into the ReSeqTB knowledge base, we expect the confidence-graded list of mutations toimprove in precision iteratively as data are accumulated, and it will be revised annually through an expertreview process similar to the methods established for the Stanford HIV Drug Resistance Database (https://hivdb.stanford.edu). This will be of particular value for the interpretation of WGS-based in vitrodiagnostics that are currently being piloted as decision support tools for rapid and comprehensivecharacterisation of clinically relevant resistance to guide individualised treatment regimens containing themost effective, least toxic drug combinations. Ultimately, we aim to provide a comprehensive and userfriendly tool to assist clinicians with the interpretation of resistance mutations in MTBC.
AcknowledgementsWe acknowledge Naomi Hillery (Health Services Research Center, Dept of Family Medicine and Public HealthUniversity of California, San Diego, CA, USA) for help with data management.
Author contributions were as follows. P. Miotto: literature search, study design, data collection, data analysis, datainterpretation, manuscript writing; C.U. Köser and T.C. Rodwell: study design, data interpretation, manuscript writing;L. Chindelevitch: study design, data analysis, data interpretation, manuscript writing; D.M. Cirillo, M. Schito andK. Dheda: study design, manuscript writing; B. Tessema and E. Tagliani: literature search, data collection, criticalrevision of manuscript; A.M. Starks, C. Emerson, D. Hanna, P.S. Kim, R. Liwski, M. Zignol, C. Gilpin, S. Niemann,C.M. Denkinger, J. Fleming, R.M. Warren, D. Crook, J. Posey, S. Gagneux, S. Hoffner, C. Rodrigues, I. Comas,D.M. Engelthaler, M. Murray, D. Alland, L. Rigouts, C. Lange, R. Hasan, U.D.K. Ranganathan, R. McNerney andM. Ezewudo: study design, critical revision of manuscript.
References1 World Health Organization. Global Tuberculosis Report 2016. Geneva, World Health Organization, 2016.2 Ahuja SD, Ashkin D, Avendano M, et al. Multidrug resistant pulmonary tuberculosis treatment regimens and
patient outcomes: an individual patient data meta-analysis of 9,153 patients. PLoS Med 2012; 9: e1001300.3 Migliori GB, Sotgiu G, Gandhi NR, et al. Drug resistance beyond extensively drug-resistant tuberculosis: individual
patient data meta-analysis. Eur Respir J 2013; 42: 169–179.4 Falzon D, Schünemann HJ, Harausz E, et al. World Health Organization treatment guidelines for drug-resistant
tuberculosis, 2016 update. Eur Respir J 2017; 49: 1602308.5 Borisov SE, Dheda K, Enwerem M, et al. Effectiveness and safety of bedaquiline-containing regimens in the
treatment of MDR- and XDR-TB: a multicentre study. Eur Respir J 2017; 49: 1700387.6 Tadolini M, Garcia-Prats AJ, D’Ambrosio L, et al. Compassionate use of new drugs in children and adolescents
with multidrug-resistant and extensively drug-resistant tuberculosis: early experiences and challenges. Eur Respir J2016; 48: 938–943.
7 Pontali E, Sotgiu G, D’Ambrosio L, et al. Bedaquiline and multidrug-resistant tuberculosis: a systematic andcritical analysis of the evidence. Eur Respir J 2016; 47: 394–402.
8 Pym AS, Diacon AH, Tang SJ, et al. Bedaquiline in the treatment of multidrug- and extensively drug-resistanttuberculosis. Eur Respir J 2016; 47: 564–574.
9 Schön T, Miotto P, Köser CU, et al. Mycobacterium tuberculosis drug-resistance testing: challenges, recentdevelopments and perspectives. Clin Microbiol Infect 2017; 23: 154–160.
10 Walker TM, Merker M, Kohl TA, et al. Whole genome sequencing for M/XDR tuberculosis surveillance and forresistance testing. Clin Microbiol Infect 2017; 23: 161–166.
11 Ellington MJ, Ekelund O, Aarestrup FM, et al. The role of whole genome sequencing in antimicrobialsusceptibility testing of bacteria: report from the EUCAST Subcommittee. Clin Microbiol Infect 2017; 23: 2–22.
12 Dheda K, Gumbo T, Maartens G, et al. The epidemiology, pathogenesis, transmission, diagnosis, and managementof multidrug-resistant, extensively drug-resistant, and incurable tuberculosis. Lancet Respir Med 2017; in press[https://doi.org/10.1016/S2213-2600(17)30079-6].
13 Nebenzahl-Guimaraes H, Jacobson KR, Farhat MR, et al. Systematic review of allelic exchange experiments aimedat identifying mutations that confer drug resistance in Mycobacterium tuberculosis. J Antimicrob Chemother 2014;69: 331–342.
14 Walker TM, Kohl TA, Omar SV, et al. Whole-genome sequencing for prediction of Mycobacterium tuberculosisdrug susceptibility and resistance: a retrospective cohort study. Lancet Infect Dis 2015; 15: 1193–1202.
15 Stucki D, Gagneux S. Single nucleotide polymorphisms in Mycobacterium tuberculosis and the need for a curateddatabase. Tuberculosis 2013; 93: 30–39.
16 Salamon H, Yamaguchi KD, Cirillo DM, et al. Integration of published information into a resistance-associatedmutation database for Mycobacterium tuberculosis. J Infect Dis 2015; 211: Suppl. 2, S50–S57.
https://doi.org/10.1183/13993003.01354-2017 12
TUBERCULOSIS | P. MIOTTO ET AL.

17 Phelan J, O’Sullivan DM, Machado D, et al. The variability and reproducibility of whole genome sequencingtechnology for detecting resistance to anti-tuberculous drugs. Genome Med 2016; 8: 132.
18 Starks AM, Avilés E, Cirillo DM, et al. Collaborative effort for a centralized worldwide tuberculosis relationalsequencing data platform. Clin Infect Dis 2015; 61: Suppl. 3, S141–S146.
19 Whiting PF, Rutjes AW, Westwood ME, et al. QUADAS-2: a revised tool for the quality assessment of diagnosticaccuracy studies. Ann Intern Med 2011; 155: 529–536.
20 Hayden SR, Brown MD. Likelihood ratio: a powerful tool for incorporating the results of a diagnostic test intoclinical decisionmaking. Ann Emerg Med 1999; 33: 575–580.
21 Goodman SN. Toward evidence-based medical statistics. 2: the Bayes factor. Ann Intern Med 1999; 130: 1005–1013.22 Brown MD, Reeves MJ. Evidence-based emergency medicine/skills for evidence-based emergency care. Interval
likelihood ratios: another advantage for the evidence-based diagnostician. Ann Emerg Med 2003; 42: 292–297.23 Borrell S, Gagneux S. Strain diversity, epistasis and the evolution of drug resistance in Mycobacterium tuberculosis.
Clin Microbiol Infect 2011; 17: 815–820.24 Köser CU, Bryant JM, Parkhill J, et al. Consequences of whiB7 (Rv3197A) mutations in Beijing genotype isolates
of the Mycobacterium tuberculosis complex. Antimicrob Agents Chemother 2013; 57: 3461.25 Fonseca JD, Knight GM, McHugh TD. The complex evolution of antibiotic resistance in Mycobacterium
tuberculosis. Int J Infect Dis 2015; 32: 94–100.26 Feuerriegel S, Köser CU, Niemann S. Phylogenetic polymorphisms in antibiotic resistance genes of the
Mycobacterium tuberculosis complex. J Antimicrob Chemother 2014; 69: 1205–1210.27 Sander P, Meier A, Böttger EC. Ribosomal drug resistance in mycobacteria. Res Microbiol 1996; 147: 59–67.28 Reeves AZ, Campbell PJ, Willby MJ, et al. Disparities in capreomycin resistance levels associated with the rrs
A1401G mutation in clinical isolates of Mycobacterium tuberculosis. Antimicrob Agents Chemother 2015; 59:444–449.
29 Coll F, McNerney R, Preston MD, et al. Rapid determination of anti-tuberculosis drug resistance fromwhole-genome sequences. Genome Med 2015; 7: 51.
30 Farhat MR, Sultana R, Iartchouk O, et al. Genetic determinants of drug resistance in Mycobacterium tuberculosisand their diagnostic value. Am J Respir Crit Care Med 2016; 194: 621–630.
31 World Health Organization. High-priority Target Product Profiles for New TB Diagnostics: Report of a ConsensusMeeting. Geneva, World Health Organization, 2014.
32 Ajileye A, Alvarez N, Merker M, et al. Some synonymous and nonsynonymous gyrA mutations in Mycobacteriumtuberculosis lead to systematic false-positive fluoroquinolone resistance results with the Hain GenoType MTBDRslassays. Antimicrob Agents Chemother 2017; 61: e02169-16.
33 Hain Lifescience. GenoType MTBDRplus ver 2.0. Instructions for Use. 2012.34 Hain Lifescience. GenoType MTBDRsl ver 2.0. Instructions for Use. 2015.35 Rigouts L, Gumusboga M, de Rijk WB, et al. Rifampin resistance missed in automated liquid culture system for
Mycobacterium tuberculosis isolates with specific rpoB mutations. J Clin Microbiol 2013; 51: 2641–2645.36 Kambli P, Ajbani K, Sadani M, et al. Correlating Minimum Inhibitory Concentrations of ofloxacin and
moxifloxacin with gyrA mutations using the genotype MTBDRsl assay. Tuberculosis 2015; 95: 137–141.37 Coeck N, de Jong BC, Diels M, et al. Correlation of different phenotypic drug susceptibility testing methods for
four fluoroquinolones in Mycobacterium tuberculosis. J Antimicrob Chemother 2016; 71: 1233–1240.38 Gonzalo X, Claxton P, Brown T, et al. True rifampicin resistance missed by the MGIT: prevalence of this pheno/
genotype in the UK and Ireland after 18 month surveillance. Clin Microbiol Infect 2017; 23: 260–263.39 Rahman A, Sahrin M, Afrin S, et al. Comparison of Xpert MTB/RIF assay and GenoType MTBDRplus DNA
probes for detection of mutations associated with rifampicin resistance in Mycobacterium tuberculosis. PLoS One2016; 11: e0152694.
40 Campbell PJ, Morlock GP, Sikes RD, et al. Molecular detection of mutations associated with first- and second-linedrug resistance compared with conventional drug susceptibility testing of Mycobacterium tuberculosis. AntimicrobAgents Chemother 2011; 55: 2032–2041.
41 Grimes DA, Schulz KF. Refining clinical diagnosis with likelihood ratios. Lancet 2005; 365: 1500–1505.42 Altman DG, Bland JM. Diagnostic tests 2: predictive values. BMJ 1994; 309: 102.43 Boyko EJ. Ruling out or ruling in disease with the most sensitive or specific diagnostic test: short cut or wrong
turn? Med Decis Making 1994; 14: 175–179.44 Rubin A, Bellamy J. Practitioner’s Guide to Using Research for Evidence-Based Practice. 2nd Edn. Chichester,
Wiley, 2012.45 Canetti G, Fox W, Khomenko A, et al. Advances in techniques of testing mycobacterial drug sensitivity, and the
use of sensitivity tests in tuberculosis control programmes. Bull World Health Organ 1969; 41: 21–43.46 Zaunbrecher MA, Sikes RD Jr, Metchock B, et al. Overexpression of the chromosomally encoded aminoglycoside
acetyltransferase eis confers kanamycin resistance in Mycobacterium tuberculosis. Proc Natl Acad Sci USA 2009;106: 20004–20009.
47 Ando H, Miyoshi-Akiyama T, Watanabe S, et al. A silent mutation in mabA confers isoniazid resistance onMycobacterium tuberculosis. Mol Microbiol 2014; 91: 538–547.
48 Safi H, Lingaraju S, Amin A, et al. Evolution of high-level ethambutol-resistant tuberculosis through interactingmutations in decaprenylphosphoryl-β-D-arabinose biosynthetic and utilization pathway genes. Nat Genet 2013; 45:1190–1197.
49 Van Deun A, Aung KJ, Bola V, et al. Rifampin drug resistance tests for tuberculosis: challenging the goldstandard. J Clin Microbiol 2013; 51: 2633–2640.
50 Willby M, Sikes RD, Malik S, et al. Correlation between GyrA substitutions and ofloxacin, levofloxacin, andmoxifloxacin cross-resistance in Mycobacterium tuberculosis. Antimicrob Agents Chemother 2015; 59: 5427–5434.
51 Clinical and Laboratory Standards Institute. M24-A2 Susceptibility Testing of Mycobacteria, Nocardiae, and OtherAerobic Actinomycetes; Approved Standard – Second Edition. Wayne, Clinical and Laboratory StandardsInstitute, 2011.
52 Rigouts L, Coeck N, Gumusboga M, et al. Specific gyrA gene mutations predict poor treatment outcome inMDR-TB. J Antimicrob Chemother 2016; 71: 314–323.
https://doi.org/10.1183/13993003.01354-2017 13
TUBERCULOSIS | P. MIOTTO ET AL.