a stellar population synthesis model for the study of ... · a stellar population synthesis model...
TRANSCRIPT

arX
iv:1
403.
2561
v1 [
astr
o-ph
.GA
] 11
Mar
201
4Astronomy & Astrophysicsmanuscript no. ms˙astro-ph c© ESO 2018June 4, 2018
A Stellar Population Synthesis Model for the Study of Ultrav ioletStar Counts of the Galaxy
Ananta C. Pradhan1, D. K. Ojha1, A. C. Robin2, S. K. Ghosh1,3, John J. Vickers⋆⋆4
1 Tata Institute of Fundamental Research, Homi Bhabha Road, Mumbai 400005, Indiae-mail:[email protected]
2 Institut Utinam, CNRS UMR 6213, OSU THETA, Universite de Franche-Comte, 41bis avenue de l’Observatoire 25000 Besanc¸on,France
3 National Centre for Radio Astrophysics, Tata Institute of Fundamental Research, Pune 411007, India4 Astronomisches Rechen-Institut, Zentrum fur Astronomieder Universitat Heidelberg, Monchhofstr, 12-14, 69120 Heidelberg,
Germany
ABSTRACT
Context. Galaxy Evolution Explorer (GALEX), the first all sky imagingultraviolet (UV) satellite, has imaged a large part of the skyproviding an excellent opportunity for studying UV star counts. Combining photometry from the different wavelengths in the infrared(from Wide-field Infrared Survey (WISE) and Two Micron All Sky Survey (2MASS)) to UV allows us to extract a real star catalogfrom the GALEX source catalog.Aims. The aim of our study is to investigate in detail the observed UV star counts obtained by GALEX vis-a-vis the model simulatedcatalogs produced by the Besancon model of stellar population synthesis in various Galactic directions, and to explore the potential forstudying the structure of our Galaxy from images in multiplenear-UV (NUV) and far-UV (FUV) filters of the forthcoming UltravioletImaging Telescope (UVIT) to be flown onboard ASTROSAT.Methods. We have upgraded the Besancon model of stellar population synthesis to include the UV bands of GALEX and UVIT.Depending on the availability of contiguous GALEX, Sloan Digital Sky Survey (SDSS), WISE and 2MASS overlapping regions, wehave chosen a set of nineteen GALEX fields which spread over a range of Galactic directions. We selected a sample of objectsfromthe GALEX database using theCASjobs interface and then cross-matched them with the WISE+2MASS and SDSS catalogs. UVstars in the GALEX catalog are identified by choosing a suitable infrared (IR) colour,J −W1 (W1 is a WISE band at 3.4µm), whichcorresponds to a temperature range from 1650 K to 65000 K. TheIR colour cut method, which is used for the first time for separationof stars, is discussed in comparison with the GALEX+SDSS star counts method.Results. We present the results of the UV star counts analysis carriedout using the data from GALEX. We find that the Besanconmodel simulations represent the observed star counts of both the GALEX All-sky Imaging Survey (AIS) and Medium Imaging Survey(MIS) well within the error bars in various Galactic directions. Based on the model analysis, we separated out white dwarfs (WDs) ofthe disc and blue horizontal branch stars (BHBs) of the halo from the observed sample by selecting a suitableFUV − NUV colour.Conclusions. The Besancon model is now ready for further comparisons in the UV domain and will be used for prospective studiesfor the UVIT instrument to be flown onboard ASTROSAT.
Key words. Stars: general - Ultraviolet: stars - Galaxy: disc - Galaxy:stellar content - Galaxy: halo
1. Introduction
The Milky Way is the best studied Galaxy in the universe; itsstructure and evolution have been studied by a variety of tech-niques. In the early 20th century, Kapteyn (1922) first stud-ied the geometrical structure of the Galaxy using the starcounts method whereby he counted stars on the photographicplates in selected areas of the sky. Since then the star countsmethod has been used as one of the preferred methods toconstrain the structural parameters of the Galaxy effectively.Several reviews (Bahcall 1986; Freeman 1987; Gilmore et al.1988; Majewski 1993; Helmi 2008; Ivezic et al. 2012) havediscussed the connection of star counts to the Galactic struc-ture. The advent of instruments with better resolution andgreater sensitivity have enabled us to obtain photometric ob-servations covering large parts of the sky in several wavelengthbands. The population synthesis models of the Milky Way arewell supported by these observations in predicting the differ-ent structural parameters of the Galaxy, such as stellar densi-
ties, scale length, scale height, etc. Among the models builtto understand the Galactic structure by star counting method,one can cite: Bahcall & Soneira (1980), Gilmore & Reid (1983),Robin & Creze (1986), Robin et al. (2003), Girardi et al. (2005)and Juric et al. (2008). However, the above Galaxy models arepredominantly based on the visible and IR photometric surveys.Very few attempts (Brosch 1991; Cohen et al. 1994) had beenmade to study the star counts in UV prior to GALEX due to alack of availability of UV photometric surveys. The advent ofGALEX, which provided a wide sky coverage in UV, now al-lows new analysis of the UV sky (Xu et al. 2005; Bianchi et al.2011a,b, 2013, among others). An attempt has also been madeto predict the star counts in the X-ray band (Guillout et al. 1996)by extending the Besancon model of stellar population synthesis(Robin & Creze 1986) to the ROSAT PSPC energy bands.
Indeed, the UV surveys, among others, could help in trac-ing the spiral structures which mainly contain very young stars.The UV surveys also help in constraining the shape of the ini-
1
Pradhan et al.: A Model for the UV Star Counts of the Galaxy
tial mass function (IMF) towards the high-mass star end as wellas elucidating the recent star formation history. Moreover, theyalso trace very blue populations such as WDs and BHBs deepin the halo population, which in turn trace the streams and relicsof ancient accretion in the Milky Way halo. GALEX has cov-ered a large part of the sky which provides an opportunity toexplore and characterize these hot sources in the FUV (1344 -1786 Å,λeff = 1538.6 Å) and NUV (1771 - 2831 Å,λeff = 2315.7Å) wavebands with better resolution and greater sensitivity thanthe previous surveys. A vivid description of the source selection,FUV and NUV magnitude error cuts and the statistical analy-sis of the GALEX catalog is provided by Bianchi et al. (2007),Bianchi (2009) and Bianchi et al. (2011a, 2013). Detection ofWDs and BHBs is one of the main achievements of GALEX asthese sources are elusive in the other wavelength bands of theelectromagnetic spectrum due to their high temperature. WDsand BHBs are integral to the study of stellar evolution and struc-ture of the Milky Way as they belong to different stellar popula-tions of the Galaxy.
We have upgraded the Besancon model of stellar populationsynthesis to include the UV bands of GALEX and the upcom-ing UVIT1 (which will be flown onboard ASTROSAT) to pre-dict star counts in different parts of the sky (Todmal et al. 2010).UVIT will image the sky in the FUV (1300 - 1800 Å) and NUV(2000 - 3000 Å) channels, each having five filters, at a high reso-lution of 1.8′′ (Postma et al. 2011; Kumar et al. 2012a,b). Betterpositional accuracy of UVIT as compared to GALEX will enablemore reliable cross correlation with other catalogs which will beof great utility in inferring the Galactic structure using the starcounts technique. The transmission curves (effective area versuswavelength) for the FUV and NUV bands of GALEX togetherwith each of the five FUV (left panel) and NUV (right panel) fil-ters of the upcoming UVIT/ASTROSAT are shown in Figure 1.We have included the effective area curves of both the GALEXand all the UVIT/ASTROSAT bands in the model to simulate theUV star counts in these bands. Apart from the GALEX bands,we will discuss the model simulated star counts of the BaF2(FUV: 1370 - 1750 Å,λeff = 1504 Å) and NUVB4 (NUV: 2505- 2780 Å,λeff = 2612 Å) bands of UVIT/ASTROSAT. The ex-pected sensitivity limits (5σ) in AB magnitude system in theUVIT BaF2 (FUV) and NUVB4 (NUV) wavebands, for an expo-sure time of 200 seconds, are 20.0 and 21.2 magnitudes, respec-tively (ASTROSAT Handbook 2013; private communication).
It is worth mentioning here that throughout the paper wehave used AB system for the GALEX, UVIT and SDSS datasets, whereas the 2MASS and WISE data sets are in the Johnsonsystem (see Section 2).
We give details of the observations and selection of UVstars in Section 2. We describe about the Besancon modelGalaxy model in Section 3 and discuss the comparison of theGALEX+WISE+2MASS and GALEX+SDSS star counts inSection 4. We present the comparison of the model with the ob-servations in Section 5, and discuss the distribution of themodelstar counts in Section 6. We mention the identification of WDsand BHBs usingFUV − NUV colour in Section 7. Finally, wesummarize our conclusions in Section 8.
1 http://www.iiap.res.in/Uvit
2. Observations and cross-correlation of GALEXsources
2.1. GALEX data
GALEX was an orbiting space telescope launched in April,2003, which was terminated in mid-February, 2012. The satelliteand on-orbit performance are described in Martin et al. (2005)and Morrissey et al. (2005, 2007). It observed the sky in two UVbands, FUV and NUV, simultaneously, with a spatial resolutionof 4.2′′ and 5.3′′, respectively. The field of view is 1.25◦ in di-ameter and the images are sampled with 1.5′′ pixels. The typicalAB magnitude limits (5σ depth) met by AIS for an exposuretime of 100 seconds and MIS for an exposure time of 1500 sec-onds are 19.9/20.8 (FUV/NUV) and 22.6/22.7 (FUV/NUV), re-spectively (Morrissey et al. 2007). The AIS has the largest skycoverage when compared to the other GALEX surveys. GALEXhas observed a large part of the sky (∼75%), excepting theGalactic plane and some regions of the Magellanic Clouds duetosafety concerns of the detectors. In this paper, we have usedtheGALEX GR6 data which is available in Multi-mission Archiveat Space Telescope Science Institute (MAST2).
2.2. Selection of GALEX fields
We have selected nineteen GALEX fields for which both the de-tectors of GALEX were turned on. We retained sources whichhad a reliable NUV detection, however, FUV detections areavailable for∼3.5% and∼6.8% of the NUV detections in theselected AIS and MIS fields, respectively. The rest of the NUVsources do not have a FUV detection because their FUV fluxesare too low to be detected. We include only regions within a ra-dius of 0.5◦ from the center of the tiles to eliminate edge artifactsand bad sources along the edge as well as to avoid overlappingareas and duplication of the sources. The coverage areas of theobserved fields are calculated by summing up the areas of all thetiles in a field.
The fields are selected in the footprints of the GALEX,SDSS, WISE and 2MASS surveys. The various fields are as fol-lows:
– Four GALEX tiles were chosen at the southern Galactic lat-itudes: two each in AIS and MIS.
– Eight fields with large area coverage of the sky were chosenin several northern Galactic directions. The fields include:two regions towards the Galactic center (GC) (one each inAIS and MIS), two regions towards the Galactic anticenter(GAC) (one each in AIS and MIS), and one region each inAIS towards the Galactic antirotation (GAR), Galactic lowlatitude (GLL), Galactic high latitude (GHL), and Galacticpole (GP) directions.
– Seven fields in AIS were chosen at 10◦ intervals ofb aroundl ∼ 50◦ in order to study the latitude variation of UV starcounts.
The center coordinates, survey types, area coverages, loca-tion in the Galaxy, number of GALEX tiles and the range ofexposure times of NUV and FUV observations of each of thefields are given in Table 1.
2.3. WISE+2MASS data
The AIS and MIS of GALEX overlap with the 2MASS andWISE footprints. 2MASS (Skrutskie et al. 2006) has observed
2 http://galex.stsci.edu/GR6
2

Pradhan et al.: A Model for the UV Star Counts of the Galaxy
the entire sky in the J (1.24µm), H (1.66µm) and Ks (2.16µm)near-IR (NIR) bands with angular resolutions of 2.9′′, 2.8′′, and2.9′′ respectively; while WISE (Wright et al. 2010) has mappedthe sky in the W1 (3.4µm), W2 (4.6µm), W3 (12µm), and W4(22 µm) mid-IR bands, with angular resolutions of 6.1′′, 6.4′′,6.5′′, and 12.0′′ respectively. The 5σ point source sensitivitiesof the four WISE bands are better than 0.08, 0.11, 1 and 6 mJy(equivalent to 16.6, 15.6, 11.3, and 8.0 Vega magnitude) in un-confused regions on the ecliptic (Wright et al. 2010). The exist-ing WISE+2MASS cross-matched catalog available at InfraredScience Archive (IRSA3) has been used for convenience. Thiscatalog has been produced using a 3.0′′ matching radius, whichwas found to be adequate considering the positional accuracyand resolution.
We have made use of the Virtual AstronomicalObservatory (VAO4) for cross-matching GALEX sourceswith WISE+2MASS sources. GALEX sources were uploadedinto the VAO, seeking their WISE and 2MASS counterpartsusing a match radius of 3.0′′. We found most of the realmatched sources within this radius, with a very small fraction(< 1%) having multiple matches which were removed fromthe final catalog. We also estimated the possible contaminationby spurious matches (random coincidences) for the matchedsources following the method of Bianchi et al. (2011a). For thispurpose we used a match radius of 6.0′′, which is equivalentto the resolution of WISE, to find the GALEX counterparts ofWISE sources. The spurious matches were found to be∼10% ofthe total matched sources, and 75% of these spurious matchedsources lie beyond a distance of 3.0′′.
2.4. SDSS data
So far, SDSS has mapped over 35% of the full sky in fiveoptical photometric bands (u, g, r, i, z) covering the wavelengthrange from 3000 to 11000 Å (Aihara et al. 2011). GALEX GR6has been cross-matched against SDSS DR7 and the providedcross-matched table isxSDSSDR7. Several works (Seibert et al.2005; Budavari et al. 2009; Bianchi et al. 2007, 2011a) haveex-plained the cross-matching of the GALEX catalog with SDSS,astrophysical source classifications and related statistical analy-ses. We uploaded the GalexIDs of the objects into the GALEXCASjobs5 SQL (Structured Query Language) interface to de-termine their SDSS counterparts in a search radius of 3.0′′.We have eliminated the multiple matches (< 1%) from theGALEX+SDSS final catalog. The estimated spurious matches incase of GALEX+SDSS are found to be∼7% within 3.0′′ radius.The SDSS star/galaxy classifications have been adopted whileperforming the match in order to separate out point sources fromthe source list.
SDSS classified point sources (GALEX+SDSS) includeboth stars and quasi stellar objects (QSOs), out of which we se-lected QSOs using the SDSS colour cuts from Richards et al.(2002) and removed them from the GALEX+SDSS pointsources and termed the clean sample as ‘GALEX+SDSS stars’.
2.5. Selection of stars from the GALEX catalog by IR colourcut method
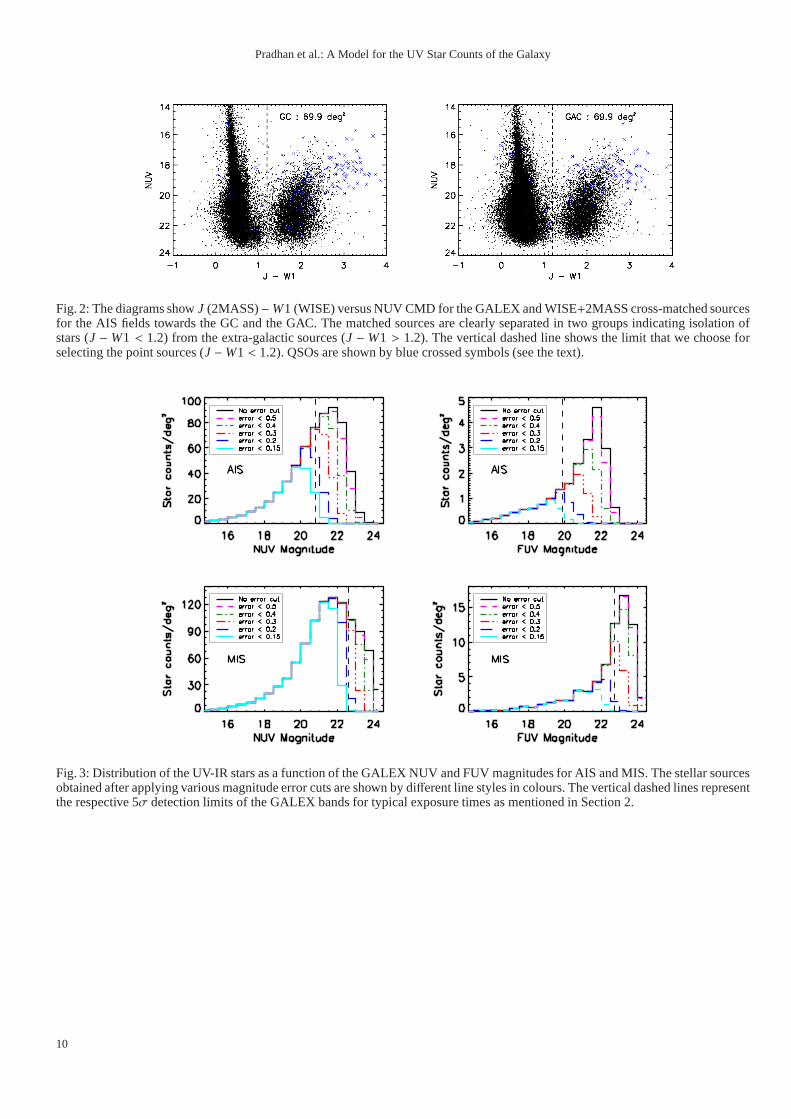
Figure 2 showsJ − W1 versus NUV colour-magnitude dia-gram (CMD) of all GALEX sources that are cross-matched
3 http://irsa.ipac.caltech.edu/Missions/wise.html4 http://vao-web.ipac.caltech.edu/applications/VAOSCC5 http://galex.stsci.edu/casjobs
with WISE+2MASS sources for the regions in the directionsof the GC and the GAC, each covering 69.9 deg2 of the sky.QSO candidates are selected using the SDSS colour cuts fromRichards et al. (2002) and are represented by blue crossed sym-bols in the plot. We clearly see two groups of sources in thefigure well separated byJ − W1 colour. The stars verified bytheir SDSS classification as point sources in a cross-matchedsample are identified to be bluer thanJ − W1 < 1.2 and theextra-galactic objects (e.g. galaxies, QSOs, etc.) are redder, withJ−W1 > 1.2. Since the contamination by SDSS-identified QSOsis estimated to be negligible in theJ −W1 < 1.2 star counts (<0.1% of the whole sample), we have used theJ −W1 colour cutprocedure for all the fields to separate the stars from the extra-galactic objects. Henceforth in the paper, we refer to GALEXand WISE+2MASS cross-matched sources withJ − W1 < 1.2(GALEX+WISE+2MASS) as ‘UV-IR stars’.
2.6. Photometric error cuts and completeness limits
Figure 3 shows the distribution of UV-IR stars as a function ofthe GALEX UV magnitudes for AIS and MIS. Stars with NUVand FUV magnitude errors less than 0.5, 0.4, 0.3, 0.2 and 0.15are displayed with magenta, green, red, blue and cyan colourlines respectively, whereas the black line represents the starswithout any magnitude error cut. The typical 5σmagnitude lim-its of the NUV and FUV bands for AIS and MIS (see Section2.1) are shown by vertical dashed lines. As seen from the his-tograms, a progressive stringent error cut eliminates the fainterstars. The completeness limits need to be established accordingto a given magnitude error. If we consider all stars without ac-counting for errors, the star counts go deeper but their values arenot reliable due to the uncertainty on the magnitude measure-ment. This is particularly true for the FUV filter where somespurious detections can occur. Finally, we retained stars withmagnitude error less than 0.2 in both bands as this error cutgives magnitude limits almost similar to the typical 5σ limitsof the GALEX bands for AIS and MIS which are provided byMorrissey et al. (2007).
We have applied magnitude error cuts (similar to the oneshown in Figure 3 for UV-IR stars) in the original GALEXsource catalog that includes all the GALEX detections and alsoin the matched GALEX source catalog obtained after cross-matching with the WISE+2MASS catalog. We find a loss ofGALEX sources in the matched catalog when compared withthe original GALEX source catalog at a specific magnitude errorcut. The completeness limits for the original GALEX sourcesforNUV and FUV magnitude error cuts of 0.2 are 20.5/21.0 magni-tude (FUV/NUV) in AIS and 22.5/22.5 magnitude (FUV/NUV)in MIS. The completeness limits at the same magnitude er-ror cuts for the matched catalog become 20.0/20.5 magnitude(FUV/NUV) in AIS and 22.5/22.0 magnitude (FUV/NUV) inMIS and these limits are the same for the UV-IR stars too. Fora specific magnitude error cut, the FUV and NUV completenesslimits of the observed sources which are cross-matched to thesurveys at longer wavelengths become brighter than the com-pleteness limits of the unmatched GALEX source catalog due tothe loss of faint sources in the former.
In order to examine which objects are affected by the lim-its of the combined surveys (GALEX+WISE+2MASS), we splitthe stars into twoNUV−W1 colour intervals: hot (NUV−W1 <5) and cool (NUV−W1 > 5) stars. We checked the completenesslimit of the NUV band (AIS) for these two colour ranges. Forhot stars, we found that the completeness limit of GALEX NUV(AIS) is reduced by 0.5 magnitude (i.e., the effective magnitude
3
Pradhan et al.: A Model for the UV Star Counts of the Galaxy
limit gets brighter). The GALEX completeness limit (AIS) ofhot stars is therefore limited by the depth of WISE, and simi-larly by the depth of 2MASS. For cool stars, the NUV (AIS)completeness limit is the same in the GALEX catalog alone andin the combined catalog with the near-IR surveys.
3. Besancon Galaxy model
The Besancon model is a population synthesis model based ona scenario of Galactic evolution and constrained by dynam-ics. In the model, five populations are taken into account: thindisc, thick disc, stellar halo, bar, and bulge (Robin et al. 2012).The previous versions of the model are extensively describedin Robin et al. (2003). We use the newest version of the model(version of April 2013; Robin et al. 2012) which has been up-graded to include the FUV and NUV passbands of GALEX andthe upcoming UVIT/ASTROSAT, by applying their filter trans-mission curves to produce UV star counts in various Galacticdirections. The model uses a set of evolutionary tracks, a starformation rate and an IMF as defined in Haywood et al. (1997),to generate different stellar populations. The colours are com-puted from the Basel Stellar Library (BaSeL3.1) model atmo-spheres (Westera et al. 2002). In this new version of the model,DA and DB type WDs are included using the evolutionary tracksand atmosphere models from Holberg & Bergeron (2006). Theluminosity functions are obtained assuming an initial-to-final-mass ratio (mI = 9.1743m f − 3.6147) from Kalirai (2008). Thedistribution in age is computed assuming a lifetime on the mainsequence (MS) from Eggleton et al. (1989) and a lifetime on thegiant branch of 15% of the time on the MS. The repartition in DA(WD with hydrogen rich atmosphere) and DB (WD with heliumrich atmosphere) is computed assuming that at Tef f > 40000 Kthey are all DA, and at Tef f < 20000 K, 50% are DB with alinear variation between 20000 K and 50000 K. The final lumi-nosity function is normalised to fit Harris et al. (2006). Similarly,the BHBs are incorporated in the model by taking the evolution-ary tracks from BaSTI (A Bag of Stellar Tracks and Isochrones)models (Pietrinferni et al. 2004). Ultimately, the model producesUV star counts by Monte Carlo simulations using a set of stellaratmospheric models, observational photometric errors andex-tinction.
The model incorporates an extinction (AV ) assuming an el-lipsoidal distribution of diffuse absorbing matter, which followsan Einasto extinction law and is depicted by an adjustable nor-malization (extinction gradient) of 0.7 mag/kpc in the V band.We produced the model simulations towards various Galacticdi-rections assuming the default extinction gradient. However, thedefault value of diffuse extinction (0.7 mag/kpc in the V band),which may not be appropriate at low latitudes, can be adjusted byadding a few absorbing clouds with a given adhoc distance andextinction from the Schlegel et al. (1998) maps. This has beenillustrated in Section 5.1. The ratios between UV band to visualextinction are taken to be 2.67 and 2.64 for the FUV and NUVband of GALEX, respectively, following the extinction law ofCardelli et al. (1989).
Stars in the simulated GALEX catalog have a UV colour,FUV and NUV magnitudes, a temperature range from 1650 K to65000 K, log g from -1 to 9, all luminosity classes and a rangeof metallicities. In the simulations done for comparison with theGALEX observed star counts, the simulated stars are mostly MSstars (∼77%) with a small contribution from giants and subgiants(∼17%). The WDs are∼6% of the sample and reside at the bluerend ofFUV − NUV colour (see Sections 7).
4. Comparison of the GALEX+WISE+2MASS andGALEX+SDSS stars
Figure 4 shows the distribution of the GALEX AIS star counts(for field 5 in Table 1) as a function of NUV magnitudefor the model simulation (solid line), GALEX+SDSS stars(dashed line), UV-IR stars (GALEX+WISE+2MASS: dashed-dotted line) and GALEX+WISE star counts with no 2MASSdetection (dotted line). The error bars shown in the model starcounts are due to Poisson noise. The NUV 5σ detection limit(NUV magnitude= 20.8; Morrissey et al. 2007) and the com-pleteness limit (∼ 20.5 magnitude; see Section 2.5) for AIS aredemarcated by the solid and dashed vertical lines, respectively.Stars with NUV magnitude up to the completeness limit are welldetected by the GALEX, SDSS, WISE and 2MASS surveys; agood agreement in star counts among the cross-matched surveysand the model simulations can clearly be seen in Figure 4.
It is also evident from Figure 4 that the GALEX+SDSSstars are slightly more than the UV-IR stars in the NUV bandat the fainter magnitudes. This discrepancy could be causedby2MASS: since the time gap between the WISE and 2MASS sur-veys is∼12 years, high proper motion stars may have movedoutside the cross-matching radii. However, stars with propermotions high enough to move by 3.0′′ in ∼12 years are veryrare in a survey of a few square degrees. Another possibilityisthat the 2MASS J band, which has a 10σ point source sensi-tivity limit of about 15.8 magnitude, does not penetrate deeplyenough to provide counterparts for all WISE detections. ThoughGALEX+SDSS has a smaller sky area coverage and a fainterlimit compared to GALEX+WISE+2MASS, both the selectionsyield a close match of the star counts at the brighter end. It is alsopossible that the GALEX+SDSS stars are still contaminated byfaint galaxies and quasars. So, we preferred to use the star countsdetermined by theJ − W1 colour cut (UV-IR stars) rather thanthe GALEX+SDSS stars.
5. Data and model comparison
We modelled the stellar density distribution of the Milky Way inUV using the Besancon model of stellar population synthesis (asdescribed in Section 3) for different regions of the sky. Four sim-ulated catalogs for each of the fields chosen for our study wereproduced in order to reduce the statistical noise. Appropriatephotometric errors were applied in the model to produce realis-tic simulations and the error information was assumed from theobserved data which is a polynomial function of the magnitude.
We can simulate the catalogs using the ‘small field’ optionwhich assumes that the density does not vary across the field,or using the ‘larger field’ option with a given step in longitudeand latitude, to account for the fields where the density can vary.We have used ‘small field’ option for the small fields (e.g., area< 15 deg2) by providing the centerl andb coordinates of thefields along with their coverage area. For the larger fields (e.g.,area> 15 deg2), we have used the ‘larger field’ option where weprovide the range ofl andb coordinates and a step size (e.g.,from 1.0◦ to 2.5◦ for small to large fields, respectively) to coverthe field. However, the gradients in the fields (Table 1) are smallenough that considering either the center of the field or the rangeof l/b does not make any difference in the predicted star counts.
4
Pradhan et al.: A Model for the UV Star Counts of the Galaxy
5.1. Comparison of observed UV star counts with the modelin various fields
Initially, simulations were performed for four GALEX tiles(fields 1 - 4 in Table 1), each covering an area of 0.785 deg2
at the southern intermediate Galactic latitudes. We binnedthemodel and the UV-IR stars in 0.5 magnitude intervals in theNUV band, for respective tiles of AIS and MIS, in the directionsof the GC and the GAC. As shown in Figure 5, we found that themodel star counts (solid line) match well the UV-IR stars (solidcircles) as well as the GALEX+SDSS stars (open circles) up tothe completeness limits of AIS (20.5 magnitude) and MIS (22.0magnitude) for the regions at the southern intermediate Galacticlatitudes.
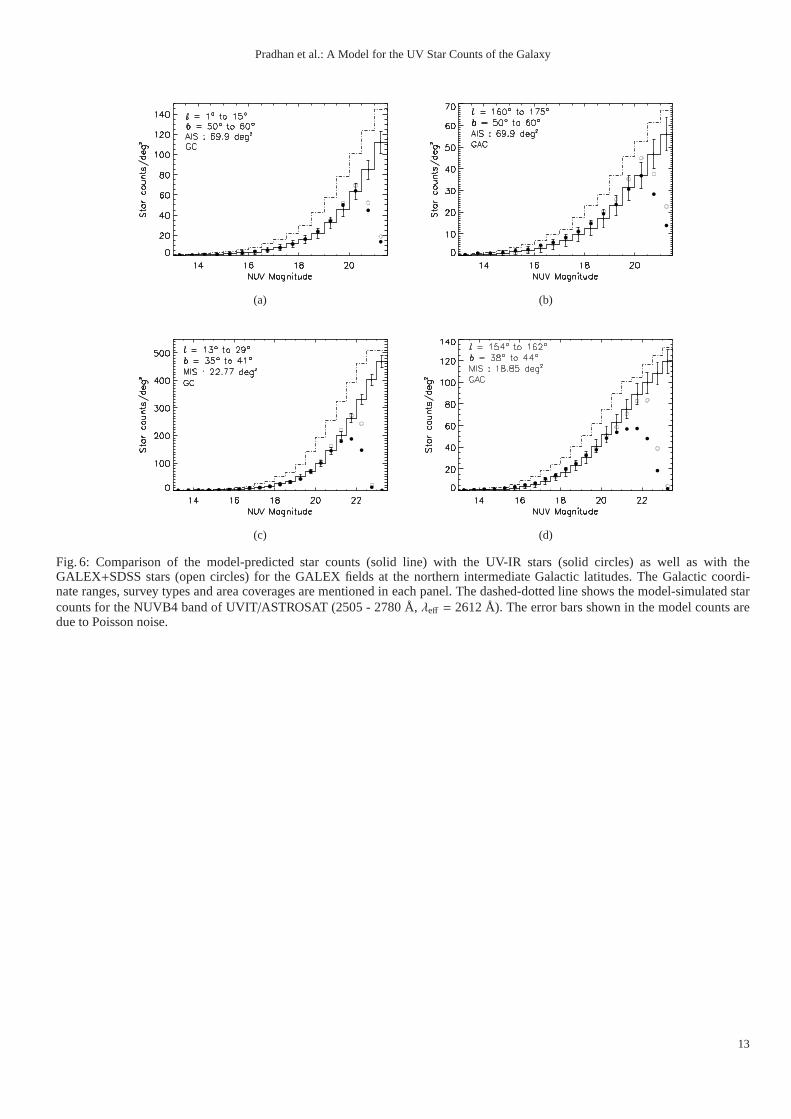
In order to check the universal validity of the model, we pro-duced simulated catalogs in various directions of the Galaxycovering a large area of the sky. Figures 6a and 6b showthe comparison of the model-predicted NUV star counts (solidline) with the UV-IR stars (solid circles) as well as with theGALEX+SDSS stars (open circles) for AIS in the directionsof the GC and the GAC, each covering 69.9 deg2 area of thesky (fields 5 - 6 in Table 1). Similarly, Figures 6c and 6d rep-resent the comparison of star counts for MIS in the directionsof the GC and the GAC, covering an area of 22.77 deg2 and18.85 deg2, respectively (fields 7 - 8 in Table 1). These fieldsare chosen at the northern intermediate Galactic latitude of theGalaxy. The error bars shown in the model-predicted star countsare due to Poisson noise. The maximum estimated asymmetricerror in the observed counts is∼2% – 10% depending on theNUV magnitude bins (i.e., error increases towards the faintermagnitude bins), which is not shown in the plots. The modelshows a good agreement with the observation (UV-IR stars andGALEX+SDSS stars) down to an NUV magnitude of∼20.5 forAIS and 22.0 for MIS (see Figures 5 and 6).
We have also produced the model-predicted star counts forone of the passbands (NUVB4: 2505 - 2780 Å,λeff = 2612 Å)of upcoming UVIT/ASTROSAT which is shown by a dashed-dotted line. Star counts are enhanced in the UVIT NUVB4 bandcompared to the GALEX NUV band because NUVB4 covers asmaller wavelength range and its effective wavelength is longerthan the effective wavelength of the NUV band. Most of the starshave flux peaks at longer wavelengths, such thatNUV−NUVB4is positive. Since the magnitudes are normalized to AB system,the integral of the filter does not matter while computing magni-tudes, though narrower filters will demand longer exposure timesto get the required magnitude.
The model-predicted star counts for the regions at the GHL,the GAR and the GP (solid line: fields 9 - 12 in Table 1) matchwell the UV-IR stars (solid circles) and the GALEX+SDSS stars(open circles) except the region at the GLL (see Figures 7a, 7b,7c and 7d). As seen in Figure 7d, the model simulated NUV starcounts (solid line) produced using the standard diffuse extinc-tion do not match observation beyond NUV magnitude fainterthan 18.5. This mismatch could be due to the default extinctiongradient being used in the model not being sufficient at the GLL.We took the line of sight extinction (AV = 0.1 magnitude) for theGLL from the Schlegel et al. (1998) maps and then corrected theextinction by adding a cloud of AV = 0.1 magnitude at a distanceof 1 Kpc (Section 3). The model-predicted star counts after cor-recting the extinction (dashed line) show a good agreement withthe UV-IR stars.
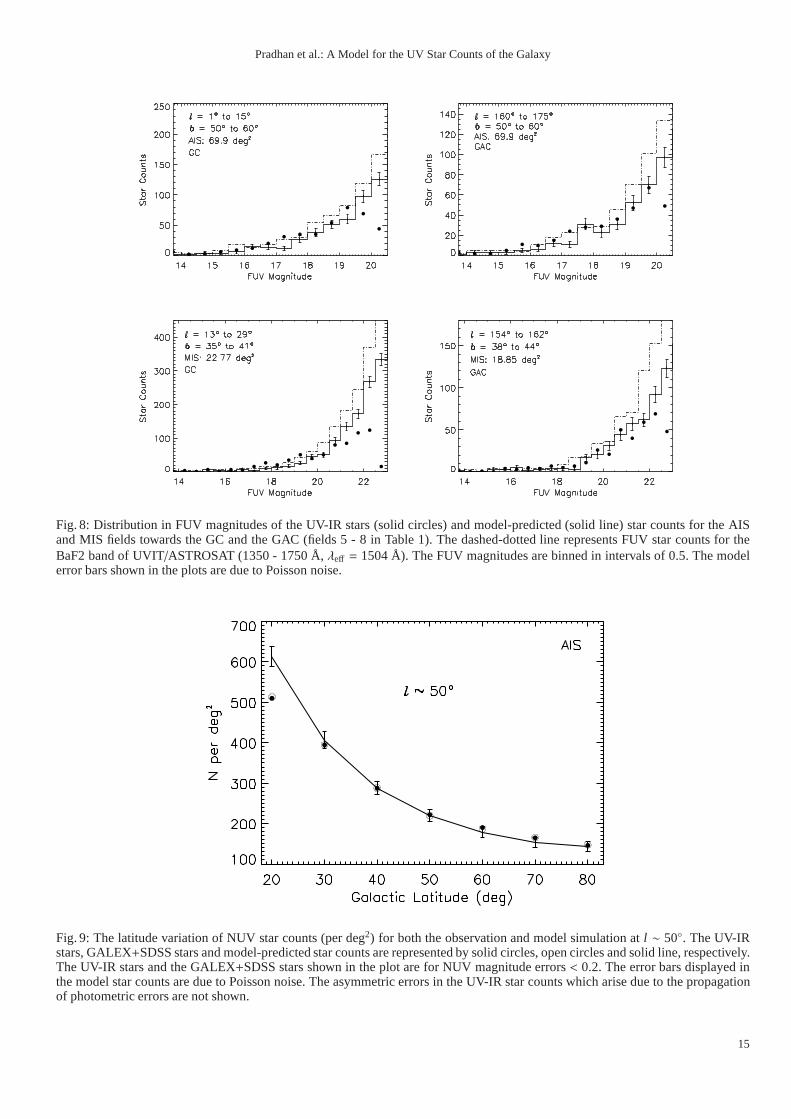
In Figure 8, we have shown the distribution in FUV mag-nitudes of the UV-IR stars (solid circles) and model-simulated(solid histograms) star counts for AIS and MIS (fields 5 - 8
in Table 1) towards the GC and the GAC. Despite the poorstatistics, the model fit well the observations up to the com-pleteness limit of the data sets (see Section 2.5). We have alsoproduced the model-predicted star counts for one of the FUVpassbands (BaF2: 1370 - 1750 Å,λeff = 1504 Å) of the forth-coming UVIT/ASTROSAT which is shown by a dashed-dottedline in Figure 8. Since the BaF2 passband range is close to theGALEX FUV passband, the UVIT model simulated FUV starcounts match the GALEX observed FUV star counts reasonablywell.
Overall the Besancon model of stellar population synthesisupgraded to the UV passbands simulates star counts which areconsistent with the observed GALEX star counts and can be usedefficiently for the study of Galactic structure parameters.
5.2. Latitude variation in star counts
In order to study the latitude variation of UV star counts, wehave chosen GALEX fields at 10◦ Galactic latitude intervals forl ∼ 50◦. We determined NUV star counts per square degree ineach field separately for the GALEX+SDSS stars and the UV-IR stars. As shown in Figure 9, the solid circles represent theUV-IR stars while the open circles show the GALEX+SDSSstars. The solid line represents the model generated star counts.The model errors due to Poisson noise are shown in the plotwhile the asymmetric errors on the UV-IR star counts whicharise due to the propagation of photometric errors are not shown.The stellar density decreases from lower to higher Galacticlati-tudes in case of both observed and model star counts. The UV-IR star counts with NUV magnitude brighter than 20.5 mag-nitude match model simulations at the intermediate and highGalactic latitudes. However, a slight deviation of model simu-lated counts from observed counts is seen at low Galactic lati-tudes. This could be due to the default extinction gradient usedin the model which might be inappropriate at low latitudes be-cause some clouds can be present as discussed above for Figure7(d).
5.3. Comparison with the TRILEGAL model
The predictions from the TRILEGAL model (Girardi et al.2005), which is another stellar population code, have been com-pared with UV star counts by Bianchi et al. (2011a). It was foundthat the TRILEGAL-predicted NUV star counts which show anoverall good match to observations at brighter magnitudes arebetter at the northern high latitudes and the southern low lat-itudes. We produced NUV star counts using the 3 alternativeIMFs that the TRILEGAL website6 proposes. However, we seein Figure 10 that the Besancon model produces a better fit toreal star counts than TRILEGAL does in the GHL field closeto the pole as well as in the GAR field at the intermediate lati-tudes. Here we use a WD modeling similar to TRILEGAL, withsmall differences. The initial-to-final mass relation from Kalirai(2008) is used in the Besancon model while TRILEGAL alter-natively uses Marigo & Girardi (2007) or Weidemann (2000),the latter giving a better fit to the GALEX data (see Figure9 in Bianchi et al. 2011a). We also use different atmospheremodels (Holberg & Bergeron 2006), while TRILEGAL uses ei-ther Koester (2008) or TLUSTY models (Hubeny & Lanz 1995).Bianchi et al. (2011a) pointed out that the difference betweenthese two models is not larger than 0.05 magnitude inFUV −NUV colour for most of the WDs. Finally, TRILEGAL does
6 http://stev.oapd.inaf.it/cgi-bin/trilegal
5
Pradhan et al.: A Model for the UV Star Counts of the Galaxy
not consider DB WDs because it includes only WDs hotter than18000 K, while we have taken them into account. However, thedifference between TRILEGAL and the Besancon model pre-dictions is mainly due to the more detailed account for the set-tling of the disc with age in the Besancon Galaxy model (thedynamical constraint which is used, forces the sub-componentsof the thin disc to follow a tied age/vertical scale height relationin agreement with the observed age/velocity dispersion relation).
6. Distribution of the stars
We find that the model reproduces the observed UV star countsas selected from the GALEX data. The star counts are dominatedby MS stars, WDs and BHBs. The vertical distribution of differ-ent stellar populations depends on their structural parameters. InFigure 11a, we show the contribution of the thin disc (dottedline), thick disc (dashed line), halo (dashed-dotted line)and sumof the three populations (solid line) predicted by the modelforan AIS field towards the GC at the intermediate Galactic lati-tude. The relatively bright stars are dominated by the thin disc atNUV magnitudes brighter than 18.5 whereas the thick disc andhalo stars become significant at NUV magnitudes fainter than∼18.5 and∼19.5 respectively. This is very similar to the com-parison made by Bianchi et al. (2011a) for hot star candidates.Considering the stars with NUV magnitudes brighter than 20.5,we found that the thick disc stars are the most dominant popula-tion and∼54% -∼60% of the total population (depending on theGalactic direction).
We have shown the vertical distribution of the model sim-ulated stars in Figure 11b. It is evident that the thin disc starcounts (dotted line) dominate up to a distance of 1.5 kpc overtheGalactic plane whereas the thick disc star counts (dashed line)dominate at distances between 1.5 and 4.0 kpc beyond whichthe halo stars (dashed-dotted line) dominate the total stellar pop-ulation. A similar trend has been observed by both Du et al.(2003) for BATC (Beijing-Arizona-Taiwan-Connecticut) multi-colour photometric survey star counts and Phleps et al. (2000)for CADIS (Calar Alto Deep Imaging Survey) deep star countsfor regions at intermediate Galactic latitudes.
7. Blue hot stars
FUV − NUV colour is an important indicator of the spectraltype of the stars. Particularly, UV colour can be used to identifyhot BHBs and WDs (Kinman et al. 2007; Bianchi et al. 2011a),which emit most of their light in UV because of their high tem-peratures. The BHBs are comparatively more luminous in UVthan the other population II stars. Similarly, the WDs whichare the end product of the stellar evolution of the intermediateand low mass stars, provide important information about theGalactic disc star formation history. Comparing the observedFUV − NUV colour of stars with the model, we were able toseparate out the halo BHBs and disc WDs from the whole sam-ple of stars.
Figure 12 shows the comparison of GALEXFUV − NUVcolours for the UV-IR stars (solid circles) and model simulatedstar counts (solid-lined histogram) for the AIS fields towards theGC and the GAC. We have considered stars with NUV magni-tude< 20.5 and FUV magnitude< 20.0 for the GALEX AISsurvey. TheFUV − NUV colours of WD (dotted line) and BHB(long-dashed line) populations are also shown along with theUVIT FUV−NUV (BaF2 - NUVB4) colour (dashed line) in theplot. Looking at theFUV−NUV model predictions, the sources
can be classified into two groups, the one withFUV − NUV >2.5 are the red cool stars and the other withFUV − NUV <2.5 are blue hot stars. The blue stars exhibit a bimodal distri-bution indicating the existence of two populations; the peak atFUV − NUV ∼ -0.5 are the hot WDs of the disc and the peakat FUV − NUV ∼ 2.0 are BHBs of the Galactic halo. In theBesancon model, the temperature range of WDs is from 10000K to 27000 K and that of BHBs is from 5000 K to 20000 K.Hotter stars with temperature greater than 27000 K are rare tobe found in significant numbers in the data considered here.
The colour distributions in Figure 12 towards both the GCand the GAC show some differences between the model and ob-servations. Specially, we notice that the very blue peak atFUV−NUV < 0, due to hot WDs, is too high in the model. Moreover,there is a lack of stars in the GC field at 0< FUV − NUV <1.5. In the colour range where the BHBs dominate, the numberof predicted stars is well in agreement with the observations inboth fields, indicating that the halo BHB density is well simu-lated. There is a dearth of model-simulated stars in the colourrange, 2< FUV − NUV < 3.5, which is not understood yet andwill be investigated in a further study. AtFUV − NUV > 4, themodel lacks stars but more towards the GAC than towards theGC. This colour domain is mostly dominated by the thick discMS stars. We guess that it is due to the scale length which willbe investigated in a forthcoming paper.
Both, photometry and spectroscopy can be used to iden-tify WDs and BHBs. Several large area sky surveys such as2MASS, SDSS and GALEX have been used to distinguish themby appropriate colour selections and it is worth mentioningafew of the works. Kleinman et al. (2013) produced the latestcatalog of spectroscopically confirmed DA and DB type WDsfrom SDSS Data Release 7. Using the data from GALEX FUVand NUV imaging, Bianchi et al. (2011b) presented a catalogof hot star candidates, particularly WDs. Similarly, the first se-lection of BHBs from SDSS colours was made by Yanny et al.(2000) and then followed by many others (Sirko et al. 2004;Bell et al. 2010; Deason et al. 2011; Vickers et al. 2012). Wehave identified WD and BHB candidates using suitable GALEXFUV−NUV colours. It was found from the modelFUV−NUVcolour (Figure 11) that BHB and WD star candidates occupy thecolour range, 1.5 < FUV −NUV < 2.5 andFUV −NUV < 0.5,respectively. In the mentioned colour range, we obtain a cleansample of WD candidates, whereas in the sample of BHB can-didates, a contamination of non-BHB candidates, such as WDsand MS stars, constitute about 7%. These colour ranges havebeen used for the separation of WD and BHB candidates fromother populations in the observed sample.
In order to substantiate our identification of the WD andBHB star candidates using GALEXFUV − NUV colour, wecompared them with their known 2MASS colours.E(B−V) val-ues for the stars were measured from Schlegel et al. (1998) andconverted to NUV, J and H extinction using Cardelli et al. (1989)extinction law :A(NUV) = 8.90E(B−V), A(J) = 0.874E(B−V),andA(H) = 0.589E(B−V). Figure 13a shows the (J−K)o versus(NUV − J)o colour-colour diagram for the BHB candidates. Thesources at different latitude intervals are represented by differ-ent symbols. The dashed parallelogram encloses the area usedby Kinman et al. (2007) which contains 66% of the BHB can-didates selected on the basis ofFUV − NUV colour. Similarly,Figure 13b shows theH−K versusJ −H colour-colour diagramfor the WD candidates. The dashed rectangle encloses the area inthe colour-colour diagram chosen from Hoard et al. (2007) thatcontains a majority of the WD candidates of our sample. Thelocation of our selected WD and BHB star candidates in the re-
6
Pradhan et al.: A Model for the UV Star Counts of the Galaxy
spective 2MASS colour window indicates that theFUV − NUVcolour can also be used as a potential tool in identifying WD andBHB candidates. This is a preliminary investigation and we willuse this in our future work of an all sky study of these sourcesusing the GALEX data.
8. Conclusions
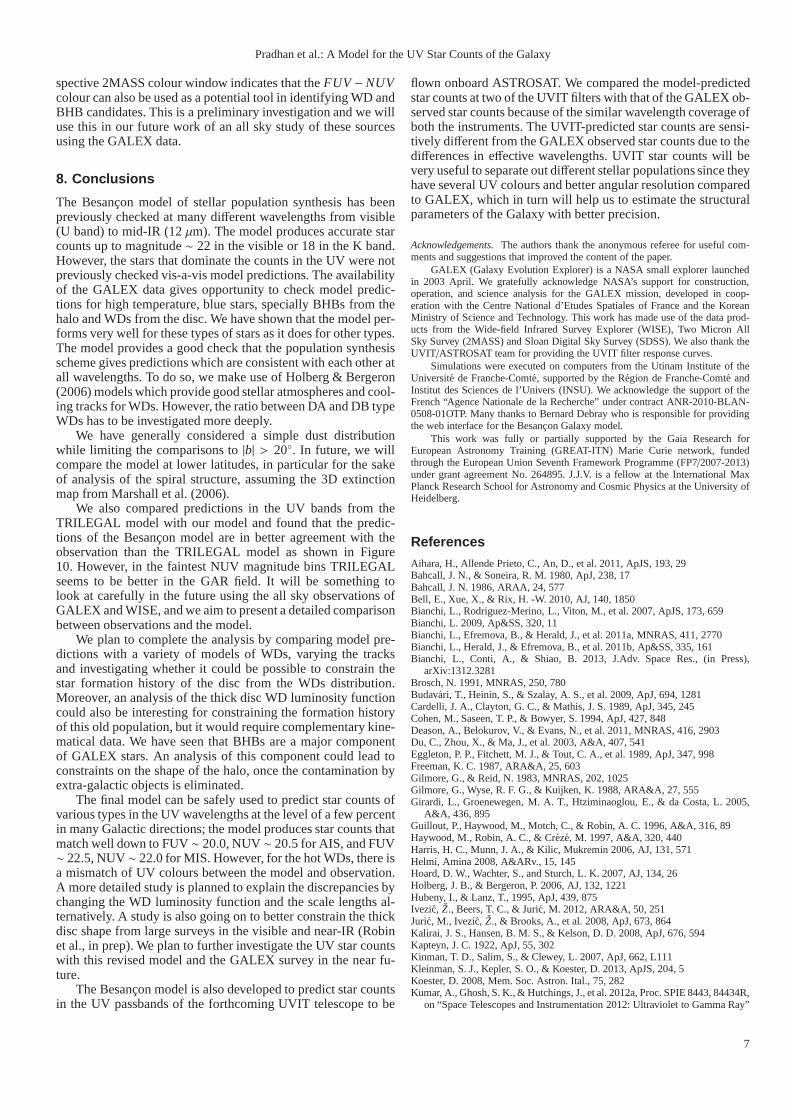
The Besancon model of stellar population synthesis has beenpreviously checked at many different wavelengths from visible(U band) to mid-IR (12µm). The model produces accurate starcounts up to magnitude∼ 22 in the visible or 18 in the K band.However, the stars that dominate the counts in the UV were notpreviously checked vis-a-vis model predictions. The availabilityof the GALEX data gives opportunity to check model predic-tions for high temperature, blue stars, specially BHBs fromthehalo and WDs from the disc. We have shown that the model per-forms very well for these types of stars as it does for other types.The model provides a good check that the population synthesisscheme gives predictions which are consistent with each other atall wavelengths. To do so, we make use of Holberg & Bergeron(2006) models which provide good stellar atmospheres and cool-ing tracks for WDs. However, the ratio between DA and DB typeWDs has to be investigated more deeply.
We have generally considered a simple dust distributionwhile limiting the comparisons to|b| > 20◦. In future, we willcompare the model at lower latitudes, in particular for the sakeof analysis of the spiral structure, assuming the 3D extinctionmap from Marshall et al. (2006).
We also compared predictions in the UV bands from theTRILEGAL model with our model and found that the predic-tions of the Besancon model are in better agreement with theobservation than the TRILEGAL model as shown in Figure10. However, in the faintest NUV magnitude bins TRILEGALseems to be better in the GAR field. It will be something tolook at carefully in the future using the all sky observations ofGALEX and WISE, and we aim to present a detailed comparisonbetween observations and the model.
We plan to complete the analysis by comparing model pre-dictions with a variety of models of WDs, varying the tracksand investigating whether it could be possible to constrainthestar formation history of the disc from the WDs distribution.Moreover, an analysis of the thick disc WD luminosity functioncould also be interesting for constraining the formation historyof this old population, but it would require complementary kine-matical data. We have seen that BHBs are a major componentof GALEX stars. An analysis of this component could lead toconstraints on the shape of the halo, once the contaminationbyextra-galactic objects is eliminated.
The final model can be safely used to predict star counts ofvarious types in the UV wavelengths at the level of a few percentin many Galactic directions; the model produces star countsthatmatch well down to FUV∼ 20.0, NUV∼ 20.5 for AIS, and FUV∼ 22.5, NUV∼ 22.0 for MIS. However, for the hot WDs, there isa mismatch of UV colours between the model and observation.A more detailed study is planned to explain the discrepancies bychanging the WD luminosity function and the scale lengths al-ternatively. A study is also going on to better constrain thethickdisc shape from large surveys in the visible and near-IR (Robinet al., in prep). We plan to further investigate the UV star countswith this revised model and the GALEX survey in the near fu-ture.
The Besancon model is also developed to predict star countsin the UV passbands of the forthcoming UVIT telescope to be
flown onboard ASTROSAT. We compared the model-predictedstar counts at two of the UVIT filters with that of the GALEX ob-served star counts because of the similar wavelength coverage ofboth the instruments. The UVIT-predicted star counts are sensi-tively different from the GALEX observed star counts due to thedifferences in effective wavelengths. UVIT star counts will bevery useful to separate out different stellar populations since theyhave several UV colours and better angular resolution comparedto GALEX, which in turn will help us to estimate the structuralparameters of the Galaxy with better precision.
Acknowledgements. The authors thank the anonymous referee for useful com-ments and suggestions that improved the content of the paper.
GALEX (Galaxy Evolution Explorer) is a NASA small explorer launchedin 2003 April. We gratefully acknowledge NASA’s support forconstruction,operation, and science analysis for the GALEX mission, developed in coop-eration with the Centre National d’Etudes Spatiales of France and the KoreanMinistry of Science and Technology. This work has made use ofthe data prod-ucts from the Wide-field Infrared Survey Explorer (WISE), Two Micron AllSky Survey (2MASS) and Sloan Digital Sky Survey (SDSS). We also thank theUVIT /ASTROSAT team for providing the UVIT filter response curves.
Simulations were executed on computers from the Utinam Institute of theUniversite de Franche-Comte, supported by the Region deFranche-Comte andInstitut des Sciences de l’Univers (INSU). We acknowledge the support of theFrench “Agence Nationale de la Recherche” under contract ANR-2010-BLAN-0508-01OTP. Many thanks to Bernard Debray who is responsible for providingthe web interface for the Besancon Galaxy model.
This work was fully or partially supported by the Gaia Research forEuropean Astronomy Training (GREAT-ITN) Marie Curie network, fundedthrough the European Union Seventh Framework Programme (FP7/2007-2013)under grant agreement No. 264895. J.J.V. is a fellow at the International MaxPlanck Research School for Astronomy and Cosmic Physics at the University ofHeidelberg.
ReferencesAihara, H., Allende Prieto, C., An, D., et al. 2011, ApJS, 193, 29Bahcall, J. N., & Soneira, R. M. 1980, ApJ, 238, 17Bahcall, J. N. 1986, ARAA, 24, 577Bell, E., Xue, X., & Rix, H. -W. 2010, AJ, 140, 1850Bianchi, L., Rodriguez-Merino, L., Viton, M., et al. 2007, ApJS, 173, 659Bianchi, L. 2009, Ap&SS, 320, 11Bianchi, L., Efremova, B., & Herald, J., et al. 2011a, MNRAS,411, 2770Bianchi, L., Herald, J., & Efremova, B., et al. 2011b, Ap&SS,335, 161Bianchi, L., Conti, A., & Shiao, B. 2013, J.Adv. Space Res., (in Press),
arXiv:1312.3281Brosch, N. 1991, MNRAS, 250, 780Budavari, T., Heinin, S., & Szalay, A. S., et al. 2009, ApJ, 694, 1281Cardelli, J. A., Clayton, G. C., & Mathis, J. S. 1989, ApJ, 345, 245Cohen, M., Saseen, T. P., & Bowyer, S. 1994, ApJ, 427, 848Deason, A., Belokurov, V., & Evans, N., et al. 2011, MNRAS, 416, 2903Du, C., Zhou, X., & Ma, J., et al. 2003, A&A, 407, 541Eggleton, P. P., Fitchett, M. J., & Tout, C. A., et al. 1989, ApJ, 347, 998Freeman, K. C. 1987, ARA&A, 25, 603Gilmore, G., & Reid, N. 1983, MNRAS, 202, 1025Gilmore, G., Wyse, R. F. G., & Kuijken, K. 1988, ARA&A, 27, 555Girardi, L., Groenewegen, M. A. T., Htziminaoglou, E., & da Costa, L. 2005,
A&A, 436, 895Guillout, P., Haywood, M., Motch, C., & Robin, A. C. 1996, A&A, 316, 89Haywood, M., Robin, A. C., & Creze, M. 1997, A&A, 320, 440Harris, H. C., Munn, J. A., & Kilic, Mukremin 2006, AJ, 131, 571Helmi, Amina 2008, A&ARv., 15, 145Hoard, D. W., Wachter, S., and Sturch, L. K. 2007, AJ, 134, 26Holberg, J. B., & Bergeron, P. 2006, AJ, 132, 1221Hubeny, I., & Lanz, T., 1995, ApJ, 439, 875Ivezic, Z., Beers, T. C., & Juric, M. 2012, ARA&A, 50, 251Juric, M., Ivezic,Z., & Brooks, A., et al. 2008, ApJ, 673, 864Kalirai, J. S., Hansen, B. M. S., & Kelson, D. D. 2008, ApJ, 676, 594Kapteyn, J. C. 1922, ApJ, 55, 302Kinman, T. D., Salim, S., & Clewey, L. 2007, ApJ, 662, L111Kleinman, S. J., Kepler, S. O., & Koester, D. 2013, ApJS, 204,5Koester, D. 2008, Mem. Soc. Astron. Ital., 75, 282Kumar, A., Ghosh, S. K., & Hutchings, J., et al. 2012a, Proc. SPIE 8443, 84434R,
on “Space Telescopes and Instrumentation 2012: Ultraviolet to Gamma Ray”
7

Pradhan et al.: A Model for the UV Star Counts of the Galaxy
Kumar, A., Ghosh, S. K., & Kamath, P. U., et al. 2012b, Proc. SPIE 8443,84431N, on “Space Telescopes and Instrumentation 2012: Ultraviolet toGamma Ray”
Majewski, S. R. 1993, ARA&A, 31, 575Marshall, D. J., Robin, A. C., & Reyle, C., et al. 2006, A&A, 453, 635Marigo, P., & Girardi L. 2007, A&A, 469, 239Martin, D. C., Fanson, J., & Schiminovich, D., et al. 2005, ApJ, 619, L1Morrissey, P., Schiminivoch, D., & Barlow, T. A., et al. 2005, ApJ, 619, L7Morrissey, P., Conrow, T., & Barlow, T. A., et al. 2007, ApJS,173, 682Phleps, S., Meisenheimer, K., Fuchs, B., & Wolf, C. 2000, A&A, 356, 108Ohlendorf, H., Preibisch, T., & Gaczkowski, B. 2013, A&A, 552, 14Pietrinferni, A., Cassisi, S., Salaris, M., & Castelli, F. 2004, ApJ, 612, 168Postma, J., Hutchings, J. B., & Leahy, D. 2011, PASP, 123, 833Richards, G. T., Fan, X., & Newberg, H. J., et al. 2002, AJ, 123, 2945Robin, A. C., & Creze, M. 1986, A&A, 157, 71Robin, A. C., Reyle, C., Derriere, S., & Picaud, S. 2003, A&A, 409, 523Robin, A. C., Marshall, D. J., Schultheis, M., & Reyle, C. 2012, A&A, 538, 106Santos, F. P., Roman-Lopes, A., & Franco, G. A. P. 2012, ApJ, 751, 138Schlegel, D.J., Finkbeiner, D.P., & Davis, M. 1998, ApJ, 500, 525Seibert, M., Budavari, T., & Rhee, J., et al. 2005, ApJ, 619,L23Sirko, E., Goodman, J., & Knapp, G. R., et al. 2004, AJ, 134, 2236Skrutskie, M. F., Cutri, R. M., & Stiening, R., et al. 2006, AJ, 131, 1163Todmal, S.S., Ghosh, S.K., Ojha, D. K., & Robin, A. C. 2010, ASI Conference
Series, Interstellar Matter and Star Formation : A MultiwavelengthPerspective, Vol. 1, pp. 245, ed. by D. K. Ojha
Vickers, J. J., Grebel, E. K., & Huxor, A. P. 2012, AJ, 143, 86Wademann, V. 2000, A&A, 363, 647Westera, P., Lejeune, T., & Buser, R., et al. 2002, A&A, 381, 524Wright, E. L., Eisenhardt, P. R. M., & Mainzer, A. K., et al. 2010, AJ, 140, 1868Xu, C. K., Donas, J., & Arnouts, S., et al. 2005, ApJ, 619, L11Yanny, B., Newberg, H. J., & Kent, S., et al. 2000, ApJS, 540, 825
8
Pradhan et al.: A Model for the UV Star Counts of the Galaxy
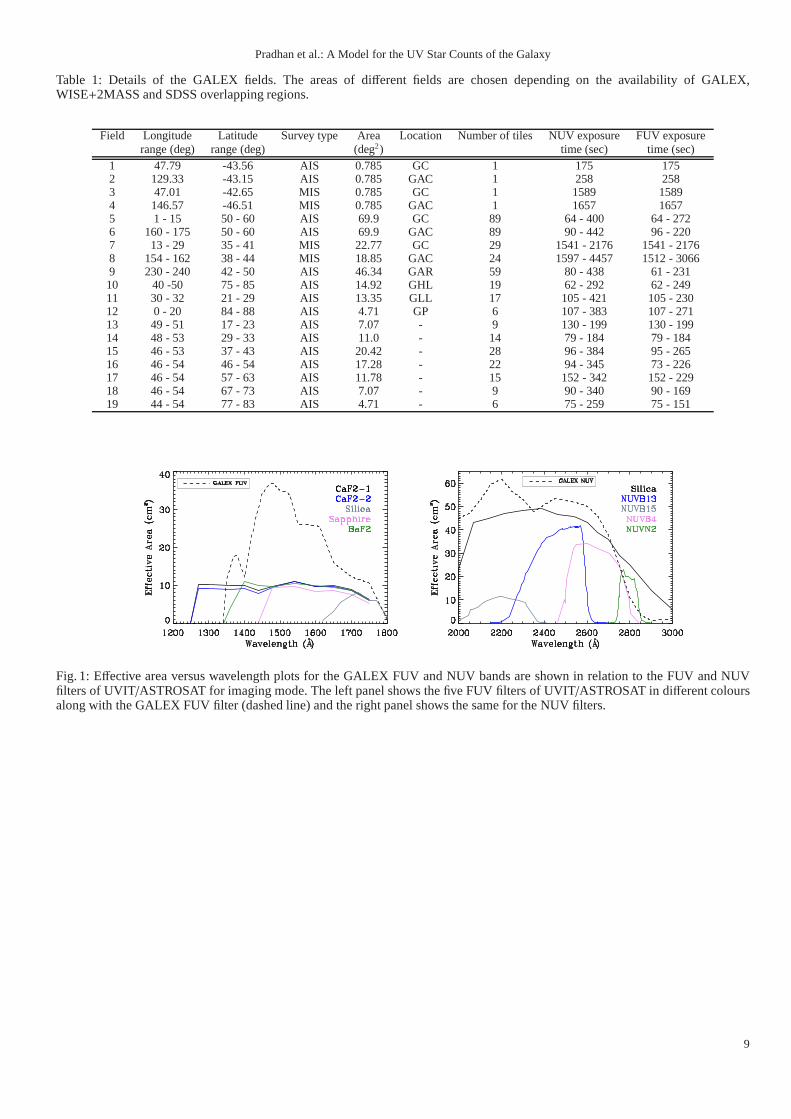
Table 1: Details of the GALEX fields. The areas of different fields are chosen depending on the availability of GALEX,WISE+2MASS and SDSS overlapping regions.
Field Longitude Latitude Survey type Area Location Number of tiles NUV exposure FUV exposurerange (deg) range (deg) (deg2) time (sec) time (sec)
1 47.79 -43.56 AIS 0.785 GC 1 175 1752 129.33 -43.15 AIS 0.785 GAC 1 258 2583 47.01 -42.65 MIS 0.785 GC 1 1589 15894 146.57 -46.51 MIS 0.785 GAC 1 1657 16575 1 - 15 50 - 60 AIS 69.9 GC 89 64 - 400 64 - 2726 160 - 175 50 - 60 AIS 69.9 GAC 89 90 - 442 96 - 2207 13 - 29 35 - 41 MIS 22.77 GC 29 1541 - 2176 1541 - 21768 154 - 162 38 - 44 MIS 18.85 GAC 24 1597 - 4457 1512 - 30669 230 - 240 42 - 50 AIS 46.34 GAR 59 80 - 438 61 - 23110 40 -50 75 - 85 AIS 14.92 GHL 19 62 - 292 62 - 24911 30 - 32 21 - 29 AIS 13.35 GLL 17 105 - 421 105 - 23012 0 - 20 84 - 88 AIS 4.71 GP 6 107 - 383 107 - 27113 49 - 51 17 - 23 AIS 7.07 - 9 130 - 199 130 - 19914 48 - 53 29 - 33 AIS 11.0 - 14 79 - 184 79 - 18415 46 - 53 37 - 43 AIS 20.42 - 28 96 - 384 95 - 26516 46 - 54 46 - 54 AIS 17.28 - 22 94 - 345 73 - 22617 46 - 54 57 - 63 AIS 11.78 - 15 152 - 342 152 - 22918 46 - 54 67 - 73 AIS 7.07 - 9 90 - 340 90 - 16919 44 - 54 77 - 83 AIS 4.71 - 6 75 - 259 75 - 151
Fig. 1: Effective area versus wavelength plots for the GALEX FUV and NUVbands are shown in relation to the FUV and NUVfilters of UVIT/ASTROSAT for imaging mode. The left panel shows the five FUV filters of UVIT/ASTROSAT in different coloursalong with the GALEX FUV filter (dashed line) and the right panel shows the same for the NUV filters.
9
Pradhan et al.: A Model for the UV Star Counts of the Galaxy
Fig. 2: The diagrams showJ (2MASS)−W1 (WISE) versus NUV CMD for the GALEX and WISE+2MASS cross-matched sourcesfor the AIS fields towards the GC and the GAC. The matched sources are clearly separated in two groups indicating isolationofstars (J − W1 < 1.2) from the extra-galactic sources (J − W1 > 1.2). The vertical dashed line shows the limit that we chooseforselecting the point sources (J −W1 < 1.2). QSOs are shown by blue crossed symbols (see the text).
Fig. 3: Distribution of the UV-IR stars as a function of the GALEX NUV and FUV magnitudes for AIS and MIS. The stellar sourcesobtained after applying various magnitude error cuts are shown by different line styles in colours. The vertical dashed lines representthe respective 5σ detection limits of the GALEX bands for typical exposure times as mentioned in Section 2.
10

Pradhan et al.: A Model for the UV Star Counts of the Galaxy
Fig. 4: Distribution of the UV-IR stars (GALEX+WISE+2MASS : dashed-dotted line), GALEX+SDSS stars (dashed line) andmodel-simulated star counts (solid line) for the AIS field towards the GC covering 69.9 deg2 of the sky (field 5 in Table 1). Thedotted line represents the GALEX+WISE sources with no 2MASS counterparts. The star counts arebinned in 0.5 magnitude intervalin NUV magnitude. The error bars in the model-simulated starcounts are due to Poisson noise. The NUV 5σ detection limit (NUVmagnitude= 20.8) is shown by a solid vertical line. The UV-IR star countsshow a turn over at NUV magnitude∼ 20.5 (demarcatedby a dashed vertical line).
11

Pradhan et al.: A Model for the UV Star Counts of the Galaxy
(a) (b)
(c) (d)
Fig. 5: Comparison of the UV-IR stars (solid circles) with model-predictions (solid line) as a function of NUV magnitudes for theregions at the southern intermediate Galactic latitudes. The open circles represent the GALEX+SDSS stars. The plots are for thefields towards the GC and the GAC for individual GALEX AIS and MIS tiles, each covering an area of 0.785 deg2 (fields 1-4 inTable 1). The error bars shown in the model star counts are dueto Poisson noise, while the asymmetric errors in the observed starcounts are not shown in the plot.
12
Pradhan et al.: A Model for the UV Star Counts of the Galaxy
(a) (b)
(c) (d)
Fig. 6: Comparison of the model-predicted star counts (solid line) with the UV-IR stars (solid circles) as well as with theGALEX+SDSS stars (open circles) for the GALEX fields at the northernintermediate Galactic latitudes. The Galactic coordi-nate ranges, survey types and area coverages are mentioned in each panel. The dashed-dotted line shows the model-simulated starcounts for the NUVB4 band of UVIT/ASTROSAT (2505 - 2780 Å,λeff = 2612 Å). The error bars shown in the model counts aredue to Poisson noise.
13

Pradhan et al.: A Model for the UV Star Counts of the Galaxy
(a) (b)
(c) (d)
Fig. 7: Comparison of model-predictions (solid line) with the UV-IR stars (solid circles) and GALEX+SDSS stars (open circles) asa function of the GALEX NUV magnitude for the regions at the GHL (7a), the GP (7b), the GAR (7c) and the GLL (7d). In plot 7d,the solid line represents the model NUV star counts producedassuming the standard diffuse extinction (as in other fields) whereasthe dashed line is the same after correcting the extinction using the value from the Schlegel et al. (1998) maps (see Section 5). Themodel error bars shown in the plots are due to Poisson noise.
14
Pradhan et al.: A Model for the UV Star Counts of the Galaxy
Fig. 8: Distribution in FUV magnitudes of the UV-IR stars (solid circles) and model-predicted (solid line) star counts for the AISand MIS fields towards the GC and the GAC (fields 5 - 8 in Table 1).The dashed-dotted line represents FUV star counts for theBaF2 band of UVIT/ASTROSAT (1350 - 1750 Å,λeff = 1504 Å). The FUV magnitudes are binned in intervals of 0.5. The modelerror bars shown in the plots are due to Poisson noise.
Fig. 9: The latitude variation of NUV star counts (per deg2) for both the observation and model simulation atl ∼ 50◦. The UV-IRstars, GALEX+SDSS stars and model-predicted star counts are representedby solid circles, open circles and solid line, respectively.The UV-IR stars and the GALEX+SDSS stars shown in the plot are for NUV magnitude errors< 0.2. The error bars displayed inthe model star counts are due to Poisson noise. The asymmetric errors in the UV-IR star counts which arise due to the propagationof photometric errors are not shown.
15

Pradhan et al.: A Model for the UV Star Counts of the Galaxy
Fig. 10: Comparison of NUV star counts predicted by the Besancon (solid line) and TRILEGAL (dashed-dotted line) modelsofstellar population synthesis for the fields towards the GHL and the GAR. The solid circles represent the UV-IR stars. The Besanconmodel error bars shown in the plots are due to Poisson noise.
Fig. 11: The left panel represents the distribution of various stellar populations produced by the Besancon model of stellar popula-tion synthesis in the direction of GC. Different lines are explained in the legend. Similarly, the right panel represents the verticaldistribution of the stellar populations in the same direction as the left panel.
Fig. 12: Comparison ofFUV −NUV colour between the model-predicted star counts (solid line) and the UV-IR stars (solid circles)for the AIS fields towards the GC and the GAC (fields 5 - 6 in Table1). The UV colours shown are for the stars with FUV< 20.0magnitude, NUV< 20.5 magnitude and the photometric errors< 0.2 (in both FUV and NUV bands).FUV − NUV colours of themodel-predicted WDs and BHBs are shown by a dotted line and a long-dashed line, respectively. The UVIT (BaF2− NUVB4)colour coverage is indicated by a dashed line.
16

Pradhan et al.: A Model for the UV Star Counts of the Galaxy
(a) (b)
Fig. 13: a) (J − K)0 versus (NUV − J)0 colour-colour diagram for the BHB candidates of the combined AIS fields given in Table1. The parallelogram encloses the area occupied by the BHB samples of Kinman et al. (2007). The sources at various latitudes arerepresented by different symbols. b)H − K versusJ − H colour-colour diagram for the WD candidates of the combinedAIS fieldsin Table 1. The dashed line rectangle encloses the area used from Hoard et al. (2007). A reddening vector (the arrow) of AV = 1magnitude and the mean error bars of the colours are displayed in both the diagrams.
17