a strategic approach to effectively manage supplier
TRANSCRIPT

University of Arkansas, FayettevilleScholarWorks@UARK
Theses and Dissertations
12-2014
A Strategic Approach to Effectively ManageSupplier Quality within the Construction IndustryRufaidah AlMaianUniversity of Arkansas, Fayetteville
Follow this and additional works at: http://scholarworks.uark.edu/etd
Part of the Construction Engineering and Management Commons, and the IndustrialEngineering Commons
This Dissertation is brought to you for free and open access by ScholarWorks@UARK. It has been accepted for inclusion in Theses and Dissertations byan authorized administrator of ScholarWorks@UARK. For more information, please contact [email protected], [email protected].
Recommended CitationAlMaian, Rufaidah, "A Strategic Approach to Effectively Manage Supplier Quality within the Construction Industry" (2014). Thesesand Dissertations. 2134.http://scholarworks.uark.edu/etd/2134

A Strategic Approach to Effectively Manage Supplier Quality within the Construction Industry

A Strategic Approach to Effectively Manage Supplier Quality within the Construction Industry
A dissertation submitted in partial fulfillment of the requirements for the degree of
Doctor of Philosophy in Industrial Engineering
by
Rufaidah Y. AlMaian Kuwait University
Bachelor of Science in Industrial & Management Systems Engineering, 2005 University of Pittsburgh
Master of Science in Industrial Engineering, 2011
December 2014 University of Arkansas
This dissertation is approved for recommendation to the Graduate Council.
Dr. Kim LaScola Needy Dissertation Director
Dr. Thaís da C. L. Alves Committee Member
Dr. Heather Nachtmann Committee Member
Dr. Edward A. Pohl Committee Member
Dr. John A. White Committee Member

ABSTRACT
The aim of the research is to determine the best practices for supplier quality management
(SQM) in the construction industry that ensure that the supplied materials and equipment for
construction projects are within the quality requirements. The research is based on three main
objectives. The first objective is to describe and assess the process of assuring supplier quality
inside and outside the construction industry. The second objective is to develop a framework for
the supplier quality process based on the collection of SQM practices from multiple data sources.
The third objective is to assess the SQM practices within the developed framework of supplier
quality process, and to discuss the development of strategic leadership for SQM.
The contribution of this research can be used by stakeholders in the construction industry to
improve SQM within their organizations. Researchers can also benefit from this research to
better understand SQM practices within the construction industry.
The findings of the research show that SQM practices outside the construction industry appear to
be similar to the existing practices within the construction industry. However, construction
organizations with highly effective SQM systems implement the SQM practices more
consistently, as compared to the other organizations. Also, construction organizations with
highly effective SQM systems focus on quality when selecting their suppliers, and hold joint
quality planning with their suppliers because these practices have high impact on quality and are
easy to implement. Finally, the research shows that having a quality director that helps create a
quality culture for SQM is very important to strategically lead SQM within construction
organizations.

ACKNOWLEDGMENTS
This dissertation is dedicated to my parents for their countless support and positive impact on my
whole life. Without them, I would never be where I am today. I am grateful to my husband, for
his strength, support, encouragement, and sacrifice. I can never find enough words to express my
gratitude and appreciation to him. My special thanks to my mother in-law for her support and
encouragement in the good and tough days. I also would like to thank my daughter who has
brought great joy to my life. This dissertation, and my graduate study, could not have been
accomplished without being encouraged by my great family. My deepest appreciation goes to
them.
I would like to express my gratitude to my advisor, Kim LaScola Needy, for her ultimate support
and guidance throughout my doctorate study. Being advised and mentored by her was a
wonderful experience. I cannot thank her enough.
I would like also to thank my committee members: Thaís Alves, for her excellent contribution to
improve this work; Edward Pohl and Heather Nachtmann for providing their assistance and
advice for completing this work; and John A. White for advancing my knowledge in leadership
through his leadership class.
My thanks go also to the faculties and staff of the Department of Industrial Engineering at the
University of Arkansas for providing a wonderful academic environment.
I would like to acknowledge and especially dedicate this dissertation in the memory of my father
in-law, Khaled, who had been supporting me with ultimate encouragement during my graduate
study.
TABLE OF CONTENTS
1. INTRODUCTION …………………………………………………………………….… 1
Research Objectives……………………………………………………………………… 3
Dissertation Format ...……………………………………………………………………. 3
Research Motivation …………………………………………………………………….. 5
Research Methodology ………………………………………………………………….. 9
Research Contributions .…………………………………………………………...…… 12
References …………………………………………………………………………….... 16
2. SUPPLIER QUALITY MANAGEMENT WITHIN AND OUTSIDE THE
CONSTRUCTION INDUSTRY
Abstract ……………………………………………………………………….……….. 18
Keywords ……………………………………………………………………………… 19
Introduction …………………………………………………………………….…….... 19
The Construction Industry and Supplier Quality Management ..……………………… 20
Literature Review Methodology ………………………………………………………. 23
Suppler Quality Management Inside the Construction Industry ..…………………….. 28
Supplier Quality Management Outside the Construction Industry ..………………….. 34
Literature Findings from Inside and Outside the Construction Industry ……………… 44
Conclusions …………………………………………..………………………….…...... 47
Implications for the Engineering Manager …………………………………………….. 49
Limitations and Future Work ………………………………………………………….. 50
References ……………………………………………………………………………... 51

3. A QUALITATIVE DATA ANALYSIS FOR SUPPLIER QUALITY MANAGEMENT
PRACTICES WITHIN THE CONSTRUCTION INDUSTRY
Abstract ………………………………………………………………………………… 57
CE Database Subject Headings ………………………………………………………… 58
Keywords ………………………………………………………………………………. 58
Introduction …………………………………………………………………………….. 58
Background on EPC Supply Chain …………………………………………………….. 60
Qualitative Data Analysis ……………………………………………………………… 62
Research Methodology …………………………………………………………….….. 65
Results Discussion ………………………………………………………………….….. 82
Conclusions …………………………………………………………………………..... 85
Acknowledgements ……………………………………………………………………..86
References ……………………………………………………………………………... 86
Appendix ………………………………………………………………………………. 89
4. ANALYZING SUPPLIER QUALITY MANAGEMENT PRACTICES IN THE
CONSTRUCTION INDUSTY USING PRINCIPAL COMPONENETS ANALYSIS
Abstract ………………………………………………………………………………… 92
Keywords ………………………………………………………………………………. 93
Introduction …………………………………………………………………………….. 93
Research Motivation …………………………………………………………………… 96
Research Methodology …………………………………………………………….….. 97
PCA Implementation ………………………………………………………………....... 99
Results Discussion ………………………………………………………………….… 102

Conclusion and Future Work ………………………………………………………... 106
References ………………………………………………………………………….... 109
5. USING THE BALANCED SCORECARD TO IMPLEMENT EFFECTIVE SUPPLIER
QUALITY MANAGEMENT PRACTICES IN THE CONSTRUCTION INDUSTRY
Abstract ……………………………………………………………………………… 112
CE Focus Area …………………………………………………………………….… 113
Keywords ……………………………………………………………………………. 113
Introduction ………………………………………………………………………….. 113
Research Motivation …………………………………………………….…………... 115
Overview of Research Data Sources ……………………………………………..….. 117
Cross Validation of the Research Findings ………………………………………..... 124
The Balanced Scorecard (BSC) Framework for SQM Practices ……………………. 128
Validating the BSC ………………….………………….…..……………….………. 132
Conclusions ………………………………………………………………………….. 133
Research Limitations and Future Work ……………………………………..……..... 134
Acknowledgements ………………………………………………………………….. 134
References …………………………………………………………………………… 135
6. ANALYZING EFFECTIVE SUPPLIER QUALITY MANAGEMENT PRACTICES USING
SIMPLE MULTI-ATTRIBUTE RATING TECHNIQUE (SMART) AND VALUE
FOCUSED THINKING (VFT)
Abstract ………………………………………………………………………………. 137
Keywords …………………………………………………………………………….. 138
Introduction ……………………………………………………………………….….. 138

Research Motivation …………………………………………………….…………….. 141
Research Methodology ………………………………………………….…………….. 143
Research Methodology Implementation ……………………………….…………….. 147
Conclusions ………………………………………………………………………….... 165
Acknowledgements …………………………………………………………………… 167
References …………………………………………………………………………….. 167
APPENDIX I ………………………………………………………………………….. 171
APPENDIX II …………………………………………………………………………. 172
7. CONCLUSION …………………………………………………………………...….... 173
Research Findings ………………………………………………………………..….... 174
Research Limitations ……………………………………………………………..….... 179
Future Work ……………..…………………………………………………………...... 181
References ……………..…………………………………………………………..…... 184
APPENDIX I. Structured Interview …………………………………………………... 185
APPENDIX II. Supplier Quality Practices and performance Instrument for Purchase Order
Data ..................................................................................................................................187
APPENDIX III. IRB Approval …...…………………………………………..……….. 194
APPENDIX IV. Supplier Quality Process Map ……………………………………….. 195
APPENDIX V. Multi-Author Documentation ..……………………………………….. 196

LIST OF PAPERS
Chapter 2
AlMaian, R. Y., Needy, K. L., Walsh, K. D., & Alves, T. (2014). Suppler quality management inside and outside the construction industry. Submitted to The Engineering Management Journal (under second review).
Chapter 3
AlMaian, R. Y., Needy, K. L., Walsh, K. D., & Alves, T. (2014). A Qualitative data analysis for supplier quality management practices in the construction industry. Submitted to The Journal of Construction Engineering and Management (Received a decision to revise for re-review).
Chapter 4
AlMaian, R. Y., Needy, K. L.,Walsh, K. D., & Alves, T. (2014). Analyzing supplier quality management practices in the construction industry using principal components analysis. In preparation for submission to The Quality Engineering Journal.
Chapter 5
AlMaian, R. Y., Needy, K. L., Alves, T., & Walsh, K. D. (2014).Using the balanced scorecard to implement effective supplier quality management practices in the construction industry. Submitted to The Journal of Management in Engineering (under review).
Chapter 6
AlMaian, R. Y., Needy, K. L., Alves, T., & Walsh, K. D. (2014). Analyzing effective supplier quality management practices using Simple Multi-Attribute Rating Technique (SMART) and Value Focused Thinking (VFT). Submitted to The Journal of Management in Engineering (under review).

1
1. INTRODUCTION
This research is part of the RT (Research Team) 308 project entitled Achieving Zero Rework
through Effective Supplier Quality Practices supported by the Construction Industry Institute
(CII). This project involves a collaborative endeavor between the Department of Industrial
Engineering at the University of Arkansas and the Department of Civil, Construction, and
Environmental Engineering at San Diego State University. The research team also includes a
group of subject matter experts (SMEs) from the construction industry, primarily the engineer-
procure-construct (EPC) industry, representing their member organizations in the CII as
construction owners, contractors, and suppliers. Each SME brought an average 35 years of
experience in the local and global construction market to the research project. In total, 21
organizations specializing in EPC projects participated in this research project. These
organizations have each been in the construction industry for more than 70 years, and each have
on average about 25,000 employees located across the globe with headquarters in the U.S., Asia,
and Europe. The portfolio of projects in which these organizations are engaged range from
600,000 to 10 billion U.S. dollars. In addition to the 21 organizations who participated in this
project, nine supplying companies (suppliers) provided important information regarding their
supplier systems. These suppliers have each been active in the EPC industry for an average of 49
years. These nine suppliers range in size, with a number of employees ranging from 90 to 9,000,
and annual sales ranging from 60 to 3 billion U.S. dollars. Collectively, these SMEs and
suppliers brought forth a tremendous wealth of expertise to the research project.
The major research question under study for RT 308 was as follows: “What are the most effective
processes and practices for ensuring that project materials and equipment are produced,

2
manufactured, or fabricated in strict accordance with all applicable specifications, and that they
are delivered to the project site without any need for rework?”
This dissertation research evaluates supplier quality management (SQM) practices in the
construction industry and from diverse industries by using multiple data sources. The purpose of
the evaluation is to identify effective SQM practices that ensure that the supplied materials to
construction projects meet the specified level of quality and to promote areas for improving
current SQM processes within construction organizations.
The findings of the research show that SQM practices outside the construction industry appear to
be similar to the existing practices within the construction industry, such as partnerships with
suppliers, and management commitment to improve and support SQM. However, some of the
construction organizations are currently not implementing the SQM practices in a consistent
manner, such as measuring suppliers’ performance and providing feedback to them. In general,
construction organizations with highly effective SQM apply SQM practices more consistently
and place higher importance on quality planning with higher involvement from top management
as compared to other organizations with moderately and least effective SQM. The assessment of
the SQM practices from the organizations with highly effective SQM that were identified from
multiple data sources show that not all the practices have a similar impact on quality nor are easy
to implement. The research shows that using a detailed formula to calculate the efforts of
supplier surveillance, updating the project materials specifications and requirements, focusing on
quality versus price or schedule, and holding joint quality planning have high impact on quality
and are easy to implement. Finally, the research shows that in order to effectively implement the
SQM practices within construction organizations, it is necessary to have a quality director who
manages the efforts and oversees the work to strategically lead SQM.

3
The contribution of this research can be used by stakeholders in the construction industry to
improve the existing SQM practices within their organizations. Researchers can also benefit
from this research to better understand SQM practices within the construction industry.
Research Objectives
The research aim is to determine the effective practices for SQM in the construction industry to
ensure that the supplied materials are produced and fabricated without any need for rework. The
dissertation also identifies the practices that develop a strategic leadership for SQM.
This dissertation research has three main objectives. The first objective is to describe and assess
the process of assuring supplier quality inside and outside the construction industry. The second
objective is to develop a framework for the supplier quality process based on the collection of
SQM practices from multiple data sources. The third objective is to assess the SQM practices
within the framework of supplier quality process, and to discuss the development of strategic
leadership for SQM.
Dissertation Format
The dissertation format utilizes the “three-paper model” supported by the University of Arkansas
Graduate School. This dissertation consists of five chapters representing publishable papers, and
two other chapters representing the introduction chapter of the research and a final chapter for
conclusions.
Chapter 1 introduces the research objectives and motivation, and describes the research structure
and methodology. This chapter also discusses the contributions of the research effort.

4
Chapter 2 presents findings from the scholarly literature of the diverse approaches for SQM in
the construction industry, and from other industries such as healthcare, manufacturing, aerospace
and food. The objective of examining the literature was to recognize practices that can be useful
to the construction industry, such as supplier partnerships and product life cycle management.
Chapter 3 contains an investigation of SQM practices currently practiced in construction
organizations. The aim of the investigation is to identify effective practices that construction
organizations can borrow to improve the existing SQM.
Chapter 4 describes the use of principal components analysis (PCA) to analyze a small sample
size and multivariate data. The aim is to quantitatively identify most important practices for
SQM.
Chapter 5 describes the development and validation of a balanced scorecard (BSC) framework
used to organize SQM practices and help construction organizations effectively implement these
practices within their projects. The proposed BSC provides a basis for implementing and
measuring the SQM practices in order to compare the performance across multiple projects and
to provide opportunities for continuous improvement.
Chapter 6 describes the work performed in analyzing the SQM practices aligned within the BSC
in terms of their impact on quality and ease of implementation. This chapter also describes
important leadership principles from the literature, and derives important leadership objectives
and practices for developing strategic leadership for SQM.
Chapter 7 presents the conclusion of the research efforts and the suggested future work.

5
Research Motivation
Within the construction industry, SQM is a system of processes and practices applied by the
project organization to ensure that the quality of fabricated materials and equipment meet the
project's requirements and specifications (Caldas et al., 2012). SQM in the construction industry
is complex due to the unique characteristic of each project in terms of its size and life cycle. In
addition, each project is supported by a broad and global supply chain involving multiple
independent contractors, subcontractors and suppliers. It is challenging throughout the execution
of the construction project to ensure that the required equipment, products and materials are
produced and delivered to the worksite without any need for rework. Moreover, construction
projects are expensive, take a long time to be completed, interfere with the surrounding
environment, and are built by dispersed teams and suppliers in a project-based fashion where
participants might never have worked with each other before and might never work together
again. In addition, construction projects are assembled at their final location making their
production nomadic (the “factory” is installed where the product will be built). The product is
built to fit the environment and often cannot be relocated, and workers move around the product
(as contrasted from assembly lines where the product is most often brought to the worker). All of
these conditions define the construction industry and profoundly interfere with processes used to
deliver its products, and assure their quality.
Researchers have examined the distinctive nature of the construction industry projects, in which
the owner, contractors, subcontractors, and suppliers work together for a specified period of time
to complete the project and then move on to work on other projects (Caldas et al., 2012). Singh
& Tiong (2005, pg. 62) identified that

6
“The construction industry is characterized by cost and duration overruns, serious problems in quality standards and safety measures, and an increased number of claims, counterclaims, and litigation. Furthermore, the peculiarity of construction is that no two projects are identical in terms of site conditions, design, use of construction materials, labor requirements, and equipment requirements, construction methods, technical complexity, and level of management skill required.”
Jongwoo (2009) determined that construction projects are dynamic and irregular in nature. Also,
a typical construction project might involve several purchase orders for thousands of unique
items that increase problems of matching and standardization, supplier quality tracking, and
fabrication quality errors (Neuman et al., 2014).
Quality is an important aspect in construction projects. Sullivan (2011) believed that quality
cannot be addressed by isolated departments and organizations, but rather it must be designed
through the entire system. Furthermore, the ability to produce a quality product in the
construction process depends on the relationship between the parties involved (Burati Jr. et al.,
1992).
Poor SQM will impact the overall quality of the project leading to rework, cost overrun, schedule
delays, and other negative consequences related to business reputation. Rogge et al. (2001)
determined that high levels of rework disturb schedule targets, reduce productivity, increase cost,
and affect quality. Love (2002) and Love & Smith (2003) identified that the major area that
contributes to poor organization and project performance is rework.
This dissertation analyzes and describes data collected from important parties within
construction projects including owners, contractors, and suppliers in order to identify
opportunities for improving the existing SQM. The research effort also seeks to describe and
identify the effective SQM approaches within the construction project life cycle that help
reducing rework and other quality problems caused by poor SQM.

7
The dissertation consists of three objectives to be achieved through the research efforts. The first
objective is to describe and assess SQM inside and outside the construction industry. The
motivation of this assessment is that the construction industry develops its products and activities
in a project-based fashion, which is the case for many other industries and organizations, e.g.,
shipbuilding, aerospace, production of one-of-a-kind and engineered-to-order products, and
engineering projects in general. The SQM assessment can help to identify approaches that could
be beneficial to the construction industry such as supplier partnerships, and product life cycle
management, and determine how these approaches might be adapted to the construction industry.
Also, the research effort to achieve the first objective of the dissertation includes in-depth
analysis of the current SQM applied by construction organizations within the EPC projects. The
purpose of this analysis is that most construction organizations, representing owners and
contractors, place high importance on documenting and tracking the quality performance of their
suppliers as part of their SQM to improve the quality of the supplied products. However, these
organizations still face problems with their SQM evidenced by the large number of rework tasks
for the supplied products within the EPC projects. Yeo & Ning (2002) identified that within the
EPC projects, the actions are interdependent, the work is split into many units leading to a
compound organizational structure, and the unsteady environment compels recurrent changes.
This highlights the importance of examining the current SQM practices to explore effective
SQM practices to deliver products with the expected level of quality.
In addition, the research effort to achieve the first objective involves a quantitative analysis for
SQM practices based on limited number of observations obtained from a data collection
instrument. Many construction organizations place high importance on using quantitative
analyses to select the effective SQM practices that ensure that the materials and fabricated
8
equipment for the construction project are within quality specifications. However, traditional
quantitative analyses methods may be limited because the process of acquiring enough data to
conduct the analysis is time consuming and costly. Also, the availability of data to analyze SQM
practices is a challenge as construction organizations keep details related to SQM indicators and
practices scattered within different departments and within different data collection systems
(Walsh et al., forthcoming 2014). The research effort suggests using a quantitative analysis
method for small and multivariate data to find the most important SQM practices.
The research findings include proposing a framework for SQM to align the effective SQM
practices that span the project life cycle. The framework can be used within SQM as a basis for
implementing the practices and for performance measurement. Kagioglou et al. (2001)
determined that supplier performance management in the project environment is poorly studied
in the construction industry literature. Needy & Ries (2010) identified that the use of consistent
quality management practices and quality metrics across the project life cycle form the
foundation of effective quality management in the construction industry. Proposing a framework
for SQM implementation and performance measurement may help organizations to assess their
performance in multiple projects. If this assessment is extended to the organizational level,
additional useful lessons can be learned and continuous improvement can be achieved (Costa et
al., 2006).
Effective SQM practices are important to improve supplier quality, but not all practices have a
similar impact on quality or are they easy to implement. This provides motivation to further
study and assess these practices thereby assisting construction organizations with focusing on the
key practices and to simplify implementing them within construction projects. Hoskisson et al.
(2009) indicated that organizations must select and asses the practices and strategies that add

9
value to the organization and promote improvements. The research also includes a description
and analysis of leadership practices that are important for developing strategic leadership for
SQM within the construction industry. Strategic leadership includes the process of forming a
vision for the future, communicating it to subordinates, motivating followers, and engaging in
strategy-supportive activities with subordinates (Elenkov et al., 2005). Strategic leadership is
crucial for achieving and maintaining continuous improvement (Vera, & Crossan, 2004).Within
the construction industry, Isik, et al. (2010) concluded that leadership strategic plans and
decisions have direct influence on the company’s performance and project success. Goodman &
Chinowsky (1997) determined that construction organizations should create an environment that
facilitates leadership and ensures strategic thinking. However, the subject of leadership has
limited focus within the construction literature (Toor & Ofori, 2008). The lack of focus on
leadership in the construction industry is prevalent not only in academic research but also in
practice (Chan & Chan, 2005). This dissertation describes objectives and practices that are
necessary for effective implementation of SQM, and important for long-term improvement for
SQM within the construction organizations.
Research Methodology
For this research, the main data collection sources are:
1. Literature review,
2. SQM documents (including reports and procedures) from the participating owners and
contractors organizations,
3. Structured interviews with contractors,
4. Supplier focus groups,

10
5. Supplier Quality practices and performance instrument for purchase order (PO) data (PO
instrument), and
6. Inspection cost data.
Figure 1 describes the data collection sources.
Figure 1: Data collection sources
The dissertation effort focuses on analyzing the literature, structured interviews, SQM
documents, and supplier focus groups, and uses the PO instrument and inspection cost data to
describe important effective SQM practices. The leading research effort for these two data
sources, i.e., PO instrument and inspection cost data, are described in details in Neuman (2014)
and Ahmad (2014) respectively. The structured interview and PO instrument appear in Appendix
I and II, respectively for reference. Institutional Review Board (IRB) approval has been obtained
and also appears in Appendix III. This research has resulted in five publishable journal papers
that are at various stages of review as depicted in Table 1. In addition, three refereed conference
papers and one presentation have resulted from this work to date.
Data collec)on sources
Literature Review
Inside the construc)on industry
Outside the construc)on industry
SQM documents
Reports
Procedures
Structured interviews
Supplier quality organiza)on
Supplier quality system
Metrics-‐ assessment-‐ documents-‐ suppliers
Supplier focus groups
Local suppliers
PO instrument
Tagged/ engineered equipment
Fabricated goods
Manufactured/ bulk materials
Inspec)on cost data
Non-‐quality cost es)ma)on
Supplier performance predic)on

11
Contribution 1 2 3 4 5 Dissertation
chapter Chapter 2 Chapter 3 Chapter 4 Chapter 5 Chapter 6
Contribution title
Supplier quality
management inside and outside the
construction industry
A qualitative data analysis for supplier quality
management practices within the construction
industry
Analyzing effective
supplier quality management
practices using principal
components analysis
Using the balanced
scorecard to implement
effective supplier quality
management practices in the
construction industry
Analyzing effective supplier
quality management using
simple multi-attribute rating
technique (SMART) and value focused
thinking (VFT)
Data type Qualitative Qualitative Quantitative Quantitative and qualitative
Quantitative and qualitative
Data sources Literature
Supplier quality management
(SQM) documents, structured interviews
PO instrument
Literature, SQM documents,
Interviews, PO instrument,
supplier focus groups,
inspection data
Literature, SQM documents,
interviews, PO instrument,
supplier focus groups, inspection
data
Research methodology
Literature review
taxonomy
Grounded theory
Principal components
analysis (PCA), and analytic
hierarchy process (AHP)
Cross analysis ,and balanced
scorecard (BSC)
Simple multi-attribute rating
technique (SMART), and value focused
thinking (VFT)
Objective Describe and assess the process of supplier quality
Develop a framework for
the supplier quality process
Assess the SQM practices within the developed framework of
supplier quality process, and to
discuss the development of
strategic leadership for
SQM. Table 1: Summary of the dissertation publishable papers and data
The research includes the use of a supplier quality (SQ) process map that captures the main
phases as shown in Figure 2. The detailed description can be found in Alves et al. (2013). The
map contains five major processes beginning with planning and selection of the suppliers. Next,
execution (of the fabrication along with the development of a supplier quality plan) followed by
release from shop for completed purchase orders (POs), i.e., packages of fabricated products.
Finally, the map depicts the receipt at site of those products, and mechanical completion

12
representing the stage when products are physically connected in place in the facility, which
marks the end of the scope of analysis for this research. Feedback loops are embedded at each
step within the process to indicate that occasionally information flows upstream to inform
previous activities about their performance. The detailed map is shown in Appendix IV.
Figure 2: Supplier quality (SQ) process map. Adapted from Alves et al. (2013).
The SQ process map is used within the discussion of the research publishable papers to define
the main stages of the SQ process, cross analyze the SQM practices identified from the data
sources linking them to the stages of the process map, and also to describe when within the
project life cycle these practices can be implemented.
Research Contributions
The contributions of the research include exploring SQM practices inside and outside the
construction industry and investigating the current SQM practices from construction
organizations to identify the effective practices that ensure the quality of the supplied products.
The contributions also involve proposing a framework for implementing the identified effective
SQM practices, and assessing those practices within the proposed framework to simplify the
implementation process. In addition, the research contributions include examining important
leadership principles from the literature that help in developing strategic leadership for SQM
within the construction industry.

13
The dissertation includes five publishable papers reflecting five main contributions. The
contribution of the first paper, presented in Chapter 2, involves investigating the practices of
SQM inside and outside the construction industry by using literature review taxonomy. The
investigation is beneficial to the construction and engineering management by increasing the
knowledge of effective SQM practices within the construction industry and within other
industries with similar production complexities. Engineering professionals can benefit from these
findings by not limiting the investigation to a particular industry. By learning about practices
from diverse industries, engineering professionals can use these practices to improve the current
SQM in any project.
The second contribution in chapter 3 includes investigating the current SQM practices from
construction organizations by using qualitative data analysis techniques of grounded theory. The
research can benefit academic researchers and professionals in construction management by
helping them learn about qualitative data analysis techniques, because several sources of
information (data) within construction projects are in qualitative forms such as inspection
reports, suppliers’ bids, and request for information reports. These data can be interpreted and
presented to management using qualitative data analysis techniques to help examine important
relationships among the data, thus conclusions can be easily drawn. Also, the second paper
discusses current SQM practices and classifies these practices according to the effectiveness of
SQM of the organizations sampled in order to recognize what the organizations with highly
effective SQM are presently practicing. The construction organizations can adopt these practices
to improve their current SQM systems. In the second contribution of the research, the effective
SQM practices are also summarized within the phases of the supplier quality process in order to
help construction organizations implement these effective practices within the project life cycle.

14
The third contribution is discussed in chapter 4. It involves using principal components analysis
(PCA) to analyze SQM practices in organizations with highly effective SQM based on in-depth
analysis of the PO instrument described in Neuman (2014). The research proposes the use of
PCA to analyze data with small sample size and with a relatively large number of variables. The
research also includes an analysis method, analytic hierarchy process (AHP), based on expert
judgment that can be used to support the conclusions drawn from small sample size analyses, and
to understand the relative importance of the SQM practices. The findings of this paper can
benefit the researchers and professionals in the construction industry to invest in the most
important SQM practices in order to implement them within construction projects.
The fourth contribution of the research is presented in chapter 5, and it includes proposing the
use of balanced scorecard (BSC) framework for implementing the effective SQM practices
during construction projects. The proposed framework is beneficial in assisting organizations in
improving their current SQM. At the end of each project, the practices within the BSC can be
assessed based on how well the goal was achieved given the utilization of these practices.
Applying the BSC within construction projects can also help organizations compare project
performance across multiple projects, thus suggesting areas of improvement.
The fifth contribution in chapter 6 of the dissertation includes analyzing SQM practices within
the BSC framework according to their ease of implementation and impact on quality by using
simple multi-attribute rating technique (SMART). This analysis can guide construction
organizations assessing their SQM practices given their current capabilities to perform the
practices and their effect on the SQM quality. The fifth contribution also involves synthesizing
leadership principles based on examining literature sources and developing leadership objectives
and practices using value focused thinking (VFT) to help create strategic leadership for SQM

15
within construction organizations. The findings from this contribution can help construction
organizations select consistent SQM practices that have high impact on quality and are simple to
implement across the construction projects and to recognize important leadership practices that
help improve the current SQM and promote a positive long-term impact for project quality.

16
References
Ahmad, S. (2014). An analysis of process vs. inspection capability in fabricated, engineered-to-order supply chains. M.S. Thesis, San Diego State University, San Diego, CA.
Alves, T., Walsh, K., Neuman, Y., Needy, K., & AlMaian, R. (2013). Supplier quality surveillance practices in construction. 21st Annual Conference of the International Group for Lean Construction – IGLC 21 – Fortaleza, Brazil, 833-842.
Burati Jr., J. L., Mathews, M. F., & Kalidindi, S. (1992). Quality management organizations and techniques. Journal of Construction Engineernig and Management, 112-128.
Caldas, H. C., Menches, L. C., Navarro, L., & Vargas, M. D. (2012). An analysis of global procurement and materials management practices in the construction industry. Research Report No. 257-11. The Construction Industry Institute: The University of Texas at Austin.
Chan, A. S., & Chan, E. W. (2005). Impact of Perceived Leadership Styles on Work Outcomes: Case of Building Professionals. Journal Of Construction Engineering & Management, 131(4), 413-422.
Costa, D. B., Formoso, C. T., Kagioglou, M., Alarcón, L. F., & Caldas, C. H. (2006). Benchmarking initiatives in the construction industry: Lessons learned and improvement opportunities. Journal of Management in Engineering, 22(4), 158-167.
Elenkov, D. S., Judge, W., & Wright, P. (2005). Strategic leadership and executive innovation influence: An international multi-cluster comparative study. Strategic Management Journal, 26(7), 665-682.
Goodman, R. E., & Chinowsky, P. S. (1997). Preparing construction professionals for executive decision making. Journal of Management in Engineering, 13(6), 55-61.
Hoskisson, R., Hitt, M., Ireland, R. D., & Harrison, J. (2009). Competing for advantage. Mason, OH: Cengage Learning.
Isik, Z., Arditi, D., Dikmen, I., & Birgonul, M. (2010). Impact of resources and strategies on construction company performance. Journal of Management in Engineering, 26(1), 9-18.
Jongwoo, J. (2009). Success factors for a lessons-learned system in a construction organization. (Cover story). Cost Engineering, 51(5), 13-20.
Kagioglou, M., Cooper, R., & Aouad, G. (2001). Performance management in construction: a conceptual framework. Construction Management & Economics, 19(1), 85-95.

17
Love, P.D. (2002). Influence of project type and procurement method on rework costs in building construction projects. Journal of Construction Engineering and Management, 128(1), 18-29.
Love, P. D., & Smith, J. (2003). Benchmarking, benchaction, and benchlearning: Rework mitigation in projects. Journal of Management In Engineering, 19(4), 147-159.
Needy, K. & Ries R. (2010). Best practices in quality management for the capital facilities delivery industry. Research Report No. Research Report 254-11. The Construction Industry Institute: The University of Texas at Austin.
Neuman, Y. (2014). A quantitative analysis of supplier quality in the engineer-procure-construct industry. M.S. Thesis, Department of Civil, Construction and Environmental Engineering, San Diego State University, San Diego, CA.
Neuman, Y., Alves, T., Walsh, K., Needy, K., & AlMaian, R. (2014). Analysis of supplier quality surveillance in EPC projects. 22nd Annual Conference of the International Group for Lean Construction – IGLC 22 – Oslo, Norway, 1083-1094.
Rogge, D., Cogliser, C., Alaman, H., & McCormack, S. (2001). An investigation of field rework in industrial construction. The Construction Industry Institute, The University of Texas at Austin.
Singh, D. D., & Tiong, R. K. (2005). A fuzzy decision framework for contractor selection. Journal of Construction Engineering & Management, 131(1), 62-70.
Sullivan, K. T. (2011). Quality management programs in the construction industry: Best value compared with other methodologies. Journal of Management in Engineering, 27(4), 210-219.
Toor, S., & Ofori, G. (2008). Tipping points that inspire leadership: An exploratory study of emergent project leaders. Engineering Construction & Architectural Management, 15(3), 212-229.
Vera, D., & Crossan, M. (2004). Strategic leadership and organizational learning. The Academy of Management Review, 29(2), 222-240.
Walsh, K., Needy, K., & Alves, T. (forthcoming 2014). Achieving Zero Rework through Effective Supplier Quality Practices. The Construction Industry Institute: The University of Texas at Austin.
Yeo, K. T., & Ning, J. H. (2002). Integrating supply chain and critical chain concepts in engineer-procure-construct (EPC) projects. International Journal of Project Management, 20(4), 253-262.

18
2. SUPPLIER QUALITY MANAGEMENT INSIDE AND OUTSIDE THE
CONSTRUCTION INDUSTRY
Rufaidah Y. AlMaian, M.S University of Arkansas
Department of Industrial Engineering
Kim LaScola Needy, Ph.D., P.E., CFPIM, PEM Professor and Department Head
21st Century Professorship in Engineering Department of Industrial Engineering
University of Arkansas
Kenneth D. Walsh, Ph.D., P.E. Professor and Chair
AGC-Paul S. Roel Chair in Construction Engineering and Management Department of Civil, Construction, and Environmental Engineering
San Diego State University
Thaís da C. L. Alves, Ph.D. Assistant Professor
Department of Civil, Construction, and Environmental Engineering San Diego State University
Abstract
Supplier quality management (SQM) inside the construction industry is complex given the one-
off nature of projects and the enormity of project size and life cycle. The resultant supply chain
that supports these projects is extremely broad and deep, creating unique challenges with
managing a network of hundreds and even thousands of independent contractors, sub-contractors
and suppliers that often span the globe. It is a continual challenge to ensure that the project
equipment, products and materials that are produced are not in need of rework. This paper
summarizes findings from the literature of diverse approaches for SQM in the construction
industry, and from other industries such as healthcare, manufacturing, aerospace and food. The
aim is to identify approaches that could be beneficial to the construction industry such as

19
supplier partnerships, category captain management, and product life cycle management, and
determine how these approaches might be adapted to the construction industry. Engineering
managers are challenged to improve SQM within an environment of limited resources. By
investigating the effective practices of SQM inside and outside the construction industry, the
engineering manager can borrow these practices and implement them. In the future, researchers
will synthesize the findings of the literature review with other data sources including structured
interviews, focus groups, and survey.
Keywords
Supplier Quality Management, Construction Industry, Supply Chain, Rework.
EMJ Focus Area
Quality Management, Strategic Management.
Introduction
The construction enterprise consists of the delivery of a staggering number of items, including
bulk materials, and fabricated components, to a construction site, where they are installed in their
final location. Each project is sustained by a broad and global supply chain involving multiple
independent contractors, sub-contractors and suppliers. Due to the number of organizations
involved and their different levels of sophistication, it is difficult throughout the execution of the
construction project to ensure that the required equipment, products and materials are produced
and delivered to the project site without any necessity for rework.
This paper describes findings from a research project sponsored by the Construction Industry
Institute (CII), and led by a multi-disciplinary team of academic researchers from industrial and

20
civil engineering, and subject matter experts (SMEs) representing construction owners,
contractors, and suppliers. CII Research Team 308 (RT 308) addresses a primary research
question, namely “What are the most effective processes and practices for ensuring that project
materials and equipment are produced, manufactured, or fabricated in strict accordance with all
applicable specifications, and that they are delivered to the project site without any need for
rework?”
The data for this paper come from the archival literature to describe the process of assuring
supplier quality inside and outside the construction industry.
The Construction Industry and Supplier Quality Management
Supplier quality management (SQM) is a system of processes and practices applied by the
project organization to ensure that the quality of fabricated materials and equipment meet the
project's requirements and specifications (Caldas et al., 2012). SQM in the construction industry
is complex due to the uniqueness of every project in terms of its scope and life cycle.
The motivation of studying SQM in the construction industry comes from the distinctive nature
of the construction industry. The following points summarize important findings from the
construction literature:
• The construction product is extremely integrated requiring the management and
cooperation of many independent groups and organizations. Quality cannot be addressed
by isolated departments and organizations, but rather it must be designed through the
entire system (Sullivan, 2011).
• Construction projects are dynamic and irregular in nature. Successful planning and
execution benefit from relying on past experiences and lessons-learned (Jongwoo, 2009).

21
• The role of the construction industry is to provide facilities that meet customers’ needs
(Burati Jr. et al., 1992).
• “The construction industry is characterized by cost and duration overruns, serious
problems in quality standards and safety measures, and an increased number of claims,
counterclaims, and litigation. Furthermore, the peculiarity of construction is that no two
projects are identical in terms of site conditions, design, use of construction materials,
labor requirements, and equipment requirements, construction methods, technical
complexity, and level of management skill required.” (Singh & Tiong, 2005, pg. 62).
• A major area that contributes to poor organization and project performance is rework
(Love, 2002, Love & Sohal, 2002), and high levels of rework disturb schedule targets,
reduce productivity, increase cost, and affect quality (Rogge et al., 2001).
In summary, construction projects are expensive, bulky, take a long time to be completed,
interfere with the surrounding environment and neighborhoods, and are built by dispersed teams
and suppliers in a project-based fashion where participants might never have worked with each
other before and might never work together again. Moreover, construction projects are
assembled at their final location making their production nomadic (the “factory” is installed
where the product will be built). The product is built to fit the environment and often cannot be
relocated, and workers move around the product (as contrasted from assembly lines where the
product is most often brought to the worker). All of these conditions define the construction
industry and profoundly interfere with processes used to deliver its products, and assure their
quality.
An abridged mapping of the supplier Quality (SQ) process is depicted in Figure 1 and described
in detail in Alves et al. (2013). The map contains five major processes beginning with planning

22
and selection (of the suppliers). Execution (of the fabrication along with the supplier quality
plan) follows with subsequent processes depicting release (packages) from shop, received
(packages) at site, and mechanical completion. Feedback loops are embedded at each step within
the process, and suppliers are informed of non-conformities and deviations when these are
identified. Additionally, suppliers’ performance can be evaluated and taken into account by
procurement in future acquisitions.
Figure 1: SQ process map. Adapted from Alves et al. (2013).
With regard to the construction supply chain, it is important that the supply chain members
involved in the project (contractors, and suppliers) understand what exactly is needed to achieve
the required level of quality in different stages of the process. The construction supply chain may
involve multiple tiers of suppliers from across the globe adding complexity for any construction
project with respect to ensuring supplier quality. Accordingly, supply chain management in the
construction industry is critical for the success of SQM and the overall performance of the
project. This is not unique to the construction industry. For example, consider the work done by
Bounken (2011) in the information technology industry where the author defines the supply
chain as a network of material, information, and service operations built up to improve supply
transformation and demand. Bounken considers that the supply chain management function must
harmonize the processes among the chain partners, focus on a small number of closer suppliers,
1. Planning and Selec)on 2. Execu)on 3.1. Release
from Shop 3.2. Received at
Site 3.3. Mechanical Comple)on
Project Start Post completion feedback
Reject packages if they do not meet quality standards

23
and exchange the necessary information across the chain to enhance the performance and
improve the quality.
Literature Review Methodology
The literature review for this research was conducted based on an intensive examination of the
scholarly literature and CII body of knowledge for the subject, supplier quality in the
construction industry. The literature review also includes an investigation of quality practices
and methods outside the construction industry for companies and industries known for having
effective SQM practices. The literature review was supplemented by input from the subject
matter experts (SMEs) who were RT 308 team members. Each of the SMEs bring decades of
experience within the construction industry in the local and global markets.
This research used a taxonomy of literature review described in Cooper (1988). The taxonomy is
a systematic categorization for the literature research effort based on the following
characteristics: focus, goal, coverage, and organization. The description of the literature review
taxonomy of this research is described next.
The Focus: With regard to the first characteristic of the taxonomy, it can be on research methods,
or practices and applications (findings). In this research, the focus is on the practices and
approaches of SQM discussed in the literature.
The Goal: The goal of the literature review can be integration, or criticism. In this paper, the goal
is to conduct an integrative literature review that generates new knowledge about the topic of
supplier quality management. As described by Torraco (2005), integrative literature review is a
form of research that reviews and synthesizes literature on a topic in an integrated way such that
new perspectives or frameworks on the topic are generated. For the scope of this research, the

24
literature review started by defining four broad areas of study as depicted in Table 1: supplier
quality organization, supplier quality system, management’s role in SQM, and supplier quality
assessment.
Area Examples of practices within each area Supplier quality
organization • Internal QMS implementation • Quality personnel development
Supplier quality system
• Partnership with suppliers • Supplier support
Management’s role in SQM
• Top management involvement and support
Supplier quality assessment
• Supplier performance measurement • Supplier selection management • Risk management Table 1: Areas of literature examined
As shown in Table 1, each area has examples of practices in the literature. These four areas were
selected for use in formulating a data collection protocol to collect further data from construction
organizations in later stages of this research via structured interviews. Also, these areas alongside
their relevant practices were chosen to be included in the literature review based on extensive
discussions with the SMEs involved in this research, due to the importance of these areas for the
construction supply chain. Initially, the discussion started with SQM practices in the construction
industry from an organizational standpoint (supplier quality organization) which was originally
centered on contractors’ and owners’ (i.e., those who hire suppliers) internal processes to
improve SQM. As the research project unfolded, RT308 academics and SMEs interacted through
several face-to-face meetings and conference calls to discuss the findings of the literature review.
The continuous process of presentation of findings, discussion, and synthesis resulted in further
areas being included for investigation, namely: supplier quality system, management’s role in
SQM, and supplier quality assessment, in addition to supplier quality organization. The SMEs
shared their experiences within these areas, and were eager to know what other practices in the
literature support SQM.

25
In a nutshell, the supplier quality organization involves internal approaches within the
organization related to SQM. Neuman et al. (2014) argued that high levels of quality are only
achievable when organizations implement quality management procedures and standards with
strong management support for quality development across all levels of the supply chain and,
more importantly, in a consistent fashion. The second area of the literature is related to the
supplier quality system which concerns the efforts to develop suppliers’ products through
collaboration and support. Modern trends for managing supplier quality are geared towards
supporting suppliers’ processes, effectively managing the relationships between the organization
and the suppliers through strategic partnerships, and collaboration efforts to enhance the overall
quality of the supply chain to promote continuous improvement (Batson, 2008; Liker 2004; Liker
& Hoseus 2008). The third area of the literature is management’s role in SQM which is a crucial
area for managing supplier quality within supply chains, because it describes how organization’s
leadership can impact SQM. With respect to reducing quality problems in construction projects,
Smith & Jirik (2006) concluded that if management is committed and involved to improving
quality by allocating time and resources into an effective system, then the non-quality
consequences will decrease. Similar findings related to the importance of management’s role for
achieving high levels of quality were extensively discussed in Needy & Ries (2010), Chase
(1993), and Isik et al., (2010). Additionally, Neuman et al. (2014) found qualitative and
quantitative evidence in construction organizations related to the importance of upper
management support to SQM practices and how they help decrease non-conformances (i.e.,
quality problems).The fourth area of the literature is related to supplier quality assessment which
involves utilizing supplier selection and performance measurement that help evaluate and predict
supplier’s performance. In general, supplier selection is an important aspect for supply chain

26
management, and the selection decisions should focus on the supplier capability to deliver the
required level of quality rather than solely on cost (Linn et al., 2006; Liker, 2004). Ahmad (2014)
concluded that selecting suppliers with high capability to deliver quality products will ultimately
reduce the cost of fixing problems in later stages of construction projects. In addition, supplier
quality assessment and its use to support procurement decisions and risk management are
essential assessment approaches within supply chain management (Flaig, 2002; Lin et al., 2006;
Baston, 2008; Isik et al., 2010; Azambuja & O’Brien, 2012).
The Coverage (Inclusion Criteria): The coverage of the literature is related to the extent of
covering the relevant work of the literature focus and goal. In this study, after identifying the
four major areas of study, a literature examination was conducted within the construction
literature and CII body of knowledge. The literature review was conducted using a number of
databases including Ebsco Academics Search Complete, ProQuest Research Library, and
ABI/Inform Complete. The inclusion criteria for selection were based on peer-reviewed
scholarly publications that are written in English. The articles were selected after reading their
abstracts and determining their relevancy to SQM within construction. The selected articles were
then examined in-depth to determine if they add new knowledge in terms of identifying SQM
practices. While examining the articles, additional relevant articles were selected from the
articles’ reference list. Further, the literature review findings were constantly presented to the
SMEs to determine their inputs regarding the literature review method and to provide more
guidance on finding the relevant SQM practices. A limitation of the literature review was that the
focus and goal of the study were centered on practices that support the management of quality.
While this can be an extremely broad topic, as any practice and every practice can influence the

27
quality of products and services delivered, the authors focused on practices that can be directly
related to managing supplier quality and their potential applicability to construction projects.
The same methodology was applied for finding scholarly articles related to SQM practices
outside the construction industry. Initially, the scope of search was limited to peer-reviewed
scholarly publications; however, because of the limited sources available that describe SQM
from multiple industries, the search was broadened to include examining companies’ websites
from multiple industries that are known by their effective SQM. The inclusion of the examined
industries was based on the possibility that their SQM practices can be adapted and successfully
applied to the construction industry. In addition each industry has its own motivation for
inclusion as described in later section of this paper. Also, the SMEs were actively involved in the
process to include/exclude examples from several industries reviewed for this study.
The Organization: There are many formats for organizing the findings of the literature review,
such as the chronological, or conceptual based on the interested areas of literature examination.
To organize the findings of the literature of this research, the SQM practices identified from the
literature examined inside and outside the construction industry were mapped onto the SQ
process map presented in Figure 1 to indicate where they could be implemented and practiced. In
addition they are classified according to the four major areas of the literature examination.
The discussion of the SQM literature in this paper is broken into two main sections. The first
section discusses SQM inside the construction industry with findings presented according to the
four areas of study as described in Table 1. The second section discusses SQM outside the
construction industry, described according to each industry.
28
Supplier Quality Management Inside the Construction Industry
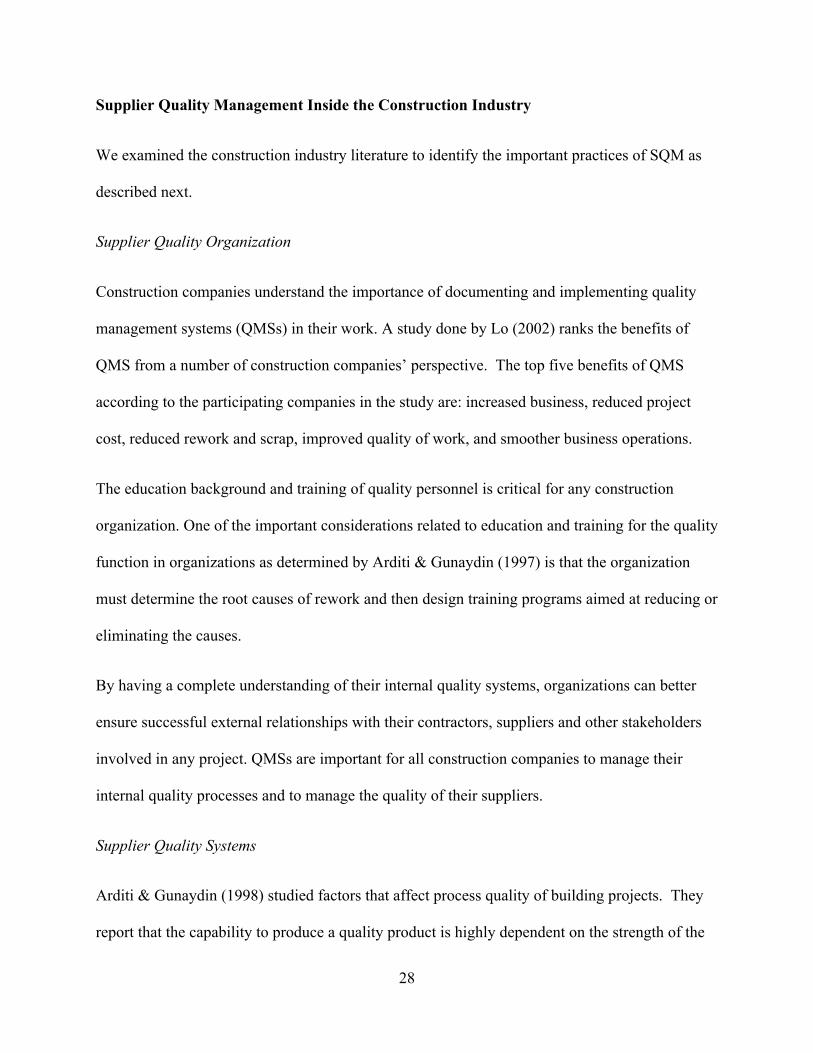
We examined the construction industry literature to identify the important practices of SQM as
described next.
Supplier Quality Organization
Construction companies understand the importance of documenting and implementing quality
management systems (QMSs) in their work. A study done by Lo (2002) ranks the benefits of
QMS from a number of construction companies’ perspective. The top five benefits of QMS
according to the participating companies in the study are: increased business, reduced project
cost, reduced rework and scrap, improved quality of work, and smoother business operations.
The education background and training of quality personnel is critical for any construction
organization. One of the important considerations related to education and training for the quality
function in organizations as determined by Arditi & Gunaydin (1997) is that the organization
must determine the root causes of rework and then design training programs aimed at reducing or
eliminating the causes.
By having a complete understanding of their internal quality systems, organizations can better
ensure successful external relationships with their contractors, suppliers and other stakeholders
involved in any project. QMSs are important for all construction companies to manage their
internal quality processes and to manage the quality of their suppliers.
Supplier Quality Systems
Arditi & Gunaydin (1998) studied factors that affect process quality of building projects. They
report that the capability to produce a quality product is highly dependent on the strength of the
29
relationship among the parties involved in the construction process, in particular the relationship
between the organization and supplier. Additional factors within the supplier quality system
found in the literature focus on building supplier partnerships, providing support to suppliers,
and using supplier quality surveillance (SQS).
Partnership with Suppliers. Peters (1987) recommends that organizations reduce their supplier
base and develop mutually beneficial partnerships with their suppliers. Healthy supplier
partnerships are important to succeed in the construction industry (Arditi & Gunaydin, 1998).
Lazar (1997) describes the importance of building healthy partnerships between owners and
contractors. Thomson et al. (1996) identify that the organization should establish a collaborative
relationship with a “preferred” supplier, especially when this relationship will span multiple
construction projects over a long period of time. Working together in a cooperative environment
under mutual goals of successful project completion avoids future problems of dissatisfactions,
claims, and litigation. However, disadvantages of partnerships may include: ineffective
cooperation due to conflicting objectives and lack of trust between the organization and supplier.
Also, the organization could face difficulties in setting performance measures for the partnership
effectiveness. When left unchecked these disadvantages may lead the organization to fulfill a
long term commitment with a possibly inadequate supplier. Crane & Felder (1999) state that the
partnering process should include partnering objectives and measures. Partnering objectives are
strategic criteria for the entire relationship, and partnering measures are management tools to
ensure progress toward objectives and desired results.
A more recent form of partnership between construction actors (owners, contractors, designers,
and major suppliers) is the integrated project delivery (IPD) form of contract to organize project
teams based on relational contracting principles (i.e., long term relationships as opposed to

30
transactional/one-time interactions). The IPD format promotes “shared pain and gain” where
actors collaborate to meet the owners’ needs and the focus is the project and not individual firms.
The team wins and loses money together which promotes collaboration to make the project
profitable for all and to avoid failures (Darrington et al., 2009).
If a partnership involves conflicting goals and lack of trust, it will not achieve effective results.
Harper & Bernold (2005) investigated a number of companies in the capital project market and
identified what they describe as the key barriers to supplier partnership. These barriers are:
conflicting goals that prevent common vision and a win-win working relationship; and resistance
to change by the organization and supplier that affect the improvement of their relationship.
Tommelein et al. (2003) examined the construction supply chain and identified examples of
partnerships between owners, suppliers, and contractors aiming at improving product quality,
delivery lead times, reliability of delivery, and reduced levels of inventory to meet demand.
Some of these partnerships require early supplier involvement in product design and fabrication,
vendor management of site inventories, definition of preferred supplier agreements, and constant
assessment of supplier performance and feedback.
Supplier Support. Needy & Ries (2010) studied organizations with effective quality management
systems. They conclude that successful construction organizations are proactive concerning their
suppliers’ QMS and develop their suppliers through training. These construction organizations
offer their QMS to be used by the supplier organizations for completing project quality
objectives in the absence of a supplier QMS.
Supplier Quality Surveillance. One of the challenging tasks for any construction project is to
ensure supplier quality, especially if there are multiple tiers of suppliers. Supplier quality

31
surveillance (SQS) is one of the common methods used to ensure supplier quality. This method
has both advantages and disadvantages. Singer et al. (1989) in their study of the construction of
nuclear power stations, analyzed surveillance as a method to ensure supplier quality. They cite
making the supplier accountable for quality and preventing construction delays to be important
advantages of surveillance. However their research indicates that the surveillance method may
lead to unexpected errors unless the supplier is closely supervised. Also, communication can be a
challenge when there are many tiers of suppliers involved in the project. They conclude that
despite it being difficult to estimate the required degree of surveillance needed in a project, this
process can be effective in producing quality results when properly implemented. In general, it is
true that the more you look the more you find, and that was confirmed in Ahmad’s (2014) work
which evaluated the effect of surveillance in construction projects. The more surveillance was
added to the process shown in Figure 1, the more non-conformances were found and corrected.
Moreover, Neuman (2014) observed a direct relationship between tracking the surveillance
effort, as well as rating supplier performance after execution, and finding and correcting non-
conformances.
Other methods may be found in the literature for ensuring supplier quality, such as partnership
with suppliers (as mentioned earlier in this paper), and supplier support and development training
(Tommelein et al., 2003). Organizations should identify the pros and cons of each method before
implementation to avoid any future problems of rework. In general, any chosen method to ensure
supplier quality requires consistent feedback among the parties involved, as well as clear
objectives and technical specifications.

32
Management’s Role
Lo (2002) identifies a number of difficulties with properly implementing a QMS such as: lack of
involvement from top management, and inconsistency in inspection procedures. Research
conducted by Needy & Ries (2010) found that effective quality management in the capital
facilities delivery industry requires:
1. Consistent and demonstrable management commitment.
2. Capable and consistent quality management processes.
3. Integrating and aligning quality management and project execution processes.
4. Providing frequent and relevant quality management training opportunities for employees
in order to maintain the required level of competence.
5. Cultivating partnerships with suppliers and contractors across the project life.
6. Establishing, communicating and using quality metrics across the project life cycle.
These findings highlight the importance of management commitment to quality objectives in
current and future projects.
In a similar fashion, Chase (1993) described common elements of management roles used by
construction organizations to improve quality. The elements include top management
involvement and commitment, the use of formalized process improvement techniques, helping
suppliers and subcontractors improve, and striving for continuous improvement. Shiramizu &
Singh (2007) present three main roles to be undertaken by management in order to maintain
quality within the organization, including: motivating employees through empowerment,
investing money and time in training, and supporting core values in employees to sustain quality.

33
The literature related to the importance of management for improving quality is wide and broad.
Despite several methods that the management may use to support quality, consistent
commitment and support are the essentials for any management role. Additionally, Neuman et al.
(2014) indicated that companies with upper management involvement in the SQM reportedly
find non-conformances earlier in the process depicted in Figure 1 and are viewed by their peers
as high performing organizations when it comes to SQM practices.
Supplier Quality Assessment
Harper & Bernold (2005) rank the top five performance measures to assess supplier
performance, based on surveying a number of contractors. The top five performance measures
that arose from this survey are: quality of work, delivery delays, past working relationships, cost
competitiveness, and technological capability. Supplier quality assessment may involve several
challenges. Songhori et al. (2011) point out that globalization has brought several challenges to
designing an effective supplier selection strategy and selecting the right suppliers which are to
become part of the organization’s supply chain. The authors conclude that effective supplier
selection and evaluation processes can directly impact supply chain performance, resulting in
improved outcomes to the organizations. However, as discussed by Azambuja & O’Brien (2014),
decision support systems to aid in supplier selection in construction organizations might not be
available, especially in the area of engineered equipment.
Risk management is a major component of project management due to the complex, dynamic,
and difficult nature of construction projects. Consequently, supplier quality assessment is also
part of managing risks in construction projects. According to Isik et al. (2010), risk in a
construction project is unavoidable and significantly affects the project performance, quality, and
budget. However, risk can be minimized by proper risk management to reduce its undesirable

34
affects. Ford et al. (2005) noted that many managers are more concerned with making quick
fixes to current problems rather than implementing long-term solutions for improving
organizational performance. Top management must mitigate the risks associated with myopic
and short-term solutions and instead commit to decisions resulting in long-term benefits for the
organization. Along these lines, the IPD contract mentioned earlier also supports the sharing of
risks associated with a project by ensuring that all stakeholders are actively involved in
minimizing risks instead of just transferring the risks to specific parties in a project (Darrington
et al., 2009).
Supplier Quality Management Outside the Construction Industry
We examined supplier quality management practices from diverse industries outside the
construction industry to identify relevant practices which may be able to be adapted and
successfully applied to the construction industry. These outside industries include healthcare,
manufacturing, aerospace, shipbuilding, and the food and restaurant industry. The healthcare
industry is examined because quality problems with the supplied materials and equipment may
cause adverse consequences in healthcare processes and ultimately affect or even cost human
lives. The manufacturing industry is studied because of its reputation for a complex supply chain
much like the one that supports the construction industry and its need for thousands of items
(engineered or commodity) in any single project. The aerospace industry is examined due to its
complex supply chain and because even minor safety and quality errors potentially can lead to
serious consequences to passengers and crew members resulting in loss of life and significant
financial losses. The shipbuilding industry is studied because the production process is
sophisticated and very customized (like in the construction industry) and the error tolerance is
very low. Additionally, the shipbuilding and aerospace industries products are bulky, very

35
expensive, and assembled in a fixed position (with workers moving around the product) like
construction projects. The motivation of examining the food and restaurant industry is that this
industry has great challenges to ensure consistency in a dispersed supply chain (like construction
supply chains) and maintain the safety and quality of the food served. A decrease in quality
standards will result in losing customer-base and reputation damage. SQ practices from these
industries cut across the supplier quality organization, the supplier quality system, the role of
management in SQM, and supplier quality assessment as categorized in Table 1.
Healthcare Industry
The equipment supplied for the healthcare industry may include bulk materials containing
sophisticated components that may be customized for each order. Trombetta (2007a) reports
findings from a study indicating that supplies represent the second highest expense for hospitals
after labor cost. This study goes on to report that a common practice for healthcare
manufacturers and suppliers to hospitals is to send representatives to hospitals to meet with
representatives of the hospitals’ purchasing departments. A modified approach is to establish a
partnership between hospitals and suppliers, thereby becoming a value-added partner,
contributing to the customer’s (hospital) efficiency and profitability.
Trombetta (2007b) proposes the category captain management (CCM) method to define the
supplier/manufacturer as a true, legitimate business partner with the buyer. Desroches et al.
(2003) define CCM as an arrangement where a supplier, often the category (product type) leader,
takes on a significant role in the management of the category, including brands of competitors.
CCM is widely used in the health and pharmaceutical industries, especially when the product
uniqueness is not significantly important. In other words, if the hospital/pharmacy products do

36
not have unique features among the other competitors, the CCM approach is usually applied.
The key organizational principle for the CCM as determined by Trombetta (2007b) is to develop
a strong relationship in which the supplier takes the effort to know how to operate the buyer’s
(hospital/pharmacy) business and to effectively face any coming challenges.
The healthcare industry literature also identifies important approaches to maintain strong
relationships and partnerships with the suppliers. For example, Hollyoake (2006) described the
importance of targeting strategic suppliers that have proper capabilities (sufficient resources, and
excellent performance) to form long-term partnerships. In addition, partnership policies and
decisions in healthcare must be supported by management. Wright & Taylor (2005) addressed
partnership policies with suppliers in the healthcare industry to be supported and motivated by
management.
Manufacturing Industry
Most of the items/raw materials delivered to manufacturing sites are large in number and from
various suppliers and sub-suppliers from different locations globally. Watkins (2005) observed
various manufacturing companies from around the world and developed a collection of
observations and recommendations for assessing the operational management of a supplier as
shown below:
• Assess the overall capabilities and limitations of a supplier, such as performance metrics,
financial metrics, and certifications.
• Describe the effectiveness of the management system based on clear objectives.
• Conduct a detailed review of current and historical concerns. The review may include
assessing what the organization considers normal vs. unexpected failure.
37
• Evaluate approaches to operational planning, with particular focus on manufacturing
product and process metrics and the use of superior quality planning, and methods.
The article suggests the following practices for quality management:
• Potential suppliers should be assessed carefully by identifying and evaluating cultural
barriers, technical capabilities, as well as financial resources.
• Analyze the end user (customer) satisfaction measures by surveys or performance
benchmarking.
• The supplier personnel capabilities must be assessed to determine if they will be adaptive
to the customer requirements.
Another manufacturing example is the electronic systems and equipment manufacturing that
often involves several suppliers and sub-suppliers in the supply chain. Forker & Hershauer
(2000) conducted a study that examines the effect of suppliers' internal quality management
practices and buyers' supplier development practices on customer satisfaction, supplier
satisfaction, and supplier quality performance. The authors surveyed the population of direct
materials suppliers for a common customer manufacturer of electronic systems and equipment.
The sample size was 181 pairs of matched survey replies from both buyers and suppliers.
Recommendations from the study include:
• Regular performance feedback to the firm’s suppliers, also monthly and yearly
solicitations to suppliers to rate its conduct as a business partner.
• Quality focus (versus price or schedule) in the selection of suppliers.
• Trust of a few loyal suppliers.
• Involvement in the suppliers' product development process.

38
• Extension of long-term contracts to the suppliers by the customer.
• Clarity of specifications provided to suppliers.
The authors concluded that clarity, transparency, and control of quality management and supplier
development programs are the key factors that lead to mutual satisfaction between buyers and
suppliers.
A study within the electronic manufacturing field by Forker et al. (1997) identified the
importance of the internal QMS of the companies on improving supplier quality performance.
The study encouraged the electronic manufacturing companies to improve their quality
departments developing employees and training them in order to better manage the external
relationships with their suppliers.
With regard to the external relationships with suppliers, Agus (2011) identified the importance of
proper information sharing and partnership within the supply chain to improve the quality of
products in the general manufacturing industry. Similar findings within semiconductor
manufacturing were discussed by Wu et al. (2011). The authors argued that cooperation and
strategic alliances with suppliers will increase the operational performance of the supply chain.
Regarding the automotive industry, which can be viewed as a large subset of the manufacturing
industry, lessons from one of the largest car automakers abound in the literature. Practices
developed and deployed by Toyota to promote SQM are discussed by Liker (2004) and Liker
and Hoseus (2008) to cite two of the more recent publications on the topic. The review of SQM
practices employed by Toyota deserves a study of its own; however, we chose to report some
which might be directly applicable to construction. Liker (2004) stresses the importance Toyota
places on developing its supplier base to assure quality in at least three principles described in his

39
book: “Build a culture of stopping to fix problems, to get quality right at the first time”; “Respect
your extended network of partners and suppliers by challenging them and helping them
improve”; and “Go and see for yourself to thoroughly understand the situation”. While these
principles seem like generic statements they actually call for a direct and immediate observation
of processes and suppliers seeking to understand how they work and fail so that they can be
continuously improved. Problems should be immediately corrected as they are spotted and
production should not continue until a root cause is found and the problem eliminated. Toyota
suppliers undergo extensive periods of testing and evaluation, and before they are considered
suppliers, they are tasked with developing products for the automaker and their technical
capability is challenged before a purchase order is released. Engineers from Toyota and its
suppliers spend periods in each other’s shops and offices to learn about their practices and are
encouraged to share their knowledge to develop better products. Additionally, Toyota takes great
care while recruiting and developing its workers and suppliers (Liker & Hoseus, 2008; Morgan
& Liker, 2006). Mentoring activities between senior and junior staff, constant training and
development of technical proficiency in the processes and products used, the use of visual
management and two-way communication are important practices used by Toyota to build a
culture of continuous improvement and the delivery of quality products.
Aerospace Industry
High quality standards are critical within the aerospace industry due to the important safety
regulations, and high consequences for failure resulting in potential litigations. As one of the
world’s largest aerospace manufacturers, Boeing is an obvious company to examine. At Boeing,
suppliers are managed throughout the product life cycle.

40
Successful partnership with their suppliers through a SQS system builds a proactive approach to
improve suppliers’ quality. Boeing’s SQS tools include: product assessment (PA), quality
process assessment (QPA), and manufacturing process assessment (MPA) (Boeing Supplier
Quality Surveillance, 2012).
SQS activities are executed by supplier quality representatives from Boeing, and are conducted
at the supplier’s facility or the supplier subcontractor’s facility under the agreed provisions that
address Boeing’s right of surveillance and review of goods, procedures, and practices (Boeing
Supplier Quality Surveillance, 2012).
Prior to Boeing performing its own assessment, the following actions have to be performed by
the supplier in advance:
• Review the checklist(s) prior to the on-site visit by the Boeing supplier quality
representative
• Provide admission to the applicable process documentations, and training records
• Prepare the relative process performance data for the processes under assessment
• Inform knowledgeable personnel to be available during assessment, and
• Provide contact information for the local regulatory agency representative when
requested (Boeing SQS Supplier Presentation, 2010).
The major benefits of this system are:
• Support monitoring the suppliers without hindering the production process, and help
improve the supplier’s procedures.

41
• Provide information regarding the supplier’s processes to the supplier, Boeing, and the
other parties involved including Boeing’s customers and regulatory agencies (Boeing
SQS Supplier Presentation, 2010).
Another example for suppliers monitoring and improvement is found in NASA, where the
suppliers are supervised through frequent visits to their facilities by NASA’s employees
(NASA’s Academy of Program and Project Leadership (APPL), 2000). During these visits,
NASA assesses the strengths and weakness of the suppliers and designs long-term agreements
for supplier performance improvement.
With regard to supplier selection within the aerospace industry, Dietrich & Cudney (2011)
identified the importance of the initial assessment for the suppliers’ technical capabilities to
improve the supply chain outcomes (collaborations and quality delivery). Similar conclusions
were found by Gordon (2006) who discussed the necessity to assess the suppliers’ capacity and
capability during planning and selection to ensure effective management of the aerospace supply
chain.
Shipbuilding Industry
Ensuring high quality in the shipbuilding industry is critical, and challenging to achieve given
the product complexity, high degree of customization and stringent safety requirements.
Sawhney et al. (2007) observed many parallels between the construction industry and the
shipbuilding industry. Like the construction industry, the shipbuilding industry depends on a
global supply chain of partners and suppliers to help develop and manufacture new ships. Proper
communication and information exchange between the primary parties during the product life
cycle is important to avoid missing any valuable information that may impact the quality of the

42
final product. One successful example of a technological tool to support communication is
Siemens PLM Software® a product lifecycle management (PLM) platform for the shipbuilding
industry (Siemens PLM software, 2013). The purpose of this software/platform is to minimize
miscommunication and rework complexities. This is particularly important to facilitate
collaboration among all partners and suppliers in the shipbuilding supply chain. The idea behind
the software is to create an integrated and synchronized environment linking designers,
production team, and suppliers to improve shipbuilding productivity (Siemens, 2012).
The benefits of creating a common platform among the involved parties in shipbuilding are:
• Enabling companies to securely share the relative project information with partners and
suppliers.
• Updating partners and suppliers with any changes.
• Providing access to the production technical information.
Similar findings with regard to effective communication and information exchange in the
shipbuilding industry were discussed in Sawhney et al. (2007) study for supply chain integration
in the global shipbuilding industry. Primo & DuBois (2012) also emphasized the importance of
enhancing the technological capabilities in knowledge sharing among the shipbuilding supply
chain members. Moreno’s (2009) research examined the shipbuilding production methods and
compared them to those that are implemented in the construction industry. To improve
construction production methods, Moreno recommended learning from shipbuilding practices
with regard to supply chain management integration and automation.

43
Food and Restaurant Industry
We discuss examples of two companies: Starbucks® and Chipotle® that are known for a
reputation of effectively managing their supply chain in the food and restaurant industry. At
Starbucks, ensuring the quality of the supplied coffee beans requires an advanced supplier
management system. Austin & Reavis (2004) observed that specialty coffee comes from mid-
sized farms (suppliers), and farm owners don’t have sufficient business and communication
skills to provide coffee beans within the quality standards for Starbucks. So, Starbucks
conducted an alliance with Conservation International, a non-profit organization, to provide
training and support to farmers in order to maintain the quality and environmental standards of
coffee tree growing and production. In addition, the farmer (the supplier) selection includes
several criteria to be met in order to become a preferred coffee supplier with priority for future
purchasing. As a result, Starbucks maintains the reputation of providing high quality coffee and
social responsibility through its supplier management system. As described by Austin & Reavis
(2004) and US Labor Education in the Americas Project (2007), Starbuck’s criteria to choose the
preferred coffee supplier employ a point system as follows:
• Environmental impact: soil management, water reduction, clean water, use of shade,
waste management (50 points)
• Social conditions: health and safety, living conditions (30 points)
• Economic issues: long terms relationships, economic transparency throughout the supply
chain (20 points)
At Chipotle, new concepts for managing their food suppliers are defined. Chipotle’s 2012 annual
report suggests the following practices for supplier quality:

44
• Supplier Relationship: Chipotle works closely with its suppliers to make sure that it
sources consistent and low-cost inputs from sustainable sources “We have established
close relationships with some of the top suppliers in the industry, and we actively
maintain a limited list of approved suppliers from whom our distributors must purchase.”
(Chipotle, 2012, pg. 5).
• Supply chain: “Maintaining the high levels of quality we expect in our restaurants
depends in part on our ability to acquire high-quality, fresh ingredients and other
necessary supplies that meet our specifications from reliable suppliers. Our distribution
centers purchase from various suppliers we carefully select based on quality and their
understanding of our mission, and we seek to develop mutually beneficial long-term
relationships with suppliers.” (Chipotle, 2012, pg. 6).
Literature Findings from Inside and Outside the Construction Industry
The findings from the literature examination of SQM inside and outside the construction industry
are summarized in four areas that were described in Table 1. These findings are also mapped
onto the SQ process map, depicted in Figure 1, in order to be adapted by construction
professionals. Tables 2 and 3 summarize the findings of the literature review inside and outside
the construction industry respectively.

45
Literature review area Literature source Findings (SQM
practices) Location on
SQ map (Figure 1)
Comments
Supplier quality
organization Lo (2002); Arditi & Gunaydin
(1997)
• Internal QMS implementation
• Quality personnel development
2. Execution, through 3.3. Mechanical completion
Implementing internal QMS ensures better
external relationships with
suppliers
Supplier quality system
Peter (1987); Arditi & Gunaydin (1998); Lazar (1997); Thomson et
al., (1996); Crane & Felder (1999); Darrington et al. (2009);
Harper & Bernold (2005); Tommelein et al. (2003)
• Partnership with suppliers and developing a preferred and dependable supplier base
1. Planning and selection
Mutual goals should be defined
Needy & Ries (2010); Tommelein et al. (2003)
• Supplier support and development
2. Execution
Construction organizations
should support their suppliers
Singer, Chirchill, & Dale (1989); Ahmad (2014); Neuman (2014)
• Supplier quality surveillance
2. Execution & 3.1. Release from shop
Management’s role in SQM
Lo (2002); Needy (2010); Chase (1993); Shiramizu & Singh
(2007); Neuman et al. (2014)
• Management commitment and support to SQM
All stages
Supplier quality
assessment
Harper & Bernold (2005) • Supplier
performance management
2. Execution, through 3.3. Mechanical completion
Songhori et al. (2011); Linn et al., (2006); Azambuja & O’Brien
(2012)
• Supplier selection and evaluation process
All stages
Effective supplier selection positively
impacts supply chain performance
Isik et al., (2010); Ford et al., (2005); Darrington et al. (2009)
• Risk management All stages
Risk management reduces the
occurrence of undesirable results
Table 2: Literature review findings of SQM inside the construction industry

46
Literature review area
Industry Findings (SQM practices) Location on SQ map (Figure 1)
Comments
Supplier quality
organization
Manufacturing • Internal QMS implementation • Quality personnel
development
2. Execution, through 3.3. Mechanical Completion
Promoting a culture of continuous improvement
Supplier quality system
Healthcare • Partnership with suppliers 1. Planning and selection
The supplier should have high
qualifications • Suppliers as true business
partners (Category Captain Management)
1. Planning and selection
Manufacturing • Regular performance feedback to the firm’s suppliers
• Direct observation of processes with immediate fixing for quality problems.
2. Execution Observe and document the supplier work.
Types of documents may involve: Non-
conformance Report (NCR), &
Corrective Action Report (CAR)
• Supplier development (mentoring, development of technical proficiency, respect and challenge suppliers)
• Extensive training with workers exchange to learn about owner/supplier processes.
1. Planning and selection
Promoting transparency and
open communication to develop and
fabricate products from the start.
Aerospace • Suppliers’ capabilities assessment and improvement
• Supplier quality surveillance (SQS)
1. Planning and selection through
3.1. Release from shop
Similarities with the construction industry, i.e.,
product bulky, expensive,
thousands of parts Food and
Restaurant • Supplier alliance, training and
support • Long-term relationship with
suppliers
1. Planning and selection & 2.
Execution
Develop mutually beneficial long-term
relationships with reliable suppliers
Management’s role in SQM
Manufacturing • Cultural barriers evaluation for global suppliers
• Clear objectives definition by the management
1. Planning and selection
Develop relationships with a
long-term view.
Supplier quality
assessment
Manufacturing • Selection of suppliers (quality focus)
• Assessment of supplier’s capacity and capability.
1. Planning and selection
Supplier commits to developing products which are analyzed
during selection. Aerospace • Assessment of supplier’s
capacity and capability 1. Planning and
selection
Shipbuilding • Proper communication and information exchange (product life cycle management)
2. Execution, through 3.3. Mechanical completion
Table 3: Literature review findings of SQM outside the construction industry

47
As described in Tables 2 and 3, the construction industry and the other industries studied, in
particular manufacturing, place an importance on developing their internal quality systems to
ensure better relationships with their suppliers. With regard to the supplier quality system, the
construction industry and the other industries studied form partnerships with suppliers and create
opportunities to train and develop them. The aerospace industry implements supplier quality
surveillance within their SQM. Within the manufacturing industry, we found that management
works to define clear objectives and evaluate cultural barriers for global suppliers. For supplier
quality assessment in manufacturing, we found the focusing on quality while selecting the
suppliers and work to develop suppliers by challenging them to show what they can deliver. In
the construction industry, we found that supplier selection and performance management impact
the project performance. Also, proper risk management is a critical practice in project
management. Along these lines, new forms of contract are being developed in construction to
ensure that profits, losses, and risks are shared forcing every project stakeholder to have “skin in
the game” and aim for project success instead of only looking after their own business. Within
the shipbuilding industry, we noted evidence of the importance of proper information exchange
methods for the involved project participants.
Conclusions
The construction industry consists of diverse projects that use different types of supplied bulk
materials and equipment that have to be fabricated and delivered to the project site with a high
level of quality. Supplier quality management in the construction industry is challenging due to
project diversity in terms of size and life cycle, and the supply chain being both broad and deep.
This paper examines supplier quality in the construction industry and suggests some efficient
practices of supplier quality management outside the construction industry. The objective is to
48
recognize practices that can be useful to the construction industry such as supplier partnerships,
and product life cycle management, and determine how these practices can be implemented in
the construction industry within the SQ process map, shown in Figure 1. The discussion with the
SMEs revealed that the practices found from outside the construction industry appear to be
similar to the existing practices within the construction industry. However, the SMEs believe that
some practices are not currently implemented in the construction industry in a consistent manner
such as providing feedback to suppliers, and supplier performance management. Further
investigation is needed to determine a thorough analysis from multiple data sources to describe
the existing SQM in the construction industry.
In summary, the primary lessons learned from with regard to improving SQM:
• Develop and respect close relationships (partnerships) with suppliers and challenge them
to improve the goods supplied.
• Involve fewer, more dependable suppliers.
• Implement a feedback system between the buyer and supplier with supplier improvement
opportunities based on measurable objectives.
• Constantly observe processes directly at the supplier facility while offering development
opportunities to the supplier.
• Develop a careful supplier selection process focusing on quality aspects, and visit
suppliers’ facilities during selection (if possible exchange workers) to collaboratively
develop products and to assure quality requirements are known.
• Mentor and develop suppliers’ workforce to be technically capable of delivering quality
products. While this might not be possible for the extended supply chain, priority can be
given to first tier suppliers and to those areas deemed most critical.

49
• Ensure top management involvement and commitment. Implement contractual
arrangements and mechanisms that promote the success of the project by making all
participants accountable (“have skin in the game”) by sharing risk, profits, and losses.
Implications for the Engineering Manager
This paper investigates the practices of SQM inside and outside the construction industry. The
construction industry develops its products and activities in a project-based fashion, which is the
case for many other industries and organizations, e.g., software, defense, consulting, production
of one of a kind and engineered to order products, government organizations (e.g., NASA,
Armed Forces), and engineering projects in general. Accordingly, the discussion and the findings
presented can be extended to other environments which operate in a project-based fashion and/or
have products that bear similarities to construction projects, e.g., ships, airplanes, rockets.
SQM is a critical aspect of engineering management; therefore, it is beneficial that engineering
managers be aware of effective SQM practices from multiple industries that can be implemented
to improve engineering products and services. Engineering managers can benefit from this
research to effectively manage suppliers in the supply chain of any project within construction,
healthcare, and automotive just to name a few. Most engineering managers face the challenge of
improving the performance of their suppliers within the constraints of limited resources of time,
budget, and technical capabilities. By investigating the effective practices of SQM inside the
construction industry, the engineering manager can develop plans to enhance suppliers
performance through effective training and education for quality personnel to determine the root
causes of poor quality problems, strategic supplier selection processes to overcome quality
problems, and long-term partnership decisions with suppliers to build a trusted supplier base for
50
future projects. In addition, the paper provides important information to engineering managers
about SQM from outside the construction industry such as healthcare, aerospace and food
industry. For example, engineering managers can adopt the efforts to develop and establish long-
term agreements (partnerships) with suppliers that are practiced in the food industry to secure
high quality supplies of raw materials and products in the long run. As important as partnerships,
proper communication and information exchange are critical aspects to consider by engineering
managers. The paper presents an example of project information synchronization software from
the shipbuilding industry that is used to effectively exchange project information. It is important
to the engineering manager to assure that information is clear and shared on time by all the
parties involved in any project, especially if these parties are located globally. In summary,
engineering managers must understand the importance of not limiting the investigation of a
particular industry when learning about SQM. By benchmarking practices from diverse
industries, engineering managers can use the practices identified from multiple industries to
improve the current SQM in any project.
Limitations and Future Work
This research was based on a literature review taxonomy with a goal of integrative review to
increase the knowledge about SQM and to propose practices that can be implemented in the
construction industry to improve SQM. The literature review focused on the SQM practices
inside and outside the construction industry found on each examined source. The identified
practices from each industry are limited to what we found in the reviewed sources. There could
be other effective practices from a particular industry, for example manufacturing, that may be
available in other sources that were not included in our review. This research did not also
examine the cost aspects of quality in the literature.

51
The SMEs of the team determined that most of the identified practices in this research are
applicable or already have been practiced in the construction industry. However, there is always
a persistent pressure to choose suppliers with minimum cost, the strategic choice of low cost
suppliers can lead to poor quality and a high number of rework tasks. The future work of this
research may include cost implications of supplier quality that help engineering managers
support their strategic decisions of supplier selection to avoid future quality problems in
construction projects.
References
Agus, A. (2011). The significant effect of information sharing and strategic supplier partnership on supplier performance. International Journal of Business & Management Science, 4(1), 75-92.
Ahmad, S. (2014). An analysis of process vs. inspection capability in fabricated, engineered-to-order supply chains. M.S. Thesis, San Diego State University, San Diego, CA.
Alves, T., Walsh, K., Neuman, Y., Needy, K., & AlMaian, R. (2013). Supplier quality surveillance practices in construction. 21st Annual Conference of the International Group for Lean Construction – IGLC 21 – Fortaleza, Brazil, 833-842.
Austin, J., & Reavis, C. (2004). Starbucks and conservation international. Harvard Business School Publishing, 1-28.
Arditi, D., & Gunaydin, H. (1997). Total quality management in the construction process. International Journal of Project Management, 15(4), 235-243.
Arditi, D., & Gunaydin, H. (1998). Factors that affect process quality in the life cycle of building projects. Journal of Construction Engineering & Management, 124(3), 194.
Azambuja, M., & O’Brien, W. (2012). Rapid Assessment of Engineered Equipment Suppliers. Automation in Construction, 22, 587-596.
Baston, R. (2008). Trends in supplier quality management. Proceedings of the 2008 Industrial Engineering Research Conference, 667-672.
Boeing Supplier quality surveillance. Retrieved September 2012, from http://www.boeingsuppliers.com/ecqs.html
52
Boeing SQS Supplier Presentation (2010). Retrieved September 2012, from http://www.boeingsuppliers.com/SQS_Supplier_Presentation.pdf
Bouncken, R. B. (2011). Supply chain contingencies: The effects of up-stream directives on supplier's innovation performance. Engineering Management Journal, 23(4), 36- 46.
Burati Jr., J. L., Mathews, M. F., & Kalidindi, S. (1992). Quality management organizations and techniques. Journal of Construction Engineering and Management, 112-128.
Caldas, H.C., Menches, L.C., Navarro, L., & Vargas, M.D. (2012). An analysis of global procurement and materials management practices in the construction industry. Research Report No. 257-11. The Construction Industry Institute: The University of Texas at Austin.
Chase, G. (1993). Effective total quality management (TQM) process for construction. Journal of Management in Engineering.Special issue: Total quality management in civil engineering, (9) 433–443.
Chipotle (2012). Annual report. Retrieved June 2013, from: http://ir.chipotle.com/phoenix.zhtml?c=194775&p=irol-reportsAnnual
Cooper, H. (1988). Organizing knowledge synthesis: A Taxonomy of literature reviews. Knowledge in Society, 1, 104-126.
Crane, T. G., & Felder, J. P. (1999). Partnering measures. Journal of Management in Engineering, 15(2), 37.
Darrington, J., Dunne, D., & Lichtig, W. (2009). Organization, Operating System, and Commercial Terms. Managing Integrated Project Delivery. CMAA, McLean, Virginia, 10-47.
Dietrich, D. M., & Cudney, E. A. (2011). Methods and considerations for the development of emerging manufacturing technologies into a global aerospace supply chain. International Journal of Production Research, 49(10), 2819-2831.
Desroches, D., Gundlach , G., & Foer, A. ( 2003 ) . Antitrust challenges to category captain management. Journal of Publicy & Marketing, 22(2), 201- 215.
Flaig, J. J. (2002). The quality implications of increasing the number of suppliers. Quality Engineering, 14(3), 453-457.
Ford, E. W., Duncan, W., Bedeian, A. G., Ginter, P. M., Rousculp, M. D., & Adams, A. M. (2005). Mitigating risks, visible hands, inevitable disasters, and soft variables: Management research that matters to managers. Academy of Management Executive, 19(4), 24-38.

53
Forker, L. B., & Hershauer, J. C. (2000). Some determinants of satisfaction and quality performance in the electronic components industry. Production & Inventory Management Journal, 41(2), 14-20.
Forker, L. B., Mendez, D. D., & Hershauer, J. C. (1997). Total quality management in the supply chain: what is its impact on performance? International Journal of Production Research, 35(6), 1681-1702.
Gordon, D. K. (2006). Supply chain management remains aerospace challenge. Quality Progress, 39(7), 83-85.
Harper, D. G., & Bernold, L. E. (2005). Success of supplier alliances for capital projects. Journal of Construction Engineering & Management, 131(9), 979-985.
Hollyoake, M. (2006). A model for strategic partnership development: Developing supplier–hospital relationships–a route map to success in the early phases. Journal of Medical Marketing, 6(2), 131-134.
Isik, Z., Arditi, D., Dikmen, I., & Birgonul, M. (2010). Impact of resources and strategies on construction company performance. Journal of Management in Engineering, 26(1), 9- 18.
Jongwoo, J. (2009). Success factors for a lessons-learned system in a construction organization. Cost Engineering, 51(5), 13-20.
Lazar, F. P. (1997). New benefits from peering inside the black box. Journal of Management in Engineering, 13(6):75- 83.
Liker, J.K. (2004). The Toyota way: 14 management principles from the world’s greatest manufacturer. McGraw-Hill: New York, NY, 330pp.
Liker, J.K., & Hoseus, M. (2008). Toyota culture: The heart and soul of the Toyota way and the center for quality people and organizations. McGraw-Hill: New York, NY, 562pp.
Linn, R. J., Fugee, T., & Lau Wai Choi, E. (2006). Supplier selection based on process capability and price analysis. Quality Engineering, 18(2), 123-129.
Lo, T. (2002). Quality culture: A product of motivation within organization. Managerial Auditing Journal, 17(5), 272 276.
Love P. (2002). Influence of project type and procurement method on rework costs in building construction projects. Journal of Construction Engineering and Management, 18-29. Retrieved from Love, P. D., & Smith, J. (2003). Benchmarking, benchaction, and benchlearning: Rework mitigation in projects. Journal of Management in Engineering, 19(4), 147-159.
Love, P., & Sohal, A. (2002). Influence of organizational learning practicies on rework costs in projects. 8th International Conference on ISO 9000 and TQM . Melbourne, Australia:

54
Center for Management Quality Research at RMIT University. Retrieved from Love, P. D., & Smith, J. (2003). Benchmarking, benchaction, and benchlearning: Rework mitigation in projects. Journal of Management In Engineering, 19(4), 147-159.
Moreno, N.(2009). Barriers to implementaion of shipbuilding production methods in construction. M.S. Thesis, San Diego State University, San Diego, CA.
Morgan, J.,M., & Liker, J., F.(2006). The Toyota product development system. Productivity Press: New York, 377pp.
NASA’s Academy of Program and Project Leadership (2000). Supplier integration. Retrieved July 2014 from: http://appel.nasa.gov/2000/10/01/supplier-integration/
Neuman, Y. (2014). A quantitative analysis of supplier quality in the engineer-procure-construct industry. Department of Civil, Construction and Environmental Engineering, San Diego State University.
Neuman, Y., Alves, T., Walsh, K., Needy, K., & AlMaian, R. (2014). Analysis of supplier quality surveillance in EPC projects. 22nd Annual Conference of the International Group for Lean Construction – IGLC 22 – Oslo, Norway, 1083-1094.
Needy, K. & Ries R. (2010). Best practices in quality management for the capital facilities delivery industry. Research Report No. Research Report 254-11. The Construction Industry Institute: The University of Texas at Austin.
Peters, T. J. (1987). Thriving on chaos: Handbook for a management revolution. New York: Knopf.
Primo, M., & DuBois, F. (2012). Technological capabilities of Brazilian shipbuilding suppliers. Journal of Technology Management & Innovation, 7(2), 39-50.
Rogge, D., Cogliser, C., Alaman, H., & McCormack, S. (2001). An investigation of field rework in industrial construction. Research Report No. 153. The Construction Industry Institute: The University of Texas at Austin.
Sawhney, A., Walsh, K.D., and Storch, R.L. (2007). Examination of the shipbuilding industry. Research Report No. 232-11. The Construction Industry Institute: The University of Texas at Austin.
Shiramizu, S., & Singh, A. (2007). Leadership to improve quality within an organization. Leadership & Management in Engineering, 7(4), 129-140.
Siemens (2012). Next-generation shipbuilding solutions. Retrieved 2013, from Siemens.com: http://www.plm.automation.siemens.com/en_us/Images/21064_tcm1023-95832.pdf
Siemens PLM software. Retrieved 2013, from http://www.plm.automation.siemens.com/en_us/about_us/index.shtml
55
Singer, A. J., Churchill, G. F., & Dale, B. G. (1989). Some supplier quality assurance assessment issues. Quality & Reliability Engineering International, 5(2), 101-111.
Singh, D. D., & Tiong, R. K. (2005). A fuzzy decision framework for contractor selection. Journal of Construction Engineering & Management, 131(1), 62-70.
Smith, G. R., & Jirik, T. (2003). Making zero rework a reality: A comparison of zero accident and methodology to zero rework accident and quality management. The University of Texas at Austin: Construction Industry Institute.
Songhori, J., Tavana, M., Azadeh, A., & Khakbaz, M. (2011). A supplier selection and order allocation model with multiple transportation alternatives. International Journal of Advanced Manufacturing Technology, 52(1-4), 365-376.
Sullivan, K. T. (2011). Quality management programs in the construction industry: Best value compared with other methodologies. Journal of Management in Engineering, 27(4), 210-219.
Thompson, P., Crane, T., & Sanders, S. (1996). The partnering process - Its benefits, implementation, and measurement. Research Report No. 102. The University of Texas at Austin: The Construction Industry Institute.
Tommelein, I.D., Walsh, K.D., & Hershauer, J.C. (2003). Improving capital projects supply chain performance. CII Research Report 172-11. The University of Texas at Austin: The Construction Industry Institute.
Torraco, R. J. (2005). Writing integrative literature reviews: Guidelines and examples. Human Resource Development Review, 4(3), 356-367.
Trombetta, B. (2007a). Category captain management: A new approach for healthcare suppliers to partner with their hospital customers. Journal of Hospital Marketing & Public Relations, 17(2), 61-69.
Trombetta, B. (2007b). Marketing masterclass category captain management: An alternative to the blockbuster model. Journal of Medical Marketing, 7(3), 223-234.
US Labor Education in the Americas Project (2007). Starbucks issues new sourcing guidelines. Retrieved March, 2014, from: http://www.usleap.org/starbucks-issues-new-sourcing-guidelines.
Watkins, D. K. (2005). Quality management's role in global sourcing. Quality Progress, 38(4), 24-31.
Wright, G., & Taylor, A. (2005). Strategic partnerships and relationship marketing in healthcare. Public Management Review, 7(2), 203-224.

56
Wu, H., Yueh, L., Fei-Liang, C., & Yu, H. (2011). A study on the relationship among supplier capability, partnership and competitive advantage in Taiwan’s semiconductor industry. International Journal of Electronic Business Management, 9(2), 122-138.
57
3. A QUALITATIVE DATA ANALYSIS FOR SUPPLIER QUALITY MANAGEMENT
PRACTICES WITHIN THE CONSTRUCTION INDUSTRY
Rufaidah Y. AlMaian, M.S Department of Industrial Engineering
University of Arkansas
Kim LaScola Needy, Ph.D., P.E., CFPIM, PEM Professor and Department Head
21st Century Professorship in Engineering Department of Industrial Engineering
University of Arkansas
Kenneth D. Walsh, Ph.D., P.E. Professor and Chair
AGC-Paul S. Roel Chair in Construction Engineering and Management Department of Civil, Construction, and Environmental Engineering
San Diego State University
Thaís da C. L. Alves, Ph.D. Assistant Professor
Department of Civil, Construction, and Environmental Engineering San Diego State University
Abstract
The process of assuring the procured and fabricated materials for an engineer-procure-construct
(EPC) project are within their quality requirements is challenging because nearly every EPC
construction project is complex and distinctive from previous projects in terms of its size, supply
chain, and materials usage. In particular, EPC projects include contractors, subcontractors, and
suppliers who collaboratively perform the engineering design for the project, procure the
required materials and equipment, and then construct. Many (or most) construction
organizations, representing owners and contractors, place high importance on documenting and
tracking the quality performance of their suppliers as part of their supplier quality management
(SQM) to ensure that procured and fabricated materials are within the quality specifications.
However, these organizations still face problems with their SQM evidenced by the large number

58
of rework tasks and replacement efforts for the supplied materials in the EPC projects. This
highlights the importance of investigating the current supplier quality practices to explore
effective practices to deliver products with the expected quality and zero rework. In this paper,
six structured interviews were conducted with contractors, and 92 SQM documents including
procedures and reports from 21 owners and contractors in the EPC industry were analyzed to
identify the current practices used by these organizations with regard to SQM, and the most
effective practices that construction engineering managers could borrow to improve the existing
SQM in the EPC projects.
CE Database Subject Headings
Construction Industry, Contractors, Owners, Engineer-Procure-Construct (EPC), Supply Chain
Management (SCM).
Keywords
Supplier Quality Management (SQM), Rework, Construction Supply Chain, Supplier Quality
(SQ) Process Map, Qualitative Data Analysis, Grounded Theory.
Introduction
This paper presents findings from a research endeavor supported by the Construction Industry
Institute (CII), and led by the Research Team 308 (RT 308) representing academic researchers
from industrial and civil/construction engineering. The research team also involved a group of
subject matter experts (SMEs) from the EPC industry, representing their member organizations
in the CII as construction owners, contractors, and suppliers. Members from 21 organizations
participated in this research project, and each team member brought multiple years of experience

59
in the local and global construction market. The major research question under study can be
stated as follows: What are the most effective processes and practices for ensuring that project
materials and equipment are produced, manufactured, or fabricated in strict accordance with all
applicable specifications, and that they are delivered to the project site without any need for
rework? Data were collected from a range of quantitative and qualitative sources including a
literature review for supplier quality management (SQM) inside and outside the construction
industry, (AlMaian et al., 2013), SQM documents provided by participating organizations, focus
group meetings with representatives of supplier organizations, purchase order (PO) data
collection instrument, and a series of structured interviews. The two main data sources that are
the subject of this paper are the SQM documents and structured interviews.
The project started with the development of a process map depicting the main stages of supplier
quality in EPC projects by collecting information from the SMEs through face-to-face meetings,
site visits, and other documented sources. Figure 1 depicts a high-level process map of the
supplier quality (SQ) process. The map contains five major processes beginning with planning
and selection of the suppliers. Execution (of the fabrication along with the supplier quality plan)
follows with subsequent processes depicting release of completed purchase orders (POs), i.e.
packages of fabricated products, from the supplier’s shop, receipt of those packages at the
construction site, and mechanical completion (products are physically connected in place in the
facility), which marks the end of the scope of analysis for this project. Feedback loops are
embedded at each step within the process. Details of this SQ process can be found in Alves et al.
(2013).

60
Figure 1: Supplier quality (SQ) process map. Adapted from Alves et al. (2013).
The SQ process map is used in this paper to define the main stages of the SQ process as
described by the SMEs and to locate the practices described by the various data sources on the
map.
The purpose of this paper is to identify effective practices to manage supplier quality that can be
used by professionals in the construction industry to improve their SQM and reduce the need for
rework and replacements in the field. The findings of this research will benefit the design,
construction, supplier, and management professionals and researchers in the construction
industry to explore the applicable practices that would help to improve existing SQM practices in
EPC projects.
Background on EPC Supply Chain
An engineer-procure-construct (EPC) project is a complex process involving a set of products
(materials, equipment), services, and construction tasks designed specifically to complete a
particular output for a customer within a certain period of time: a building, a power plant, a
turnkey factory, or the like (Cova & Hoskins, 1997). In EPC projects, owners, contractors,
subcontractors, and suppliers collaborate for a definite period of time to deliver the project to the
client and then move on to other projects (Caldas, 2012). Yeo & Ning (2002) recognized
additional distinctive characteristics of EPC projects: the actions are interdependent, the work is

61
split into many units leading to a compound organizational structure, and the unsteady
environment compels recurrent changes.
Supplier quality management (SQM) in the EPC project is a key factor of the overall project
success with respect to quality (Tommelein et al., 2003; Needy & Ries, 2010). SQM is a system
of processes and practices applied by the project organization to ensure that the quality of
fabricated materials and equipment meet the project’s requirements and specifications (Caldas et
al., 2012). SQM in the construction supply chain depends largely on how the members involved
in the project (contractors, subcontractors, and suppliers), understand what exactly is needed to
achieve the required level of quality. Each member acts as a functional area within the chain with
an integrated linkage between each member and the others. The construction supply chain
members may involve multiple tiers of suppliers adding complexity for any EPC project with
respect to ensuring supplier quality. An illustration of the process flow diagram for the supply
chain of a construction project appears in Figure 2.
Figure 2: The process flow diagram for the supply chain of a construction project

62
The Council of Supply Chain Management Professionals (2012) contends that supply chain
management (SCM) is an integrating function that links major business function processes
within and across companies into a consistent and high-performing business model.
Qualitative Data Analysis
The data in this research came from two main sources (the structured interviews and SQM
documents) that were collected in written or verbal form, and then summarized in narrative form.
Schutt (2012) summarized the major features of qualitative data analysis in which the focus is on
meanings not quantifiable issues, the study is in depth, and the goal is to come up with a detailed
description rather than measurement of particular variables. In this research, qualitative
approaches for data analysis are considered the most appropriate methods for analyzing this type
of data because the study does not depend on specific variables for analysis, but rather on
concepts and meanings. Therefore, the focus of this study is to draw conclusions based on
detailed understanding and discovery of relationships between the concepts.
In order to achieve reasonable conclusions, an effective qualitative data collection protocol
should use a systematic process for data collection, a planned method and documentation for
data analysis, in addition to a multiple-person contribution for verification (Srnka & Koeszegi,
2007). In this research, we used systematic methods for data collection and analysis. As the
research progressed, the data analysis was presented to the SMEs to obtain feedback,
interpretation and validation of findings.
Along these lines, Schutt (2012) determined the steps for qualitative data analysis, which were
used as guidance in this research. According to Schutt, the data analysis process starts with

63
documenting the data collection process, and ends with validation and reporting. An overview of
the qualitative data analysis process is presented in Figure 3.
Figure 3: An overview of the qualitative data analysis process. Adapted from Schutt (2012).
Grounded Theory
The data analysis process should identify the appropriate approach for analyzing the data. In this
research, grounded theory was used in the data analysis. Grounded theory uses systematic and in-
depth comparison of text segments to make thematic arrangement and theory from a body of text
(Guest & Mitchell, 2012). This analysis method involves constructing inductively an organized
theory that is supported by the observations (Schutt, 2012) and the researcher identifies the
emergent themes and categories of the qualitative data under examination through inductive
analysis. A summary of the data analysis procedure using the appropriate Grounded theory
techniques for this study is depicted in Figure 4.
Figure 4: Data analysis process using the appropriate grounded theory techniques
Step 1: Documenta/on: Document the data and the data collec)on
process.
Step 2: Conceptualiza/on and categorizing:
Categorize the data into concepts.
Step 3: Examining rela/onships: Connect the data to show
influence between concepts.
Step 4: Valida/on and repor/ng: Verify and present the final
conclusions.
Scan the documents'
(data) contents and write comments
Ask ques)ons and make theore)cal comparisons
Conduct line-‐by-‐line
inves)ga)on (Microanalysis)
Develop coding
scheme and make rela)ve tables and diagrams
Develop selec)ve coding
Iden)fy the results of analysis
Validate the
analysis
64
According to Strauss & Corbin (1998) asking questions is one of the basic operations in
grounded theory; it helps researchers understand the variations within the several cases of the
data collected, and guides researchers in outlining the basic concepts that can be drawn from
data. The researchers then can start making theoretical comparisons to discover both variations
and general patterns (similarities) in the data under study.
Strauss & Corbin (1998) determined that grounded theory involves the process of Microanalysis
which is a detailed line-by-line investigation to produce initial categories. Each category has its
own property, which defines the meaning of the category and its characteristics. The category
also has dimensions that define the range of possible values of a category, for example the
dimensions of a company type for the construction organizations in this research are owner and
contractor. The microanalysis evolves through the study to include a coding technique in which
data are broken-down, conceptualized, and integrated to form an analysis structure that helps in
obtaining conclusions and findings from the data (Strauss & Corbin, 1998). The coding
technique could be in the form of open coding in which the categories and their dimensions are
discovered through line-by-line examination of data (microanalysis). The selective coding
technique is performed in an advanced stage of data analysis in which a category is chosen
among the existing categories to be central for the purpose of integrating the analysis findings
and building conclusions. Coding also involves developing the necessary diagrams and tables
that show relationships among the categories. Once the analysis is completed and appropriate
conclusions are obtained, the researcher can validate the method of analysis and the resultant
conclusions.
An important point about grounded theory is that the intent is not always to develop a dense and
integrated theory. Strauss & Corbin (1998) explained that the aim of grounded theory is to

65
develop a description of the data, obtain a conceptual ordering, or discover categories from data.
Conceptual ordering is defined as “the organization of data into discrete categories according to
their properties and dimensions and then using description to elucidate those categories” (Strauss
& Corbin 1998, p.19). In this research, the purpose of using grounded theory is to follow a
systematic data analysis process, as shown in Figure 4, which assists in developing a conceptual
ordering and rich description of the data.
In summary, this research combines the qualitative data analysis process adapted from Schutt
(2012), as shown in Figure 3, to perform the data analysis with the grounded theory method.
Figure 5 illustrates this integrated approach.
Figure 5: Grounded theory method with the process of qualitative data analysis
Research Methodology
The SQM documents and structured interviews were analyzed using the steps described in
Figure 5. The SQM documents were used to analyze the current practices for SQM in
construction. These documents include reports and procedures used by construction
organizations as part of their SQM practices such as supplier performance evaluation forms,
inspection reports, and quality problems notices. The structured interviews were used to learn in-
Scan the documents'
(data) contents and write comments
Ask ques)ons and make theore)cal comparisons
Conduct line-‐by-‐line
inves)ga)on (microanalysis)
Develop coding
scheme and make rela)ve tables and diagrams
Develop selec)ve coding
Iden)fy the results of analysis
Validate the
analysis
Step 1: Documentation
Step 2: Conceptualization and categorizing
Step 3: Examining
relationships
Step 4: Validation and reporting

66
depth about the supplier quality process and compare the current practices among the
organizations that have been interviewed. The detailed analysis of the SQM documents and
structured interviews is described next.
Step1: Documentation
SQM Documents
The academic team asked the participating organizations to provide documentation pertaining to
their SQM processes and procedures. These documents were reviewed and catalogued according
to the organization type (owners and contractors, with suppliers being included in the contractors
category per CII’s standards).
The research team includes 21 construction organizations, including 7 owners and 14
contractors. The total number of documents provided for analysis was 92, including 50 reports
and 42 procedures. A summary of the number and type of documents provided is shown in
Figure 6.
Figure 6: Summary of the provided documents
The SQM reports are written documents to record quality issues such as non-conformances
(NCs), and required corrective actions. Examples of these reports are: construction quality
assurance survey, supplier quality assessment, quality surveillance report, and source inspection
15
35
18 24
Owners (7 organiza)ons) Contractors (14 organiza)ons)
No. of reports No. of procedures

67
report. The SQM procedures are written documents that define a specific process or describe a
set of requirements that should be followed during the procurement, fabrication, and delivery of
products/services. Examples of these procedures are: operations handbook-subcontract
management, inspection procedure, and post award procurement process.
Structured Interviews
Interviews were conducted on a voluntary basis in a face-to-face setting, or via phone using a
structured interview data protocol. The team documented the structured interview findings and
recorded the date, time, and location of each interview. The interview questions were grouped
into seven sets, including: supplier quality organization, supplier quality system, metrics, data,
assessment, supporting documents, and suppliers.
Step 2: Conceptualization and categorizing
SQM Documents
The documents were examined to determine a high level categorization to assist with developing
a detailed analysis of the SQM documents gathered. While examining the documents, a number
of theoretical questions were asked to help in building the main categories of analysis and to
identify the variations among the documents. The criteria for identifying the theoretical
questions were as follows:
• Questions were derived from the contents of the documents (Figure 7) to group the
contents into a reasonable number of categories that include main ideas. Categories were
planned to be used for cross analysis among the other data sources, such as location on
the SQ process map.

68
• Questions should have answers that can converge into a definite number of responses
(dimensions) and can assist in the comparison among the documents. Some questions
were initially asked for comparison such as date of reports, frequency of inspection, and
number of people involved in the inspection. In the case of reports, these questions were
excluded because the answers were not available in the documents.
Figure 7 presents the main questions asked for each type of document (report and procedure).
Figure 7: Theoretical questions for the documents
After identifying the questions, the documents were then compared to build the main categories
around the questions and to identify the possible answers. Comparison was performed through
RT 308 Docum
ents
Reports
What is the report /tle?
What is the report type ?
What is the organiza/on/company type ?
Was there a site visit?
Where do ac)vi)es map onto the SQ process map ?
What was the construc/on task invloved in the report content?
What was the ac/on required in case of non-‐conformances (NCs)?
What is the level of detail for the report contents?
Procedures
What is the procedure /tle?
What is the procedure type?
What is the company/organiza/on type?
Where do procedures map onto the SQ process map?
What is the procedure scope?
What is the level of detail for the procedure contents?

69
examining the contents of the documents. The depth of examination increased at each iteration
in which the documents were checked, beginning with general review of the contents and writing
related comments, and ending with line-by-line review (microanalysis). An open-coding
technique of grounded theory was used in analyzing the documents. In open-coding, the
categories and their dimensions are discovered and titled (Strauss & Corbin, 1998). In this
analysis, there were no predetermined categories and dimensions prior to examining the data; the
categories evolved from the data (reports’ and procedures’ contents). Table A-1 in the Appendix
depicts a template including the main categories that were used to complete the data analysis.
When the company provided more than one document, additional columns were added under the
company heading cell. Table 1 and 2 represent the open-coding for the reports and procedures
including the categories and their dimensions. The description (property) for each dimension is
presented in Tables A-2 and A-3 in the Appendix.
Category Possible dimensions 1. Company type Owner
Contractor 2. Report type Inspection report
Follow-up Checklist/ Progress report
3. Location on SQ process map (Figure 1) Assessment of criticality Planning and selection Execution Release from shop Received at site Mechanical completion
4. Site visit Yes No N/A
5. Construction task Welding Parts Miscellaneous N/A
Table 1: Open-coding for reports (categories and dimensions)

70
Category Possible dimensions 6. Action required for Non-Conformances (NCs) Repair
Rework Replace Accept as is Others N/A No NCs
7. Level of details High Med Low
Table 1 (Cont.): Open-coding for reports (categories and dimensions)
Category Possible dimensions 1. Company type Owner
Contractor
2. Procedure type Procedure Flowchart Lesson Procedure and flowchart
3. Location on SQ process map (Figure 1) Assessment of criticality Planning and selection Execution Release from shop Received at site
4. Scope Inspection SQS level according to criticality QA planning for equipment and material procurement Supplier qualification, selection, and quality planning
5. Level of details High Med Low
Table 2: Open-coding for procedures (categories and dimensions)
To determine the level of detail for the documents, a rubric of scores was developed for the
reports and procedures to assign a level for each document examined. This qualitative research
method is called scaling (Miles & Huberman, 1994) whereby the documents’ contents are scaled
to consistently appraise and compare the contents. If the document has a total score between 4
and 5, then the level of details is high, if 3, then medium, and if 0 to 2, then the level is low.
Table 3, 4, and 5 describe the rubric of scores.

71
Category Description Score (0-1) Administration The report includes the date, location, date of previous visit, upcoming
prospective visit, and contact information.
Usability The report is easy to use. Responsibility The report identifies the responsibilities of the administrative task or corrective
actions that need to be taken as part of the supplier quality process.
Impact The report includes a description of quality impact on project management. That includes impact on cost, comparison between actual and planned, and relative comparison to previously agreed specifications on purchase order or contract.
Illustration The report includes illustrative pictures and/or drawing for the non-conformances or other issues that help in monitoring supplier quality
Total Score 0-5 Table 3: Level of details rubric of scores: Reports
Category Description Score (0-1) Administration The procedure has an issue and revision date, and indicates the department
responsible for issuing the procedure
Supportive documents
The procedure identifies a section for supportive documents for further reading if necessary
Clarity The procedure has clear definitions for the acronyms and/or glossary of terms Description The procedure has clear description of the intended subject. The reader can
easily understand the procedure content.
Illustration The procedure has some illustrative materials to help the user in implementing the procedure (drawings, illustrative examples)
Total Score 0-5 Table 4: Level of details rubric of scores: Procedures
Level of detail Score High 4-5 Med 3 Low 0-2
Table 5: Level of details possible scores
Structured Interviews
A total of 29 interview questions were grouped into seven sets that focus on several aspects of
SQM. Each set of questions in the interview was categorized into main concepts to build a high
level categorization that would help in the analysis. After conducting the six interviews and
examining the resulting data, i.e. microanalysis of the interview responses, a coding scheme was
developed for the purpose of comparison among the organizations interviewed. Figure 8 presents
the categorization for each set of questions with the coding scheme highlighted in bolded text.

72
Figure 8: Interview sets of questions (categorization and coding scheme)
Step 3: Examining Relationships
SQM Documents
After classifying the documents and their contents into categories, the template in Table A-1 in
the Appendix was completed in an Excel spreadsheet, and imported into a qualitative data
analysis software package named QDA Miner® (version 4). QDA Miner® is a qualitative data
analysis software package used for coding and analyzing collections of documents (Provalis
• SQ in Organiza/on chart • Top management role • Supplier quality personnel
Set 1: Supplier quality organiza/on
• Decisions to choose suppliers • Process to select suppliers • Supplier removal • SQS and other tools to ensure supplier quality
Set 2: Supplier quality System
• Supplier performance metrics • Time/stage of measuring supplier performance • Responsibility to measure supplier performance • Supplier performance and future work
Set 3: Metrics
• Supplier performance tracking • Supplier performance documents • Non-‐conformance (NC) documenta)on • Supplier performance data on SQ process map
Set 4: Data
• Strengths • Opportuni/es for improvement • Challenges • Level of maturity of the supplier quality system
Set 5: Assessment
• Documents related to quality of products and services • Procedures and guidelines for quality system Set 6: Suppor/ng documents
• Sub-‐suppliers quality assurance • Number of ac)ve suppliers • Tiers of suppliers
Set 7: Suppliers
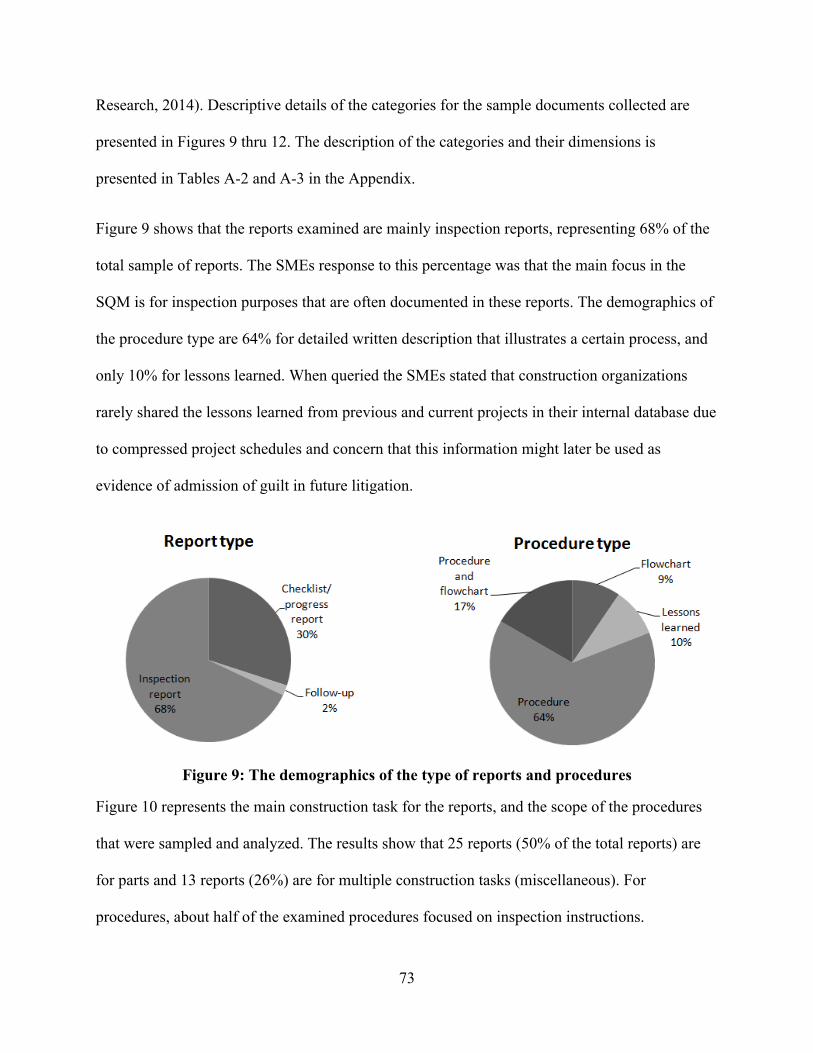
73
Research, 2014). Descriptive details of the categories for the sample documents collected are
presented in Figures 9 thru 12. The description of the categories and their dimensions is
presented in Tables A-2 and A-3 in the Appendix.
Figure 9 shows that the reports examined are mainly inspection reports, representing 68% of the
total sample of reports. The SMEs response to this percentage was that the main focus in the
SQM is for inspection purposes that are often documented in these reports. The demographics of
the procedure type are 64% for detailed written description that illustrates a certain process, and
only 10% for lessons learned. When queried the SMEs stated that construction organizations
rarely shared the lessons learned from previous and current projects in their internal database due
to compressed project schedules and concern that this information might later be used as
evidence of admission of guilt in future litigation.
Figure 9: The demographics of the type of reports and procedures
Figure 10 represents the main construction task for the reports, and the scope of the procedures
that were sampled and analyzed. The results show that 25 reports (50% of the total reports) are
for parts and 13 reports (26%) are for multiple construction tasks (miscellaneous). For
procedures, about half of the examined procedures focused on inspection instructions.

74
Figure 10: The demographics of the construction task and procedure scope
As shown in Figure 11, the level of detail for the reports is high to medium (78% of the reports)
which reflect good documentation of SQM processes and practices. A similar result was
observed for the procedures examined indicating that more than 60% of them have high level of
detail.
Figure 11: The demographics of the level of detail for the examined reports and procedures
Analysis of the reports indicates that 70% of the examined reports were for site visit to the
supplier’s facility (as presented in Figure 12). The majority of the sample reports (66%) reflected
quality problems for repair, replace, rework, and accept as is. Only 10% of the reports
represented cases of perfect supplier practice (no non-conformances being detected).
0% 20% 40% 60% 80% 100%
High
Med
Low
% of Reports and procedures
Level of d
etail Reports
Procedures

75
Figure 12: The demographics of action required for Non-Conformances (NCs) and site visit
- Reports
To describe the common focus of the SQM documents with regard to the SQ process, they were
mapped onto the SQ process map (location on SQ process map, category 3 in reports and
procedures).The location on SQ process map forms the main category for the selective coding
process in grounded theory. Figure 13 depicts the location of the reports and procedures
examined on the SQ process map. In some cases, SQM documents can be located on a particular
phase within the SQ process map such as planning and selection, while the others span more than
one phase such as planning and selection to Execution (the last 4 columns of Figure 9 are for
SQM documents having the latter case).

76
Figure 13: The demographics of the location on SQ map for the reports and procedures
As shown in Figure 13, most of the documentation gathered was clustered in the execution phase
of the SQ process map for both reports and procedures.
In summary, most of the reports examined were inspection reports with mostly a high-medium
level of detail. More than half of the gathered reports described quality problems, mainly repair
and rework, along with site visits to the supplier facility for inspection purposes. The collected
sample of procedures has a high level of detail and mainly describes inspection processes.
Structured Interviews
Contractors interviewed using the structured interview protocol were classified into three main
groups according to their responses of the level of maturity of their SQ system, Set 5 of the
interview questions as shown in Figure 8. This classification helped in making comparisons and
forms the selective coding of the grounded theory. The interview question that was used for
selective coding was “Would you consider the supplier quality system at your company to be
highly mature?” Contractors responded to this question describing the maturity and effectiveness
of the SQ system (or SQM as defined by Caldas et al. 2012) within their organizations. Not all
contractors indicated their SQM was mature. They considered themselves in the incipient period

77
pointing out that their SQM was benchmarked to be least effective against other construction
organizations with highly effective SQM. Table 6 provides the main dimensions based on the
response of the interviewed organizations.
Interview question (selective coding)
Dimensions Organizations’ answers
Would you consider the supplier quality system at your company to be highly mature? Code: Level of SQM maturity (effectiveness)
Not mature: Organizations with least effective SQM. No. Incipient period.
Somewhat mature: Organizations with moderately effective SQM.
No. We’re in the middle.
Highly mature: Organizations with highly effective SQM.
Yes. We’re a benchmark for the industry.
Table 6: Selective coding for the interview questions
After classifying the organizations interviewed using the three dimensions, the responses for
each set of questions were organized into organizations with least effective SQM, organizations
with moderately effective SQM, organizations with highly effective SQM. Tables 7 through 9
show the responses followed by an interpretation for each. The bolded text in the tables describe
the categorization for each set of the interview questions as described in Figure 7, and highlight
the differences among the interviewed organizations.
Organizations with least effective SQM
Organizations with moderately effective SQM
Organizations with highly effective SQM
Set 1
: Sup
plie
r qu
ality
org
aniz
atio
n SQ in Organization chart
Part of procurement and quality management.
Part of procurement. Part of procurement.
Top management role
• Senior directors of procurement, engineering and Quality lead the SQ
• Senior leadership, which is subset of procurement, reviews SQ
• Sets the vision and policy, directions, and leads Improvement initiatives (formal causal analysis.)
SQ personnel Local and global. Local and global. Local and global.
Set 2
: Sup
plie
r qu
ality
Sys
tem
Decisions to choose suppliers
Procurement and Engineering choose suppliers.
Procurement, project manager and the client choose suppliers.
Procurement and engineering choose suppliers.
Process to select suppliers
• Based on survey, quality audits, and re-qualification form.
• Based on technical and commercial evaluation.
• Based on technical, commercial evaluation, surveys and ratings.
• Classification of strategic and non-strategic suppliers.
Table 7: Set 1 and 2 of the interview questions

78
Organizations with least effective SQM
Organizations with moderately effective
SQM
Organizations with highly effective SQM
Set 2
(Con
t.): S
uppl
ier
qual
ity S
yste
m Supplier
removal
• Based on poor performance.
• Corruption and using color score for suppliers.
• Based on poor performance on multiple projects (performance lists).
SQS • Use inspection based on
criticality, but there isn’t written procedure.
• Use inspection formula and coordinators.
• Use database on supplier history, and evaluate by multiple disciplines
Other tools for SQ
• Form SQ team for high criticality items.
• Use engineering reviews (documents).
• Use audits and surveys.
Table 7 (Cont.): Set 1 and 2 of the interview questions
The results in Table 7 indicate that the SQM is mainly within the procurement division for all
organizations, but for organizations with highly effective SQM, top management sets the vision,
policy and direction for the organization, and initiates improvement to the process. For the
supplier quality system, organizations with highly effective SQM differ from other organizations
in terms of having a careful process to select their suppliers, and maintaining a classification for
strategic and non-strategic suppliers. In addition, they use performance lists to track
performance, decide which suppliers should be removed, and keep a database that is shared and
evaluated throughout their organization to analyze suppliers’ work on pervious projects.
Organizations with least effective SQM
Organizations with moderately effective
SQM
Organizations with highly effective SQM
Set 3
: Met
rics
Supplier performance metrics
• Use NCs report, but there’s no designated procedure.
• Use supplier evaluation module in procurement data base.
• Use rating system, NCs reports, and issues per visit.
Time/stage of measuring supplier performance
• After each delivery and monthly.
• After completing 10% of the PO.
• Throughout the PO.
Responsibility to measure supplier performance
• Procurement, project managers, and SQ committee.
• Procurement. • Engineering, procurement, logistics, and SQS.
Supplier performance and future work
• Yes. Based on schedule.
• Yes. • Yes. Formula is used to calculate the effort of SQS.
Table 8: Set 3 and 4 of the interview questions

79
Organizations with least effective SQM
Organizations with moderately effective
SQM
Organizations with highly effective SQM
Set 4
: Dat
a
Supplier performance tracking
• Using reports. • Using supplier evaluation module.
• Using global data base.
Supplier performance documents
• Archived in inspection and audit reports.
• Pulled from a data base.
• Pulled from a data base.
NCs documentation • Corrective action program.
• Pulled from a data base monthly.
• Pulled from a data base.
Supplier performance data on SQ process map (3.1 Release from shop, 3.2 Received at site, 3.3 Mechanical completion)
• Data only during release from shop and received at site.
• Data only during release from shop.
• Data during all SQ stages except mechanical completion which has different system.
Table 8 (Cont.): Set 3 and 4 of the interview questions
As presented in Table 8, the supplier performance measurement system is more advanced for
organizations with highly effective SQM. These organizations measure the performance
throughout the execution of the PO, and they evaluate supplier performance not only by the
procurement function, but also by multiple disciplines including logistics and SQS (supplier
quality surveillance). The performance measurement outcomes and metrics are used in a formula
to calculate the level of SQS in future projects with the same supplier. For organizations with
moderately effective SQM, they have initiatives to improve their SQM using a module within the
procurement database to measure the supplier performance.
Organizations with least effective SQM
Organizations with moderately effective
SQM
Organizations with highly effective SQM
Set 5
: Ass
essm
ent
Strengths
• Risk identification. • Quality plans. • Well trained
inspectors. • Inspection coverage. • Selecting suppliers.
• Developing project-specific procurement quality plan.
• Consistency in using tools and practices.
• Internal data-base.
• Coordination. • Inspection coverage. • Measuring supplier
performance. • Consistency in using
tools and practices. • Selecting and
qualifying suppliers. • Developing project-
specific procurement. • Well trained
inspectors. Table 9: Set 5, 6, and 7 of the interview questions

80
Organizations with least effective SQM
Organizations with moderately effective
SQM
Organizations with highly effective SQM
Set 5
(Con
t.): A
sses
smen
t
Opportunities for improvement
• Selecting and qualifying suppliers.
• Measuring supplier performance.
• Measuring inspector performance.
• Consistency in using tools and practices.
• Risk identification.
• Well trained inspectors. • Measuring supplier
performance.
• Selecting and qualifying suppliers.
• Well trained inspectors.
• Inspection coverage. • Measuring inspector
performance. • Providing feedback
to suppliers.
Challenges
• Educate suppliers. • Defining the cost of
quality.
• Budget, well trained inspectors.
• Suppliers don’t read the contract in sufficient detail.
• Cultural differences for low cost supplier in emerging global markets.
Set 6
: D
ocum
ents
Documents for SQM • Copies of documents were provided for analysis
Set 7
: Sup
plie
rs
Sub-suppliers quality assurance
• Visit the sub-supplier.
• Assume the suppliers are responsible.
• Use risk based approach: If the job is complex, they will meet sub-suppliers.
• Treat critical sub-suppliers same as suppliers, and make sure the requirements flow-down.
Number of active suppliers
• 60 -100. • Trend to
form partnership.
• 2,000. • 600-30,000.
Tiers of suppliers • 3 • 4 • 3
Table 9 (Cont.): Set 5, 6, and 7 of the interview questions
Table 9 summarizes the responses for set 5, 6, and 7 of the interview questions. The contractors
interviewed were given a list including ten examples of strengths (such as coordination,
measuring supplier performance, and risk identification) to choose from with the option to
include additional ones if they wished. Table 9 shows that the strengths of organizations with
highly effective SQM are coordination between the parties involved in the project, and the
measurement of supplier performance in a consistent manner. These organizations are working
to improve the inspector coverage, and the feedback process to the suppliers. Organizations with

81
highly effective SQM still face problems with the contractors that do not properly read the
contract in sufficient detail at the beginning of the project, and with the suppliers in the emerging
global markets that have a different culture. In terms of managing the tiers of sub-suppliers,
organizations with less effective SQM assume that the suppliers are responsible for the quality of
their sub-suppliers. For organizations with highly effective SQM, they are proactive in terms of
making sure that the information flow-down is clear for all the tiers of sub-suppliers, also they
treat the critical sub-suppliers in the same way they treat their primary suppliers. Although these
organizations have a large number of suppliers in their database, they tend to form partnerships
with their strategic suppliers (strategic suppliers’ base).
Step 4: Validation and Reporting
The validation of the research involves getting feedback from the informants and using two
methods of triangulation, namely researchers’ check and multiple instruments verification or
cross analysis (Miles & Huberman, 1994).
In this research the SMEs (the informants) were involved in the analysis, offering their input for
the research method and their insights for the interpretation of results found.
The first triangulation method that was used in this study is researchers’ check. The researchers
were involved to check the analysis steps for the SQM documents and structured interviews to
identify any inconsistencies in the analysis. The second method that was used is cross analysis to
verify the findings from the SQM documents, structured interviews, and the construction
industry literature with regard to the effective practices of SQM. To implement this method, the
SQM documents for organizations who reported themselves with highly effective SQM were re-

82
examined to identify their effective practices in order to align them with the findings from the
structured interviews and the literature. The cross analysis is described in the following sections.
Results Discussion
The SQM documents gathered from organizations with highly effective SQM were compared
with the documents provided by organizations with least effective and moderately effective
SQM. The effective practices for organizations with highly effective SQM that appeared
different compared to the others include using percentages to indicate the work capacity of the
suppliers during selection. These organizations assess how much of the supplier’s capacity is tied
up with other POs, i.e. a low percentage indicates that the supplier has low capacity due to a high
number of other customer’s orders that have to be fulfilled). Also, these organizations analyze
the impact of NCs to the project cost and schedule and identify who is responsible for
performing the corrective action using responsibilities charts.
The effective practices found from analyzing the SQM documents are aligned with the structured
interview findings. In addition, these practices identified from the SQM documents and
structured interviews are compared to what have been found in the construction industry
literature. The effective practices are discussed according to the phases of the SQ process map in
the following paragraphs:
1. Planning and selection: Organizations who reported themselves with highly effective SQM
classify their suppliers into strategic (partnerships) and non-strategic. The analysis of the SQM
documents for organizations with highly effective SQM shows that these organizations assess the
supplier’s workload to identify the total orders that have to be fulfilled for other customers. This
assessment helps to determine the overall work capacity of the supplier.
83
The construction industry literature has indicated an emphasis on the supplier’s planning and
selection process. Songhori et al (2011) concluded that an effective supplier selection process
directly impacts the supply chain performance, resulting in improved results to the organization.
In addition, reducing the supplier base and forming strategic partnerships with the suppliers to
achieve project success is also valuable (Peters, 1987). Arditi & Gunaydin (1998) also indicate
that healthy partnerships with suppliers affect process quality in construction projects.
2. Execution: Organizations with highly effective SQM indicated in the structured interviews
that they are proactive in terms of developing their suppliers and treating critical sub-suppliers
the same as suppliers. The analysis of the SQM documents shows that these organizations
ultimately determine the cost and quality impact of the NCs to the project and identify who is
responsible for the correction and the due date for completion. Providing support to the supplier
by utilizing proper SQM tools is important for a successful SQM (AlMaian et al., 2013).
2. Execution through 3.3 Mechanical completion: The organizations with highly effective SQMs
maintain well-trained inspectors and use consistent tools to measure supplier performance as
reported during the structured interview. Similar practices are found and/or recommended by the
literature on construction supply chains.
Tommelein et al. (2003) found that organizations that perform systematic performance ratings of
overall supplier processes create an added value to improve their projects’ performance. Another
study focusing on total quality management in the construction industry conducted by Arditi &
Gunaydin (1997) suggested that organizations must be proactive and determine the root causes
of poor quality and design training programs aimed at eliminating these causes. Along these
lines, using consistent inspection procedures is paramount because their inconsistent use hinders

84
the proper implementation of the quality management system in construction organizations (Lo,
2002).
1. Planning and selection through 3.3 Mechanical completion: The structured interviews with
organizations with highly effective SQM reported that they involve top management (leadership)
to improve the SQ system (set the vision, directions, and improvement initiatives), develop an
internal database to track supplier performance and analyze future decisions, measure the
supplier performance throughout the PO, evaluate the suppliers from multiple disciplines, and
use a detailed formula to calculate the effort of SQS based on criticality of the items and
previous supplier performance.
The literature also supports these findings as consistent management commitment, and the use of
consistent quality management processes and quality metrics across the project life cycle form
the foundation of effective quality management in the construction industry (Needy & Ries
2010). In a similar fashion, Chase (1993) described common elements of management roles used
by construction organizations to ensure quality. The elements include top management
involvement and commitment, the use of formalized process improvement techniques, helping
suppliers and subcontractors improve, and thriving for continuous improvement. However, Ford
et al. (2005) identified that many construction managers are making quick fixes to current
problems rather than implementing long-term solutions for improving organizational
performance. These quick fixes often do not resolve the underlying problem. Top management
must commit to decisions resulting in long-term benefits for the organization.

85
Conclusions
This paper presented an integrated approach of grounded theory and qualitative data analysis
process, as presented in Figure 5, to analyze data obtained from SQM documents and structured
interviews. Throughout the research, SMEs were involved in the analysis process through face-
to-face meetings to discuss the findings, and provide feedback during the analysis and validation
phases. In total, 92 documents including 50 reports and 42 procedures provided by contractors
and owners involved in EPC projects were analyzed. In addition, 6 structured interviews with
construction contractors were conducted and their responses were analyzed.
In summary, organizations with highly effective SQM place importance on the planning and
selection phase where they classify their suppliers into strategic and non-strategic, and they have
higher involvement from top management throughout the project. Most of the organizations have
proper documentation for their reports and procedures, however, organizations with highly
effective SQM use databases to store their documentation. These databases are visible to all the
parties involved in the project and company personnel can use the information stored in their
database for future procurement decisions when choosing suppliers.
The future work of this research includes in-depth cross analysis of the results obtained from the
qualitative data sources including the literature review of SQM effective practices inside and
outside the construction industry, SQM documents, structured interviews, supplier focus groups,
and the quantitative data sources including the purchase order (PO) survey instrument, and cost
curves modeling.
The findings from this research will benefit academic researchers and professionals in design,
construction, and management of projects by applying an integrated approach of grounded

86
theory and qualitative data analysis process, as described in Figure 5. Within EPC project
management in the construction industry, Civil and Construction professionals usually deal with
several sources of information (data) that could be in qualitative forms such as inspection
reports, suppliers’ bids, and request for information reports. These data can be interpreted and
presented to management using qualitative data analysis methods that help examining the
relationships among the data so that conclusions can be easily drawn. This paper also examines
current SQM practices by analyzing the structured interviews responses with the contractors and
the SQM documents. The research also classifies these practices according to the effectiveness
of SQM of the organizations sampled in order to identify what organizations with highly
effective SQM are currently practicing. Construction organizations can adopt these practices to
improve their current SQM systems. In this paper, the effective SQM practices are summarized
within the phases of the SQ process in order to help construction organizations implement these
effective practices within the EPC project life cycle.
Acknowledgment
This research effort is supported by the Construction Industry Institute (CII) on RT 308 –
Achieving Zero Rework through Effective Supplier Quality Practices. The opinions expressed in
this paper are those of the authors and not necessarily of CII.
References
AlMaian, R., Needy, K., Walsh, K., Alves, T., & Neuman, Y. (2013). Suppler quality management inside and outside the construction industry. 2013 American Society for Engineering Management Proceedings. Bloomington, MN.
Alves, T., Walsh, K., Neuman, Y., Needy, K., & AlMaian, R. (2013). Supplier quality surveillance practices in construction. 21st Annual Conference of the International Group for Lean Construction – IGLC 21 – Fortaleza, Brazil, 833-842.
87
Arditi, D., & Gunaydin, H. (1997). Total quality management in the construction process. International Journal of Project Management, 15(4), 235-243.
Arditi, D., & Gunaydin, H. (1998). Factors that affect process quality in the life cycle of building projects. Journal of Construction Engineering & Management, 124(3), 194.
Caldas, H.C., Menches, L.C., Navarro, L., & Vargas, M. D. (2012). An analysis of global procurement and materials management practices in the construction industry. Research Report No. 257-11. The Construction Industry Institute: The University of Texas at Austin.
Council of Supply Chain Management Professionals (2012). Retrieved May 2013, from: http://cscmp.org/aboutcscmp/definitions.asp
Cova, B., & Hoskins, S. (1997). A twin-track approach to project marketing. European Management Journal, 15(5), 546-560. Retrieved from: Caldas, H. C., Menches, L. C., Navarro, L., & Vargas, M. D. (2012). An Analysis of global procurement and materials management practices in the construction industry. Research Report No. 257-11. The Construction Industry Institute: The University of Texas at Austin.
Ford, E. W., Duncan, W., Bedeian, A. G., Ginter, P. M., Rousculp, M. D., & Adams, A. M. (2005). Mitigating risks, visible hands, inevitable disasters, and soft variables: Management research that matters to managers. Academy of Management Executive, 19(4), 24-38
Guest, G., Namey, E., & Mitchell, M. (2012), Collecting qualitative data: A field manual for applied research. Sage Publications Inc.
Lo, T. (2002). Quality Culture: A product of motivation within organization. Managerial Auditing Journal, 17(5), 272 276.
Miles, M. B., & Huberman, A. M. (1994). Qualitative data analysis: An expanded sourcebook. Thousand Oaks: Sage Publications.
Needy, K. & Ries R. (2010). Best practices in quality management for the capital facilities delivery industry. Research Report No. Research Report 254-11. The Construction Industry Institute: The University of Texas at Austin.
Peters, T. J. (1987). Thriving on chaos: Handbook for a management revolution. New York: Knopf.
Provalis Research (2014). Retrieved January 2014, from http://provalisresearch.com/products/qualitative-data-analysis-software/

88
Schutt, R. (2012). Investigating the social world: The process and practice of research. 7th edition, Sage Publications Inc.
Songhori,J., Tavana, M., Azadeh, A., & Khakbaz, M. (2011). A supplier selection and order allocation model with multiple transportation alternatives. International Journal of Advanced Manufacturing Technology, 52(1-4), 365-376.
Strauss, A. L., & Corbin, J. M. (1998). Basics of qualitative research: Techniques and procedures for developing grounded theory. Thousand Oaks: Sage Publications.
Srnka, K. J., & Koeszegi, S. T. (2007). From words to numbers: How to transform qualitative data into measurable quantitative results. Schmalenbach Business Review (SBR), 59(1), 29-57.
The Quality Improvement Glossary (2004). ASQ Quality Press - used in the descriptions in the tables in the appendix
Tommelein, I.D., Walsh, K.D., & Hershauer, J.C. (2003). Improving capital projects supply chain performance. CII Research Report 172-11. Construction Industry Institute, The University of Texas at Austin.
Yeo, K. T., & Ning, J. H. (2002). Integrating supply chain and critical chain concepts in engineer-procure-construct (EPC) projects. International Journal of Project Management, 20(4), 253-262.

89
Appendix D
ocum
ent T
ype
Company/organization type Owners Contractors
O1
O2
O3
O4
O5
O6
O7
C1
C2
C3
C4
C5
C6
C7
C8
C9
C 10
C11
C 12
C 13
C 14
Rep
orts
Number of documents
Report title Report type Location on SQ process map
Site visit Construction task
Action required for NCs
Level of detail
Proc
edur
es
Number of documents
Procedure title
Procedure type
Location on SQ process map
Scope Level of detail
Table A-1: A template for data analysis
Category Possible dimensions Description (property)
1 Company type Owner Organization that manages and coordinates the functions and
activities of a project and has the authority to make changes.
Contractor Organization responsible for the performance of a contract, including suppliers and subcontractors.
2 Report type
Inspection report
A report for “conformity evaluation by observation and judgment accompanied, as appropriate, by measurement, testing, or gauging.” (The Quality Improvement Glossary, ASQ Quality Press 2004, P.117)
Follow-up A document to provide feedback from a previous inspection. Checklist/ progress report
A document with a checklist for evaluation or tracking the progress of a project. Usually used internally.
Table A-2: Open coding for reports (categories, dimensions, and properties)

90
Category Possible dimensions Description (property)
3 Location on SQ process map (Figure 1)
Assessment of criticality
In this stage, purchase orders (POs), i.e. packages of products, to be purchased are assigned to a certain level of criticality (low, med, high) based on their impact to the project cost and schedule.
Planning and selection
This stage involves supplier selection and qualification including the assessment of the supplier’s financial and quality capabilities, as well as past performance.
Execution This stage includes developing supplier quality plan, observing supplier’s work, and documenting observations.
Release from shop Final inspection of packages prior to shipping occurs in this stage.
Received at site
In this stage, a recipient inspection occurs at site to accept or reject the shipped packages.
Mechanical completion
The packages of products are installed in this stage and ready for use. Mechanical completion is the end stage for the purpose of this research.
4 Site visit
Yes There was a site visit conducted No No site visit was conducted
N/A
• For progress report, follow-up report that includes a summary of findings after a site visit, or after items received at site, or
• If not clear that the report was a summary of a site visit, or if the report was not filled (sample)
5 Construction task
Welding The process of joining metal parts.
Parts
This task includes: Pumps (water pumps),Grating, Injection umbilical, Coolers, heaters, Anodes, Valves, Drums, Gas filters, Blades Structural steel, Exchanger box, duct, Vessel, Electric components.
Miscellaneous
A combination of two or more of the following construction tasks: • Welding • Parts • Coating • Drawings • Painting • Drilling • Waste water system
N/A The report provided is not filled (sample) or report contents are not clear.
7 Action required for NCs
Repair
“Action taken on nonconforming item so it will fulfill the intended usage requirements although it may not conform to the originally specified requirements.” (The Quality Improvement Glossary, ASQ Quality Press 2004, P.208). That includes issues related to not following the agreed procedures.
Rework “Actions taken on a nonconforming item so it will fulfill the originally specified requirements.” (The Quality Improvement Glossary, ASQ Quality Press 2004, P.21)
Replace Action to return the non-conformed item for replacement.
Accept as is A decision to use the item in its existing condition and acknowledge that it is within an acceptable level of quality (the item may not necessarily be within the exact quality requirement).
Others Includes: Missing parts or missing information. Table A-2 (Cont.): Open coding for reports (categories, dimensions, and properties)

91
Category Possible dimensions Description (property)
Action required for NCs (Cont.)
N/A • For some checklist/progress report • If report is not filled or contents are not clear (no section for
NCs)
No NCs No non-conformances (NCs) were detected and corrective action was required.
8 Level of details High See Table 4 and 6. Med See Table 4 and 6. Low See Table 4 and 6.
Table A-2 (Cont.): Open coding for reports (categories, dimensions, and properties)
Category Possible dimensions
Description (property)
1 Company type Owner Organization that manages and coordinates the functions and activities of a project and has the authority to make changes.
Contractor Organization responsible for the performance of a contract, including suppliers and subcontractors.
2 Procedure type Procedure A detailed instructions describing a process Flowchart A drawing that shows the flow of activities for a given process. Lesson A document that reviewed a previous process and highlights the
main lesson learned to be used for later similar projects to improve the process.
Procedure and Flowchart
A document includes a detailed procedure and flowchart.
3 Location on SQ process map (Figure 1)
Assessment of criticality
See Table 2.
Planning and selection Execution Release from shop Received at site
4 Scope Inspection A description of the inspection process that has to be undertaken by the contractor.
SQS level according to criticality
A description of the supplier quality surveillance (SQS) effort according to material criticality that is being supplied.
QA planning for equipment and material procurement
Quality assurance (QA) plans for suppliers
Supplier qualification, selection, and quality planning
A description of activities for supplier assessment and prospective quality planning
5 Level of details High See Table 5 and 6. Med See Table 5 and 6. Low See Table 5 and 6.
Table A-3: Open coding for procedures (categories, dimensions, and properties)
92
4. ANALYZING SUPPLIER QUALITY MANAGEMENT PRACTICES IN THE
CONSTRUCTION INDUSTRY USING PRINCIPAL COMPONENTS ANALYSIS
Rufaidah Y. AlMaian, M.S Department of Industrial Engineering
University of Arkansas
Kim LaScola Needy, Ph.D., P.E., CFPIM, PEM Professor and Department Head
21st Century Professorship in Engineering Department of Industrial Engineering
University of Arkansas
Kenneth D. Walsh, Ph.D., P.E. Professor and Chair
AGC-Paul S. Roel Chair in Construction Engineering and Management Department of Civil, Construction, and Environmental Engineering
San Diego State University
Thaís da C. L. Alves, Ph.D. Assistant Professor
Department of Civil, Construction, and Environmental Engineering San Diego State University
Abstract
Supplier quality management (SQM) is an important function in the construction industry. Many
construction organizations place high importance on using quantitative analyses to select the
effective SQM practices that ensure that the materials, assemblies, and fabricated equipment for
the construction project are within quality specifications. However, traditional quantitative
analyses methods may be limited because the process of acquiring enough data to conduct the
analyses is time consuming and costly. This paper discusses the use of principal components
analysis (PCA) to analyze a number of SQM practices from construction organizations known
for their effective SQM. PCA is useful as the data available for analysis is small in size and
multivariate. SQM practices were discussed extensively and validated with the subject matter
experts (SMEs) by using the analytic hierarchy process (AHP). This resulted in the discovery

93
that supplier’s work observation, supplier performance rating, inspection effort tracking, and
inspection and testing plans are important practices for SQM. The contributions of this research
include proposing a quantitative method, PCA that can be used by quality engineers to analyze
small sample size data. The research also describes how AHP, an analysis method based on
expert judgment, can be used to validate and support the conclusions drawn from small sample
size analyses. Identification of important SQM practices can benefit construction professionals
with limited resources.
Keywords
Construction industry, Supplier Quality Management (SQM), Multivariate Data Analysis, Small
Sample Size, Principal Components Analysis (PCA).
Introduction
The paper presents findings from research supported by the Construction Industry Institute (CII),
and led by a research team composed of academic researchers, from industrial and
civil/construction engineering, and subject matter experts (SMEs), representing CII member
organizations as construction owners, contractors, and suppliers. The major research question
under study was: “What are the most effective processes and practices for ensuring that project
materials and equipment are produced, manufactured, or fabricated in strict accordance with all
applicable specifications, and that they are delivered to the project site without any need for
rework?
Data were collected from a range of quantitative and qualitative sources, including literature
review, structured interviews, SQM documents, supplier focus groups, along with a data
collection instrument to obtain quantitative information about SQM practices and performance

94
for individual purchase orders (POs) data (PO instrument). The main data source that is the
subject of this paper is the PO instrument. The PO instrument collected data about practices used
for the selection of suppliers, tracking of purchase orders, communication with suppliers,
installation of the products supplied in construction projects, and the resulting quality associated
with these practices. The responses were drawn from actual data about specific POs (not from
estimation), and each response represented data from a single PO. The PO instrument asked
participants about the use of SQM practices using closed-ended questions such as observing and
inspecting supplier’s work, and projecting inspection costs to determine their effect on detecting
non-conformances (NCs) per total PO value (NCs/$). Each question had a list of possible
answers from which the respondents selected the answer that best described the situation. Table
1 summarizes the SQM practices examined within the PO instrument questions.
SQM practices The closed-ended questions from the PO survey Possible answers
Supplier’s work observation Did you have a person in the supplier’s facility to observe the supplier’s work?
• Full time • Part time • Occasionally • Final only • Not at all
Inspection effort tracking Do you track hours, cost, or both, none?
• Hours • Cost and
hours • None
Inspection and testing planning (ITP)
Was there a quality control plan/inspection and testing plan (ITP) used for this specific PO?
• Yes • No
Supplier’s performance rating (after executing the work by the
supplier)
Did you conduct a performance rating of the supplier after execution?
• Yes • No
Inspection cost projection Did you project the cost of your inspection effort with this supplier for this PO?
• Yes • No
Table 1: Summary of the exploratory variables
In a separate effort, Neuman (2014) analyzed the PO instrument data and performed tests of
hypotheses and correlation analyses. Neuman’s analyses included cases in which data were
parsed by material type and PO criticality. The PO data were also categorized according to the
perceived effectiveness of the organizations’ SQM systems. In this regard, a series of focus

95
groups and structured interviews revealed a subset of construction organizations widely regarded
as having highly effective SQM (Walsh, et al., forthcoming 2014). In general, the organizations
with highly effective SQM perform an advanced process characterized by consistent use of a
wide range of SQM practices, and were distinguished in the results variables by their ability to
prevent, find, and correct NCs. The PO analysis effort permitted analysis to discover what the
organizations with highly effective SQM are doing differently compared to the other
organizations
Based on the PO instrument results, the following SQM practices were found to have significant
impact on detecting NCs/$ (Neuman, 2014), as summarized below:
1. Supplier’s work observation: Supervising the suppliers, full time or part time, to
ensure that they are meeting the project quality requirements.
2. Inspection effort tracking: Using tracking measures to determine the effort spent in
inspection, such as hours or dollars spent.
3. Inspection and testing planning (ITP): Using plans developed in concert with
suppliers for inspection and quality control at the beginning of each project.
4. Supplier’s performance rating (after executing the work by the supplier): Evaluating
the performance of the suppliers after fabricating the product.
5. Inspection cost projection: Estimating the costs associated with inspection visits.
The analysis of the PO instrument showed that organizations with highly effective SQM conduct
these practices more frequently than the other organizations and detect NCs earlier in the project
life cycle process. Also, these organizations perform more quality process meetings consistently
with their suppliers, such as lessons learned meetings, to discuss quality issues.

96
The SQM practices were analyzed in this paper to select the most important SQM practices used
by the construction industry by using a quantitative approach. The analysis can provide insights
to construction organizations on how best to invest their limited resources on the most important
SQM practices.
Research Motivation
Supplier quality management (SQM) in the construction industry is a system of processes and
practices applied by the project organization to ensure that the quality of fabricated materials and
equipment meet the project’s requirements and specifications (Caldas et al., 2012). SQM in the
construction industry is complex due to the irregular nature of every project in terms of its scope
and life cycle. Also, improving SQM is challenging because of the constraints of limited
resources of time, budget, and technical capabilities (AlMaian et al., 2013). The effectiveness of
SQM within the construction industry varies from one organization to the other. Organizations
with highly effective SQM use consistent practices for managing their suppliers (Walsh et al.,
forthcoming 2014). On the other hand, organizations with less effective SQM are still facing
difficulties in defining, standardizing, and improving their practices. In this paper, we analyzed a
number of SQM practices that have significant impact on quality based on research conducted by
Neuman (2014). The aim is to determine the most important practices that help organizations
improve their SQM. The identification of effective SQM practices is important in guiding
organizations to focus efforts on practices that yield high return in terms of resources spent to
achieve the best quality and avoid the waste associated with rework of any kind (re-designing
components, accepting deviations, fixing mistakes, re-fabricating items). The practices discussed
as part of this study can also be applied to other engineering fields such as aerospace and
97
shipbuilding as they are not exclusive to the construction industry as supported by the literature
review on SQM practices in other industries discussed by AlMaian et al. (2013).
In the context of construction organizations, the availability of data to analyze SQM practices is
a challenge as organizations usually keep track of indicators related to cost and time, but keep
details related to these and other SQM-related indicators scattered within different departments
and within different data collection systems (Walsh et al., forthcoming 2014). This challenge is
not unique to the construction industry, but is common for other industries as well where data is
limited due to economic and time constraints to acquire more data such as from complicated
quality tests and experiments. For example, Freeman (2011) used maximum likelihood
estimators (MLEs) to study a small sample size of failure data. In another study, Khoo (2005)
studied process dispersion monitoring in the manufacturing industry. The author analyzed the
effectiveness of quality control charts based on experiments of small sample size. The research
presented in this paper faces similar challenges with small sample size data. Generally within the
construction industry, the phenomenon regarding data availability in the SQM sector is well
known, due to time constraints and complexity to collect more data from several projects.
Research Methodology
The data under analysis is multivariate with small sample size. We have 31 data points and five
exploratory variables representing the SQM practices, as described earlier in Table 1.
In order to select the appropriate data analysis approach, three main areas were considered: small
sample size, categorical data analysis, and multivariate data analysis. Table 2 summarizes the
findings from several key textbooks.

98
Literature area Sources Findings
Small sample size
Hoyle (1999); Maddala & Lahiri
(2009)
The data analysis techniques found in these textbooks that treat the issue of small sample size were mainly for statistical analyses to identify the difference between groups of data.
Categorical data
analysis
Agresti (1990); Bourque & Clark
(1992)
Categorical variables can be coded using numbers, considering that these numbers are consistent for similar levels of different categories. For simplicity, we use numeric codes to represent the answers for survey questions appearing in Table 1. For example, a question with yes or no answers can be coded as 1 or 2 respectively.
Multivariate data
analysis
Cliff (1987); Grimm &
Yarnold (1995).
Based on examining the multivariate data analysis literature, we found that regression modeling techniques such as stepwise regression can be used as a variable selection method, along with PCA as a dimension reduction technique and variable selection method.
Table 2: The examined literature areas of data analysis
Scholarly academic journals were examined for articles that describe multivariate data
techniques with small sample size. However, we found that their techniques are not within the
scope of the paper, because they were mainly for identifying the difference between groups of
data. For example, Bathke et al. (2008) and Harrar, & Bathke (2008) used statistical comparisons
of multivariate data with small sample size. Saranadasa & Altan (1998) and Frömke, et al. (2008)
used permutation algorithms to test the difference between multivariate treatments.
In summary, based on examining the three areas of literature in the textbooks and the scholarly
journals, we found that regression modeling techniques and principal components analysis
(PCA) could be possible approaches to analyze the SQM practices. However, upon further
consideration, regression modeling requires a rule of thumb of having 15 to 20 observations for
each exploratory variable (Siddiqui, 2013), which is impractical for our problem. With regard to
the required number of observations for PCA, the PCA literature does not discuss the
requirements for the minimum number of observations with respect to the number of studied
variables. However, it does not recommend having the number of variables exceed the number of

99
observations. Further details can be found in Dunteman (1989) and Jolliffe (2002). Thus, PCA
was selected as an approach to analyze SQM practices.
PCA reduces the dimensionality of data by transforming data into a new set of principal
components, which retain most of the variation present in all of the original variables (Jolliffe,
2002). The PCA literature contains diverse applications for using PCA to select a number of
variables under analysis. For instance, Baciu & Parpucea (2011) studied the relationship between
U.S. crime rates and variables such as age, education level, and unemployment rate. The authors
performed PCA to determine which variable determines a higher crime rate. Previous
applications of PCA as a variable selection method were also found in the Quality Engineering
literature. For example, La Parra et al. (2004) applied PCA in a pharmaceutical study to detect
the potential impurities (variables) that affect a certain drug substance. In another example,
Ostyn et al. (2007) used PCA to find variables within multivariate control charts that help detect
bad seals for food packaging. Das et al. (2008) also utilized PCA to find the most important
customer preferences to improve product quality.
PCA Implementation
PCA can be performed on our exploratory variables, namely 𝑥!: supplier’s work observation, 𝑥!:
inspection effort tracking, 𝑥!: ITP, 𝑥!: supplier’s performance rating, and 𝑥!: inspection cost
projection. As described earlier, PCA transforms the variables into a reduced set of components
that represent most of the information in the original variables. Also, PCA can be used to select a
number of variables based on some selection rules.
To describe PCA in a mathematical form, suppose the full dataset contains k variables,
𝑥!, 𝑥!,… , 𝑥! measured on 𝑛 observations. The set of these k variables, which can be

100
characterized as a k-dimensional random vector (𝑥!, 𝑥!,… , 𝑥!), can be linearly transformed into
a principal component 𝑦. Any principal component for the full set of data is a linear combination
of all the variables and can be written as:
𝑦 = 𝑎! 𝑥! + 𝑎! 𝑥! +⋯+ 𝑎! 𝑥!
Where 𝑦 is the principal component, 𝑎!’s are the weights (loadings) that maximize the variation
of the linear composite or, equivalently, to maximize the sum of the squared correlations/
covariance of the calculated principal components with the original variables. PCA can be
performed using either the correlation or covariance matrices between the variables from which
the weight vectors (eigen vectors) are obtained. We used the correlation matrix because it is
widely applied within PCA analysis (Jackson, 1991). Table 3 presents the correlation between
the variables.
𝑥!: Supplier’s
work observation
𝑥!: Inspection
effort tracking
𝑥!: ITP
𝑥!: Supplier’s performance
rating
𝑥!: Inspection
cost projection
𝑥!: Supplier’s work observation 1 0.300 0.330 0.248 -0.114
𝑥!: Inspection effort tracking 1 0.373 0.311 0.691 𝑥!: ITP 1 -0.089 0.230 𝑥!: Supplier’s performance rating 1 0.281
𝑥!: Inspection cost projection 1
Table 3: Correlation between the variables
It is necessary for an appropriate application of PCA that the correlation coefficient between the
variables is not equal to zero Dunteman (1989) and Jolliffe (2002). As shown in Table 3, there is
some degree of correlation between the variables. For example, there is a correlation of the value
0.373 between the inspection effort tracking and ITP indicating a positive relationship between
these two variables.

101
PCA starts by constructing the correlation matrix, then the first principal component can be
conducted, 𝑦!, which is a linear combination of the k variables, 𝑥!, 𝑥!,… , 𝑥! (i.e., 𝑦! = 𝑎!!𝑥! +
𝑎!"𝑥!+ . .+ 𝑎!!𝑥! = 𝑎!! 𝑥! !!!! such that the variance (eigenvalue) of 𝑦! is maximized, and
the sum of squared correlations of 𝑦! with the original variables is also maximized. Then, the
consecutive principal components are obtained (i.e., 𝑦! = 𝑎!" 𝑥! !!!! for every
component 𝑚) to find the weight vector (𝑎!!, 𝑎!!,… ,𝑎!" ) such that the remaining variance is
maximized. The important statistics obtained from the PCA are the weight (eigen) vector
(𝑎!,𝑎!,… . ,𝑎!) associated with each principal component and its associated variance
(eigenvalue). Further details of the algebraic description of PCA, can be found in Dunteman
(1989), Jackson (1991) and Jolliffe (2002).
Table 4 represents the summary of the PCA results for our dataset depicting five principal
components (PCA produces principal components that are equal to the number of variables),
their associated variance (eigenvalue), and proportion of variance explained. The proportion of
the variance explained is calculated by dividing the variance of the principal component by the
number of variables 𝑘, i.e., 𝑘 = 5.
Variables 𝒚𝟏 𝒚𝟐 𝒚𝟑 𝒚𝟒 𝒚𝟓 𝒙𝟏: Supplier’s work observation 𝒙𝟐: Inspection effort tracking 𝒙𝟑: ITP 𝒙𝟒: Supplier’s performance rating 𝒙𝟓: Inspection cost projection
0.301 0.621 0.375 0.340 0.517
-0.681 0.099
-0.489 0.219 0.489
-0.393 0.094 0.485
-0.735 0.248
-0.373 -0.441 0.617 0.533
-0.052
-0.389 0.634 0.066 0.111
-0.656 Variance (eigenvalue) Proportion of variance explained (%) Cumulative
2.116 0.423 0.423
1.195 0.239 0.662
1.058 0.211 0.874
0.437 0.088 0.961
0.194 0.039 1.000
Table 4: PCA results
To select a subset of principal components (PCs), we used a common stopping rule in the PCA
literature; the size of variances of principal components (Kaiser’s rule). Kaiser’s rule retains only
the PCs whose variances (eigenvalues) are greater than unity. Looking at Table 4, we have three

102
principal components to retain with a variance greater than 1: 𝑦!, 𝑦!, and 𝑦!. These three
principal components account for 87.4% of the total variance. The three principal components
are:
𝑦! = 0.301 𝑥! + 𝟎.𝟔𝟐𝟏 𝒙𝟐 + 0.375 𝑥! + 0.340 𝑥! + 0.517 𝑥!
𝑦! = −𝟎.𝟔𝟖𝟏 𝒙𝟏 + 0.099 𝑥! − 0.489 𝑥! + 0.219 𝑥! + 0.489 𝑥!
𝑦! = −0.393 𝑥! + 0.094 𝑥! + 0.485 𝑥! − 𝟎.𝟕𝟑𝟓 𝒙𝟒 + 0.248 𝑥!
To select a subset of variables from the retained PCs above, we chose the variable that has the
highest absolute weight (loading), i.e., 𝑎!" in each principal component 𝑦!, as shown in bolded
text in the above equations. As described in Jolliffe (2001), the selection of one variable that has
the highest absolute weight from each retained PC preserves most of the information given by
this particular PC. The details of variable selection method can be found in Jolliffe, 1972;
Jolliffe, 1973; Jackson, 1991 and Al-Kandari & Jolliffe, 2001. Looking at Table 4 and the
equations of the retained principal components, 𝑥!, 𝑥!, 𝑎𝑛𝑑 𝑥!, respectively, inspection effort
tracking, supplier’s work observation, and supplier’s performance rating are the selected
variables from PCA.
Results Discussion
The SQM practices found from the PCA analysis were inspection effort tracking, supplier’s work
observation, and supplier’s performance rating. To evaluate the robustness of the PCA to repeat
the same results using a smaller number of data points (n), we selected randomly two-thirds of
the data points, i.e., 21 data points. The summary of the PCA results is presented in Table 5.

103
Variables 𝒚𝟏 𝒚𝟐 𝒚𝟑 𝒚𝟒 𝒚𝟓 𝒙𝟏: Supplier’s work observation 𝒙𝟐: Inspection effort tracking 𝒙𝟑: ITP 𝒙𝟒: Supplier’s performance rating 𝒙𝟓: Inspection cost projection
0.130 0.638 0.502 0.069 0.564
0.742 -0.167 0.475
-0.227 -0.379
-0.309 0.100 0.074
-0.943 0.008
-0.566 0.039 0.618 0.234
-0.492
-0.125 -0.744 0.366
-0.004 0.544
Variance (eigenvalue) Proportion of variance explained (%) Cumulative
2.243 0.449 0.449
1.416 0.283 0.732
1.0149 0.203 0.935
0.259 0.052 0.987
0.066 0.013 1.000
Table 5: PCA results using 21 data points
As shown in Table 5, we have three principal components with a variance greater than 1; 𝑦!, 𝑦!,
and 𝑦!, which account for 93.5% of the total variability. Following the same rule to select a
subset of variables as described earlier, we found that PCA produced the same variables that
were found with the total 31 data points, namely supplier’s work observation, inspection effort
tracking, and supplier’s performance rating.
In order to validate the findings from the PCA analysis, two SMEs representing organizations
with highly effective SQM were interviewed to describe the importance of the SQM practices
within construction projects. The SMEs were asked to determine the most important SQM
practices described in Table 1 within the SQM systems of their organizations; the SMEs did not
know the results obtained from the PCA analysis, so that they would not be influenced by the
results. The SMEs reported that the importance of these practices differ from one project to the
other depending on many factors including, but not limited to, whether the construction
organizations select the suppliers for the first time or there was a past working relationships with
these suppliers. In general, the SMEs reported that for every project ITP, supplier’s work
observation, and inspection effort tracking are the most important SQM practices. For learning
purposes in consecutive projects dealing with the same supplier, the SMEs reported that
supplier’s performance rating is very important since this practice is usually used in future
projects to determine the required amount of supplier surveillance.

104
To help the decision makers and practitioners in the construction industry understand the relative
importance of the SQM practices in this research based on the SMEs judgment, we used the
analytic hierarchy process (AHP) to further analyze these practices. AHP is widely used to
structure a complex decision problem (Saaty, 1994), and it has diverse applications such as
project planning, policies selection, and portfolios management. If the problem under analysis
has a manageable number of alternatives (i.e., practices, policies, or any alternative courses of
action) to compare, then AHP is an effective method, since it has a simple methodology to
conduct the pairwise comparisons (Goodwin & Wright, 2009). To apply AHP in determining the
relative importance of SQM practices based on the SMEs judgment, we used the numerical scale
described in Saaty (1994) and Goodwin & Wright (2009). Table 6 describes this scale. For
example, if the SQM practice (ITP) is weakly more important than the practice (supplier
performance rating), the assigned preference number is 3.
Practice x is …… as (than) y Preference number assigned Equally important 1 Weakly more important 3 Strongly more important 5 Very strongly more important 7 Absolutely more important 9 Weakly worse 1/3 Strongly worse 1/5 Very strongly worse 1/7 Absolutely worse 1/9
Table 6: Numerical scale for pairwise comparisons in AHP
One SME with over 20 years of experience in the supplier quality field participated to perform
pairwise comparisons on the SQM practices. This SME was one of the two SMEs that were
initially interviewed to describe the importance of the SQM practices. The SME was provided
with a matrix to enter the preference number for each practice as compared to the other. Table 7
presents the pairwise comparisons provided by the SME.

105
x!: Supplier's
work observation
x!: Inspection
effort tracking
x!: ITP
x!:Supplier's performance
rating
x!:Inspection cost
projection
x!: Supplier's work observation 1.00 5.00 1.00 3.00 5.00
x!: Inspection effort tracking 0.20 1.00 0.20 0.33 3.00
x!: ITP 1.00 5.00 1.00 3.00 5.00 x!:Supplier's
performance rating 0.33 3.00 0.33 1.00 3.00
x!:Inspection cost projection 0.20 0.33 0.20 0.33 1.00
Total 2.73 14.33 2.73 7.67 17.00 Table 7: Pairwise comparisons provided by the SME
As shown in Table 7, supplier's work observation is equally important as ITP. Also, these two
practices are strongly more important than inspection cost projection. Following the AHP
methodology to determine the priority weights for the practices which help to indicate the
importance ranking for these practices, the preference numbers of each column in Table 7 should
be normalized by dividing the value of each cell by the sum of the column. Table 8 shows the
resulting values of normalizing the columns. Table 8 also shows the total sum for each row, and
the average value, i.e., the priority weight for each SQM practice, which is the total row sum
divided by the number of SQM practices.

106
x!:Supplier's work
observation
x!: Inspection
effort tracking
x!:ITP x!:Supplier's performance
rating
x!:Inspection cost
projection Row total
Average= row
total/ 5
x!:Supplier's work
observation 0.366 0.349 0.366 0.391 0.294 1.766 0.353
x!: Inspection effort tracking 0.073 0.070 0.073 0.043 0.176 0.436 0.087
x!:ITP 0.366 0.349 0.366 0.391 0.294 1.766 0.353 x!:Supplier's performance
rating 0.122 0.209 0.122 0.130 0.176 0.760 0.152
x!:Inspection cost projection 0.073 0.023 0.073 0.043 0.059 0.272 0.054
Total 1 1 1 1 1 5 1 Table 8: Resulting normalized pairwise comparisons and priority weights for SQM
practices
Looking at Table 8, supplier's work observation, and ITP have the same highest priority with a
value of 0.353, supplier's performance rating has the second highest priority with a value of
0.152, then inspection effort tracking with a value of 0.087. Inspection cost projection has the
least priority with a value of 0.054.The SME reported that inspection cost projection is only an
estimate and doesn't add value to the SQM process.
In summary, the PCA analysis identified supplier's work observation, inspection effort tracking,
and supplier's performance rating as the most important SQM practices. The analysis of the SME
judgment using AHP to determine the important SQM practices suggested that ITP is as
important as supplier's work observation. Both analyses excluded inspection cost projection.
Conclusion and Future Work
Within the construction industry, there are many SQM practices to help improve the quality of
the materials supplied to construction projects. However, the choice of one practice over the
other using quantitative analysis techniques may not be easy due to limited data. This research
aims to quantitatively identify important practices for SQM. First, we used principal components

107
analysis (PCA) to select SQM practices that summarize main variability from data collected
from organizations with highly effective SQM systems. Then, SMEs representing organizations
with highly effective SQM were interviewed to provide a better understanding of the SQM
practices as compared to each other.
The contribution of this paper includes proposing a quantitative approach, PCA, which can be
used within quality engineering to analyze multivariate data with small sample size. In general,
the results drawn from small sample size analysis should be carefully interpreted and validated to
avoid inaccurate conclusions. Due to this limitation, the research includes discussion with SMEs
from organizations with highly effective SQM systems to elicit their judgment with regard to the
importance of the SQM practices under study, and to validate the results of PCA. The paper
proposes the analytic hierarchy process (AHP) to be used by quality engineers and construction
professionals to validate the results from small sample size quantitative approaches. Also, AHP
can be used to determine and understand the relative importance of practices or any quality
courses of actions by using expert knowledge judgment. In this research, both analyses, PCA and
AHP, suggested that supplier’s work observation, inspection effort tracking, and supplier’s
performance rating are important SQM practices.
The contribution of this research to the quality engineering field includes suggesting PCA to be
used for small sample size analyses, and proposing AHP to strengthen the conclusions drawn
from small sample size analysis, and to help the decision makers understand the relative
importance of the studied practices (variables). The findings of this paper can benefit researchers
and professionals in the construction industry by investing in the most important SQM practices
and implementing them within construction projects. The analysis and discussion with the SMEs
identified supplier’s performance rating as an important practice because it provides suppliers
108
with important information about previous performance to help them learn from mistakes that
cause quality problems, and hence prevent these problems reoccurring in future projects.
Observing supplier’s work during execution will help construction organizations detect quality
problems. As important as observing supplier’s work, developing inspection and testing plans are
collaborative efforts between the supplier and the contractor to understand what is required to
produce a product with the required level of quality. Inspection effort tracking is also an
important practice for SQM, because at the end of each project construction organizations can
determine the required inspection effort for future projects dealing with the same suppliers.
This research is limited by a small sample size to determine important SQM practices. The study
can be improved by collecting more data and involving more SMEs to determine the important
SQM practices. The study is also limited to the investigation of SQM practices from construction
organizations (contractors) performing mainly engineer-procure-construct (EPC) projects. The
research findings might not be the same for other types of contractors in the construction
industry. The research can be further improved with data from organizations with a different
focus (e.g., commercial, residential, specialty contractors).
Suggestions for future work include synthesizing the effective SQM practices into a framework
for implementation within construction projects, to guide construction organizations on how, and
when to implement these practices within the project life cycle. These SQM practices can also be
analyzed in terms of their impact on quality and ease of implementation to help construction
organizations on selecting the important SQM practices that improve quality.

109
References
Agresti, A. (1990). Categorical Data Analysis, New York: Wiley.
Al-Kandari, N., & Jolliffe, I. (2001). Variable Selection and Interpretation of Covariance Principal Componenets. Communications in Statistics: Simulation & Computation, 30(2): 339-354.
AlMaian, R., Needy, K., Walsh, K., Alves, T., & Neuman, Y. (2013). Suppler Quality Management Inside and Outside the Construction Industry. 2013 American Society for Engineering Management Proceedings. Bloomington, MN.
Baciu, O., & Parpucea, I. (2011). Socio-Economic Factors Impact on Crime Rate. Review of Economic Studies & Research, 4(2): 5-20.
Bathke, A. C., Harrar, S. W., & Madden, L. V. (2008). How to Compare Small Multivariate Samples Using Nonparametric Tests. Computational Statistics & Data Analysis, 52(11): 4951-4965.
Bourque, L. B., & Clark, V. (1992). Processing Data: The Survey Example, Newbury Park, Calif: Sage.
Caldas, H. C., Menches, L. C., Navarro, L., & Vargas, M. D. (2012). An Analysis of Global Procurement and Materials Management Practices in the Construction Industry. Research Report No. 257-11. The Construction Industry Institute: The University of Texas at Austin.
Cliff, N. (1987). Analyzing Multivariate Data, San Diego: Harcourt Brace Jovanovich.
Das, P., & Mukherjee, P. (2008). Modeling of Customer Preferences on Product Features and Comparing the Competitors' Performances. Quality Engineering, 20(1): 53-62.
Dunteman, G. H. (1989). Principal Components Analysis, Newbury Park: Sage Publications.
Freeman, L. J. (2011). A Cautionary Tale: Small Sample Size Concerns for Grouped Lifetime Data. Quality Engineering, 23(2): 134-141.
Frömke, C., Hothorn, L., & Kropf, S. (2008). Nonparametric Relevance-Shifted Multiple Testing Procedures for the Analysis of High-Dimensional Multivariate Data with Small Sample Sizes. BMC Bioinformatics, 9(54): 1-14.
Goodwin, P., & Wright, G. (2009). Decision Analysis for Management Judgment (4th ed.). New York: Wiley.

110
Grimm, L. G., & Yarnold, P. R. (1995). Reading and Understanding Multivariate Statistics, Washington, D.C: American Psychological Association.
Harrar, S. W., & Bathke, A. C. (2008). Nonparametric Methods for Unbalanced Multivariate Data and Many Factor Levels. Journal of Multivariate Analysis, 99(8): 1635-1664.
Hoyle, R. H. (1999). Statistical Strategies for Small Sample Research, Thousand Oaks, Calif: Sage Publications.
Jackson, J. E. (1991). A User's Guide to Principal Components, New York: Wiley.
Jolliffe, I.T. (1972). Discarding Variables in a Principal Component Analysis. I: Artificial Data. Journal of The Royal Statistical Society: Series C (Applied Statistics), 21(2): 160- 173.
Jolliffe, I. T. (1973). Discarding Variables in a Principal Component Analysis II: Real Data. Journal of The Royal Statistical Society: Series C (Applied Statistics), 22(1): 21- 31.
Jolliffe, I. T. (2002). Principal Component Analysis, New York: Springer.
Khoo, M. C. (2005). A Modified S Chart for the Process Variance. Quality Engineering, 17(4): 567-577.
La Parra, G. D., Rodriguez-Loaiza, M. P., & Namur, S. (2004). Studying Unidentified Impurities in Drug Substances by the Application of Multivariate (Principal Component and Cluster) Analysis. Quality Engineering, 16(3): 475-485.
Maddala, G. S., & Lahiri, K. (2009). Introduction to Econometrics, Chichester, U.K: Wiley.
Neuman, Y. (2014). A Quantitative Analysis of Supplier Quality in the engineer-procure-construct Industry. Department of Civil, Construction and Environmental Engineering, San Diego State University.
Ostyn, B., Darius, P., Baerdemaeker, J. D., & Ketelaere, B. D. (2007). Statistical Monitoring of a Sealing Process by Means of Multivariate Accelerometer Data. Quality Engineering, 19(4): 299-310.
Saaty, T. L. (1994). How to Make a Decision: The Analytic Hierarchy Process. Interfaces, 24(6), 19-43.
Saranadasa, H., & Altan, S. (1998). The Analysis of Small-Sample Multivariate Data. Journal of Biopharmaceutical Statistics, 8(1), 163-186.

111
Siddiqui, K. (2013). Heuristics for Sample Size Determination in Multivariate Statistical Techniques. World Applied Sciences Journal, 27(2): 285-287.
Walsh, K., Needy, K., & Alves, T. (forthcoming 2014). Achieving Zero Rework through Effective Supplier Quality Practices. The Construction Industry Institute: The University of Texas at Austin.

112
5. USING THE BALANCED SCORECARD TO IMPLEMENT EFFECTIVE SUPPLIER
QUALITY MANAGEMENT PRACTICES IN THE COSTRUCTION INDUSTRY
Rufaidah Y. AlMaian, M.S Department of Industrial Engineering
University of Arkansas
Kim LaScola Needy, Ph.D., P.E., CFPIM, PEM Professor and Department Head
21st Century Professorship in Engineering Department of Industrial Engineering
University of Arkansas
Thaís da C. L. Alves, Ph.D. Assistant Professor
Department of Civil, Construction, and Environmental Engineering San Diego State University
Kenneth D. Walsh, Ph.D., P.E.
Professor and Chair AGC-Paul S. Roel Chair in Construction Engineering and Management
Department of Civil, Construction, and Environmental Engineering San Diego State University
Abstract
Construction organizations utilize supplier quality management (SQM) practices to ensure that
the project materials and equipment are produced, manufactured, in accordance with the project
specifications. This paper describes the development and validation of a balanced scorecard
(BSC) framework used to organize SQM practices and help construction organizations
effectively implement these practices within their projects. The proposed BSC provides a basis
for implementing and measuring SQM practices to compare the performance across multiple
projects and to provide opportunities for continuous improvement. Additionally, the paper
addresses the validation of the BSC framework proposed for use by construction organizations as
part of their SQM in each project. During the validation of the BSC framework, we found that

113
construction organizations anticipate using it in future projects within their organizations, and
that the framework could allow them to focus on improving important areas of SQM other than
financial, such as the internal process and innovation.
CE Focus Areas
Construction Industry, Construction Projects, Rework, Non-Conformances (NCs), Performance
Measurement, Supplier Quality Management.
Keywords
Supplier Quality Management (SQM), SQM Practices, Supplier Quality (SQ) Process Map,
Balanced Scorecard (BSC), Performance Measurement.
Introduction
The paper presents results from research performed by Research Team 308 (RT 308) Achieving
Zero Rework through Effective Supplier Quality Practices supported by the Construction
Industry Institute (CII). The team was composed of academic researchers from industrial and
civil engineering and also included a group of subject matter experts (SMEs), representing
member organizations in the CII as construction owners, contractors, and suppliers. Members
from twenty one organizations contributed to this research project, and each team member
brought multiple years of experience in local and global construction markets. The major
research question under study: “What are the most effective processes and practices for ensuring
that project materials and equipment are produced, manufactured, or fabricated in strict
accordance with all applicable specifications, and that they are delivered to the project site
without any need for rework?”

114
The objective of the paper is to suggest a framework for implementing SQM practices found to
be effective, based on analyzing multiple data sources during the research. Figure 1 describes
data sources used, classified as qualitative or quantitative.
Figure 1: Data sources of the research
The paper begins with an overview of the research data sources and important SQM practices
identified by analyzing the data sources. SQM practices are then mapped onto a process outline
for supplier quality that was developed during the early stages of the research. Figure 2 depicts a
high-level representation of the SQ process map described in detail by Alves et al. (2013). The
map contains five major processes beginning with planning and selection of the suppliers. Next,
comes execution (of the fabrication along with the development of a supplier quality plan)
followed by release of completed purchase orders (POs) from the shop, i.e., packages of
fabricated products. Finally, the map shows the receipt of those products at the construction site,
and mechanical completion representing the stage when products are physically connected in
place in the facility, which marks the end of the scope of analysis for the project. Feedback loops
Research data sources
Qualita)ve
Literature review of SQM inside and outside the construc)on industry
Structured interviews with contractors’ organiza)ons
SQM documents
Supplier focus groups
Quani)ta)ve
Supplier quality prac)ces and perfromance instrument for PO data (PO instrument)
Inspec)on cost data

115
are embedded at each step within the process to indicate that occasionally information flows
upstream to inform previous activities about their performance.
Figure 2. SQ Process Map. Adapted from Alves et al. (2013).
The SQ process map is used to define the main stages of the SQ process, cross analyze the SQM
practices identified from the data sources linking them to the stages of the process map, and to
describe when within the project life cycle these practices can be applied.
Finally, after identifying when these practices can be applied, we present the balanced scorecard
(BSC) as a framework to be implemented during construction projects.
Research Motivation
Within the construction industry, supplier quality management (SQM) is a system of processes
and practices applied by organizations to ensure that the quality of fabricated materials and
equipment meet the project’s requirements and specifications (Caldas et al., 2012). SQM in the
construction industry is complex given the one-off nature of projects and the enormity of project
size and life cycle, resulting in a continual challenge to ensure that project equipment, products
and materials are produced without need for rework.
The motivation for selecting the balanced scorecard (BSC) as a framework for implementation of
SQM practices is because of its well-known status in the literature and its diverse

116
implementation in multiple types of businesses such as healthcare (Waal, 2003) and automobile
manufacturing (Hoskisson et al. (2009). Since being introduced by Kaplan and Norton in 1992,
the BSC has gained favorable support by academia and multiple industries (Kagioglou et al.,
2001). The BSC allows managers to view the organization performance from four perspectives,
financial, customer, internal business, and innovation and learning. The financial perspective
indicates the success of organizations of its financial performance such as its profitability.
Kaplan & Norton (1992) identified an example of how improvement in quality and product
introduction will lead to higher profits and reduced expenses. The customer perspective
considers customer satisfaction in terms of how the customers view the organization. The
internal business perspective focuses on the efficiency of the operational activities of the
organization. The innovation and learning perspective measures the organization performance
toward improvement. Viewing the performance through four perspectives of the BSC helps
prevent focusing on one aspect while sacrificing other important aspects (Kaplan & Norton,
1992). Within the construction industry, Kagioglou et al. (2001) indicated that most construction
organizations still depend on financial performance measurements. In this paper, the BSC was
also applied to propose a number of SQM performance measures within the four perspectives
described above. Kagioglou et al. (2001) determined that supplier performance management in
the project environment is poorly studied in the construction industry literature. Costa et al.
(2006) found that there were no measures related to suppliers’ performance and quality
management based on their analysis of performance measures from the Construction Industry
Institute Benchmarking and Metrics (CII BM&M), the National Benchmarking System for the
Chilean Construction Industry (NBS-Chile), and the Construction and the Construction Best
Practices Programme –UK (CBPP-UK). However, for all these performance measures to be

117
compared, it is important that the measures be related to the whole project life cycle (Costa et al.,
2006). Along the same lines, Needy & Ries (2010) found that the use of consistent quality
management practices and quality metrics across the project life cycle form the foundation of
effective quality management in the construction industry. In this paper, the SQM practices span
the SQ process to provide an adequate focus for the whole project.
The proposed BSC is anticipated to be applied for each construction project as a framework for
supplier quality management to provide a basis for implementing SQM practices and measuring
performance of the SQM practices. Applying the BSC can help identify lessons learned and
opportunities for improving future project performance. In addition, providing the BSC
framework for implementation and performance measurement may help organizations compare
their performance in multiple projects and benchmark – or assess- their performance against
other organizations. Extending the assessment to the organizational level, allow additional useful
lessons to be learned (Costa et al., 2006). Needy & Ries (2010) determined that obtaining quality
performance metrics and tracking their effectiveness can help construction organizations
promote continuous improvement and organizational learning.
Overview of Research Data Sources
As described in Figure 1, the data sources were quantitative or qualitative. A summary of the
research methodology for each data source and the main findings is provided next. The research
protocol was reviewed and approved by the institutional review board of the universities
involved in the study.

118
Literature Review of SQM Inside and Outside the Construction Industry
The literature review was conducted based on an intensive examination of the scholarly literature
and CII body of knowledge for SQM. The literature review also included an investigation of
quality practices and methods outside the construction industry for companies and industries
known for having effective SQM practices. The industries that were studied include healthcare,
manufacturing, food and restaurant industries, aerospace, and shipbuilding. More details about
the literature review can be found in AlMaian et al. (2013).
The literature review examination of SQM practices showed that the documented process in the
construction industry is quite similar to those found outside of the construction industry. The
primary lessons learned from the literature review with regard to improving SQM are to develop
close relationships (partnerships) with suppliers, involve fewer and more dependable suppliers,
implement a feedback system between the buyer and supplier with supplier improvement
opportunities based on measurable objectives, develop a supplier selection process focusing on
quality aspects, and ensure top management involvement and commitment with the SQM
process.
Structured Interview with Contractors’ Organizations
Interviews were conducted on a voluntary basis in a face-to-face setting, or via phone using a
structured interview data protocol. The interview questions were grouped into seven sets,
including: supplier quality organization, supplier quality system, metrics, data, assessment,
supporting documents, and suppliers. In total six interviews were conducted with contractors’
organizations. The structured interviews were used to learn in depth about the supplier quality
process and compare the current practices among the organizations that have been interviewed.

119
The research methodology was based on an integrative approach of qualitative data analysis
method using grounded theory as described in Strauss & Corbin (1998) and Schutt (2012). In
grounded theory, the data analysis method depends on inductive analysis of data. The Grounded
theory techniques that were used include detailed examination of the data contents (interview
responses) and the development of coding schemes to compare the examined data and to build
conclusions. By applying the techniques of grounded theory in examining the interview
responses and developing coding schemes, several categories were built to compare the SQM of
the interviewed organizations such as supplier performance metrics, strengths and opportunities
assessment, and sub-suppliers quality assurance. A detailed description of the qualitative data
analysis of this research can be found in AlMaian (2014 forthcoming).
The structured interview responses were sorted into three groups according to the self-reported
SQM effectiveness level of the organizations interviewed. The three groupings are: organizations
with highly effective SQM, organizations with moderately effective SQM, and organizations
with least effective SQM. The three categories emerged from the analysis of interviews and from
interviewees’ assessment of their SQM systems when compared to that of other competing
organizations in the same industry.
Findings from the structured interviews indicated that, when choosing suppliers, organizations
with highly effective SQM place an importance on classifying suppliers as strategic or non-
strategic. Also, they have higher involvement from top management throughout the project.
These organizations use databases to store information about their suppliers, and use this
information for supplier performance tracking and future supplier selection.

120
SQM Documents
The researchers asked participating organizations to provide a sample of documentation of their
SQM processes and procedures. The SQM documents include reports and procedures used by
construction organizations in their SQM systems. The SQM reports are written documents used
to record quality issues and identified required corrective actions. The SQM procedures are
written documents that define a specific process or describe a set of requirements that should be
followed during the procurement, fabrication, and delivery of products/services. The SQM
documents were used to analyze current SQM practices in construction. In total 92 SQM
documents were analyzed including 50 reports and 42 procedures. The research method for
analyzing the SQM documents was similar to the one used for the structured interview, namely,
grounded theory.
Moreover, a second iteration of analysis was conducted for the sample SQM documents that
were provided by the organizations reporting highly effective SQM, in the structured interviews.
A few SQM practices for these organizations differed from other organizations in the assessment
of the work capacity of the suppliers during selection, the analysis of the impact of poor quality
on project cost and schedule, and the identification of who is responsible for performing
corrective actions by using responsibilities charts.
Supplier Focus Groups
The researchers requested the participating organizations to refer supplier organizations that
supply products and services to their local and global construction markets. The team received
more than 30 suppliers’ contact information; suppliers from this group were contacted and
accepted/declined the invitation to participate in the focus groups. The names of the suppliers

121
involved in the focus groups remained confidential, that is, those who provided the names do not
know if they indicated participated in the focus groups. This was done to protect the free consent
and anonymity of those participating. The purpose of the focus groups was to learn suppliers’
perception about SQM and to identify practices that help suppliers achieve zero rework. Three
focus group meetings were conducted, with 11 participants representing nine supplying
companies (suppliers). These suppliers have been in the EPC industry for an average of 49 years
supplying products such as structural steel, loading and combustion equipment, and industrial
goods resembling filters and strainers.
The supplier focus group agenda included three categories: current SQM practices in which
suppliers described existing SQM practices; current effective SQM practices in which suppliers
provided examples of SQM practices, currently adopted by some of the construction
organizations which suppliers believe are effective; and practices that help suppliers achieve
zero rework (desired SQM practices) in which suppliers identified a number of practices that
would help them achieve improved levels of quality. The compiled focus group notes were
examined to identify main areas within each discussion category according to the suppliers had
reported. Three main areas emerged from the analysis: quality management, project
specifications, and feedback system. Table 1 summarizes the findings of the focus groups with
respect to the three categories of focus groups discussion and the main areas of analysis.

122
Cur
rent
SQ
M p
ract
ices
Quality management
• Sending inspection staff that, sometimes, do not have clear understanding of the inspection process.
Project specifications
• Receiving projects specifications from different sources, including project owners and contractors. Sometimes, received information does not match.
• Quoting process includes a lot of communication about the project requirements.
Feedback
• Delaying the process of reporting non-conformances (NCs) to the suppliers. Sometimes the NCs are only known to the supplier after the product has been shipped.
• Sending, in some cases, combative inspectors. Most inspectors are helpful, but some inspectors might be combative and not immediately share with suppliers when problems are discovered. This results in delaying the process of correcting problems.
Cur
rent
eff
ectiv
e SQ
M
prac
tices
Quality management
• Use NCs as learning opportunities to develop and train suppliers. • Ensure top management involvement. • Establish strong supplier partnerships • Use examples from other industries having effective SQM practices such as
automobile manufacturing to develop current practices. • Share forecast plans with suppliers that allow suppliers to plan. (What are your
plans for increasing your capacity?) • Develop central software for repository of information and tracking/reporting data.
Project specifications
• Provide relevant standards and instructions for each project.
Feedback (Suppliers have not provided examples of current effective practices for feedback.)
Des
ired
SQ
M p
ract
ices
Quality management
• Participate in up-front joint quality planning and establish quarterly reviews with the goal of improving “Get all players together in the same room to resolve problems.”
Project specifications
• Match the purchase order (PO) to the request for quotation (RFQ). • Provide exact and relevant specifications for each project. “Sometimes we just get
a few drawings” or “We get an enormous amount of information, 30-40% of which does not apply to what we do”.
• Provide updated specifications. “Some are more than 30 years old!” • Standardize specifications and applications.
Feedback • Provide feedback to suppliers. • Notify suppliers immediately about NCs. “Sometimes there is a delay and the
product has been shipped.” Table 1: Main findings from the supplier focus group meetings
The information gathered from the focus group meetings indicated that there is a need to
improve the feedback process between suppliers and contractors, standardize and update project
specifications, and perform joint quality planning with involvement from top management.
Supplier Quality Practices and Performance Instrument for Purchase Order Data (PO
Instrument)
The PO instrument was designed according to the type of the supplied materials in construction
projects, including tagged/engineered equipment, fabricated goods (structured steel), fabricated

123
goods (pipe spools), and manufactured goods/bulk goods. The PO instrument collected data
about practices used primarily in engineer-procure-construct (EPC) projects for the selection of
suppliers, tracking of purchase orders from shop to site, communication with suppliers,
installation of supplied products in construction projects, and resulting quality associated with
these practices. The responses were based on actual data about specific POs not from estimation.
The team received 108 responses, each response represented data from a single PO. The PO
instrument asked participants about the use of SQM practices such as observing and inspecting
suppliers’ work, and projecting inspection costs to determine their effect on detecting non-
conformances (NCs) per total PO value (NCs/$). Tests of hypotheses and correlation analyses
were used to draw the conclusions and the data were parsed by material type and PO criticality.
The data were also studied in depth to identify what organizations with highly effective SQM are
doing differently with respect to the studied practices. Details of the complete PO analysis and
data interpretation can be found in Neuman (2014).
The main conclusions drawn from this study for organizations with highly effective SQM
include: they detect more NCs/$; they find them earlier in the project; they have improved
systems for observing suppliers’ work and for inspection in terms of tracking the cost and hours
of inspection. In addition, these organizations conduct more meetings with the suppliers and
perform supplier ratings.
Inspection Cost Data
The researchers analyzed the effects of varying inspection and process capabilities with respect
to cost parameters through simulation modeling. The model was developed to reflect the main
stages of the SQ process map described in Figure 2. The researchers began by gathering cost data

124
for correcting NCs from the SMEs to incorporate into the model to develop analysis scenarios.
The objectives of the simulation model were to estimate the costs of identifying and correcting
NCs at different stages of the project and to predict the performances of suppliers that have
different initial costs and capabilities. It was found that the inspection capability (the ability of
the inspection at a given point to detect and repair NCs) affects the outcome more significantly
than process capability (the ability to fabricate the item correctly). Also, modeling cost curves
indicate the higher quality the supplier, the less costs related to poor quality will be found at the
end of the project. Details of the simulation modeling can be found in Ahmad (2014).
Cross Validation of the Research Findings
The SQM practices found from analyzing the quantitative and qualitative data sources can be
summarized within the SQ process map to identify when they can be implemented during the
project. Table 2 maps the SQM practices with respect to each stage of the SQ process.
SQ process map phases SQM practices
1. Planning
and selection
• Use a detailed formula to calculate the SQS efforts based on criticality of the items and previous supplier performance.
• Estimate (project) the inspection cost. • Match PO with request for proposal/quotation (RFP) and update materials/equipment
specifications. • Share forecasting plans of upcoming projects with suppliers. • Classify suppliers as strategic or non-strategic. • Focus on the planning and selection phase because it affects the whole SQ process. • Focus on quality (versus price and schedule). • Identify work capacity of the suppliers including other customers’ POs. • Evaluate cultural barriers for global suppliers when doing supplier qualification assessment.
2. Execution
• Notify suppliers immediately regarding any NCs. • Send inspectors to supplier facilities who add value to the SQ process. • Observe suppliers’ work at their facilities. • Ensure that sub-suppliers know quality requirements. • Derive supplier development and control from other industries, and shift from QC
(inspection) to development and improvement (prevention). • Determine the cost and quality impact of NCs to the project.
Table 2: SQM practices onto the SQ process map
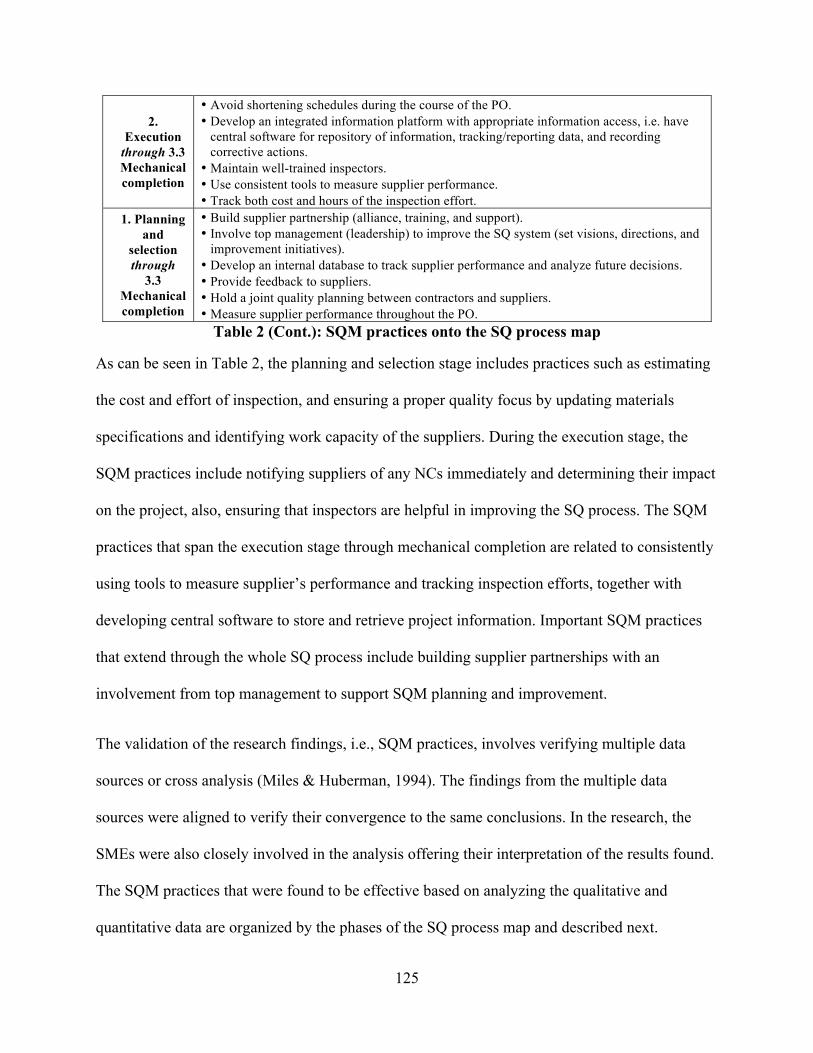
125
2. Execution
through 3.3 Mechanical completion
• Avoid shortening schedules during the course of the PO. • Develop an integrated information platform with appropriate information access, i.e. have
central software for repository of information, tracking/reporting data, and recording corrective actions.
• Maintain well-trained inspectors. • Use consistent tools to measure supplier performance. • Track both cost and hours of the inspection effort.
1. Planning and
selection through
3.3 Mechanical completion
• Build supplier partnership (alliance, training, and support). • Involve top management (leadership) to improve the SQ system (set visions, directions, and
improvement initiatives). • Develop an internal database to track supplier performance and analyze future decisions. • Provide feedback to suppliers. • Hold a joint quality planning between contractors and suppliers. • Measure supplier performance throughout the PO.
Table 2 (Cont.): SQM practices onto the SQ process map
As can be seen in Table 2, the planning and selection stage includes practices such as estimating
the cost and effort of inspection, and ensuring a proper quality focus by updating materials
specifications and identifying work capacity of the suppliers. During the execution stage, the
SQM practices include notifying suppliers of any NCs immediately and determining their impact
on the project, also, ensuring that inspectors are helpful in improving the SQ process. The SQM
practices that span the execution stage through mechanical completion are related to consistently
using tools to measure supplier’s performance and tracking inspection efforts, together with
developing central software to store and retrieve project information. Important SQM practices
that extend through the whole SQ process include building supplier partnerships with an
involvement from top management to support SQM planning and improvement.
The validation of the research findings, i.e., SQM practices, involves verifying multiple data
sources or cross analysis (Miles & Huberman, 1994). The findings from the multiple data
sources were aligned to verify their convergence to the same conclusions. In the research, the
SMEs were also closely involved in the analysis offering their interpretation of the results found.
The SQM practices that were found to be effective based on analyzing the qualitative and
quantitative data are organized by the phases of the SQ process map and described next.
126
1. Planning and selection The construction industry literature emphasizes on the supplier’s
planning and selection process, in terms of the importance of effective supplier selection
(Songhori et al, 2011) and reducing the supplier base and forming strategic partnerships (Peters,
1987; Arditi & Gunaydin, 1998) to improve project outcomes. Similar findings were obtained by
analyzing interviews and SQM documents of organization with highly effective SQM in terms of
the importance of the planning process, i.e., partnership, classifying the suppliers as strategic or
non-strategic, and using formulas to calculate the effort of inspection based on criticality of the
items and previous supplier performance. Similar results were also obtained from the
quantitative data in which modeling cost data present evidence that the higher quality the
supplier (suppliers who have the capability to offer higher quality items), the less costs related to
poor quality will be found at the end of the project. The results from the PO instrument show
that developing quality plans and projecting the cost of inspection with the supplier improves
supplier quality outcomes, because required resources to deliver the items in a PO will be known
and planned accordingly at the beginning of the project.
2. Execution: From the qualitative analysis, we found that organizations with highly effective
SQM, as indicated in the structured interviews, are proactive in developing their suppliers. The
analysis of the SQM documents shows that these organizations ultimately determine the cost and
quality impact of the NCs to the project. The results from the supplier focus group show that
some organizations perform effective efforts to turn inspections into learning and education
opportunities for their suppliers. The quantitative analysis, based on the PO instrument, shows
that organizations with highly effective SQM perform more efforts observing the supplier work
than those organizations with less effective SQM.

127
2. Execution through 3.3 Mechanical completion: Organizations with highly effective SQM
maintain well-trained inspectors and use consistent tools to measure supplier performance as
reported during the structured interviews. Within the construction industry literature, we found
that performing systematic performance ratings of overall supplier processes (Tommelein et al.,
2003), and using consistent inspection procedures (Lo, 2002) are important SQM approaches.
The results of the quantitative analysis suggest that organizations with highly effective SQM
have more elaborate systems for inspecting work of suppliers and tracking related inspection
efforts.
1. Planning and selection through 3.3 Mechanical completion: Structured interviews with
organizations having highly effective SQM reported they involve top management (leadership)
to improve the SQ system, develop an internal database to track supplier performance and
analyze future decisions, and measure and evaluate supplier performance from multiple
disciplines. The findings from supplier focus groups revealed that top management involvement
is an important aspect of SQM. Also, using central software to manage information exchange
between the supplier and contractor is considered an effective practice. The literature also
supports these findings. Chase (1993) described common elements of management roles used by
construction organizations to ensure quality, such as top management involvement and
commitment, the use of formalized process improvement techniques, helping suppliers to
improve, and striving for continuous improvement. With regard to information exchange, the
literature review shows that one of the effective SQM practices found outside the construction
industry is to develop a product life cycle management (PLM) platform such as the one found in
the shipbuilding industry. An example is Siemens PLM Software® (Siemens PLM software,

128
2013), that is used to clarify and show up-to-date project information and changes that occur
during the project, and this information are accessible for all parties involved in the project.
The Balanced Scorecard (BSC) Framework for SQM Practices
Once effective SQM practices are identified and validated through cross analysis, the next step is
to develop an implementation framework. SQM practices identified were matched to the four
perspectives of the BSC, namely, financial, customer, internal business, and innovation and
learning. The matching criterion for SQM practices to the perspectives was based on setting a
goal for each perspective and then aligning the practices that fulfilled the stated goal if they were
successfully implemented as part of the SQM. The goals were defined as suggested by Kaplan &
Norton (1992), and customized to properly describe the SQM. The proposed BSC is portrayed
in Figure 3.

129
Financial Perspective Goal: Reduce the cost of rework by practicing proper
supplier quality management. Practices: 1. Use a detailed formula to calculate the effort of
SQS based on criticality of the items and previous supplier performance.
2. Estimate (project) inspection cost. 3. Determine the cost and quality impact of the NCs
to the project. 4. Track both cost and hours of inspection efforts.
Customer (Supplier) Perspective Goal: Achieve a successful relationship with suppliers
to improve the outcomes of the construction project and reduce rework tasks.
Practices: 1. Match PO with request for proposal/quotation
(RFP), i.e. send exact specifications to the supplier so that the bid can be more accurate.
2. Update materials/equipment specifications. 3. Share forecasting plans of upcoming projects with
suppliers to allow them to plan. (What are the plans for increasing suppliers’ capacities?)
4. Notify suppliers immediately regarding any NCs. 5. Send inspectors to supplier facilities who add value
to the SQ process. 6. Avoid shortening schedules during the course of
PO. 7. Observe suppliers’ work at their facilities.
The Balanced Scorecard Internal Business Perspective
Goal: Ensure internal quality of work in the organization (contractor) in order to improve external
(supplier) quality. Practices: 1. Classify suppliers as strategic or non-strategic. 2. Focus on the planning and selection phase. 3. Focus on quality (versus price and schedule). 4. Identify the work capacity of the suppliers
including the other customers’ POs. 5. Maintain well-trained inspectors. 6. Use consistent tools to measure supplier
performance. 7. Involve top management (leadership) to improve
the SQ system (set visions, directions, and improvement initiatives).
8. Measure supplier performance throughout the PO. 9. Evaluate cultural barriers for global suppliers and
adapt the SQ process in each country. 10. Develop an internal database to track supplier
performance and analyze future decisions.
Innovation and Learning Perspective Goal: Build a continuous improvement environment to
develop the organization’s (contractor's staff) and supplier’s knowledge and skills.
Practices: 1. Ensure that sub-suppliers (tiers of suppliers) know
quality requirements. 2. Derive supplier development and control from
other industries, and shift from QC (inspection) to more development and improvement (prevention).
3. Build supplier partnerships (alliance, training, and support).
4. Develop an integrated information platform with appropriate information access, i.e. have central software for use as repository for information, tracking/reporting data, and recording corrective action.
5. Hold joint quality planning between contractors and suppliers.
6. Provide feedback (performance ratings, and meetings) to suppliers.
Figure 3: SQM practices within the balanced scorecard
After aligning SQM practices with the BSC, performance metrics were suggested for each
practice within each perspective to help organizations implement the BSC. These performance
metrics were obtained from the construction industry literature and the multiple data sources
from the research project. The sources of the performance metrics are described in Table 3.
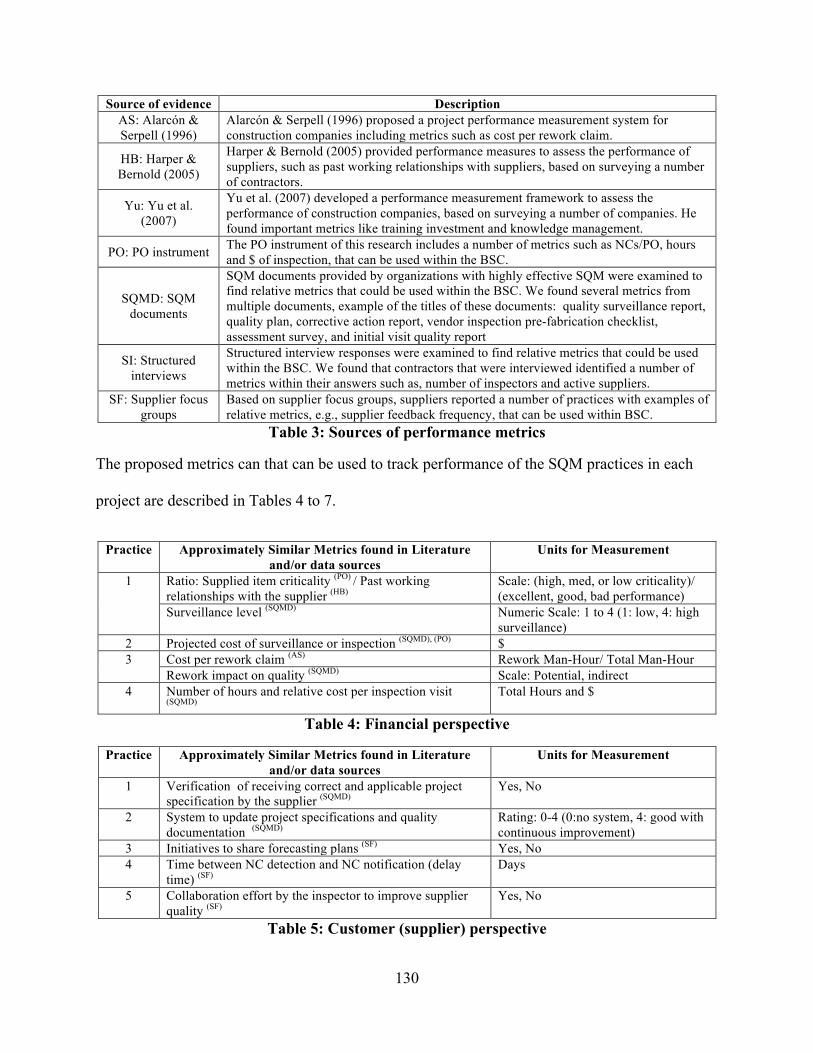
130
Source of evidence Description AS: Alarcón & Serpell (1996)
Alarcón & Serpell (1996) proposed a project performance measurement system for construction companies including metrics such as cost per rework claim.
HB: Harper & Bernold (2005)
Harper & Bernold (2005) provided performance measures to assess the performance of suppliers, such as past working relationships with suppliers, based on surveying a number of contractors.
Yu: Yu et al. (2007)
Yu et al. (2007) developed a performance measurement framework to assess the performance of construction companies, based on surveying a number of companies. He found important metrics like training investment and knowledge management.
PO: PO instrument The PO instrument of this research includes a number of metrics such as NCs/PO, hours and $ of inspection, that can be used within the BSC.
SQMD: SQM documents
SQM documents provided by organizations with highly effective SQM were examined to find relative metrics that could be used within the BSC. We found several metrics from multiple documents, example of the titles of these documents: quality surveillance report, quality plan, corrective action report, vendor inspection pre-fabrication checklist, assessment survey, and initial visit quality report
SI: Structured interviews
Structured interview responses were examined to find relative metrics that could be used within the BSC. We found that contractors that were interviewed identified a number of metrics within their answers such as, number of inspectors and active suppliers.
SF: Supplier focus groups
Based on supplier focus groups, suppliers reported a number of practices with examples of relative metrics, e.g., supplier feedback frequency, that can be used within BSC.
Table 3: Sources of performance metrics
The proposed metrics can that can be used to track performance of the SQM practices in each
project are described in Tables 4 to 7.
Practice Approximately Similar Metrics found in Literature and/or data sources
Units for Measurement
1 Ratio: Supplied item criticality (PO) / Past working relationships with the supplier (HB)
Scale: (high, med, or low criticality)/ (excellent, good, bad performance)
Surveillance level (SQMD) Numeric Scale: 1 to 4 (1: low, 4: high surveillance)
2 Projected cost of surveillance or inspection (SQMD), (PO) $ 3 Cost per rework claim (AS) Rework Man-Hour/ Total Man-Hour
Rework impact on quality (SQMD) Scale: Potential, indirect 4 Number of hours and relative cost per inspection visit
(SQMD) Total Hours and $
Table 4: Financial perspective
Practice Approximately Similar Metrics found in Literature and/or data sources
Units for Measurement
1 Verification of receiving correct and applicable project specification by the supplier (SQMD)
Yes, No
2 System to update project specifications and quality documentation (SQMD)
Rating: 0-4 (0:no system, 4: good with continuous improvement)
3 Initiatives to share forecasting plans (SF) Yes, No 4 Time between NC detection and NC notification (delay
time) (SF) Days
5 Collaboration effort by the inspector to improve supplier quality (SF)
Yes, No
Table 5: Customer (supplier) perspective

131
Practice Approximately Similar Metrics found in Literature and/or data sources
Units for Measurement
6 Schedule variation(AS) Days 7 Supplier’s work observation (PO) Scale: Not at all, full time observation
Table 5 (Cont.): Customer (supplier) perspective
Practice Approximately Similar Metrics found in Literature and/or data sources
Units for Measurement
1 Strategic suppliers/total number of active suppliers (SI) % 2 Planning meetings SQMD) Number of meetings
Inspection and testing plans (ITP) (PO) Yes, No 3 Supplier evaluation when making sourcing decisions
(supplier’s ability to contribute to new product, supplier’s continuous improvement effort) (SQMD)
Rating scale: 0-4 (0: no consistent planning system, 4: good with continuous improvement)
4 Estimate of current working capacity of the supplier (SQMD) % 5 Experienced inspectors (SI) Number of inspectors 6 Consistency of measuring inspection or testing processes
(SQMD) Rating scale: 0-4 (0:no consistent system, 4: good with continuous improvement)
7 Senior management responsibility for improvement (SQMD) Rating scale: 0 to 4 (0: no improvement system or culture, 4: good with proven continuous improvement)
8 Control of non-conformances (NCs) throughout the project (SQMD)
Rating scale: 0 to 4 (0: no control system, 4: good with proven continuous improvement)
Number of NCs detected (PO) Number of NCs/ PO 9 Initiatives to evaluate cultural (communication) barriers for
global suppliers (SF) Yes/ No
10 Supplier performance traceability (SQMD) Rating scale: 0-4 (0: no system, 4: good with continuous improvement)
Table 6: Internal business perspective
Practice Approximately Similar Metrics found in Literature and/or data sources
Units for Measurement
1 Plans for sub-supplier auditing and quality control (SQMD) Rating scale: 0-4 (0: no consistent planning system, 4: good with continuous improvement)
2 Knowledge gained from other industries (SF) Numeric scale: 1 to 5 (1: no knowledge management system, 5: good) Knowledge management (Yu)
3 Training investment (Yu) $ 4 Information and communication system (Yu) Scale :high to low
i.e. high integration (central software), low integration (emails)
5 Number of planning meetings /project (SQMD) Meetings Development of quality control plans/inspection and testing plans (ITP) (PO)
Yes, No
6
Frequency to provide supplier feedback (SF) Scale: Always, frequently, rarely, never
Meetings with suppliers to discuss quality issues and provide feedback (PO)
Number and types of meetings
Supplier performance rating after executing the work (PO) Yes, No Table 7: Innovation and learning perspective

132
Validating the Balanced Scorecard (BSC)
To validate the proposed BSC framework and the relative metrics described in Tables 4 to 7, the
SMEs were involved to provide insights and comments for the applicability of the BSC
framework and the correctness of aligning practices and metrics within each perspective. Six
validation interviews were conducted with construction organizations representing owners,
contractors, and suppliers. The suppliers were included in the validation interviews because they
can implement the BSC framework since they work with multiple tiers of suppliers that provide
them with materials and products. For each perspective within the BSC, the SMEs were asked to
determine whether the SQM practices with relative metrics are correctly viewed to belong to a
particular perspective. Four SMEs strongly agreed that these practices and metrics are correctly
placed within each perspective. Two SMEs agreed that these practices and metrics are correctly
viewed because they believe that there must be some modifications in order to be applicable
within each project. For example, for the financial perspective (Table 4), the metrics of practices
2, 3, and 4, need to be measured for each equipment/material in order to be more accurate. For
the internal business perspective (Table 6), the metric of practice 5, i.e. number of experienced
inspectors, has to be clarified to include the levels of the inspectors experience in order to reflect
what is being generally practiced in the construction industry. In other words, level I represents
the entry level inspectors, level III represents the highest experienced inspectors.
The SMEs were also asked if they anticipate suggesting the BSC framework be used in future
projects at their organizations. All the SMEs were willing to implement this framework. In
general, the SMEs reported that all of the financial SQM practices are currently implemented. In
fact in most cases, they have more advanced systems to measure the financial perspective of
SQM. However, the practices in the other perspectives of the BSC are not currently well

133
implemented within their organizations and they indicated that organizations would benefit from
paying more attention to these areas. The SMEs believed that the practices of the internal
business and innovation and learning are the most critical to improve the SQM in their
organizations.
Conclusions
This research summarized the most effective SQM practices identified by multiple sources of
quantitative and qualitative data. These SQM practices were mapped onto a process outline, SQ
process map, to determine when they should be implemented during the project. Also, these
practices were matched within the balanced scorecard (BSC) to be used as an implementation
framework for SQM within construction projects.
The most important contribution of the research to civil and construction engineering
management is recommending the BSC framework for implementing the effective SQM
practices during construction projects. The BSC usually incorporates a goal for each perspective
with relative metrics to help track and measure the performance. In this study, we aligned
effective SQM within each perspective with applicable metrics to guide organizations in
performing required actions (practices) to achieve the goal of each perspective. The proposed
framework is beneficial in assisting organizations in improving their current SQM. At the end of
each project, the practices within each perspective can be assessed based on how well the goal
was achieved given the utilization of these practices. In general, this paper drew upon a research
effort to propose a framework that, if used for each construction project, would allow a
comparison of the performance across multiple projects, thus suggesting areas of improvement.

134
Research Limitations and Future Work
This paper has a number of limitations. First, it does not address the required resources (e.g.,
budget, staffing and data collection efforts) for organizations to effectively utilize the BSC. It is
important for construction organizations to develop their internal capabilities to effectively
implement the framework. For example, Costa et al. (2006) identified the necessity to develop
technical support for the data collection process within construction organizations to implement
performance management systems. Second, with regard to the available data (metrics) for
performance measurement, any performance measurement system must incorporate a database to
store, retrieve, and handle the needed information for developing the measurement system (Costa
et al., 2006; Alarcon & Serpell, 1996). The paper does not address the challenges of not having
an advanced database for storing and retrieving information needed for the BSC. Third, having
many practices within each perspective may add complexity to effectively measure and track
their performance during each project. Moreover, not all practices are easy to implement or have
similar impacts on improving quality. Suggestions for future work include further analysis of
each practice within each perspective of the BSC in terms of their ease of implementation and
impact on quality by using the appropriate analysis methods.
Acknowledgment
This research effort was supported by the Construction Industry Institute on RT 308 – Achieving
Zero Rework through Effective Supplier Quality Practices. The opinions expressed in this paper
are those of the authors and not necessarily of CII or its member organizations.

135
References
Ahmad, S. (2014). An analysis of process vs. inspection capability in fabricated, engineered-to-order supply chains. M.S. Thesis, San Diego State University, San Diego, CA.
Alarcón, L. F., & Serpell, A. (1996). Performance measuring, benchmarking and modeling of project performance. 5th Int. Conf. of the International Group for Lean Construction - IGLC 5- University of Birmingham, U.K.
AlMaian, R. (forthcoming 2014). A strategic approach to effectively manage supplier quality within the construction industry. Ph.D. Dissertation, Department of Industrial Engineering, University of Arkansas.
AlMaian, R., Needy, K., Walsh, K., Alves, T., & Neuman, Y. (2013). Supplier quality management inside and outside the construction industry. 2013 American Society for Engineering Management Proceedings. Bloomington, MN.
Alves, T., Walsh, K., Neuman, Y., Needy, K., & AlMaian, R. (2013). Supplier quality surveillance practices in construction. 21st Annual Conference of the International Group for Lean Construction – IGLC 21 – Fortaleza, Brazil, 833-842.
Arditi, D., & Gunaydin, H. (1998). Factors that affect process quality in the life cycle of building projects. Journal of Construction Engineering & Management, 124(3), 194- 200.
Caldas, H. C., Menches, L. C., Navarro, L., & Vargas, M. D. (2012). An Analysis of global procurement and materials management practices in the construction industry. Research Report No. 257-11. The Construction Industry Institute: The University of Texas at Austin.
Chase, G. (1993). Effective total quality management (TQM) process for construction. Journal of Management in Engineerin.Special issue: Total quality management in civil engineering, (9) 433–443.
Costa, D. B., Formoso, C. T., Kagioglou, M., Alarcón, L. F., & Caldas, C. H. (2006). Benchmarking initiatives in the construction industry: Lessons learned and improvement opportunities. Journal of Management in Engineering, 22(4), 158-167.
Harper, D. G., & Bernold, L. E. (2005). Success of supplier alliances for capital projects. Journal of Construction Engineering & Management, 131(9), 979-985.
Hoskisson, R., Hitt, M., Ireland, R. D., & Harrison, J. (2009). Competing for advantage. Cengage Learning

136
Kagioglou, M., Cooper, R., & Aouad, G. (2001). Performance management in construction: a conceptual framework. Construction Management & Economics, 19(1), 85-95.
Kaplan, R., & Norton, D. (1992). The balanced scorecard-measures that drive performance. Harvard Business Review, 70(1), 71-79.
Lo, T. (2002). Quality Culture: A product of motivation within organization. Managerial Auditing Journal, 17(5), 272 276.
Miles, M. B., & Huberman, A. M. (1994). Qualitative data analysis: An expanded sourcebook. Thousand Oaks: Sage Publications.
Needy, K. & Ries R. (2010). Best practices in quality management for the capital facilities delivery industry. Research Report No. Research Report 254-11. The Construction Industry Institute: The University of Texas at Austin.
Neuman, Y. (2014). A quantitative analysis of supplier quality in the engineer-procure-construct industry. M.S. Thesis, Department of Civil, Construction and Environmental Engineering, San Diego State University.
Peters, T. J. (1987). Thriving on chaos: Handbook for a management revolution. New York: Knopf.
Schutt, R. (2012). Investigating the social world: The process and practice of research. 7th edition, Sage Publications Inc.
Siemens PLM software. Retrieved 2013, from http://www.plm.automation.siemens.com/en_us/about_us/index.shtml
Songhori, J., Tavana, M., Azadeh, A., & Khakbaz, M. (2011). A supplier selection and order allocation model with multiple transportation alternatives. International Journal of Advanced Manufacturing Technology, 52(1-4), 365-376.
Strauss, A. L., & Corbin, J. M. (1998). Basics of qualitative research: Techniques and procedures for developing grounded theory. Thousand Oaks: Sage Publications.
Tommelein, I.D., Walsh, K.D., & Hershauer, J.C. (2003). Improving capital projects supply chain performance. CII Research Report 172-11. Construction Industry Institute, The University of Texas at Austin.
Waal, A. (2003). The future of the balanced scorecard: an interview with Professor Dr Robert S. Kaplan. Measuring Business Excellence, 7(1), 30-35.
Yu, I., Kim, K., Jung, Y., & Chin, S. (2007). Comparable performance measurement system for construction companies. Journal of Management in Engineering, 23(3), 131-139.

137
6. ANALYZING EFFECTIVE SUPPLIER QUALITY MANAGEMENT PRACTICES
USING SIMPLE MULTI-ATTRIBUTE RATING TECHNIQUE (SMART) AND
VALUE FOCUSED THINKING (VFT)
Rufaidah Y. AlMaian, M.S Department of Industrial Engineering
University of Arkansas
Kim LaScola Needy, Ph.D., P.E., CFPIM, PEM Professor and Department Head
21st Century Professorship in Engineering Department of Industrial Engineering
University of Arkansas
Thaís da C. L. Alves, Ph.D. Assistant Professor
Department of Civil, Construction, and Environmental Engineering San Diego State University
Kenneth D. Walsh, Ph.D., P.E.
Professor and Chair AGC-Paul S. Roel Chair in Construction Engineering and Management
Department of Civil, Construction, and Environmental Engineering San Diego State University
Abstract
Supplier quality management (SQM) practices are important to ensure that supplied project
materials are within quality specifications. However not all SQM practices have similar impact
on quality or are easy to perform within construction projects. This research describes applying
simple mutli-attribute rating technique (SMART) to analyze a number of SQM practices aligned
within the balanced scorecard (BSC) perspectives, namely, financial, customer (supplier),
internal business, and innovation and learning. Each SQM practice is assessed in terms of its
ease of implementation and impact on quality. In addition, the research describes important
leadership principles that were found in the literature, and utilizes the value focused thinking
138
(VFT) method to derive important leadership objectives and practices for SQM. The SMART
analysis identified SQM practices that are most important within each perspective, such as the
practice of holding joint quality planning within the innovation and learning perspective of the
BSC. The results of applying VFT show having a quality director who establishes and supports
the culture of SQM is the most important leadership practice. The research findings can benefit
construction organizations wishing to improve their existing SQM by identifying practices that
are easy to implement with high impact on quality, and by sharing such organizations leadership
objectives and practices necessary to develop strategic leadership and successfully implement
SQM practices within construction projects.
Keywords
Construction industry, Supplier Quality Management (SQM), Balanced Scorecard (BSC), Simple
Multi-Attribute Rating Technique (SMART), Value Focused Thinking (VFT), Leadership
Principles, Strategic Leadership.
Introduction
The paper presents results from a research study supported by the Construction Industry Institute
(CII), and led by academic researchers from industrial and civil engineering with a group of
subject matter experts (SMEs) representing their member organizations in the CII as construction
owners, contractors, and suppliers. The major research question under study was as follows:
“What are the most effective processes and practices for ensuring that project materials and
equipment are produced, manufactured, or fabricated in strict accordance with all applicable
specifications, and that they are delivered to the project site without any need for rework?”

139
The objectives of this paper are to analyze a number of supplier quality management (SQM)
practices that were found to be effective based on analyzing multiple data sources, and to
describe important leadership practices that help in developing strategic leadership for SQM in
construction organizations.
Within scope of this study, the balanced scorecard (BSC) was previously developed as a
framework to align SQM practices with their performance metrics to assist construction
organizations measure project performance. The practices were aligned within the four BSC
perspectives: financial, customer (supplier), internal business, and innovation and learning. Each
perspective has a goal with related practices, in which if these practices aer successfully
implemented, the goal will be achieved. The details of the BSC framework can be found in
AlMaian (forthcoming 2014). Table 1 describes the BSC.
BSC perspective SQM goals and practices Financial Goal: Reduce the cost of rework by practicing proper supplier quality management.
Practices: 1. Use a detailed formula to calculate the effort of supplier quality surveillance (SQS)
based on criticality of the items and previous supplier performance. 2. Estimate (project) the inspection cost. 3. Determine the cost and quality impact of the non conformances (NCs) to the project. 4. Track both cost and hours of the inspection efforts.
Customer (supplier) Goal: Achieve a successful relationship with suppliers to improve the outcomes of the construction project and reduce rework tasks.
Practices: 1. Match purchase order (PO) with request for proposal/quotation (RFP), i.e. send
exact specifications to supplier so that the bid can be more accurate. 2. Update materials/equipment specifications. 3. Share forecasting plans of upcoming projects with suppliers that allow them to plan.
(What are the plans for increasing suppliers’ capacities?) 4. Notify suppliers immediately regarding any NCs. 5. Send inspectors to supplier’s facility who add value to the SQ process. 6. Avoid shortening schedules during the course of the PO. 7. Observe suppliers’ work at their facilities.
Table 1: The SQM goals and practices within the balanced scorecard. Adapted from AlMaian (2014 forthcoming)
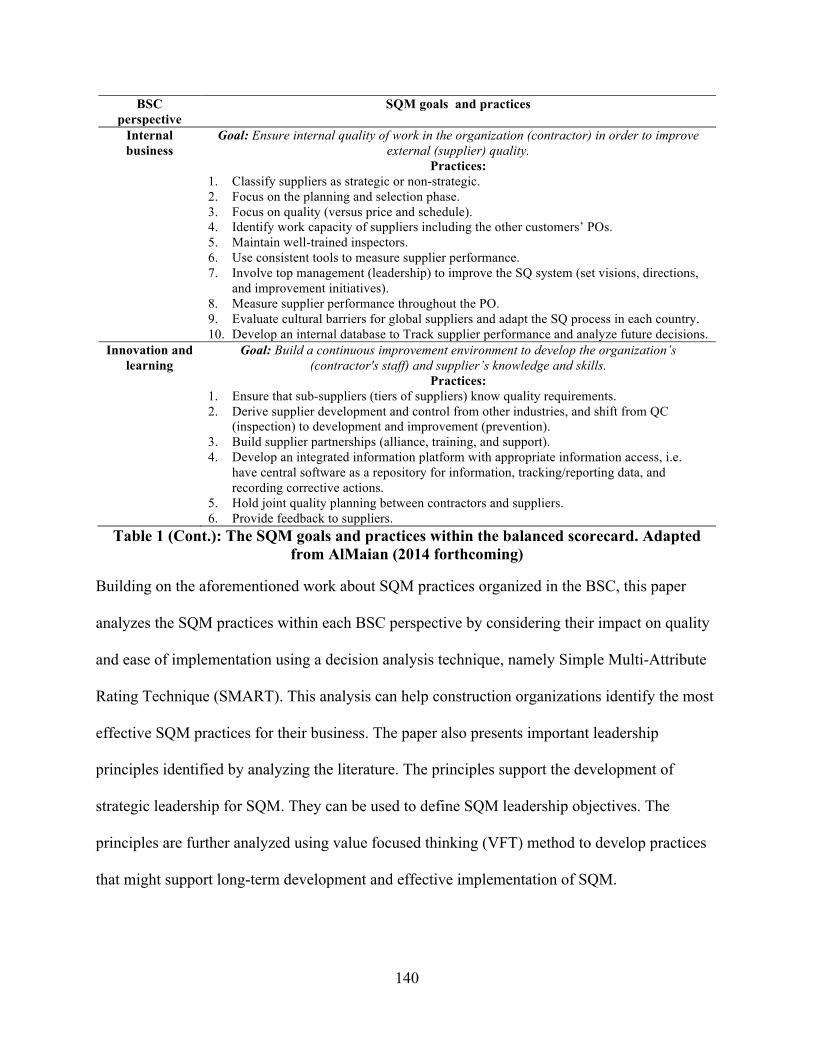
140
BSC perspective
SQM goals and practices
Internal business
Goal: Ensure internal quality of work in the organization (contractor) in order to improve external (supplier) quality.
Practices: 1. Classify suppliers as strategic or non-strategic. 2. Focus on the planning and selection phase. 3. Focus on quality (versus price and schedule). 4. Identify work capacity of suppliers including the other customers’ POs. 5. Maintain well-trained inspectors. 6. Use consistent tools to measure supplier performance. 7. Involve top management (leadership) to improve the SQ system (set visions, directions,
and improvement initiatives). 8. Measure supplier performance throughout the PO. 9. Evaluate cultural barriers for global suppliers and adapt the SQ process in each country. 10. Develop an internal database to Track supplier performance and analyze future decisions.
Innovation and learning
Goal: Build a continuous improvement environment to develop the organization’s (contractor's staff) and supplier’s knowledge and skills.
Practices: 1. Ensure that sub-suppliers (tiers of suppliers) know quality requirements. 2. Derive supplier development and control from other industries, and shift from QC
(inspection) to development and improvement (prevention). 3. Build supplier partnerships (alliance, training, and support). 4. Develop an integrated information platform with appropriate information access, i.e.
have central software as a repository for information, tracking/reporting data, and recording corrective actions.
5. Hold joint quality planning between contractors and suppliers. 6. Provide feedback to suppliers.
Table 1 (Cont.): The SQM goals and practices within the balanced scorecard. Adapted from AlMaian (2014 forthcoming)
Building on the aforementioned work about SQM practices organized in the BSC, this paper
analyzes the SQM practices within each BSC perspective by considering their impact on quality
and ease of implementation using a decision analysis technique, namely Simple Multi-Attribute
Rating Technique (SMART). This analysis can help construction organizations identify the most
effective SQM practices for their business. The paper also presents important leadership
principles identified by analyzing the literature. The principles support the development of
strategic leadership for SQM. They can be used to define SQM leadership objectives. The
principles are further analyzed using value focused thinking (VFT) method to develop practices
that might support long-term development and effective implementation of SQM.

141
The paper begins with description of the research motivation and research methods, namely,
SMART, leadership literature taxonomy, and VFT. Next, the research methodology and its
implementation are described. Finally, conclusions are drawn based on the research findings.
Research Motivation
Construction organizations apply supplier quality management (SQM) within their projects.
SQM is a system of processes and practices applied by the organization to ensure that the quality
of the fabricated materials and equipment meet the project’s requirements and specifications
(Caldas et al., 2012). SQM in the construction industry is challenging due to the uniqueness of
each construction project in terms of its scope, size, and life cycle. It is desirable for construction
organizations to define SQM practices that can be implemented in every project so that quality
outcomes can be consistent and delivered as planned or improved. A previous study by AlMaian
(2014 forthcoming), analyzed SQM practices that span the project life cycle and incorporated
them in the balanced scorecard (BSC), shown in Figure 1, to help construction organizations
implement these practices and compare their performance among multiple projects. However,
the number of practices within each perspective is considered large, adding complexity for
organizations trying to implement this framework for the first time. Furthermore, proper data
inquiry efforts within the organizations seeking to implement it are required to collect, store, and
retrieve performance measures for the practices. Kaplan & Norton (1992) emphasized the
number of performance measures within the BSC should be manageable to avoid information
overload and to focus on the most critical measures. To simplify implementing the BSC
framework within construction projects, the practices were assessed within each perspective in
terms of their ease of implementation, i.e., the practice is easy to implement when the resources
to implement this practice are already available. Also, the practices were assessed in terms of

142
their impact on quality, i.e., the practice has a high impact on quality when it helps in improving
supplier quality. The assessment of SQM practices can help construction organizations focus on
key SQM practices within the BSC framework, and provide a basis for selecting consistent SQM
practices across the construction projects that have high impact on quality and are simple to
implement. Needy & Ries (2010) observed the use of consistent quality management practices
and quality metrics across the project life cycle form the foundation of effective quality
management in the construction industry.
This paper also includes a description and analysis of leadership principles and practices. The
necessity to discuss leadership within the scope of the study is to inform organizations about
important principles and practices necessary to develop strategic leadership for SQM, and hence
successfully implement efficient SQM practices across the construction industry. Strategic
leadership is crucial for achieving and maintaining continuous improvement (Vera, & Crossan,
2004). Strategic leadership includes the process of forming a vision for the future,
communicating it to subordinates, motivating followers, and engaging in strategy-supportive
activities with subordinates (Elenkov et al., 2005). A preliminary review of the strategic
leadership literature indicates that leadership practices should be adjusted to reflect the
challenges of the global economy of the 21st century (Saee, 2005). A study by Ireland & Hitt
(2005) concluded that developing technological knowledge; building partnerships and alliances;
and sharing leadership influence are important strategic leadership skills. Within the construction
industry, Isik, et al. (2010) noted leadership strategic decisions and plans have direct influence
on the company’s performance and project success. However, the subject of leadership has
received limited focus within the construction literature, and researchers have focused mainly on
technical features of construction projects (Toor & Ofori, 2008). The lack of focus on leadership

143
in the construction industry applies to both academic research and industry practice (Chan &
Chan, 2005). Toor & Ofori (2008) suggested that leadership studies need to be improved in
terms of the methodological approach, and development of leadership perspective within the
construction industry. In our research, important leadership principles were derived based on
examining two sources: the construction industry leadership literature, and the general leadership
literature. The derived leadership principles were used to identify important leadership objectives
necessary to successfully implement SQM practices, and effectively develop strategic leadership
for SQM within construction organizations.
The findings from the assessment and discussion of both SQM practices within the BSC and
strategic leadership for SQM can benefit construction organizations by improving the existing
SQM systems. Hoskisson et al. (2009) indicated effective strategic leadership in any organization
must use control systems such as the BSC so that leaders can assess organization performance.
Also, effective strategic leadership must select and asses practices that add value to the
organization and promote improvements (Hoskisson et al., 2009). In summary, managers should
be able to identify effective practices that are relatively easy for their organizations to implement
and yield the highest impact on quality; the analysis of SQM practices with the BSC supports
this process. In addition, the discussion of strategic leadership can promote long-term
improvements for SQM in construction organizations.
Research Methodology
The research methodology used consists of three parts: an assessment of the SQM practices
within each perspective of the BSC using SMART, an examination of leadership principles in
the construction industry and general leadership literature using a taxonomy based on the

144
literature review and a qualitative comparative analysis, and a consideration of SQM leadership
objectives and creation of SQM leadership practices using value focused thinking (VFT). A
detailed description of the research methods is follows.
Simple Multi-Attribute Rating Technique (SMART)
The simple multi-attribute rating technique (SMART) is a decision analysis method based on
rating alternatives with respect to a defined set of attributes. In this research, we have a number
of practices identified, i.e., alternative courses of action, within each perspective of the BSC.
Assuming that the BSC perspectives are of equal importance, we used SMART to analyze the
practices within each perspective based on two attributes: ease of implementation and impact on
quality. SMART was selected for this research, because it has been widely used by decision
makers from various backgrounds due to its relative simplicity (Goodwin & Wright, 2009). The
analytic hierarch process (AHP) was also considered as a means of evaluating SQM practices.
However, SMART was selected over AHP due to its simplicity in considering a large number of
practices. In our study, the use of AHP would have resulted in over one hundred pairwise
comparisons, which was impractical for this application. More details describing the simplicity
of SMART as compared to AHP can be found in Goodwin & Wright (2009) and Pöyhönen &
Hämäläinen (2001).
In our research, the assessment of alternatives (SQM practices) and attribute weightings were
elicited from two SMEs having extensive knowledge and experience of SQM within
organizations with highly effective SQM systems. Collectively, their experience spanned 50
years in supplier quality. These SMEs were also subsequently interviewed to gain additional
insight and understanding of their assessment.

145
Methodology of Leadership Literature review
Cooper’s (1988) taxonomy of literature review was utilized to classify the literature according to:
focus, goal, coverage, and organization. The focus of the literature review can be on research
outcomes (findings), research methods, theories, or practices and applications. In this study, the
focus of literature review is on information analysis and synthesis of findings from construction
leadership literature, and the general leadership literature.
The goal of the literature review can be integration, criticism, and identification of central issues.
In this study, the goal of the review is to integrate and generalize findings across two fields of
literature, and to bridge the common leadership principles between these two areas.
The coverage (inclusion criteria) of the literature can be exhaustive, exhaustive with selective
citation, representative, or central. In this study the coverage was exhaustive with selective
citation. As described by Cooper (1998), this criterion of coverage is to find a manageable
number of sources to examine.
To review the leadership literature in the construction industry, we conducted a search on a
number of databases, and limited our search to peer-reviewed scholarly journals. The exclusion
criteria were for articles that discuss professional issues for leadership education and research,
and leadership career development. We obtained 23 articles. After examining their abstracts to
determine their relevancy, a total of four articles were selected for further examination.
The inclusion criteria for the leadership literature were based on a select group of books known
for their impact on the leadership field. Nine books were selected and studied in-depth as
depicted in Table 2.

146
Author(s) citation Book title Phillips, 1992 Lincoln on Leadership: Executive Strategies for Tough Times
Kouzes & Posner, 1995
The Leadership Challenge: How to Keep Getting Extraordinary Things Done in Organizations
Machiavelli, 1994 The Prince Maxwell, 2007 The 21 Irrefutable Laws of Leadership: Follow them and the People will Follow You
Heifetz & Linsky, 2002 Leadership on the Line: Staying Alive through the Dangers of Leading
Sun Tzu, 1963 The Art of War Heifetz, 1994 Leadership without Easy Answers Sample, 2002 The Contrarian’s Guide to Leadership
Kolp & Rea, 2006 Leading with Integrity: Character based Leadership Table 2: Leadership books used for literature review
For organization, the most common choice of the formats in which to organize the review are
historical format, conceptual format, and the methodological format. The conceptual format was
used to find the common leadership concepts (principles) between the two areas of literature that
we examined. Also, we adopted the qualitative comparative analysis described in Schutt (2012),
in which the contents of data collected from multiple sources are compared to find common
concepts. In this study, two sources of literature fields were examined to identify the
combination of factors that are present across these multiple sources.
Value Focused Thinking (VFT)
Value focused thinking (VFT) is a decision analysis method that differs from alternative-focused
thinking methods, such as SMART and AHP, in terms of its focus on the values or objectives
that are required to be achieved through the decision analysis. VFT relies on the principle that
values are better achieved if they are stated and understood prior to thinking of alternatives
(Keeney, 1992; Keeney, 1993). Within decision making contexts, recognizing the need for
objectives (values) is a fundamental step for any strategic approach (Keeney, 1996). In general,
VFT seeks to gain in-depth understanding of the objectives, leading to creative alternatives
(practices) that are strongly related to these objectives. Therefore, we started with the objectives
and then developed alternatives by utilizing the VFT method to identify leadership practices for
147
effective SQM. First we designed objectives (values) based on examining the leadership
literature as described earlier, then these objectives were weighted and their relative practices
(alternatives) were developed.
An assessment of these alternatives was performed by SMEs to select the practices that influence
strategic leadership for SQM. Information required to utilize VFT was collected via interviews
with the same SMEs that were involved with the SMART analysis.
Research Methodology Implementation
As described earlier, the research used SMART to analyze the practices within each perspective
of the BSC, and then used VFT to discuss the leadership principles obtained from the leadership
literature taxonomy. The details of implementing the research methodology and the results are
obtained and discussed next.
SMART
The SMEs were asked to consider each BSC perspective and provide their assessment
accordingly. The two attributes used for analysis were ease of implementation and impact on
quality. To implement SMART, the practices within each perspective should be weighted with
respect to each attribute, and also the attributes within each perspective should be weighted.
There are multiple weighting methods for the alternatives, i.e., practices and attributes within the
multi-criteria decision analysis (MCDA) literature, such as swing, direct, and relative
importance. Details can be found, for example, in Daniels et al. (2001), Pöyhönen & Hämäläinen
(2001), and Goodwin & Wright (2009). For SMART, swing weighting is commonly used for the
attributes and the relative importance weighting for the alternatives (practices). For swing
weighting, the attribute weight is based on the SMEs perception of how important the attribute’s

148
swing in values (from worst to best) is relative to the swings in values for the other attributes
under consideration. Usually, swing weight is illustrated considering a hypothetical alternative in
which all the attributes are at their worst level. For SQM, a hypothetical alternative can be for a
practice that has no impact on quality and is very difficult to implement. The SMEs were asked
to pick the attribute that moves the practice from its worst to be ranked first. For example, if ease
of implementation was picked and ranked first, then a swing from worst to best impact on quality
for a practice can be considered to be, for example 80%, as important as a swing from worst to
best level of ease of implementation.
For relative importance weighting, the practice weight is based on the SMEs perception of how
important the practice is relative to other practices under consideration.
The weighting methods were explained to the SMEs prior to the interview. Then, within each
perspective of the BSC, the SMEs were asked to rank the practices by their ease of
implementation and impact on quality. Assuming higher values are better, the practices that were
ranked first were given a value of 100 and those that were ranked last were given a value of zero.
A value of 100 describes a practice that is very easy to implement, and a value of zero describes
a practice that is very difficult to implement. Weighting of the impact on quality is done
similarly, i.e., zero for practice that has no impact on quality, and 100 for a practice that has
significant impact on quality. Relative values were given to the remaining practices. The
weighting values were then normalized, so that the total summation of values is equal to 100.
The SMEs were then asked to evaluate the two attributes within each perspective using swing
weights. The values of swing weights were normalized so that that the total summation of values

149
for the two attributes is equal to 1. Once the weights were determined, the overall value for each
practice within each perspective was calculated as follows:
𝑣 𝑥 = 𝑤!𝑣! 𝑥!!!!! (1)
Where,
𝑣 𝑥 = practice’s value
𝑖 = the attribute number from 1 to n (in our case 𝑖 is equal 1 or 2 )
𝑤!= weight of the attribute 𝑖 (normalized weight, i.e., summation of 𝑤! is equal to 1)
𝑣! 𝑥! = rating/score of alternative 𝑥 for attribute 𝑖 (normalized rating, i.e., summation of 𝑣! 𝑥!
is equal to 100)
Table 3 describes the practices’ ratings for the financial and customer (supplier) perspectives.
Attributes Ease of implementation Impact on quality
SQM practices (financial) Original rating
Normalized rating
Original rating
Normalized rating
1. Use a detailed formula to calculate the effort of SQS based on criticality of the items and previous supplier performance.
50 28.57 70 30.43
2. Estimate (project) the inspection cost. 45 25.71 50 21.74 3. Determine the cost and quality impact of the NCs to
the project. 10 5.71 70 30.43
4. Track both cost and hours of inspection efforts. 70 40 40 17.39 Total 175 100 230 100
SQM practices (supplier) Original rating
Normalized rating
Original rating
Normalized rating
1. Match PO with request for proposal/quotation (RFP). 50 13.70 100 19.34
Table 3: Ratings for practices of the financial and customer perspectives
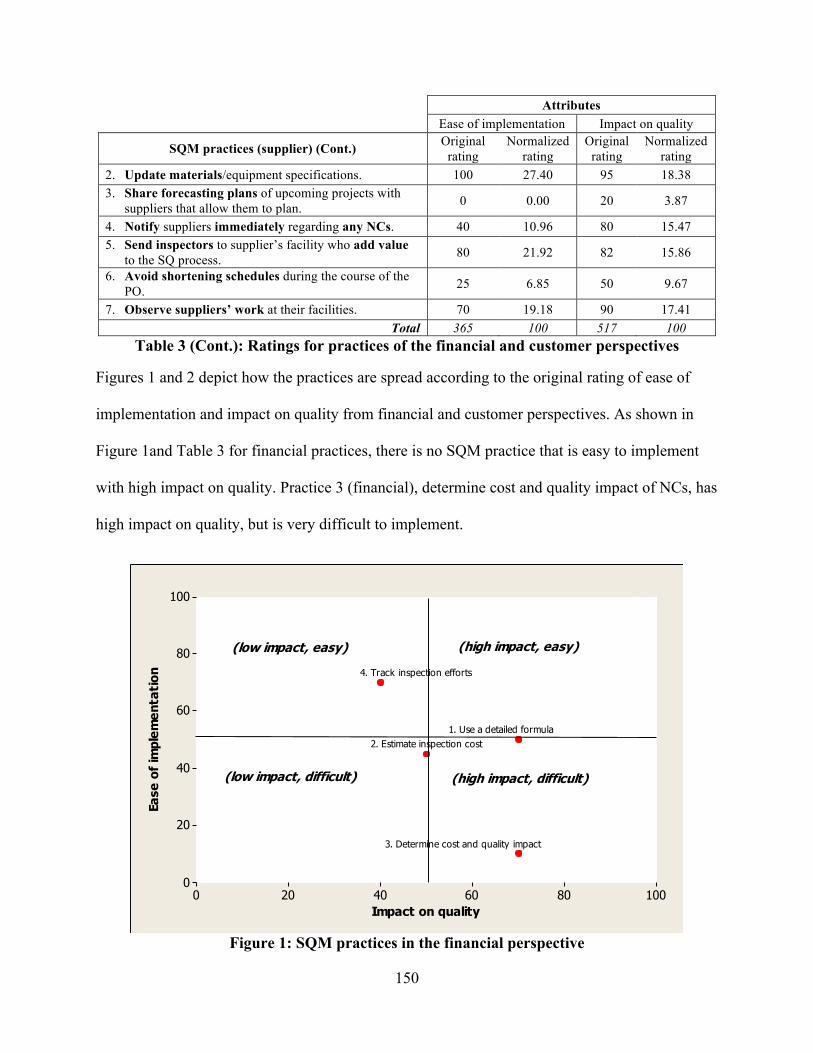
150
Attributes Ease of implementation Impact on quality
SQM practices (supplier) (Cont.) Original rating
Normalized rating
Original rating
Normalized rating
2. Update materials/equipment specifications. 100 27.40 95 18.38 3. Share forecasting plans of upcoming projects with
suppliers that allow them to plan. 0 0.00 20 3.87
4. Notify suppliers immediately regarding any NCs. 40 10.96 80 15.47 5. Send inspectors to supplier’s facility who add value
to the SQ process. 80 21.92 82 15.86
6. Avoid shortening schedules during the course of the PO. 25 6.85 50 9.67
7. Observe suppliers’ work at their facilities. 70 19.18 90 17.41 Total 365 100 517 100
Table 3 (Cont.): Ratings for practices of the financial and customer perspectives
Figures 1 and 2 depict how the practices are spread according to the original rating of ease of
implementation and impact on quality from financial and customer perspectives. As shown in
Figure 1and Table 3 for financial practices, there is no SQM practice that is easy to implement
with high impact on quality. Practice 3 (financial), determine cost and quality impact of NCs, has
high impact on quality, but is very difficult to implement.
100806040200
100
80
60
40
20
0
Impact on quality
Ease
of
impl
emen
tati
on 4. Track inspection efforts
3. Determine cost and quality impact
2. Estimate inspection cost1. Use a detailed formula
(low impact, difficult)
(low impact, easy)
(high impact, difficult)
(high impact, easy)
Figure 1: SQM practices in the financial perspective

151
For SQM practices within the customer perspective, as shown in Figure 2, most of practices were
considered relatively easy to implement. Only sharing forecasting plans with suppliers is difficult
to implement with low impact on quality.
100806040200
100
80
60
40
20
0
Impact on quality
Ease
of
impl
emen
tati
on 7. Observe supplier's work
6. Aviod shortening schedules
5. Send helpful inspectors
4. Notify any NCs immediately
3. Share forecasting plans
2. Update materials specifications
1. Match the PO with RFP
(low impact, difficult)
(low impact, easy) (high impact, easy)
(high impact, difficult)
Figure 2: SQM practices in the customer (supplier) perspective
Table 4 describes the practices’ ratings for the internal business and innovation and learning
perspectives.
Attributes Ease of implementation Impact on quality
SQM practices (internal business) Original rating Normalized rating
Original rating
Normalized rating
1. Classify suppliers as strategic or non-strategic. 100 28.57 75 9.18 2. Focus on the planning and selection phase. 12 3.43 85 10.40 3. Focus on quality (versus price and schedule). 98 28.00 99 12.12 4. Identify work capacity of the suppliers
including the other customers’ POs. 10 2.86 70 8.57
5. Maintain well-trained inspectors. 15 4.29 98 12.00 6. Use consistent tools to measure supplier
performance. 20 5.71 80 9.79
Table 4: Ratings for practices of the internal business, and innovation perspectives

152
Attributes Ease of implementation Impact on quality
SQM practices (internal business) (Cont.) Original rating Normalized rating
Original rating
Normalized rating
7. Involve top management (leadership) to improve the SQ system (set visions, directions, and improvement initiatives).
5 1.43 100 12.24
8. Measure supplier performance throughout the PO. 40 11.43 95 11.63
9. Evaluate cultural barriers for global suppliers and adapt the SQ process in each country.
0 0.00 25 3.06
10. Develop an internal database to track supplier performance and analyze future decisions.
50 14.29 90 11.02
Total 350 100 817 100
SQM practices (innovation and learning) Original rating Normalized rating
Original rating
Normalized rating
1. Ensure that sub-suppliers (tiers of suppliers) know quality requirements. 80 23.74 100 22.99
2. Derive supplier development and control from other industries, and shift from QC (inspection) to development and improvement (prevention).
0 0.00 25 5.75
3. Build supplier partnerships (alliance, training, and support). 40 11.87 50 11.49
4. Develop an integrated information platform with appropriate information access. 20 5.93 75 17.24
5. Hold joint quality planning between contractors and suppliers. 100 29.67 95 21.84
6. Provide feedback to suppliers. 97 28.78 90 20.69 Total 337 100 435 100
Table 4 (Cont.): Ratings for practices of the internal business, and innovation perspectives
Figure 3 portrays the SQM practices in the internal business perspective presented in Table 4. As
shown in Figure 3 and described in Table 4, practices 2 and 4 through 7 have high impact on
quality, but are relatively difficult to implement.

153
100806040200
100
80
60
40
20
0
Impact on quality
Ease
of
impl
emen
tati
on
10. Develop internal database
9. Evaluate cucltural barriers
8. Measure supplier perfromance
7
65
4
3. Focus on quality versus cost
2
1. Classify suppliers
(low impact, easy)
(low impact, difficult) (high impact, difficult)
(high impact, easy)
Figure 3: SQM practices in the internal business perspective
Figure 4 is for SQM practices in the innovation and learning perspective.
100806040200
100
80
60
40
20
0
Impact on quality
Ease
of
impl
emen
tati
on
6. Provide feedback5. Hold joint quality planning
4. Develop integrated information platform
3. Build supplier partnership
2. Derive supplier development from other industries
1. Ensure sub-suppliers know quality requ
(low impact, easy)
(low impact, difficult)
(high impact, easy)
(high impact, difficult)
Figure 4: SQM practices in the innovation and learning perspective
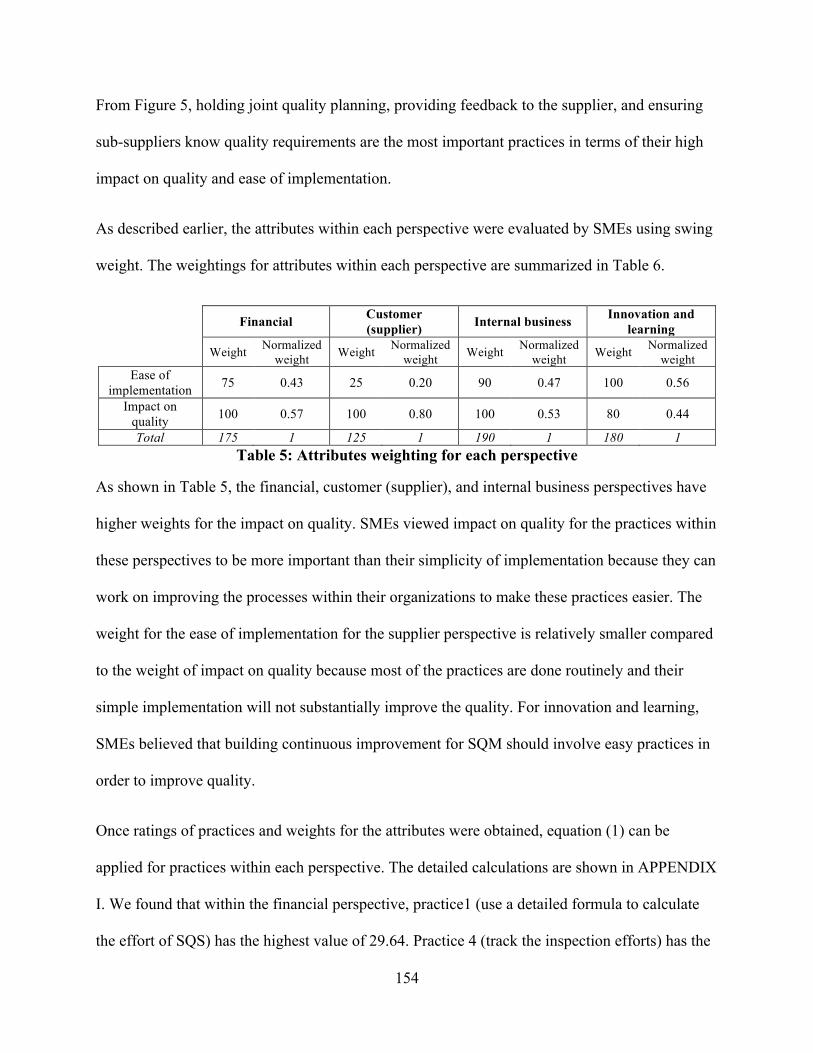
154
From Figure 5, holding joint quality planning, providing feedback to the supplier, and ensuring
sub-suppliers know quality requirements are the most important practices in terms of their high
impact on quality and ease of implementation.
As described earlier, the attributes within each perspective were evaluated by SMEs using swing
weight. The weightings for attributes within each perspective are summarized in Table 6.
Financial Customer (supplier) Internal business Innovation and
learning
Weight Normalized weight Weight Normalized
weight Weight Normalized weight Weight Normalized
weight Ease of
implementation 75 0.43 25 0.20 90 0.47 100 0.56
Impact on quality 100 0.57 100 0.80 100 0.53 80 0.44
Total 175 1 125 1 190 1 180 1 Table 5: Attributes weighting for each perspective
As shown in Table 5, the financial, customer (supplier), and internal business perspectives have
higher weights for the impact on quality. SMEs viewed impact on quality for the practices within
these perspectives to be more important than their simplicity of implementation because they can
work on improving the processes within their organizations to make these practices easier. The
weight for the ease of implementation for the supplier perspective is relatively smaller compared
to the weight of impact on quality because most of the practices are done routinely and their
simple implementation will not substantially improve the quality. For innovation and learning,
SMEs believed that building continuous improvement for SQM should involve easy practices in
order to improve quality.
Once ratings of practices and weights for the attributes were obtained, equation (1) can be
applied for practices within each perspective. The detailed calculations are shown in APPENDIX
I. We found that within the financial perspective, practice1 (use a detailed formula to calculate
the effort of SQS) has the highest value of 29.64. Practice 4 (track the inspection efforts) has the

155
second highest value of 27.08. Practice 3 (determine the impact of NCs) has the lowest score
with a value 19.84.
For the customer (supplier) perspective, practice 2 (update materials/equipment specifications)
has the highest score with a value of 20.18, practice1 (match the PO with RFP) has the second
highest score with a value of 18.2. Practice 3 (share forecasting plans with suppliers) has the
lowest score, with a value of 3.09.
For the internal business, practice 3 (focus on quality) has the highest value of 19.64. Practice 1
(classify suppliers as strategic or non-strategic) has the second highest value of 18.37. The
practice that has the lowest value is practice 9 (evaluate cultural barriers for global suppliers)
with a value of 1.61.
The practice that has the highest score within the innovation and learning perspective was
number 5 (hold a joint quality planning) with a value of 26.19, practice 6 (provide feedback to
suppliers), and has the second highest score with a value of 25.19. Practice 2 (derive supplier
development from other industries) has the lowest value of 2.55.
Based on the results suggested by SMART, the reduced BSC with the important SQM practices
in each perspective is depicted in Table 6.

156
Financial perspective Goal: Reduce the cost of rework by practicing proper supplier quality management.
Practices: • Use a detailed formula to calculate the effort of supplier quality surveillance (SQS) based on criticality of the
items and previous supplier performance. • Track both cost and hours of the inspection efforts.
Customer (supplier) perspective Goal: Achieve a successful relationship with suppliers to improve the outcomes of the construction project and
reduce rework tasks. Practices: • Update materials/equipment specifications. • Match the purchase order (PO) with request for proposal/quotation (RFP), i.e. send exact specifications to
supplier so that the bid can be more accurate. Internal business perspective
Goal: Ensure internal quality of work in the organization (contractor) in order to improve external (supplier) quality.
Practices: • Focus on the planning and selection phase. • Classify suppliers as strategic or non-strategic.
Innovation and learning perspective Goal: Build a continuous improvement environment to develop the organization’s (contractor's staff) and
supplier’s knowledge and skills. Practices: • Hold joint quality planning between contractors and suppliers. • Provide feedback to suppliers.
Table 6: The balanced scorecard with important SQM practices
Sensitivity analysis was performed for each BSC perspective to determine how robust the choice
of a practice is to the changes in the attributes’ weights used in the analysis. In general, the
recommendation is to invest in practices that have the highest scores from SMART analysis.
However, sensitivity analysis can provide important information for decision makers in terms of
viewing the changes of practices’ values with respect to modifications in attribute’s weights. To
perform sensitivity analysis, the weight of an attribute was varied from 0 to 1 using 0.1
increments. The detailed calculations of sensitivity analysis are provided in APPENDIX II.
Figure 5 depicts how a change in the weight of ease of implementation affects the practices’
values within the financial perspective. The vertical dashed line represent the original weight,
i.e., 𝑤(!"#! !" !"#$.) = 0.43 and 𝑤(!"#$%& !" !"#$%&') = 1− 𝑤 !"#! !" !"#$. = 0.57. Recall the
summation of the attributes’ weights is equal to 1. As shown in Figure 5, the line of practice 1 is
the most horizontal (with a slope closest to zero) and retains almost the same value over the

157
changes of attributes weight from 0 to 1. This indicates that this practice is the most robust in
terms of attributes’ weights variation. The sensitivity analysis in Figure 5 also shows that
practices 3 and 4 are the most sensitive to changes in attributes’ weights. It can be seen for
weights of ease of implementation over 0.5, practice 4 has the highest value among the other
practices. This indicates that if the decision maker would assign higher weights for ease of
implementation, then practice 4 would be the best practice and practice 3 would be the worst
practice, in terms of their values.
Figure 5: Sensitivity analysis for the financial perspective practices
Figure 6 shows that practice 7 in the customer perspective, observe the supplier’s work, is the
most robust practice to the changes in ease of implementation and impact on quality. However,
practice 2 has the highest value across all the weights of ease of implementation. This indicates
that the choice of practice 2 is the most favorable because it results in the best outcome
regardless of the assigned value of preference for the attributes’ weights.
0
5
10
15
20
25
30
35
40
45
0 0.1 0.2 0.3 0.4 0.43 0.5 0.6 0.7 0.8 0.9 1
Prac/ce's v
alue
Weight of ease of implementa/on
1.Use a detailed formula
2.Es)mate inspec)on cost
3.Determine cost and quality impact
4. Track inspec)on efforts

158
Figure 6: Sensitivity analysis for the customer perspective practices
Figure 7 depicts the sensitivity analysis for the practices within the internal business perspective.
As can be seen, practice 8 is the least sensitive to the changes of ease of implementation weight.
Practice 3 has the highest value for any weight of ease of implementation. In general, the
practices within this perspective are sensitive to changes in attribute’s weights, as can be seen
from the slope of their lines in the graph.
Figure 7: Sensitivity analysis for the internal business practices
0
5
10
15
20
25
30
35
40
0 0.1 0.2 0.3 0.4 0.5 0.6 0.7 0.8 0.9 1
Prac/ce's v
alue
Weight of ease of implementa/on
1.Match the PO with RFP
2. Update materials specifica)ons
3. Share forecas)ng plans
4. No)fy any NCs immediately
5.Send helpful inspectors
6.Avoid shortening schedules
7.Observe suppliers’ work
0
5
10
15
20
25
30
0 0.1 0.2 0.3 0.4 0.47 0.5 0.6 0.7 0.8 0.9 1
Prac/ce's v
alue
Weight of ease of implementa/on
1Classify suppliers
2.Focus on planning
3.Focus on quality
4. Iden)fy work capacity of suppliers 5.Maintain well-‐trained inspectors 6.Use consistent tools
7.Involve top management
8. Measure supplier performance 9.Evaluate cultural barriers for global suppliers 10.Develop internal database

159
Figure 8 represents the sensitivity analysis for the innovation and learning. It shows that
practices 1 and 3 are the most robust practices and practice 5 has the highest value for all
weights. It is also noted that practice 4 is the most sensitive.
Figure 8: Sensitivity analysis for the innovation and learning perspective
The sensitivity analysis shows that updating materials specifications, focusing on quality, and
holding joint quality planning have the highest values when the weights vary, i.e., changes in
weights preference will still result in these practices have the highest scores. The sensitivity
analysis also shows that using a detailed formula, observing supplier’s work, measuring
supplier’s performance, building partnerships, and ensuring sub-suppliers know quality
requirements are the least sensitive to the variations in the attributes’ weights in all BSC
perspectives. The analysis of robustness of practices allows construction decision makers to
understand which practices are least affected by the ease of implementation and impact on
quality when applied in real projects.
0
5
10
15
20
25
30
35
0 0.1 0.2 0.3 0.4 0.5 0.56 0.6 0.7 0.8 0.9 1
Prac/ce's v
alue
Weight of ease of implementa/on
1. Ensure sub-‐suppliers know quality
2. Derive supplier development from other industries 3.Build supplier partnership
4.Develop integrated informa)on plahorm
5.Hold a joint quality planning
6.Provide feedback

160
Leadership Literature Taxonomy
Six common leadership principles were found when implementing the leadership literature
taxonomy between the construction industry leadership and general leadership literatures. These
principles are: trust, partnerships and alliances, assessing internal capabilities, effective
communication, innovation and learning, and influence. Table 7 describes these principles and
the relevant findings from the literature.
Leadership principle
Findings from the construction industry leadership literature
Findings from the general leadership literature
1. Trust
Building mutual-trust relationship with project stakeholders is important for project success (Liu et al., 2003; Skipper & Bell, 2006; Sunindijo, 2012).
Trust is the foundation for successful relationship (Phillips, 1992), the foundation of leadership (Maxwell, 2007), and a requirement for leadership (Sample, 2002). Also, trust is very difficult to restore, once lost (Machiavelli, 1994; Kolp & Rea, 2006). • Remark: Trust is mentioned in almost all of
the examined books.
2. Partnership and alliances
Partnership and alliances with project stakeholders are important in achieving project objectives (Sunindijo, 2012).
Recent studies in the field of leadership recognize the need for building strong relationships and alliances (Phillips, 1992; Hiefetz, 1994; Heifetz & Linsky, 2002).
3. Assessing internal capabilities
Evaluating and assessing the internal capabilities and seeking self-improvement are important to improve the organization’s performance (Gharehbaghi & McManus, 2003).
The ability to assess leadership effectiveness is important (Maxwell, 2007), i.e. leaders must have self-confidence of their strengths (Phillips, 1992), must know their weaknesses, i.e. know yourself (Sun Tzu, 1963), and seek new challenges (Kouzes & Posner, 1995).
4. Effective communication
Developing effective communication skills (Gharehbaghi & McManus, 2003), and ensuring clear communication are key factors for successful relationships in construction projects (Sunindijo, 2012).
Leadership theory requires effective skills and ways of communication (Phillips, 1992; Kouzes & Posner, 1995; Sample, 2002).
5. Innovation and learning
Learning to increase the knowledge and skills of the team is an important leadership skill (Gharehbaghi & McManus, 2003; Skipper & Bell, 2006).
Leadership must include innovation encouragement (Phillips, 1992; Kouzes & Posner, 1995), training (Sun Tzu, 1963), and learning and educative strategy (Heifetz,1994).
6. Influence
Leadership is about motivation and influence to followers (Liu et al., 2003), and it is important that project managers influence and inspire the team to achieve project success and gain respect and trust from the team (Sunindijo, 2012).
An important factor in leadership is the ability to influence and inspire subordinates (Phillips, 1992; Kouzes & Posner, 1995; Sample, 2002). Influence is considered to be the true measure of leadership (Maxwell, 2007). • Remark: Influence is mentioned in almost all
of the examined books. Table 7: The common leadership principles found from the two literatures

161
After identifying leadership principles, the SMEs were involved in developing objectives based
on these principles to reflect strategic leadership for SQM in the construction industry. The
objectives that were developed are:
• Maximizing mutual trust between the construction organization and suppliers.
• Maximizing benefits of developing successful partnerships and alliances with
suppliers.
• Maximizing effective communication between construction organization and suppliers.
• Maximizing the efforts to assess internal capabilities of the construction organization to
achieve improvements.
• Maximizing educative and learning culture of quality within the construction
organization.
• Maximizing quality influence of top management on all levels of the construction
organization.
These objectives were then used for VFT as described next.
Value Focused Thinking (VFT)
The aforementioned objectives can be classified into internal and external leadership objectives.
The internal objectives are those that can be achieved and controlled internally within the
organization, such as maximizing the quality influence and the educative and learning culture of
quality. The external objectives are those that involve relationships between the construction
organization and suppliers, such as maximizing mutual trust and partnerships between the
construction organization and the supplier. Based on this classification of the objectives, the
value hierarchy, i.e., a graphical representation of the objectives, of the VFT can be constructed.

162
The hierarchy is organized with a fundamental objective at the top, with subsequent tiers of
supporting objectives (Keeney, 1992). Figure 9 depicts the value hierarchy.
Figure 9: Value hierarchy for the SQM leadership objectives
As shown in Figure 9, the fundamental objective is to develop strategic leadership for SQM in
construction organizations. Tier 1 supporting objectives are the internal and external leadership
objectives, followed by tier 2 supporting objectives.
Once the hierarchy is constructed, the next step in VFT is to develop evaluation measures. In our
case, the aim is to create practices and then evaluate these practices accordingly. So, we
developed a constructed measure (described in Table 8) because the natural measure
recommended by Keeny (1992), using quantifiable metrics, is not easy within the context of
leadership for SQM. Following Keeny (1992) and Parnell et al. (2011) guidance for developing a
constructed measure, we developed three levels of evaluation scores: low, medium, and high,
with an interval of numerical values to describe the possible value scores for each level. Table 8
presents the constructed measure used.
(Tier 2 suppor/ng objec/ves) (Tier 1 suppor/ng objec/ves) (Fundamental objec/ve)
Developing strategic leadership for SQM
Internal leadership objec)ves
Internal capabili)es assessment
Educa)ve and learning culture of quality
Quality influence
External leadership objec)ves
Mutual Trust
Communica)on
Partnerships and alliances

163
Evaluation scores Description Possible value score Low The practice is least important to SQM leadership 0-25 Med The practice is moderately important to SQM leadership 26-75 High The practice is highly important to SQM leadership 76-100
Table 8: The constructed measure for the practices
After constructing the value hierarchy and the evaluation measures, the SMEs were asked to
provide scores (weights) on a scale from 0 (least important) to 100 (very important) for tier 1 and
tier 2 in the value hierarchy shown in Figure 9. We used the relative importance weighting for
the value hierarchy. The SMEs were asked to rank tier 1 objectives and provide a relative
importance weight. Tier 2 objectives within both the internal and external objectives were then
ranked and weighted. This process leads to developing local and global weights. Local weights
present the weight for each objective under the higher level objective in the hierarchy. The local
weights are used to build global weights by taking the product of the local weights along the tiers
of the hierarchy. The local weights under the same objective should sum to 1. Similarly, the
global weights in the lowest tier of the hierarchy should sum to 1. Table 9 presents the local and
global weights for the value hierarchy.
Tier 1 supporting objectives Tier 2 supporting objectives
Objective Local weight
Normalized local weight Objective Local
weight Normalized local weight Global weight
Internal leadership 100 0.54
Internal capabilities assessment 88 0.31 0.54 * 0.31= 0.17
Educative and learning culture of
quality 95 0.34 0.54 * 0.34= 0.18
Quality influence 100 0.35 0.54 * 0.35= 0.19 ∑ (normalized local weight) = 1
External leadership 85 0.46
Mutual trust 80 0.33 0.46 * 0.33= 0.15
Communication 90 0.37 0.46 * 0.37= 0.17
Partnerships and alliances 75 0.31 0.46 * 0.31= 0.14
∑ (normalized local weight) = 1 ∑ (normalized local weight) = 1 ∑ (global weight) = 1 Table 9: Local and global weights for the value hierarchy

164
As shown in Table 9, internal leadership has higher weight. The SMEs revealed that it is
important to ensure the internal leadership of the organization first. The quality influence has the
highest global weight, because the SMEs believe that the overall quality can’t be achieved
without an influence.
The SMEs were then asked to develop practices that help to achieve the internal and external
objectives. This approach of generating practices is called the design tactic, in which the
alternatives, i.e., practices, are custom-made to stress innovation (Parnell et al., 2011). The SMEs
reported the following three practices:
1. Have a quality director (leader in the top level) that helps create and oversee a
quality culture for SQM.
2. Establish relationships with strategic suppliers with frequent joint quality meetings
to assess and derive improvements for both the supplier and contractor.
3. Perform internal reviews of the SQM practices and get a buy-in from the
stakeholders (quality director, SQS personnel, inspectors, procurement, and suppliers,
etc.).
The developed practices were then scored/weighted with respect to each supporting objective in
order to determine the overall value for each practice. Equation (1): 𝑣 𝑥 = 𝑤!𝑣! 𝑥!!!!! , can
be used. Using equation (1) for VFT, 𝑣 𝑥 represents the practice’s score, 𝑖 is the number of
objectives, 𝑤! represents the weight of the 𝑖!! objective, 𝑥! represents the evaluation score for the
practice with respect to objective 𝑖, and 𝑣! 𝑥! represents the numeric value score of 𝑥!. Table 10
presents the evaluation scores for the objectives and practices.

165
Supporting objectives
𝒗 𝒙
Internal capabilities assessment
Educative and learning culture
of quality
Quality influence Mutual trust Communication Partnerships
and alliances
𝑤! 0.17 0.18 0.19 0.15 0.17 0.14 Practice 𝑥! 𝑣! 𝑥! 𝑥! 𝑣! 𝑥! 𝑥! 𝑣! 𝑥! 𝑥! 𝑣! 𝑥! 𝑥! 𝑣! 𝑥! 𝑥! 𝑣! 𝑥!
1. Quality director High 100 High 100 High 100 High 85 Med 70 High 80 89.8
2. Relationship Med 30 Med 70 Med 50 High 95 High 90 High 100 70.8
3. Internal review High 100 High 95 High 80 High 90 Med 75 Low 30 79.7
Table 10: Evaluation scores for the objectives and practices
As shown in Table 10, practice 1, having a quality director, has the highest score. This result
shows the importance of having a person leading the efforts and overseeing the work to make the
people accountable for their jobs to strategically lead SQM within construction organizations.
Conclusions
The research yielded findings that can help construction organizations successfully implement
SQM practices within their projects. The paper also provides leadership principles and practices
that are critical for developing strategic leadership for SQM. The research utilized three research
methods: SMART, leadership literature taxonomy, and VFT. The SMART analysis identified
using a detailed formula to calculate the efforts of supplier surveillance, updating materials
specifications, focusing on quality versus price or schedule, and holding joint quality planning to
be the most important SQM practices with the highest scores within each of the four perspectives
of the BSC. Sensitivity analysis was also performed to provide construction decision makers and
professionals with the information regarding the fluctuation of the practices’ values (analysis
output) over the variation of attributes’ weights (analysis input). The analysis provided important
insights when applying the SQM practices in real projects with different attributes’ weights.

166
In this research, SMART was used to analyze SQM practices that are important in every
construction project. In order to describe the required long-term strategy for SQM, it was
important to consider the importance of leadership and its impact on SQM. The leadership
taxonomy and VFT were utilized for this purpose. The leadership literature taxonomy produced
six common leadership principles that were used to formulate objectives for the VFT analysis.
The VFT analysis revealed that the internal leadership objectives are more important than the
external because it is essential for construction organizations to focus on managing their internal
objectives prior to managing the external ones. The analysis also identified maximizing quality
influence as the most important objective for SQM leadership. Three leadership practices were
created for VFT: having a quality director to create a quality culture; establishing relationships
and joint quality meetings with strategic suppliers; and performing internal reviews of SQM
practices. The assessment of these practices shows that having a quality director is the most
important practice in developing strategic leadership for SQM.
The contributions of this research to the construction and management engineering include
analyzing SQM practices within the BSC framework that can provide a basis for construction
organizations to assess their existing SQM practices given their current capabilities to perform
the practices and their effect on the SQM quality. The findings from this analysis can help
construction leaders identify SQM practices that have high impact on quality and are easy to
implement across construction projects. The research also identifies key leadership objectives
and practices that will help create an effective environment for applying SQM practices within
construction organizations and support the achievement of strategic leadership for SQM.
This study is limited in that only two attributes were used with SMART for rating the SQM
practices: ease of implementation and impact on quality. Other attributes can be beneficial to be

167
included within the analysis such as cost and risk associated with implementing the practices.
The study is also limited by using data obtained from construction organizations performing
mainly engineer-procure-construct (EPC) projects, the results might not be the same for other
types of contractors in the construction industry. Suggestions for future work include conducting
SMART analysis for the SQM practices for organizations with least effective SQM in order to
assess their internal capabilities. Also, future work could include investigating the barriers for
SQM improvement. Other suggestions for future work to improve the research may include
involving more SMEs from organizations with a different focus (e.g., commercial, residential,
specialty contracting).
Acknowledgements
This research effort was supported by the Construction Industry Institute on RT 308 – Achieving
Zero Rework through Effective Supplier Quality Practices. The opinions expressed in this paper
are those of the authors and not necessarily of CII or its member organizations.
References
AlMaian, R. (forthcoming 2014). A strategic approach to effectively manage supplier quality within the construction industry. Ph.D. Dissertation, Department of Industrial Engineering, University of Arkansas.
Caldas, H. C., Menches, L. C., Navarro, L., & Vargas, M. D. (2012). An analysis of global procurement and materials management practices in the construction industry. Research Report No. 257-11. The Construction Industry Institute: The University of Texas at Austin.
Chan, A. S., & Chan, E. W. (2005). Impact of perceived leadership styles on work outcomes: Case of building professionals. Journal of Construction Engineering & Management, 131(4), 413-422.
Cooper, H. (1988). Organizing knowledge synthesis: A Taxonomy of literature reviews. Knowledge in Society, 1, 104-126.

168
Daniels, J., Werner, P. W. & Bahill, A. T. (2001).Quantitative methods for tradeoff analyses. Systems Engineering, 4(3), 190-212.
Elenkov, D. S., Judge, W., & Wright, P. (2005). Strategic leadership and executive innovation influence: An international multi-cluster comparative study. Strategic Management Journal, 26(7), 665-682.
Gharehbaghi, K., & Mc Manus, K. (2003). The construction manager as a leader. Leadership & Management in Engineering, 3(1), 56-58.
Goodwin, P., & Wright, G. (2009). Decision analysis for management judgment (4th ed.). New York: Wiley.
Heifetz, R. A. (1994). Leadership without easy answers. Cambridge, MA: Belknap Press of Harvard University Press.
Heifetz, R. A., & Linsky, M. (2002). Leadership on the line: Staying alive through the dangers of leading. Boston, MA: Harvard Business School Press.
Hoskisson, R., Hitt, M., Ireland, R. D., & Harrison, J. (2009). Competing for advantage. Mason, OH: Cengage Learning.
Ireland, R., & Hitt, M. A. (2005). Achieving and maintaining strategic competitiveness in the 21st century: The role of strategic leadership. Academy of Management Executive, 19(4), 63-77.
Isik, Z., Arditi, D., Dikmen, I., &Birgonul, M. (2010). Impact of resources and strategies on construction company performance. Journal of Management in Engineering, 26(1), 9-18.
Kaplan, R., & Norton, D. (1992). The balanced scorecard-measures that drive performance. Harvard Business Review, 70(1), 71-79.
Keeney, R. L. (1992). Value-focused thinking: A path to creative decision making. Cambridge, Mass: Harvard University Press.
Keeney, R. L. (1993). Creativity in MS/OR: Value-focused thinking - Creativity directed toward decision making. Interfaces, 23(3), 62-67.
Keeney, R. L. (1996). Value-focused thinking: Identifying decision opportunities and creating alternatives. European Journal of Operational Research, 92(3), 537-549.
Kolp, A., & Rea, P. (2006). Leading with integrity: Character-based leadership. Cincinnati, Ohio: Atomic Dog Publishers.
169
Kouzes, J. M., & Posner, B. Z. (1995). The leadership challenge: How to keep getting extraordinary things done in organizations. San Francisco: Jossey-Bass.
Liu, A., Fellows, R., & Fang, Z. Z. (2003). The power paradigm of project leadership. Construction Management & Economics, 21(8), 819-829.
Machiavelli, N. (1994). The prince. New York: Barnes and Noble, Inc.
Maxwell, J. C. (2007). The 21 irrefutable laws of leadership: Follow them and people will follow you. Nashville, TN: Thomas Nelson.
Needy, K. & Ries R. (2010). Best practices in quality management for the capital facilities delivery industry. Research Report No. Research Report 254-11. The Construction Industry Institute: The University of Texas at Austin.
Parnell, G., Driscoll, J., & Henderson, D. (2011). Decision making in systems engineering and management. Hoboken, N.J.: Wiley-Interscience.
Phillips, D. T. (1992). Lincoln on leadership: Executive strategies for tough times. New York: Warner Books.
Pöyhönen, M., & Hämäläinen, R. P. (2001). On the convergence of multiattribute weighting methods. European Journal of Operational Research, 129(3), 569-585.
Saee, J. (2005). Effective leadership for the global economy in the 21st century. Journal of Business Economics & Management, 6(1), 3-11.
Sample, S. B. (2002). The contrarian's guide to leadership. San Francisco: Jossey-Bass.
Schutt, R. (2012). Investigating the social world: The process and practice of research (7th edition). Sage Publications Inc.
Skipper, C. O., & Bell, L. C. (2006). Assessment with 360° evaluations of leadership behavior in construction project managers. Journal of Management in Engineering, 22(2), 75-80.
Sunindijo, R. Y. (2012). Integrating emotional intelligence, political skill, and transformational leadership in construction. Civil Engineering Dimension, 14(3), 182-189.
Sun Tzu (1963). The art of war. New York: Oxford University Press.
Toor, S., & Ofori, G. (2008). Tipping points that inspire leadership: An exploratory study of emergent project leaders. Engineering Construction & Architectural Management, 15(3), 212-229.

170
Vera, D., & Crossan, M. (2004). Strategic leadership and organizational learning. The Academy of Management Review, 29(2), 222-240.

171
APPENDIX I: SMART calculations for SQM practices
Weight Normalized weight wi Weight Normalized weight wi75 0.43 100 0.57
1. Financial perspective practices RatingNormalized rating
vi(xi)Rating
Normalized rating vi(xi)
Total v(x)
1. Use a detailed formula to calculate the effort of SQS. 50 28.57 70 30.43 29.642. Estimate (project) the inspection cost. 45 25.71 50 21.74 23.443. Determine the cost and quality impact of the NCs to the project. 10 5.71 70 30.43 19.844. Track both cost and hours of the inspection efforts. 70 40.00 40 17.39 27.08
Total 175 100 230 100
Weight Normalized weight wi Weight Normalized weight wi25 0.2 100 0.8
2. Customer (Supplier) perspective practicesRating
Normalized rating vi(xi)
RatingNormalized rating
vi(xi)Total v(x)
1. Match the PO with request for proposal/quotation (RFP) 50 13.70 100 19.34 18.212. Update the materials/ equipment specifications. 100 27.40 95 18.38 20.183. Share forecasting plans of upcoming projects with suppliers. 0 0.00 20 3.87 3.094. Notify suppliers immediately regarding any NCs. 40 10.96 80 15.47 14.575. Send inspectors to the supplier’s facility who add value to the SQ process. 80 21.92 82 15.86 7.566. Avoid shortening schedules during the course of the PO. 25 6.85 50 9.67 9.117. Observe the suppliers’ work at their facilities. 70 19.18 90 17.41 17.76
Total 365 100 517 100
Weight Normalized weight wi Weight Normalized weight wi
90 0.47 100 0.53
3. Internal business perspective practices Rating Normalized rating RatingNormalized rating
vi(xi)Total v(x)
1. Classify suppliers as strategic or non-‐strategic. 100 28.57 75 9.18 18.372. Focus on the planning and selection phase. 12 3.43 85 10.40 7.103. Focus on quality (versus price and schedule). 98 28.00 99 12.12 19.644. Identify work capacity of suppliers including the other customers’ POs. 10 2.86 70 8.57 5.865. Maintain well-‐trained inspectors. 15 4.29 98 12.00 8.346. Use consistent tools to measure supplier performance. 20 5.71 80 9.79 7.867. Involve top management (leadership) to improve the SQ system. 5 1.43 100 12.24 7.128. Measure supplier performance throughout the PO. 40 11.43 95 11.63 11.539. Evaluate cultural barriers for global suppliers and adapt the SQ process in each country. 0 0.00 25 3.06 1.6110. Develop an internal database to Track supplier performance and analyze future decisions. 50 14.29 90 11.02 12.56
Total 350 100 817 100
Weight Normalized weight wi Weight Normalized weight wi
100 0.56 80 0.44
4.Innovation and learning practices Rating Normalized rating RatingNormalized rating
vi(xi)Total v(x)
1. Ensure that sub-‐suppliers (tiers of suppliers) know the quality requirements. 80 23.74 100 22.99 23.412. Derive supplier development and control from other industries, and shift from QC (inspection) to more into development and improvement (prevention).
0 0.00 25 5.75 2.55
3. Build supplier partnership (alliance, training, and support). 40 11.87 50 11.49 11.704. Develop an integrated information platform with appropriate information access. 20 5.93 75 17.24 10.965. Hold a joint quality planning between contractors and suppliers. 100 29.67 95 21.84 26.196. Provide feedback to the suppliers. 97 28.78 90 20.69 25.19
Total 337 100 435 100
―Example for calculating total value of practice 3 (determine the cost and quality impact of NCs) in the finanacial perspective : Total v(x)= 0.43*5.71 + 0.57*30.43 = 19.84―Highlighted rows represent practices that have the highest scores within each perspective of the balanced scorecard (BSC).
Attributes
Ease of implementation Impact on qualityAttributes
Ease of implementation Impact on quality
Ease of implementation Impact on quality
Attributes
Attributes
Ease of implementation Impact on quality

172
APPENDIX II: Sensitivity analysis for SMART calculations
Change in ease of implemtation
weight
1.Use a detailed formula
2.Estimate inspection
cost
3.Determine cost and
quality impact
4. Track inspection efforts
0 30.4347826 21.73913043 30.43478261 17.391304350.1 30.2484472 22.13664596 27.96273292 19.652173910.2 30.0621118 22.53416149 25.49068323 21.913043480.3 29.8757764 22.93167702 23.01863354 24.173913040.4 29.689441 23.32919255 20.54658385 26.434782610.43 29.6362023 23.44276841 19.84028394 27.080745340.5 29.5031056 23.72670807 18.07453416 28.695652170.6 29.3167702 24.1242236 15.60248447 30.956521740.7 29.1304348 24.52173913 13.13043478 33.21739130.8 28.9440994 24.91925466 10.65838509 35.478260870.9 28.757764 25.31677019 8.186335404 37.739130431 28.5714286 25.71428571 5.714285714 40
Change in ease of implemtation
weight
1. Match PO with RFP
2. Update materials
specifications
3. Share forecasting
plans
4. Notify of any NCs
immediately
5.Send helpful
inspectors
6.Avoid shortening schedules
7.Observe suppliers’ work
0 19.3423598 18.37524178 3.868471954 15.47388781 15.860735 9.671179884 17.408123790.1 18.7779868 19.27744363 3.481624758 15.02238944 16.466442 9.388993402 17.585119630.2 18.2136138 20.17964548 3.094777563 14.57089107 17.07215 9.106806921 17.762115470.3 17.6492409 21.08184733 2.707930368 14.1193927 17.677857 8.824620439 17.939111310.4 17.0848679 21.98404918 2.321083172 13.66789433 18.283564 8.542433958 18.116107150.5 16.520495 22.88625103 1.934235977 13.21639596 18.889272 8.260247476 18.293102990.6 15.956122 23.78845288 1.547388781 12.76489759 19.494979 7.978060995 18.470098830.7 15.391749 24.69065473 1.160541586 12.31339922 20.100686 7.695874513 18.647094670.8 14.8273761 25.59285658 0.773694391 11.86190085 20.706394 7.413688032 18.824090510.9 14.2630031 26.49505842 0.386847195 11.41040248 21.312101 7.13150155 19.001086351 13.6986301 27.39726027 0 10.95890411 21.917808 6.849315068 19.17808219
Change in ease of implemtation
weight
1. Classify suppliers
2.Focus on planning
3.Focus on quality
4. Identify work
capacity of suppliers
5.Maintain well-‐trained
inspectors
6.Use consistent
tools
7.Involve top management
8. Measure supplier
performance
9.Evaluate cultural
barriers for global
suppliers
10. Develop internal database
0 9.17992656 10.40391677 12.11750306 8.567931457 11.995104 9.791921665 12.23990208 11.62790698 3.05997552 11.01591190.1 11.1190768 9.706382235 13.70575275 7.996852597 11.224165 9.38415807 11.15876902 11.60797342 2.753977968 11.34289210.2 13.058227 9.008847701 15.29400245 7.425773737 10.453226 8.976394475 10.07763595 11.58803987 2.447980416 11.66987240.3 14.9973772 8.311313167 16.88225214 6.854694877 9.6822871 8.56863088 8.996502885 11.56810631 2.141982864 11.99685260.4 16.9365274 7.613778633 18.47050184 6.283616017 8.9113481 8.160867284 7.91536982 11.54817276 1.835985312 12.32383280.47 18.3653749 7.099805818 19.64079108 5.862821067 8.3432878 7.860409899 7.118745456 11.53348487 1.610513432 12.56476560.5 18.8756776 6.916244099 20.05875153 5.712537157 8.1404092 7.753103689 6.834236755 11.5282392 1.52998776 12.65081310.6 20.8148278 6.218709565 21.64700122 5.141458297 7.3694702 7.345340094 5.753103689 11.50830565 1.223990208 12.97779330.7 22.753978 5.521175031 23.23525092 4.570379437 6.5985312 6.937576499 4.671970624 11.48837209 0.917992656 13.30477360.8 24.6931282 4.823640497 24.82350061 3.999300577 5.8275922 6.529812904 3.590837559 11.46843854 0.611995104 13.63175380.9 26.6322784 4.126105963 26.41175031 3.428221717 5.0566533 6.122049309 2.509704494 11.44850498 0.305997552 13.9587341 28.5714286 3.428571429 28 2.857142857 4.2857143 5.714285714 1.428571429 11.42857143 0 14.2857143
Change in ease of implemtation
weight
1. Ensure sub-‐suppliers
know quality requirements
2. Derive supplier
development from other industries
3.Build supplier
partnerships
4. Develop integrated information platform
5. Hold joint quality planning
6. Provide feedback
0 22.9885057 5.747126437 11.49425287 17.24137931 21.83908 20.689655170.1 23.0635424 5.172413793 11.53177121 16.11071319 22.622531 21.499027930.2 23.1385791 4.597701149 11.56928954 14.98004707 23.405982 22.30840070.3 23.2136157 4.022988506 11.60680787 13.84938095 24.189433 23.117773460.4 23.2886524 3.448275862 11.6443262 12.71871483 24.972884 23.927146220.5 23.3636891 2.873563218 11.68184454 11.58804871 25.756335 24.736518980.56 23.4053761 2.554278416 11.70268806 10.95990086 26.191586 25.186170520.6 23.4387257 2.298850575 11.71936287 10.45738258 26.539786 25.545891740.7 23.5137624 1.724137931 11.7568812 9.326716464 27.323237 26.35526450.8 23.5887991 1.149425287 11.79439954 8.196050343 28.106688 27.164637270.9 23.6638357 0.574712644 11.83191787 7.065384222 28.890139 27.974010031 23.7388724 0 11.8694362 5.934718101 29.673591 28.78338279
―Highlighted rows represent calculations of the base (original) value for the attributes' weights provided by subject matter experts (SMEs).
v(x)
4. Innovation and learning practices
3. Internal business practices
2. Customer (Supplier) practices
1. Financial practicesv(x)
v(x)
v(x)

173
7. CONCLUSION
This dissertation employs a strategic approach to effectively manage supplier quality within the
construction industry. This strategic approach involves examining SQM practices from the
construction industry and from multiple industries found in the literature to identify practices that
could be used by the construction industry to improve SQM. The research also investigates the
current SQM practices within the construction industry from multiple data sources, such as
structured interviews and supplier focus groups to identify effective SQM practices that help
improve the existing SQM. Effective SQM practices identified in the investigation are validated
(cross analyzed) to verify that the findings from multiple data sources yield same conclusions.
Effective SQM practices identified in the research are presented in multiple views, including the
SQ process map and the balanced scorecard (BSC), to help construction management adopt these
practices within construction projects. The SQ process map indicates when SQM practices are
best implemented within the project life cycle. The BSC organizes SQM practices along four
perspectives: financial, customer (supplier), internal business, and innovation and learning.
Performance metrics were then formulated for each practice within each perspective of the BSC
to help managers measure and compare performance of multiple projects. In general, the BSC is
an effective framework for leaders who use in assessing the organization performance to achieve
effective strategic leadership (Hoskisson et al., 2009). The research effort also includes an
assessment of SQM practices aligned within the BSC framework to help construction
organizations focus on key SQM practices within this framework. In order to promote strategic
leadership for SQM and enable an effective implementation of SQM practices, the research
identifies important leadership practices for construction organizations. In general, leadership

174
provides conditions for motivation, commitment, and support for any project (Cleland & Ireland,
2006).
The research includes three objectives to effectively manage supplier quality within the
construction industry. The first objective is to describe and assess the process of assuring
supplier quality inside and outside the construction industry. The second objective is to develop a
framework for the supplier quality process based on the collection of SQM practices from
multiple data sources. The third objective is to assess the SQM practices within the developed
framework of supplier quality process, and to discuss the development of strategic leadership for
SQM.
The research efforts to achieve the dissertation objectives include an investigation of SQM
practices inside and outside the construction industry; and for the current SQM practices applied
by construction organizations, to identify the effective practices that ensure the quality of the
supplied products. The research efforts also involve recommending a framework for
implementing the identified effective SQM practices and measuring the performance of multiple
projects. The dissertation also contains an assessment of those effective SQM practices within
the proposed framework to simplify the implementation process and to focus on the most
important practices. Finally, the research includes an examination of important leadership
principles and practices that help in achieving strategic leadership for SQM within the
construction industry.
Research Findings
The research has identified several findings related to the effective management of supplier
quality within the construction industry through the dissertation contributions (publishable

175
papers). The first contribution, presented in Chapter 2, identifies the importance of the strategic
supplier partnership and development for SQM, along with management commitment for
improvement, and proper feedback system implementation. The first contribution shows that
SQM approaches inside and outside the construction industry are quite similar. However, the
current SQM within the construction industry requires consistent implementation.
Chapter 3 presents the second contribution. This contribution identifies that organizations with
highly effective SQM place higher importance during the planning and selection phase of
construction projects, and are more consistent in measuring and developing supplier performance
as compared to other organizations with least and moderate effective SQM.
The third contribution, discussed in Chapter 4, describes the use of quantitative methods to
analyze the SQM practices and to determine the most important practices for SQM. The analysis
results and the discussion with the SMEs show supplier’s performance rating is an important
practice because it helps suppliers learn from their mistakes that caused quality problems.
Observing supplier’s work helps construction organizations detect quality problems during
execution. As important as observing supplier’s work, developing inspection and testing plans
help to understand what is required to produce a product with the required level of quality.
Inspection effort tracking is also an important practice for SQM, because at the end of each
project, construction organizations can determine the required inspection effort for future
projects.
In Chapter 5, the fourth contribution shows the alignment of effective SQM practices across
multiple data sources and determines the importance of proposing the BSC as an implementation
framework for consistent application and continuous improvement for SQM. The discussion with

176
the SMEs show that the construction organizations anticipate using the BSC framework in future
projects, and that the BSC could allow them to consider improving important areas of SQM other
than financial, such as internal business and innovation.
Chapter 6 describes the fifth contribution which identifies that using financial formulas for
supplier surveillance, updating project materials specifications, focusing on quality as opposed to
cost, and holding joint quality planning with suppliers are important SQM practices for
construction organizations because of their high impact on quality and ease of implementation.
The fifth contribution also shows effective SQM implementation within construction
organizations require strategic leadership for SQM by having a quality director who inspires the
culture of quality.
In this dissertation, SQM practices identified to be effective were found based on analyzing
multiple data sources. The data sources include literature review, SQM documents, structured
interviews, supplier focus groups, PO instrument, and inspection cost data. Table 1 summarizes
all SQM practices identified throughout the research and marks from which data source the SQM
practice was shown to be effective.
Data source
SQM practice
Lite
ratu
re
revi
ew
SQM
do
cum
ents
Stru
ctur
ed
inte
rvie
ws
Supp
lier
focu
s gr
oups
PO
inst
rum
ent
Insp
ectio
n co
st d
ata
1. Use a detailed formula to calculate the effort of SQS based on criticality of the items and previous supplier performance.
ü ü
ü
2. Estimate (project) inspection cost. ü 3. Determine the cost and quality impact of the NCs to
the project. ü
4. Track both cost and hours of inspection efforts. ü ü ü 5. Match PO with request for proposal/quotation (RFP). ü 6. Update materials/equipment specifications. ü
Table 1: Summary of effective SQM practices and the data sources

177
Data source
SQM practice
Lite
ratu
re
revi
ew
SQM
do
cum
ents
Stru
ctur
ed
inte
rvie
ws
Supp
lier
focu
s gr
oups
PO
inst
rum
ent
Insp
ectio
n co
st d
ata
7. Share forecasting plans of upcoming projects with suppliers to allow them to plan.
ü
8. Notify suppliers immediately regarding any NCs. ü 9. Send inspectors to supplier’s facility who add value to
the SQ process. ü
10. Avoid shortening schedules during the course of PO. ü 11. Observe suppliers’ work at their facilities. ü ü 12. Classify suppliers as strategic or non-strategic. ü ü 13. Focus on the planning and selection phase. ü ü 14. Identify work capacity of suppliers including the other
customers’ POs. ü ü
15. Focus on quality (versus price and schedule). ü ü ü ü 16. Maintain well-trained inspectors. ü 17. Use consistent tools to measure supplier performance. ü ü ü 18. Involve top management (leadership) to improve the
SQ system (set visions, directions, and improvement initiatives).
ü
ü ü
19. Measure supplier performance throughout the PO. ü 20. Evaluate cultural barriers for global suppliers and
adapt the SQ process in each country. ü ü ü
21. Develop an internal database to track supplier performance and analyze future decisions.
ü
22. Ensure that sub-suppliers (tiers of suppliers) know quality requirements. ü
ü ü
23. Derive supplier development and control from other industries, and shift from QC (inspection) to development and improvement (prevention).
ü
ü
24. Build supplier partnerships (alliance, training, and support). ü
ü ü
25. Develop an integrated information platform with appropriate information access. ü ü
26. Hold joint quality planning between contractors and suppliers. ü
ü ü ü
27. Provide feedback (performance ratings, and meetings) to suppliers. ü
ü ü ü
Table 1(Cont.): Summary of effective SQM practices and the data sources
The practices highlighted in Table 1 are for those found to be effective from analyzing four data
sources. The analysis of literature review, structured interviews, supplier focus groups, and
inspection cost data suggested practice 15 (focus on quality) to be effective. Practices 26 (hold
joint quality planning) and 27 (provide feedback to suppliers) were identified to be effective

178
based on analyzing the literature, structured interviews, supplier focus groups, and PO
instrument.
Several research methods were used in this dissertation to analyze the data and to draw
conclusions about the effective SQM practices including: literature review taxonomy for SQM
practices inside and outside construction industry, grounded theory, principal components
analysis (PCA), and analytic hierarchy process (AHP). SQM practices that were identified to be
effective were aligned in the BSC framework, and evaluated using simple multi-attribute rating
technique (SMART). Leadership practices were also discussed as part of this dissertation and
evaluated using value focused thinking (VFT). Table 2 presents a summary of SQM practices
recommended based on consensus among several research methods findings.
SQM practice Cross analysis remarks Practice 1: Use a detailed formula to calculate the effort of SQS based on criticality of the items and previous supplier performance.
This practice was selected as an effective practice based on the analysis of grounded theory, also SMART analysis determined this practice to have the highest score value within financial perspective of the BSC.
Practice 4: Track both cost and hours of inspection efforts.
The analysis using grounded theory suggested this practice as one of the effective practices for organizations with highly effective SQM. PCA and AHP identified this practice as an important SQM practice. SMART analysis suggested this practice to have the second highest score within financial perspective of the BSC.
Practice 6: Update materials/equipment specifications.
SMART analysis determined this practice to have the highest score within customer perspective of the BSC. Also, as reported by suppliers in the supplier focus groups, this practice is critical for SQM improvement.
Practice 11: Observe suppliers’ work at their facilities.
The literature review for SQM practices inside and outside the construction industry by using literature review taxonomy recommended this practice as an effective SQM practice. Also, PCA and AHP identified this practice as an important SQM practice.
Practices 12: Classify suppliers as strategic or non-strategic.
The literature review for SQM practices inside and outside the construction industry by using literature review taxonomy and grounded theory analysis recommend this practice as an effective SQM practice. Also, SMART analysis suggested this practice to have the second highest score in internal business of the BSC.
Table 2: Summary of cross analysis for the SQM practices

179
SQM practice Cross analysis remarks
Practice 15: Focus on quality (versus price and schedule).
The literature review for SQM practices inside and outside the construction industry by using literature review taxonomy and grounded theory analysis recommended this practice as an effective SQM practice. Also, SMART analysis suggested this practice to have the highest score in internal business of the BSC.
Practice 18: Involve top management (leadership) to improve the SQ system (set visions, directions, and improvement initiatives).
The literature review for SQM practices inside and outside the construction industry by using literature review taxonomy, grounded theory analysis, and VFT recommend this practice as an effective SQM practice. SMART analysis showed this practice to have a significant impact on improving quality, however it is very difficult to implement.
Practice 26: Hold joint quality planning between contractors and suppliers.
The literature review for SQM practices inside and outside the construction industry by using literature review taxonomy, grounded theory analysis, AHP, and SMART suggested this practice as an effective SQM practice.
Practice 27: Provide feedback (performance ratings, and meetings) to suppliers.
The literature review for SQM practices inside and outside the construction industry by using literature review taxonomy, grounded theory analysis, PCA and AHP, as well as SMART (second highest score in innovation perspective of the BSC) suggested this practice as an effective SQM practice.
Table 2 (Cont.): Summary of cross analysis for the SQM practices
Synthesizing the findings summarized in Tables 1 and 2, we conclude that observing suppliers at
their facilities, using detailed formulas to calculate the efforts (cost and hours) of supplier
surveillance, and also tracking those efforts are important practices as supported by the
consensus among several data and research methods used in this dissertation. Also, the cross
analysis of findings showed that updating materials specifications provided to suppliers and
focusing on quality as opposed to cost are effective SQM practices for improving current SQM
systems. Not surprisingly, many research methods used for analyzing the dissertation data
sources noted the importance of management support for SQM. In addition, classification of
suppliers as strategic or non-strategic and proper joint planning and feedback systems were also
found to be effective SQM practices.
Research Limitations
The research involves a number of limitations. SQM practices identified from literature
examination inside and outside the construction industry is limited to the focus of the literature

180
review (integrative review) and to what was found in the examined sources. Other practices can
be effective for SQM but might not be discussed in the first publishable paper of the dissertation
presented in Chapter 2. The discussion of effectiveness of SQM is limited to the sampled data
from construction organizations conducting mainly engineer-procure-construct (EPC) projects,
also limited to what the interviewed contractors have reported regarding the level of SQM
effectiveness in their organizations. The classifications and findings of effectiveness for SQM
might not necessarily be similar to other construction organizations with different focus other
than EPC. The third publishable paper, presented in Chapter 4, is limited by the use of a small
data set to analyze and derive conclusions about practices conducted by organizations with
highly effective SQM within EPC projects. The findings identified in Chapter 4 might not
represent a large number of organizations conducting different types of projects within the
construction industry. The developed BSC framework could have included other important SQM
practices; however, the development of the BSC is based on SQM practices collected from
multiple data sources that are limited to the focus of the research. In addition, the findings of the
fifth publishable paper described in Chapter 6 are based on expert judgment and preference from
two SMEs in organizations with highly effective SQM who have collectively over 50 years of
experience in the construction industry and primarily in EPC projects, resulting in nearly similar
judgments. The SMEs’ judgments might not have similar consensus if the research involved a
large group of SMEs from the construction industry. In such cases of disagreement, the research
may include a detailed methodology for group decision making to address the lack of consensus.
The focus of this dissertation in terms of describing and evaluating existing SQM practices in
construction industry requires the utilization of ordinal data such as the self-reported level of
SQM effectiveness from construction organizations (highly effective, moderately effective, and

181
least effective) and the expert judgment of SQM practices. The conclusions based on ordinal data
from this research might not necessarily be generalized for the whole construction industry.
Despite these limitations, this research has made a significant contribution to the body of
knowledge. The findings can be used by stakeholders in the construction industry to improve
SQM within their organizations, and can also benefit researchers who wish to better understand
SQM practices within the construction industry.
Future Work
This dissertation can provide several opportunities to expand the discussion of SQM in future
work. Suggestions for future work are described next.
Analyzing SQM Effectiveness and Suppliers’ Products
The research can be expanded to include more organizations reflecting diverse levels of SQM
effectiveness so that further areas of comparisons among these organizations can be examined.
Another area for future work may include analyzing and comparing SQM practices with respect
to the products and services being supplied. For example, practices for managing the quality of
supplied materials and equipment may differ from the practices used for managing the supplied
services at a construction site such as welding and drilling.
Analyzing SQM Practices from Construction Organizations with Different Focus
This dissertation focuses on SQM practices from construction organizations performing mainly
EPC projects. The suggested future work for the dissertation may include analyzing SQM from
construction organizations with different focus other than EPC such as commercial, residential,
or specialty contracting. Although, the identified SQM practices of this dissertation may not only

182
be restricted for EPC projects, it is beneficial to analyze and compare the SQM practices from
diverse construction organizations with different focus. Also, future work may include exploring
and investigating supplier development practices, and predicting their impact to project
outcomes.
Analyzing the SQM Practices in terms of Detecting and Preventing Non-Conformances
The SQM practices within the proposed balanced scorecard (BSC), shown in Figure 3 of Chapter
5, can be analyzed by their ability to detect and prevent non-quality problems, i.e., non-
conformances. Detecting non-conformances measures the ability of a given practice to help in
discovering quality problems during the project. Preventing non-conformances describes the
ability of a practice to avoid non-conformances from occurring.
Studying the Barriers for Improving SQM
Implementing effective SQM practices within construction projects may be hindered by a
number of barriers and risks. Future work may include analyzing barriers and risks associated
with SQM implementation. Examples of the barriers and risks may include:
• Lack of commitment by the supplier to the relationship and performance expectations.
• Lack of support from management to choose a supplier that has long-term benefits for the
organization.
• Unforeseen supplier tiers that could lead to complexities in communication, management,
and legal consequences.

183
• Uncertainty of future conflicting interests of the suppliers that could not be obvious
during the selection process.
• Supplier’s environment risk such as operating and political risks.
The barriers and risks can also be classified into within control and out of control, as well as
internal and external barriers and risks.
Improving the Quality Culture and Supplier Data Management
The discussion with the SMEs revealed important suggestions for future work such as
identifying the initiatives necessary to build an integrated culture of quality within organization
given the challenges of staffing, recruitment, and retention. Also, based on the SMEs discussion
future work may include how to effectively manage supplier data in terms of collecting,
consolidating, and analyzing in order to help improving SQM. Another suggestion for future
work for assisting construction organizations in improving their SQM systems is to provide them
with a user-friendly tool, such as an Excel spreadsheet, for SQM evaluation. The evaluation
methodology described in Chapter 6 of the dissertation can be more useful for application if a
user-friendly tool is developed for construction organizations to let them customize the level of
preference for ranking and weighting the SQM practices allowing them to better manage their
SQM data.

184
References
Cleland, D. I., & Ireland, L., R. (2006). Project management: Strategic design and implementation. New York: McGraw-Hill.
Hoskisson, R., Hitt, M., Ireland, R. D., & Harrison, J. (2009). Competing for advantage. Mason, OH: Cengage Learning.

185
APPENDIX I: Structured Interview
Data Collection Protocol RT 308 – Achieving Zero Rework through Effective Supplier Quality Practices
• Companies will be invited to participate on a volunteer basis according to the guidelines
provided by CII (GuidelinesForMeetingsAndConferences-CII.pdf) and the informed consent letter.
• Data will be collected via interview face-to-face or via conference call based on the following set of questions:
1. Supplier Quality Organization
1.1. Provide an organization chart depicting the Supplier Quality Organization relative to other units within the organization.
1.2. What role does top management play with respect to supplier quality management? 1.3. How many people are employed in the Supplier Quality Organization? What titles do
they hold? Are they salaried or hourly? Are the full-time or part-time? Are they employed by the company or contracted?
1.4. List the location of personnel in the Supplier Quality Organization, i.e., domestic/abroad, office/project site.
1.5. What is the range of education of Supplier Quality personnel? On average, how much experience do they have? Do they typically hold Supplier Quality Certification? What Supplier Quality training do they take? What kinds of “levels of Supplier Quality education” (“training”) does your company offer?
1.6. What is the ratio of agency (temporary labor) to direct hired (staff) people? 2. Supplier Quality System
2.1. Who makes decisions to choose suppliers? 2.2. How are suppliers selected/qualified for use? 2.3. How frequently are suppliers re-qualified for use? 2.4. What triggers a supplier to be removed from your bidders list? 2.5. Do you use supplier quality surveillance to try to ensure supplier quality? Tell us about
the system. 2.6. What other tools do you use to ensure supplier quality?
3. Metrics
3.1. Which metrics do you use to measure supplier performance? 3.2. When do you measure supplier performance? 3.3. Who is responsible for measuring supplier performance? 3.4. Do you use supplier performance in consideration for future work or maintenance of
bidders list? 4. Data
4.1. Describe the method for tracking supplier performance? 4.2. What documents are generated by your organization to document supplier performance? 4.3. How are non-conformances documented and managed within your organization?

186
4.4. Could you provide supplier performance data? [phases: release from inspection, received on site acceptable, and mechanical completion acceptable]
5. Assessment
5.1. What are the strengths of your supplier quality system? 5.1.1. Selecting and qualifying suppliers 5.1.2. Risk identification 5.1.3. Developing project-specific procurement quality plan 5.1.4. Coordination 5.1.5. Well trained inspectors 5.1.6. Inspection coverage 5.1.7. Measuring supplier performance 5.1.8. Measuring inspector performance 5.1.9. Consistency in using tools and practices 5.1.10. Continuous improvement 5.1.11. Other
5.2. What are the opportunities for improvement in your supplier quality system?
5.2.1. Selecting and qualifying suppliers 5.2.2. Risk identification 5.2.3. Developing project-specific procurement quality plan 5.2.4. Coordination 5.2.5. Well trained inspectors 5.2.6. Inspection coverage 5.2.7. Measuring supplier performance 5.2.8. Measuring inspector performance 5.2.9. Consistency in using tools and practices 5.2.10. Other
5.3. What is the biggest challenge you face as an organization with respect to supplier quality?
5.4. Would you consider the supplier quality system at your company to be highly mature? 6. Supporting documents
6.1. Which documents do you use to keep track of data related to quality of products and services? Can we obtain copies of these documents?
6.2. Which procedures or guidelines are used as part of your quality system? Can we obtain copies of these documents?
7. Suppliers
7.1. How do you assure that your sub-suppliers are complying with your requirements? 7.2. How many active suppliers do you have? 7.3. How many levels and/or tiers are typically in your supply chain?
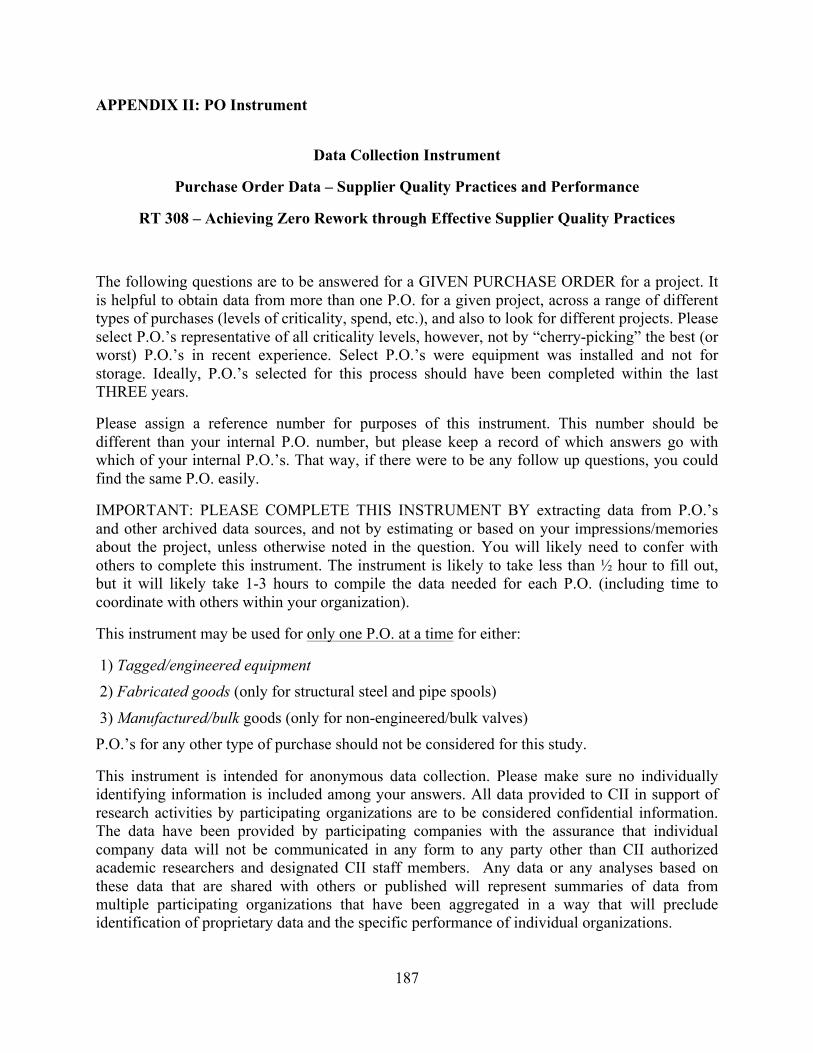
187
APPENDIX II: PO Instrument
Data Collection Instrument
Purchase Order Data – Supplier Quality Practices and Performance
RT 308 – Achieving Zero Rework through Effective Supplier Quality Practices
The following questions are to be answered for a GIVEN PURCHASE ORDER for a project. It is helpful to obtain data from more than one P.O. for a given project, across a range of different types of purchases (levels of criticality, spend, etc.), and also to look for different projects. Please select P.O.’s representative of all criticality levels, however, not by “cherry-picking” the best (or worst) P.O.’s in recent experience. Select P.O.’s were equipment was installed and not for storage. Ideally, P.O.’s selected for this process should have been completed within the last THREE years.
Please assign a reference number for purposes of this instrument. This number should be different than your internal P.O. number, but please keep a record of which answers go with which of your internal P.O.’s. That way, if there were to be any follow up questions, you could find the same P.O. easily.
IMPORTANT: PLEASE COMPLETE THIS INSTRUMENT BY extracting data from P.O.’s and other archived data sources, and not by estimating or based on your impressions/memories about the project, unless otherwise noted in the question. You will likely need to confer with others to complete this instrument. The instrument is likely to take less than ½ hour to fill out, but it will likely take 1-3 hours to compile the data needed for each P.O. (including time to coordinate with others within your organization).
This instrument may be used for only one P.O. at a time for either:
1) Tagged/engineered equipment 2) Fabricated goods (only for structural steel and pipe spools)
3) Manufactured/bulk goods (only for non-engineered/bulk valves) P.O.’s for any other type of purchase should not be considered for this study.
This instrument is intended for anonymous data collection. Please make sure no individually identifying information is included among your answers. All data provided to CII in support of research activities by participating organizations are to be considered confidential information. The data have been provided by participating companies with the assurance that individual company data will not be communicated in any form to any party other than CII authorized academic researchers and designated CII staff members. Any data or any analyses based on these data that are shared with others or published will represent summaries of data from multiple participating organizations that have been aggregated in a way that will preclude identification of proprietary data and the specific performance of individual organizations.

188
Reports, presentations, and proceedings containing statistical summaries of aggregated company data may be used to support team findings. To protect the confidentiality of companies submitting data, all data published and/or presented must reflect the aggregate of no less than 10 P.O.’s, where project level data are collected, and must have been submitted by at least three (3) separate companies. In cases where a disproportionate amount of the data are provided by a single company, the research team will suppress publication of results until the data set is sufficiently large to mitigate confidentiality and bias concerns.
Should you have any questions about this request please contact any or all the project investigators: Dr. Kenneth Walsh, Dr. Kim Needy, and Dr. Thais Alves. Alternatively you might contact the Institutional Review Board at San Diego State University at [email protected] or 619-594-6622 for any questions or concerns about this project.
1. Contact information for follow up questions:
The following information will ONLY be used for follow up questions and will NOT be associated with the rest of the questions in the final database used for analysis.
Title: ________
Name: __________
Company: ________
Phone: (Include area code and country code if outside USA or Canada) ________
Email: __________
Verify Email: ______
PROJECT DATA
For this section, please provide your answers while trying to leave out as much individually identifying information as possible. Items 2 and 3 are for internal use by the academics only, and will not be shared in any publications or with any industry members of the research team, but are requested only to support follow-up questions (if any), general understanding of the project, and linking P.O.s on the same project.
2. Project Name: ______________________________________________________________________
3. Brief description of project for which this P.O. was initiated: ________________________________
4. Project location (Country if outside U.S., State if inside U.S.): ________________________________

189
5. Project size (estimated total installed cost, should be an order of magnitude value, is it more like e.g. $1M, $10M, $100M) Including engineer, procure, and construct price to the owner: ______________________________________
6. Indicate your role on this project (contractor, owner, supplier): ______________________________
P.O. BASIC DATA
7. P.O. Number (note, this is a reference you should apply only to this response, that should be different from your internal P.O. number): _______________________________________________
8. Total value of P.O. (US $): ____________________________________________________________
9. Brief description of what was purchased: _______________________________________________
10. Primary location of supplier’s facility (not headquarters, but rather where the bulk of the supplied material for this P.O. came from): _____________________________________________________
11. Did the supplier subcontract a significant portion of the work for this P.O.? (As compared to other purchases) Yes/No
12. If Yes for Question 11, was this expected at the time the supplier was selected? Yes/No 13. If No for Question 12, when did it become clear that the work was going to be
subcontracted? __________________________________________________________________________________
14. P.O. Award Date: ___________________________________________________________________
15. Date of release to ship from the supplier’s facility. For P.O’s that had multiple deliveries, use the first release to ship date. If the release date is not known, please provide the ship date from the supplier’s facility: ___________________________________________________________________
16. Date material received on the site. For P.O’s that had multiple deliveries, use the date of the first arrival at the site: ___________________________________________________________________
17. Estimated date of mechanical completion for supplied material. Throughout this instrument, “mechanical completion” refers to the physical installation of the item into the facility, onto foundation, piped, wired, with fluids added as appropriate. For P.O.s with multiple deliveries, use the date of the last installation. An estimate of this date is acceptable: __________________________________
18. Was the supplier selected from your activities, or was the selection driven by some other criterion: (e.g. In-country manufacturing requirement of contract, Direction to use owner-selected supplier)
_____________________________________________________________________________________
19. What was the criticality level assigned to this P.O. (low, medium, high, critical)? ________________

190
PRACTICES
Please answer the following questions in regards to the relationship with this particular supplier, for this particular P.O.
20. Did you have a person in the supplier’s facility to observe the supplier’s work?
____Not at all
____Full time (resident)
____Part time (_____ % time)
____ Occasionally, Randomly, or Periodically (specify below _____# days)
____Final only
_____Neither
21. Do you track hours, cost, or both, none? 22. If available, how many hours were used for inspection on this P.O (this would include hours
spent in item 20): ______ 23. If available, estimated cost for inspection on this P.O. (this would include cost spent in item
20): ______ 24. Were your inspection personnel contract, staff personnel or both? 25. Was there a Quality Control Plan/Inspection and Testing Plan (ITP) used for this specific
P.O.? Yes/No 26. If Yes for Question 25, were all steps in the above plan followed? Yes/No 27. If No for Question 26, Explain why not?
_________________________________________________ 28. If No for Question 26, what percentage of inspections/tests on the ITP ended up NOT being
conducted: ____________% 29. Was the Inspection and Testing Plan (ITP) revised due to issues that arose during execution?
Yes/No 30. Did you conduct meetings with the supplier to discuss quality processes that should be
conducted? (Check all that apply)
____ Pre-award meetings related to the quality function
____ Post-award, pre-execution related to the quality function
____ Pre-inspection meetings
____ Meetings during execution related to the quality function
____ Lessons learned meetings after execution to discuss quality outcomes and potential improvements
31. Did you conduct a performance rating of the supplier after execution? Yes/No 32. Did you include ratings of prior performance in determining whether or not to select this
supplier for this specific P.O.? Yes/No

191
33. If Yes for Question 32, what characteristics of the prior performance did you consider? (Give a list) _________________________________________________(Open-ended in Survey Select)
34. Did you project the cost of your inspection effort with this supplier for this P.O.? Yes/No 35. If Yes for Question 34, was the final actual cost of that effort measured? Yes/No 36. If Yes for Question 35, how did it compare to the estimate? (% Higher, negative number for
lower than expected cost): ______________________________________________ 37. Did the supplier have a registered/certified Quality Management System (QMS) in place at
the time the P.O. was issued? Yes/No 38. If Yes for Question 37, please list all relevant or important registrations/certifications held:
_________________________________________________(Open-ended in Survey Select) 39. Do you prefer to select suppliers with a registration/certification? Yes/No 40. What OTHER PRACTICES that you believe are CRITICAL to your procurement quality
process were not identified or recognized by questions 20-39? Explain?
_____________________________________________________________________________________
_____________________________________________________________________________________
41. TO CONTINUE, CHOOSE ONE OF THE OPTIONS BELOW:
(Note: In order to match the numbering scheme in Survey Select, these pointers must be kept as “Question 41” but there is no real question to be answered here)
• If P.O. Was for Tagged/engineered equipment skip to question # 42. • If P.O. Was for Fabricated goods;
For structural steel, skip to question # 48. For pipe spools, skip to question # 55.
• If P.O. Was for Manufactured/bulk goods (only for non-engineered/bulk valves) skip to question # 61.
OUTCOMES FOR TAGGED/ENGINEERED EQUIPMENT
42. Total number of items for this P.O. __________________________________________________
43. Did you identify any discrepancies or non-conformances during execution in the shop, prior to release to ship? Yes/No
44. If available, Total number of discrepancies and non-conformances noted during execution in the shop ___________________
45. Total number of items identified as unacceptable at release to ship from shop? If no final inspection was performed, answer N/A. __________________________________________________________
192
46. Total number of items identified as unacceptable when received on site? If no inspection was performed, answer N/A. _____________________________________________________________
47. Total number of items identified as unacceptable at mechanical completion at the site? If no inspection was performed, answer N/A. _________________________________________________
FOR FABRICATED GOODS - STRUCTURAL STEEL
48. Total number of tons (ton=2,000lb) of structural steel for this P.O. ___________________________
49. If available, approximate number of pieces of steel represented by the answer to Question 45: ____
50. Did you identify any non-conformances during execution in the shop prior to release to ship? Yes/No
51. If available, total number of pieces of steel for which discrepancies and non-conformances were noted during execution in the shop_______________________________________
52. Total number of pieces of steel which were identified as unacceptable at release to ship from shop? If no final inspection was performed, answer N/A. _____________________________________________
53. Total number of pieces of steel which were identified as unacceptable when received on site? If no inspection was performed, answer N/A. _________________________________________________
54. Total number of pieces of steel which were identified as unacceptable at mechanical completion? If no inspection was performed, answer N/A. _________________________________________________
FOR FABRICATED GOODS - PIPE SPOOLS
55. Total number of pipe spools for this P.O. ________________________________________________
56. Did you identify any non-conformances during execution in the shop prior to release to ship? Yes/No
57. If available, total number of pipe spools for which discrepancies and non-conformances were noted during execution in the shop: ________________________________________
58. Total number of pipe spools identified as unacceptable at release to ship from shop? If no final inspection was performed, answer N/A. _________________________________________________
59. Total number of pipe spools identified as unacceptable when received on site? If no inspection was performed, answer N/A. _____________________________________________________________
60. Total number of pipe spools identified as unacceptable during installation at the site? If no inspection was performed, answer N/A. ________________________________________________

193
FOR MANUFACTURED/BULK GOODS - NON-ENGINEERED/BULK VALVES
61. Total number of non-engineered valves for this P.O. ______________ 62. Did you identify any non-conformances during execution in the shop prior to release to ship?
Yes/No 63. If available, total number of valves for which discrepancies and non-conformances were
noted during execution in the shop: ____ 64. Total number of valves identified as unacceptable at release to ship from shop? If no final
inspection was performed, answer N/A. ______________________________________________________
65. Total number of valves identified as unacceptable when received on site? If no inspection was performed, answer N/A. ___________________________________________________________
66. Total number of valves identified as unacceptable at mechanical completion? If no inspection was performed, answer N/A. _____________________________________________________________
End of Survey
Thank you for volunteering your time to help RT-308 survey and improve supplier quality surveillance practices! Your help is greatly appreciated.

194
APPENDIX III: IRB Approval

195
APPENDIX IV: Supplier Quality Process Map (Detailed)
Supplier Quality Process Map. From Alves et al. (2013)*
*Alves, T., Walsh, K., Neuman, Y., Needy, K., & AlMaian, R. (2013). Supplier quality surveillance practices in construction. 21st Annual Conference of the International Group for Lean Construction – IGLC 21 – Fortaleza, Brazil, 833-842.
196
APPENDIX V: Multi-Author Documentation