a study of the conditions and variables that affect the
TRANSCRIPT
Rochester Institute of TechnologyRIT Scholar Works
Theses Thesis/Dissertation Collections
6-1-2005
A study of the conditions and variables that affectthe printing of shrink films on waterbasedflexographyJimmy Vainstein
Follow this and additional works at: http://scholarworks.rit.edu/theses
This Thesis is brought to you for free and open access by the Thesis/Dissertation Collections at RIT Scholar Works. It has been accepted for inclusionin Theses by an authorized administrator of RIT Scholar Works. For more information, please contact [email protected].
Recommended CitationVainstein, Jimmy, "A study of the conditions and variables that affect the printing of shrink films on waterbased flexography" (2005).Thesis. Rochester Institute of Technology. Accessed from
A Study Of The Conditions And Variables That Affect The Printing Of
Shrink Films On Waterbased Flexography
by
Jimmy Vainstein
A thesis submitted in partial fulfillment of the requirements for the degree of Master of Science in the
School of Print Media in the College of Imaging Arts and Sciences of the Rochester Institute of Technology
June 2005
Thesis Advisors: Dr. Scott Williams Dr. Franziska Frey

Title of thesis: A Study Of The Conditions And Variables That Affect The Printing Of
Shrink Films On Waterbased Flexography.
I, Jimmy Vainstein, herby grant permission to the Wallace Memorial Library of R.I.T. to
reproduce my thesis in whole or in part. Any reproduction will not be for commercial use
or profit.
June 28, 2005

iii
In loving memory of Motel Vainstein (Z’L)
His vision and dedication build the
path that led me here today
iv
Acknowledgements
I would like to thank all the people that were somehow involved in the journey of
this research project. This thesis would not have been possible without the help and
support of all of you.
My advisors, Dr. Scott Williams and Dr. Franziska Frey for their valuable input
and dedication during the course of this project. It was truly a joy to learn from such fine
mentors.
Bill Pope and Timothy Richardson, for their time and effort during the planning
and performance of the print runs of this thesis.
Ron Ryback, for sharing his experience and knowledge of shrink sleeve labels
without asking anything in return.
Kirk Franklin (Environmental Inks and Coatings), Jim Mullen (Klockner
Pentaplast of America) and the team at Hammer Lithograph, not only for contributing
with valuable supplies, but also for their noble teachings.
Last but not least, my wife, family and friends for their patience, love and support
during this fulfilling experience.
v
Table of Contents
List of Tables ...............................................................................................................vii
List of Figures...............................................................................................................ix
Abstract ........................................................................................................................xi
Chapter 1: Introduction and Problem Statement ........................................................1
Chapter 2: Literature Review.......................................................................................3
A Growing Market ......................................................................................................3
Principle Of Shrink Films ............................................................................................3
Shrink Sleeves vs. Roll-On-Shrink-On.........................................................................4
Types of Substrates......................................................................................................4
Printing Process...........................................................................................................7
Inks for Shrink Labels .................................................................................................9
Converting Process....................................................................................................10
Label Application ......................................................................................................11
Flexography ..............................................................................................................12
Printing Problems......................................................................................................14
Chapter 3: Research Objective ...................................................................................20
vi
Chapter 4: Methodology .............................................................................................21
Methodology Overview .............................................................................................21
Equipment and Supplies Specification .......................................................................21
Press Run and Sample Analysis Methodology ...........................................................24
Chapter 5: Results .......................................................................................................40
Press Run Measurements ...........................................................................................40
Corona Treatment Print Run ......................................................................................44
Traditional Print Run .................................................................................................58
Additional Print Runs ................................................................................................67
Chapter 6: Conclusions ...............................................................................................70
Recommendations For Further Studies ......................................................................72
Bibliography ................................................................................................................75
vii
List of Tables
Table 1: Ink pH values...................................................................................................40
Table 2: Ink viscosity values..........................................................................................41
Table 3: Dryer temperatures (Corona Print Run)............................................................42
Table 4: Dryer temperatures (Traditional Print Run). .....................................................42
Table 5: Blocking test results (Corona Print Run). .........................................................44
Table 6: Acceptance decision summary for blocking test (Corona Print Run). ...............45
Table 7: Type of blocking (Corona Print Run). ..............................................................45
Table 8: Hypothesis test decision summary for blocking test (Corona Print Run)...........46
Table 9: Blocking test final results (Corona Print Run). .................................................46
Table 10: Offsetting test results (Corona Print Run).......................................................48
Table 11: Acceptance decision summary for offsetting test (Corona Print Run). ............48
Table 12: Type of offsetting (Corona Print Run)............................................................49
Table 13: Offsetting test final results (Corona Print Run)...............................................49
Table 14: Adhesion test results (Corona Print Run)........................................................50
Table 15: Acceptance decision summary for adhesion test (Corona Print Run). .............50
Table 16: Adhesion test final results (Corona Print Run)................................................52
Table 17: Re-wetting test results (Corona Print Run). ....................................................53
Table 18: Acceptance decision summary for re-wetting test (Corona Print Run). ...........54
Table 19: Corona print run tests results..........................................................................56
Table 20: Corona print run final results..........................................................................56
viii
Table 21: Blocking test results (Traditional Print Run). .................................................58
Table 22: Acceptance decision summary for blocking test (Traditional Print Run).........59
Table 23: Type of blocking (Traditional Print Run). ......................................................59
Table 24: Hypothesis test decision summary for blocking test (Traditional Print Run). ..60
Table 25: Blocking test final results (Traditional Print Run). .........................................61
Table 26: Offsetting test results (Traditional Print Run). ................................................61
Table 27: Acceptance decision summary for offsetting test (Traditional Print Run). ......62
Table 28: Type of offsetting (Traditional Print Run). .....................................................62
Table 29: Offsetting test final results (Traditional Print Run). ........................................64
Table 30: Adhesion test results (Traditional Print Run)..................................................64
Table 31: Traditional print run tests results. ...................................................................66
Table 32: Traditional print run final results....................................................................66
Table 33: Main print runs test results. ............................................................................70
ix
List of Figures
Figure 1: Shrink Rates Graph...........................................................................................7
Figure 2: PVC Shrink Curve..........................................................................................22
Figure 3: Press Form. ....................................................................................................24
Figure 4: An inverse bar flips the web during the printing operation. .............................28
Figure 5: Samples are cut at the delivery section of the Mark Andy 4150 press..............29
Figure 6: Pallet containing printed rolls, make ready waste and unprinted substrate. ......29
Figure 7: Samples are cut and placed in their proper position to perform the blocking and
offsetting test. ................................................................................................31
Figure 8: Pressure is applied to the samples during the blocking and offsetting test. ......32
Figure 9: An X-Rite 530 spectrodensitometer is used to measure the amount of ink
detachment during the adhesion test...............................................................33
Figure 10: Steam cleaner used to perform the re-wetting test. ........................................36
Figure 11: A steam cleaner is used to shrink a label during the re-wetting test. ..............36
Figure 12: Sleeve labels are placed over the containers before the shrinkage process. ....37
Figure 13: Sleeve labels after the shrinkage process during the re-wetting test. ..............37
Figure 14: Normal distribution curve. ............................................................................39
Figure 15: Sample presenting “ink to ink” offsetting (Corona Print Run). ......................47
Figure 16: Percentage of accepted samples from the adhesion test (Corona Print Run). .51
Figure 17: Ink detachment after adhesion test is performed (Corona Print Run). ............52
Figure 18: Percentage of accepted samples from the adhesion and the re-wetting test. ...55
x
Figure 19: Ink on shrunken label is affected after steam is applied during the re-wetting
test ...............................................................................................................55
Figure 20: “Ink to back” offsetting (Traditional Print Run) ............................................63
Figure 21: Ink detachment after adhesion test is performed............................................65
xi
Abstract
Printing shrink labels with waterbased flexographic inks require a great deal of
attention from the press operator. Lack of heat from the dryers can cause drying related
problems, while an increase in the dryer temperature can shrink the material. Some press
manufacturers recommend presses that are equipped with powerful dryers and expensive
chill roll systems. Manufacturers also suggest the use of a corona treatment unit to
improve ink adhesion. Newcomers, that do not wish to invest in new presses and
equipment of this kind, struggle with finding a proper combination of press speed and
dryer settings that may offer acceptable print results.
The main objective of this research project was to establish an optimal press
speed for a conventional flexographic printing technique that could output acceptable
printing products for heat sensitive materials. To accomplish the research objective, a
series of shrink film samples were evaluated from two main flexographic print runs. One
run was performed using a corona treatment unit and another one without corona
treatment. These print runs were executed using waterbased inks on a shrinkable film.
Each run was divided into six press speed segments. For each segment, the press was set
at a different speed. Following the print operation, a series of tests were conducted to
determine the press speed boundaries that were best suited for printing without affecting
xii
the performance of the shrink film or inks. Samples were evaluated by employing an
adhesion test, re-wetting test, shrinkage test, a blocking test and an offsetting test.
Tests performed during the course of this research project established that shrink
labels could be printed on a conventional waterbased flexographic press as long as the
press uses corona treatment and that the maximum press speed does not exceed 150 feet
per minute. Printing shrink films without corona treatment should not be performed since
ink adhesion fails at all press speeds and blocking and offsetting issues are visible when
press speed reaches 150 feet per minute.
1
Chapter 1
Introduction and Problem Statement
Shrink labels are among the fastest growing trends in the packaging industry. This
growth has resulted in more printers finding their way into this market. This remarkable
trend encouraged the researcher to perform a study on shrink label printing. The
researcher was specifically interested in understanding the technical requirements that
were needed in order to achieve successful results when printing over this special
substrate.
During the printing operation, converters have to deal with the thermal sensibility
of shrinkable substrates to obtain proper printing results. An increase in temperature or
air volume of the heat dryers may result in premature shrinkage of the material during the
printing operation. Because of this, newcomers must decide whether or not to invest in
new presses designed for this kind of application. Press manufacturers promote expensive
printing presses with powerful dryers that are equipped with chill roll systems specially
designed to balance the heat of the web. Despite all the help this equipment provides, a
proper combination of press speed and dryer settings may also offer acceptable results.
The following is a thesis study that focused on the variables affecting the drying
of waterbase inks and the dimensional stability of a shrinkable substrate, when printing
shrink labels on a conventional flexographic press. The researcher performed multiple
tests on a series of printed samples in order to establish an optimal press speed that would
2
output acceptable printed product for heat sensitive materials when using a conventional
flexographic press.
This thesis begins with an introduction of the problem under study, followed by a
comprehensive review of the literature concerning shrink labels. Next, the researcher
states the research objective of the study and a complete description of the methodology
that was employed. To conclude, a complete description of the results obtained is offered
followed by a final conclusion. All the references used in this study are listed at the final
section of the document.
3
Chapter 2
Literature Review
A Growing Market
Shrink sleeve labels are considered the ideal format for decorating strategies. In 2002,
this market represented a $210 million business in the U.S. (Moran, 2003). Some
estimate a market that could reach $415 million in sales by 2007 (Keith, 2004),
experiencing a 20 percent annual growth rate (Sharon, 2003). Others project a more
conservative, but also optimistic, seven percent annual growth rate (Gates, 2002).
In the last few years, shrink sleeve labels started to overtake markets, even though
the first ones were reported in 1967 (Hall, 1999). Sleeves represent a wide range of new
possibilities and advantages for packaging. A 360-degree billboard can be accomplished
by using the packaging to amplify the product presence on the shelf (Behar, 2001).
Sleeves can also be valuable by extending the label over the closure, adding an extra
degree of tamper-proof protection (Leaversuch, 2002). They can even diminish breakage
problems by protecting the container against shattering (Wingate, 2004).
Principle Of Shrink Films
Thermoplastic polymer chains have a random chain structure. As thermoplastics are
stretched during the manufacturing process, their molecules are ordered and oriented in
the same direction. Throughout this process, they are heated to preserve dimensional
characteristics and memory before they are cooled down (Wingate, 2004). Upon
4
reheating during the shrinkage process, the film attempts to regain its original dimension
(Kelsey, 1989). This is the principle of shrink films.
Shrink Sleeves vs. Roll-On-Shrink-On
The shrink label industry can be divided into two groups, shrink sleeve labels and wrap-
around labels. They differ in the orientation of their substrate. Shrink films can be
oriented in the machine direction (MD) or in the transverse-direction (TD). Films
oriented in the machine direction are used for wrap-around shrink labels. Films oriented
in the transverse direction are used for shrink sleeve label applications (Brown, 2004a).
Wrap-around labels, also known as Roll-On-Shrink-On, enfold around the bottle
and are sealed with a hot-melt adhesive before they enter a heat tunnel (Genuario, 2004).
Shrink sleeve labels, on the other hand, are formed into a tube using solvent adhesive and
are then placed over the bottle before heat is applied (Gates, 2002). Besides their labeling
method, shrink labels also differ in their shrinkage rate. Wrap-around labels can only
shrink up to 22 percent, while sleeves can shrink up to 80 percent depending on the
substrate (Leaversuch, 2002).
Types of Substrates
Converters and customers must decide which substrate is best suited for their labels. All
film materials are not the same. They differ primarily in shrink capabilities and
environmental friendliness (Behar, 2001). The main shrink materials used in the industry
are polyvinyl chloride (PVC), glycol-modified polyethylene (PETG), oriented
5
polystyrene (OPS) and oriented polypropylene (OPP). The last one is used for roll-on
wrap-around shrink labels only (Sharon, 2003).
PVC
Controlling 75 percent of the market, PVC is the dominant substrate used for shrink
labels. Its lower costs and high shrinkability make it an attractive option. However, other
substrates with comparable characteristics to those of PVC are also important players in
the market (Sharon, 2003). Some of the advantages of PVC over other substrates are its
low economic cost, good printability surface, easy seaming characteristics, low shrink
force and slow shrink curve. Its shrinkage rate can be considered a disadvantage, since
other substrates can acquire greater rates even though PVC can shrink up to 64 percent
(Mullen, 2004). The greatest disadvantage of PVC is its disapproval among
environmentalists. Chlorine gas emission into the atmosphere upon incineration has been
an important concern (Genuario, 2004). Another concern is related to separation of a
PVC label from a PET container. Since they have almost the same specific gravity, they
are not easy to divide. One part of PVC in a million parts of PET can be a very
contaminating formula (Behar, 2001). This discussion has lead to the growth of
alternative materials that are more environmentally friendly and also offer great benefits
(Genuario, 2004).
6
PETG
PETG can shrink up to 80 percent and it is considered an environmentally friendly
substrate (Alfaro, 2004). Its higher cost, however, has kept it from capturing more than
25 percent of the market (Behar, 2001). Some advantages of PETG are its good
printability surface, high shrinkability and high stiffness (Mullen, 2004). PETG also
displays a lower-temperature shrink initiation than other substrates. This allows a faster
labeling application because its shrink performance will be more predictable
(Leaversuch, 2002). On the other hand, PETG suffers from a high shrink force and is
tougher to cut and seam than other materials (Mullen, 2004).
OPS
OPS is a lot more popular in Asia than it is in North America. It controls only 5 percent
of the shrink film market in North America, while in Japan, it accounts for 70 percent of
the market (Wingate, 2004). Its success in Asian markets is attributed to its
environmental properties and good shrinkage ratios. It is expected that this success will
be emulated in North American markets in the near future (Sharon, 2003). An important
quality of OPS is that its shrink curve has a gentle slope, which allows a smoother
shrinkage transition (Genuario, 2004). Other good qualities of OPS are its low cost (less
than PETG), high transparency, good impact strength and low density compared to PVC
and PETG (Wingate, 2004). OPS is, however, very unstable. It suffers from natural
shrinkage even at room temperatures. This characteristic makes this substrate much more
volatile than PVC or PETG (Genuario, 2004). Its environmental friendliness is also
7
questionable. Very recently, Europe's PET Recycling Trade Association (Petcore) asked
bottlers to stop using oriented polystyrene (OPS) in their shrink sleeve labels because the
material has been obstructing recycling systems (Defosse, 2004).
OPP
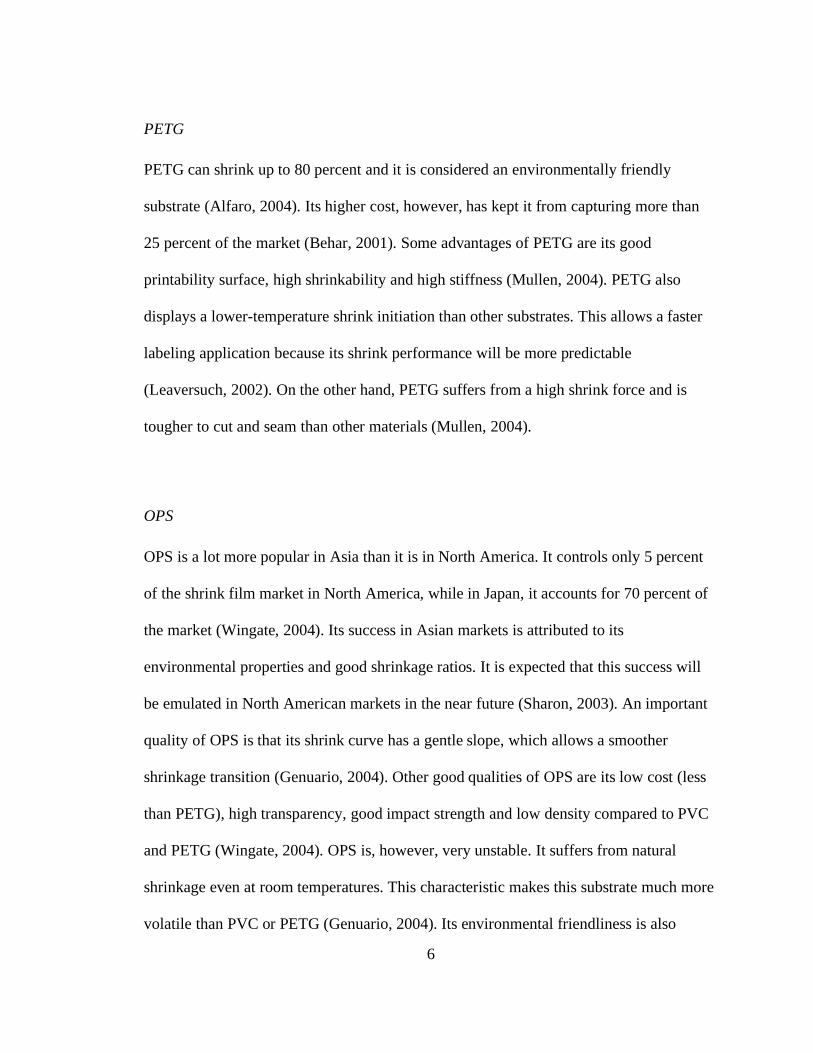
OPP is a low-cost alternative, but offers a limited low shrink capability of only 25
percent. The use of OPP is limited to containers that are less challenging in shape.
Because of its low shrinkability, OPP film is used for wrap-around shrink labels only
(Sharon 2003). Since this type of label involves one less converting operation than shrink
sleeves, cost issues could favor OPP shrink labels in the future (Leaversuch, 2002).
Figure 1 describes the shrinkage properties of the four substrates (Brown, 2004b):
Figure 1: Shrink Rates Graph.
Printing Process
Shrink labels can be printed with gravure, flexography (Gates, 2002) or even digital
printing (Forcino, 2002). Gravure is the printing process that dominates shrink-sleeve
production (Gates, 2002). Big brands that demand longer printing jobs, use gravure
8
printers to supply their high demand jobs (Sharon, 2004). However, Flexo printers are a
good fit for shorter runs (Brown, 2004a). The employment of high-definition
flexographic presses has revealed that flexography can offer a level of quality that can
compete with gravure (Gates, 2002). Digital presses, on the other hand, are used in the
industry to make proofs that help ensure graphics will shrink as expected (Forcino, 2002).
Digital presses are also used to print very short runs of shrink sleeve labels (Alfaro,
2004). Digital printers have found a niche that focuses on short runs as small as five
hundred shrink labels that may also be outputted using variable data on their design
(Genuario, 2004).
Printing Technique
Sleeve labels are generally reverse-printed so that the ink is on the inside of the finished
tube. This printing method protects the ink during the converting and labeling process
(Grates, 2002).
Shrink films require special attention to the amount of heat applied to the
substrate during printing. Excess in the applied temperature may prematurely shrink the
substrate. Unwanted shrinkage of the substrate may prevent the label from slipping over
the bottle during the labeling operation (Genuario, 2004). At the same time, low heat
temperatures during printing may cause important drying issues. Printers need to have a
balance between temperature and printing conditions to achieve desired results (Sharon,
2004).
9
Inks for Shrink Labels
Shrink labels require the use of inks specially formulated for this application. Label
printers cannot use the same inks used to print on pressure-sensitive substrates (Gates,
2002).
The most important challenge of using these inks is that they must be flexible
enough to withstand the shrinkage process. If not, the ink could crack or break when the
substrate shrinks (Genuario, 2004). In addition to flexibility, inks need to dry quickly
under low heat from the dryers, have improved adhesion, and be heat resistant. Because
heat is involved in the process, these inks need to be formulated with pigments that won't
change color or fade when heat is applied (Sharon, 2004). The printer also has to consider
other important factors such as the container material, bottle-blocking resistance, scuff
resistance and a high level of opacity of the white ink (George, 2004).
There are currently four types of inks available for the shrink label market.
Solvent-based inks have the highest demand in the market, followed by waterbased inks.
UV cationic inks are also available, but have not had great success because of their high
cost (Sharon, 2004). UV free radical inks are now available with excellent printing
results, good shrink resistance and low economic costs (Kilbo, 2004).
Among all the requirements mentioned above, the shrinkage rate is one of the
most significant. Waterbase and UV free radical inks are intended for medium to low
shrink applications, as they can only shrink up to 60 percent. For high shrink operations,
UV cationic and solvent-based inks are a better option, given that they can shrink up to
75 percent (Sharon, 2004).
10
Converting Process
There are basically four operations a converter may perform after printing shrink sleeve
labels. They are slitting, seaming, inspecting and cutting.
Slitting is usually a required operation after printing. A slitter may be used to
discard unwanted edges on the film. It will also split the roll when labels are printed more
than one-across on the web (Gates, 2002).
Seaming is an operation in which the film is formed into a sleeve or tube.
Seaming machines wrap the substrate around a forming plate and apply a precise amount
of solvent to the substrate (Matos, 2004). The solvent solution softens the film molecules
which makes the actual film work as an adhesive. When the film comes together on the
seaming machine, the film molecules are pressed together to form a fused bond
(Machleder, 2004). To apply the solvent, seaming machines may use a wick system or a
more precise direct injection system (Matos, 2004).
Inspecting is done to detect any possible seaming defects. It is done by inflating
the seamed roll with air and then inspecting the tube for open seams. Inspecting machines
may also include continuous perforation capabilities and a stroboscopic light system for
inspecting print quality (Matos, 2004).
Cutting is used when the labels are manually applied to the container. A cutting
machine slices the seamed tube into separate labels. These machines can also perform
continuous perforations (Ryback, 2004). After the converting process is performed, the
labels are ready to be applied.
11
Label Application
Shrink sleeve and wrap-around shrink labels are applied very differently. Sleeve labels
are supplied on a roll that is mounted on the labeling equipment. The machine uses a
conveyor to transfer bottles into the labeling section for sleeve application (Mans, 2002).
The sleeve is opened using a mandrel and then is cut (Niemuth, 2004). Each piece is then
positioned around the container to which the label is to be shrunk. Once the label is in
place, the bottles enter a shrink tunnel where heat is applied. High temperatures in the
tunnel mold the label to the shape of the bottle (Gates, 2002). Depending on the system,
shrink tunnels may apply heat using hot air or steam (George, 2004).
An important issue has been observed when using steam tunnels on labels printed
with waterbase ink. Labels that have been printed using waterbase inks have the risk of
re-wetting when they are exposed to steam (Genuario, 2004).
Roll-on-shrink-on labels can usually be applied with existing labeling equipment.
This poses an important advantage when compared to sleeve labels (Behar, 2001). Roll-
on-shrink-on labels are applied by gluing the leading edge and trailing edge of the label.
They are glued with adhesive or welded together with solvent. After the label is secured,
heat is applied (Genuario, 2004).
Important discussions have risen about the adhesives used in roll-fed applications.
They can loosen when exposed to temperatures in heat tunnels (Behar, 2001). Solvents
are also questioned because they suffer compatibility issues with polypropylene
substrates (Genuario, 2004).
12
Flexography
As mentioned before, shrink labels can be printed with a great variety of printing
processes. For this study, the researcher will focus on the variables affecting shrink label
printing when employing waterbase flexography as the printing process of choice.
Printing Process
Flexography is defined as a rotary relief printing process (Fairley, 2004). The
flexographic printing process consists of an ink fountain pan that supplies ink to a rubber
ink fountain roll. The fountain roll delivers ink to an ink-metering roll called an anilox
roll. The anilox roll is a cylinder that is covered with tiny engraved cells. Its purpose is to
transfer a precise amount of ink onto the printing plate. After the ink is transferred, the
printing plate and the impression cylinder form a nip where the ink is applied onto the
substrate (Flexography: Principles and Practices, 1999).
Environmental Inks and Coatings, one of the most important suppliers of inks for
shrink label applications, provided some knowledge regarding the type of anilox that is
better suited for shrink film printing. In their technical bulletins, they recommend the use
of an anilox between 360 lines and 1,000 lines, depending on the type of images that are
to be printed.
13
Drying Process
Flexographic presses use between-color deck dryers to dry the ink. Dryers apply hot air
to remove enough volatiles from the ink so that each print station can apply another color
without altering the previous one (Schollmeyer, 2003). Hot air is directed to the web
where the substrate, ink solids, and ink solvents are raised to a temperature that causes
volatilization (Flexography: Principles and Practices, 1999). A dryer applies energy in the
form of British Thermal Units (BTU) to the web. In response to the applied energy, the
solvent evaporates and the ink dries (Linsky, 1977). Nevertheless, the amount of solvent
in the ink influences greatly in the effectiveness of the dryers. Opaque inks will dry faster
than transparent inks because they have less solvent and more solid components.
Transparent inks have more solvent that needs to evaporate (Narrow Web Printing By
Flexography, 1973).
There are four factors that determine the performance of a dryer: air temperature,
air velocity, air volume and time. The higher the temperature, the quicker the ink will
dry. At the same time, high temperatures can cause serious damage to the substrate. The
greater the velocity and volume of hot air directed to the web, the faster the volatile ink
components will evaporate. Additional evaporation is assisted by the dryer’s moving air,
which carries the volatile components away (Flexography: Principles and Practices,
1999).
Dryer nozzles may operate at a velocity range of 3,000 to 15,000 feet per minute.
The use of high velocities will depend on the substrate that will be printed. Lightweight
materials may distort if high velocity air is applied. The dryer nozzles’ location is also
14
important. The closer hot air can be applied to the substrate, the better the transfer of heat
and mass will be to the web. If the nozzles are located at half an inch or more away from
the substrate, then some energy may be wasted (Linsky, 1977).
The amount of time a substrate is directly exposed to the dryer is also significant
in the drying process. The dryer length and the press linear speed determine the
exposition time. A proper combination of air velocity, air volume, air temperature and
time, will allow for accurate drying of the ink (Flexography: Principles and Practices,
1999).
Chill Rolls
Chill rolls may be used in flexographic operations to compensate for high temperatures of
the dryers when printing heat sensitive substrates (Fairley, 2004). The chill roll becomes
part of the press drying system. As a consequence, heat is drained off at the point where it
was introduced. The success of the chill roll will depend on the amount of time the
substrate is exposed to the chill roll. This time will be determined by the diameter of the
roll itself (Shaping The Future Of Packaging, 2000).
Printing Problems
A printer can experience multiple problems during the printing operation. To avoid these
problems, the operator should monitor ink characteristics such as pH level, ink viscosity
or adhesion properties. The substrate’s surface tension can also have an important effect
on the printing outcome.
15
Low Adhesion
Adhesion refers to the attribute of an ink to properly bond to the surface of a substrate.
Low adhesion problems are especially common on non-absorbent substrates such as the
ones used in shrink label printing (Flexographic Ink: A Process Approach, 1998). The
adhesion of flexographic inks is primarily affected by the formulation of the ink, the
surface of the substrate and press conditions (Bisset, 1979).
Printers and ink manufacturers have to work together to properly formulate an ink
system that is compatible with the printer’s substrate. At the same time, the printer must
also monitor the quality and characteristics of the substrate before running the press
(Flexographic Ink: A Process Approach, 1998).
Proper press conditions are, of course, critical for good ink adhesion. Adhesion
may improve during printing by increasing the temperature and air volume of the dryers
(Bisset, 1979).
Adhesion is commonly measured using the pressure-sensitive tape adhesion test.
This test evaluates the bond of the ink to the printed substrate, compared to the bond of
the ink to the pressure-sensitive tape (Flexography: Principles and Practices, 1999).
Blocking
Blocking occurs when there is an undesired adhesion between two surfaces. When this
occurs, ink is transferred to the opposite side of the substrate on which it was printed
(offsetting). This problem is not usually detected until the roll is re-reeled. The main
16
factors that can cause blocking are improper drying, excessive roll pressures and high
temperatures of the web at rewind. The last one can be avoided by using a chill roll on
the press before rewind (Flexographic Ink: A Process Approach, 1998).
There are many tests available to detect blocking. Many of them apply pressure to
printed samples for a number of hours. Then the samples are inspected for any evidence
of blocking or offsetting (Flexography: Principles and Practices, 1980).
Surface Tension
In the printing industry, surface tension refers to the property of a substrate regarding
how receptive it is to accepting printing inks (Flexography: Principles and Practices,
1999). A molecule that is located in the middle of a solid or liquid substance will be
pulled in different directions at the same time. This will cause the molecule to be unable
to move in any direction. The potential energy produced in this process is called surface
energy. The force willing to contract the surface area is the surface tension (Bisset, 1979).
Surface tension is measured in dynes per square centimeter. The dyne level can be
measured using a dyne solution or more conveniently, using a dyne pen (Wolf, 2001). To
obtain proper adhesion, the dyne level of a substrate should be ten dynes/cm2 higher than
the dyne level of the ink. If the desired surface tension level is not met, the converter can
proceed to treat the surface of the substrate with a corona treatment (Stobbe, 1999).
A corona treatment alters the surface molecules of a substrate, increasing its
energy level. This occurs when the corona-treating unit discharges high-voltage
electricity separating oxygen molecules into their atomic form. The oxygen atoms are
17
able to alter the chemical nature of the substrate when linking with the polymer chains.
This process allows the ink to form a chemical bond with the substrate surface (Stobbe,
1999).
The recommended dyne level for a shrinkable PVC substrate is between 36 and
38 dynes per square centimeter. For a PETG substrate it is between 42 and 44 dynes per
square centimeter. Shrink film suppliers recommend the use of corona treatment
especially when the printer will use waterbase inks (Mullen, 2004).
Ink pH
The pH value is the degree of acidity or alkalinity of a substance (Flexography: Principles
and Practices, 1999). The degree of water tolerance of an ink depends on its pH value.
And the level of pH itself will depend on how much alkali additive was used in that
specific ink (Todd, 1994). Controlling the pH level of the ink is essential when printing
with waterbase inks (Flexography: Principles and Practices, 1999).
Since printing inks are colored substance, their pH value cannot be measured
using a traditional paper or liquid pH indicator. A pH meter must be used instead (Todd,
1994). The level of pH is measured on a scale from zero to fourteen. A pH value in the
range between zero and seven is considered acid, and between seven and fourteen is
considered alkaline. The alkalinity or acidity of a waterbase ink may cause important
effects during printing. A pH between six and seven may cause high viscosity of the ink
and poor printability. Between seven and eight the ink may become too unstable causing
low viscosity, dirty printing and buildup on the plate and anilox rolls. A pH level between
18
eight and nine point five should bring good flow characteristics. Achieving this level will
result in good printability, good adhesion and ideal wet-out properties. Finally, a pH
level between 9.5 and 11 may cause important pigment deterioration, excessive foam and
low water resistance properties (Flexographic Ink: A Process Approach, 1998).
Ink Viscosity
Viscosity refers to the property of a substance to flow under the influence of mechanical
stress (Kipphan, 2001). The viscosity of an ink can impact many aspects of the printing
result. It can affect the print strength, print sharpness, ink lay and the achieved color. Low
viscosity can result in excessive dot gain, causing the printed image to lose its sharpness.
High viscosity may produce dirty printing and problems related to the ink not transferring
properly from the plate to the substrate. Changes in viscosity levels can result in
alterations of the shades of colors. A red color can become more yellow if viscosity is
high, while it can get bluer if it is low (Flexography: Principles and Practices, 1999).
It is important to note that high viscosity in waterbase inks does not necessarily
mean a low pH, but a low pH will always result in high viscosity. Before altering the
viscosity on a press with an extender, the printer should always check the pH level first
(Flexographic Ink: A Process Approach, 1998).
Temperature and thixotropy also has an important effect on viscosity. Viscosity
measurements taken when the ink is cool, may result in higher values than those recorded
when the press is warm and running (Flexography: Principles and Practices, 1999).

19
Ink viscosity can be measured using a Zahn cup. This method consists of
recording the time when the flow of the ink breaks as it is released from the cup (Todd,
1994). Ink viscosity can also be measured using a shell cup or a viscometer
(Flexography: Principles and Practices, 1999).
20
Chapter 3
Research Objective
The objective of this research project can be stated as follows:
Establish an optimal press speed for a conventional flexographic printing technique
that will yield at least 95% acceptable product for heat sensitive materials.
Actual industry printers suggested an acceptance criterion of 95% as an
appropriate quality acceptance measure for this project. 95% acceptable product was
considered the cut-off point before portraying a press run as unacceptable.
The accomplishment of this objective will provide valuable information for shrink
label printers. These conclusions may help converters identify a maximum press speed
that will allow the printing of shrink films on a conventional press without experiencing
shrinkage or drying related issues.
To try to accomplish the research objective, a series of samples were evaluated
employing a set of laboratory tests. Test results for each of the samples were evaluated
using a quality acceptance criterion. This criterion established if a sample could be
considered an acceptable product. If a given press speed presented evidence of failing at
least one of the quality tests, the entire press speed was considered rejected.
The following chapter portrays detailed information of the tests employed and the
scoring system that was used for data analysis.
21
Chapter 4
Methodology
Methodology Overview
A series of shrink film samples were evaluated from two main flexographic print runs.
One run was performed using a corona treatment unit (from now on referred to as the
“Corona Print Run”) and another one without corona treatment (referred to as the
“Traditional Print Run”). These print runs were executed using waterbased inks on a
shrinkable film. Each run was divided into six press speed segments. For each segment,
the press was set at a different speed. Following the print operation, a series of tests were
conducted to determine the press speed boundaries that were best suited for printing
without affecting the performance of the shrink film or inks.
Equipment and Supplies Specification
A Mark Andy 4150 press was used to perform the press run. This press was located in the
Printing Application Laboratory at the Rochester Institute of Technology. The press
allows for up to 20-inch wide substrates and supports a 40-inch maximum roll diameter.
The press can use core sizes of three or six inches. The Mark Andy 4150 can run at
speeds ranging from 50 to 500 fpm (feet per minute). The dryers can be set at a maximum
temperature of 120 degrees Fahrenheit. The heating length of each of the dryers is 27
inches.
22
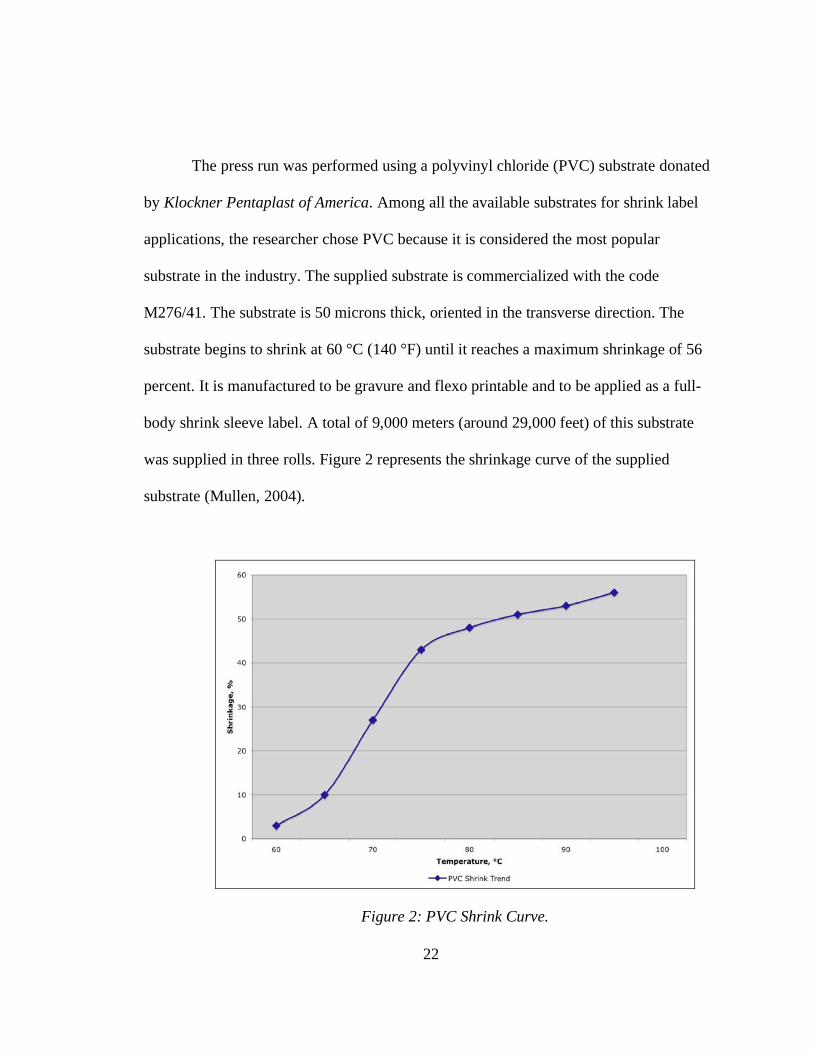
The press run was performed using a polyvinyl chloride (PVC) substrate donated
by Klockner Pentaplast of America. Among all the available substrates for shrink label
applications, the researcher chose PVC because it is considered the most popular
substrate in the industry. The supplied substrate is commercialized with the code
M276/41. The substrate is 50 microns thick, oriented in the transverse direction. The
substrate begins to shrink at 60 °C (140 °F) until it reaches a maximum shrinkage of 56
percent. It is manufactured to be gravure and flexo printable and to be applied as a full-
body shrink sleeve label. A total of 9,000 meters (around 29,000 feet) of this substrate
was supplied in three rolls. Figure 2 represents the shrinkage curve of the supplied
substrate (Mullen, 2004).
Figure 2: PVC Shrink Curve.
23
The researcher used a set of waterbased inks specially formulated for shrink film
printing. Environmental Inks and Coatings donated the inks used for this trial. The ink
system used was called Aqua HS System. The cyan inks used for the press run was
identified by the code HSX05200, the yellow ink by HSX05310, the magenta ink by
HSX05530, the black ink by HSX05900 and the opaque white ink by EH070290.
Recommended pH values for this system were between 9.1 and 9.2. Recommended
viscosity ranges were between 17 and 19 (Zahn cup #3). The supplied amount of ink was
two gallons of CMYK and four gallons of opaque white.
24
Press Run and Sample Analysis Methodology
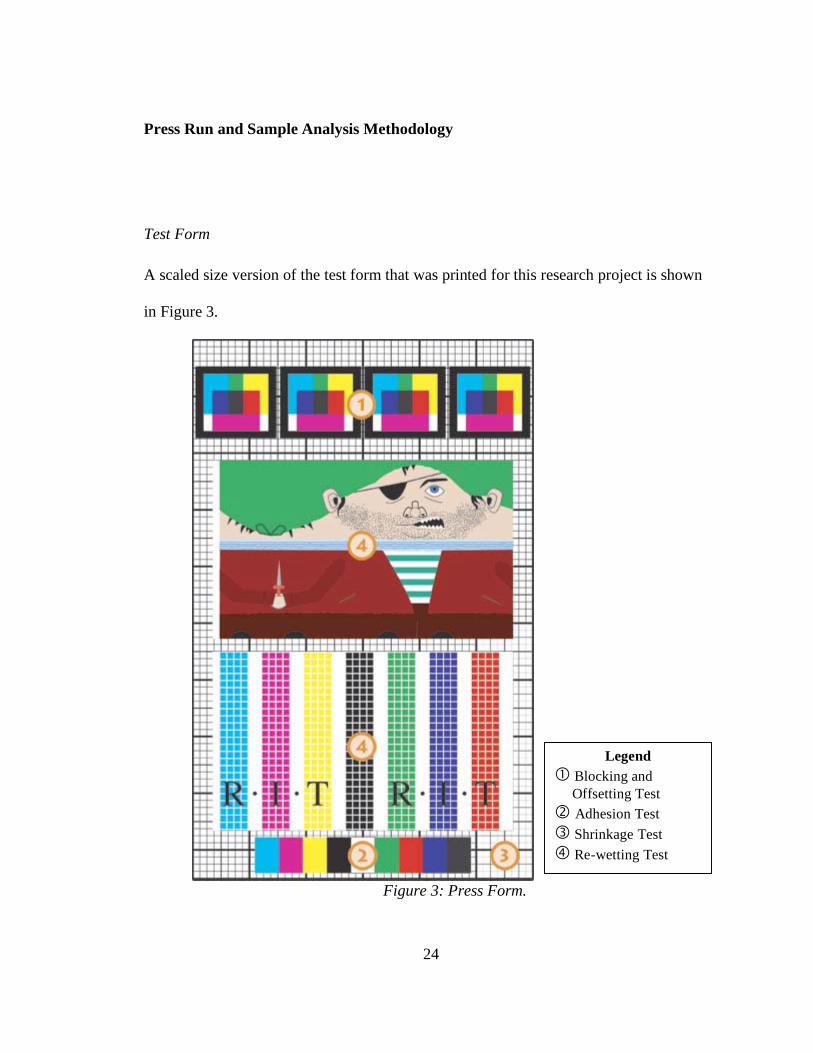
Test Form
A scaled size version of the test form that was printed for this research project is shown
in Figure 3.
Figure 3: Press Form.
Legend
Blocking and
Offsetting Test
Adhesion Test
Shrinkage Test
Re-wetting Test
25
The test form is 10 inches wide by 15 inches long. The numbers on the form are
there for informational purposes (they were not printed). Target number one was intended
for the blocking and offsetting test; number two for the adhesion test; number three
indicates the printed grid intended for the shrinkage test; and both images labeled with
the number four were for the re-wetting test.
The blocking and offsetting targets were designed to contain all CMYK colors
and their respective overprint colors. They share similar space in the target design. The
researcher intended to give equal opportunities for all ink colors to manifest blocking or
offsetting problems. The target displays an overlapping of solid color squares and a black
frame. Two white squares can also be visualized where no other ink color overlaps. The
target is repeated four times so it can be secured in different positions during the test.
The adhesion test target consists of a single row containing squares of all CMYK
colors and their overprints. The target also contains a square of opaque white. Squares are
organized in a row to allow the tape test to be applied to all colors at once. The squares
are designed to be wider than the size of the tape. This was intended to provide contrast
when the adhesion test is analyzed.
The shrinkage target is represented by a grid pattern that covers the test form. If
the substrate was to shrink during the print trial, the grid was intended to show unwanted
distortion. The grid is composed of a series of five millimeters squares. Some of the grid
lines are drawn with a wider thickness to allow better visualization.
The re-wetting test targets are composed of two shrink labels. The label in the
bottom contains seven grid-style columns printed with CYMK inks and RGB overprint.
26
The space between the columns is filled with opaque white ink. Each of the colors was
portrayed separately to allow a better understanding of how they were individually
affected by the re-wetting test. The top label portrays a full color image with multiple
overprints and color gradations. The purpose of this second label is to evaluate a target
with a printed image more similar to a commercialized label. A metric grid was used to
compensate for artwork distortions while designing this label. A detailed description of
all applied tests is offered in the following pages.
Physical Properties
Before starting the printing run, the researcher performed a series of tests to make sure
that the substrate and inks were delivered to specifications.
Surface Tension. The surface tension of the substrate was checked using an “Accu
Dyne Test” dyne pen kit. A series of dyne pens were drawn across the treated surface of
the substrate. The test establishes that if the liquid does not break into droplets after three
seconds, then the researcher may assume that the surface energy of the marker closely
matches the level of the substrate.
Ink Viscosity. The ink viscosity was checked using a Zahn cup #3. The researcher
recorded the time when the flow of the ink was broken as it was released from the cup.
The results were analyzed and cross-referenced with the technical information supplied
27
by the ink manufacturer. Environmental Inks and Coatings recommends a viscosity range
between 17 and 23 seconds when the ink is measured using a Zahn cup #3.
Ink pH. The pH level of the inks was also recorded before the press run. It was
checked using an electronic pH meter. The recommended pH value for the supplied ink
was between 9 and 9.3.
Press Run
The press was set for reverse printing. The ink fountains were loaded in the following
order: black, cyan, magenta, yellow and opaque white. The appropriate anilox rolls were
mounted for each of the color stations. An anilox of 800 line screens/inch was used for
the black ink, a 1000 line count anilox for the cyan ink, 900 for the magenta ink, 700 for
the yellow ink and 360 line screens/inch for the opaque white ink.
The printing was done on the underside of the substrate so the label could be
protected from any scratching during the labeling process. Since the last color down was
opaque white, the laying of this last ink would have obstructed the registration camera
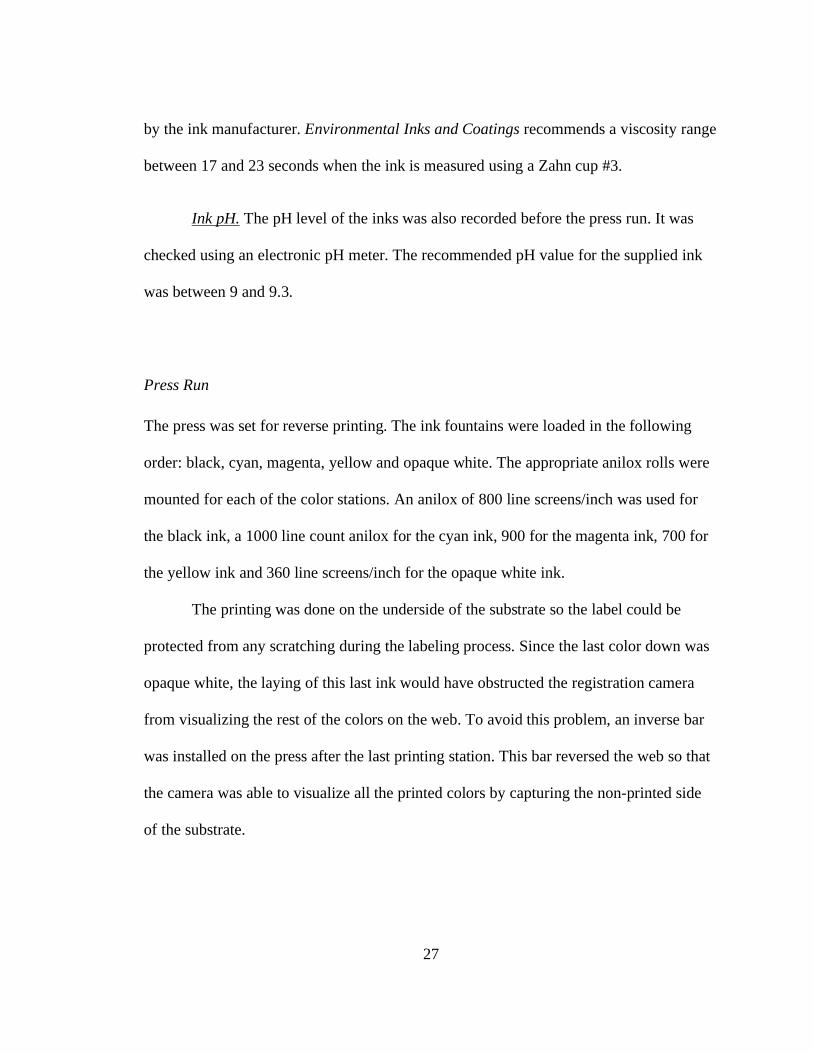
from visualizing the rest of the colors on the web. To avoid this problem, an inverse bar
was installed on the press after the last printing station. This bar reversed the web so that
the camera was able to visualize all the printed colors by capturing the non-printed side
of the substrate.
28
Figure 4: An inverse bar flips the web during the printing operation.
After all these adjustments were made, the press operator proceeded to run the
press for registration using an available film substrate (clear OPP). When registration
was achieved, a roll of PVC was loaded on the press. Before re-starting the press, the
corona treatment unit was set at a minimum level (around 0.42 kW) and dryers were set
at the maximum temperature of 120 degrees Fahrenheit.
The press started to run at a fixed speed of 50 feet per minute. This speed was
marked as speed number one. The press ran for 2000 feet at this fixed speed which
allowed for 1600 samples to be printed. The dryer’s temperature for each printing station
was recorded during the run.
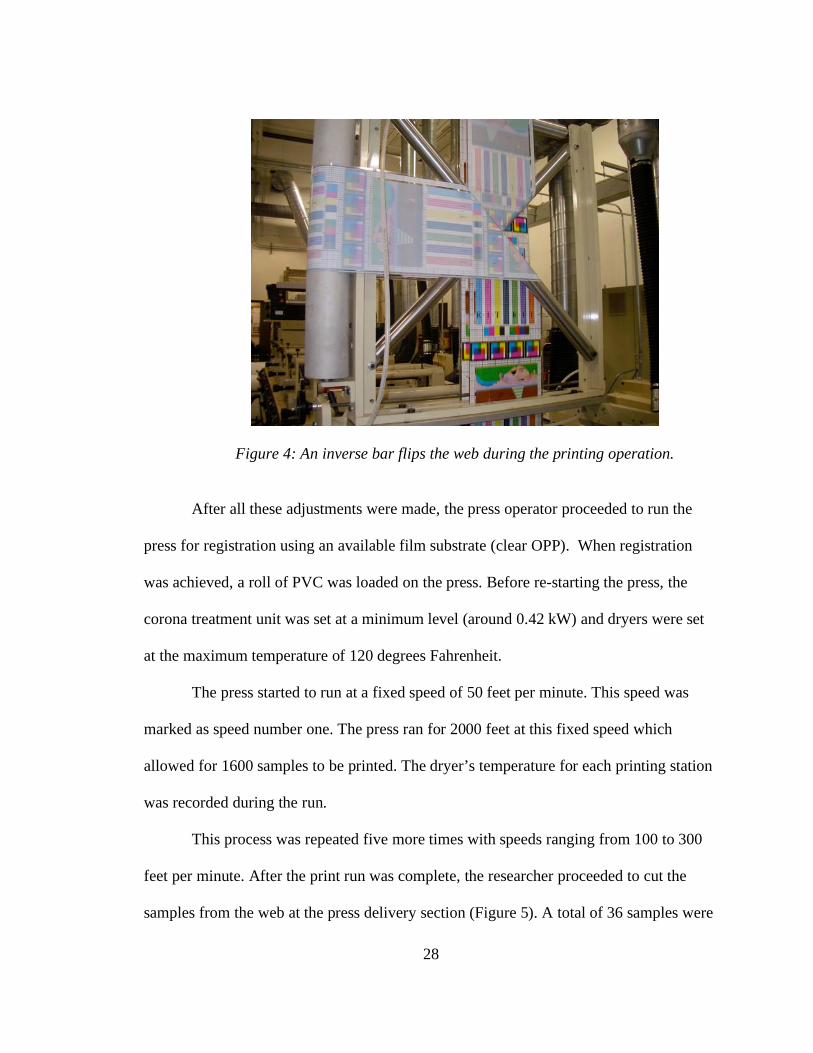
This process was repeated five more times with speeds ranging from 100 to 300
feet per minute. After the print run was complete, the researcher proceeded to cut the
samples from the web at the press delivery section (Figure 5). A total of 36 samples were
29
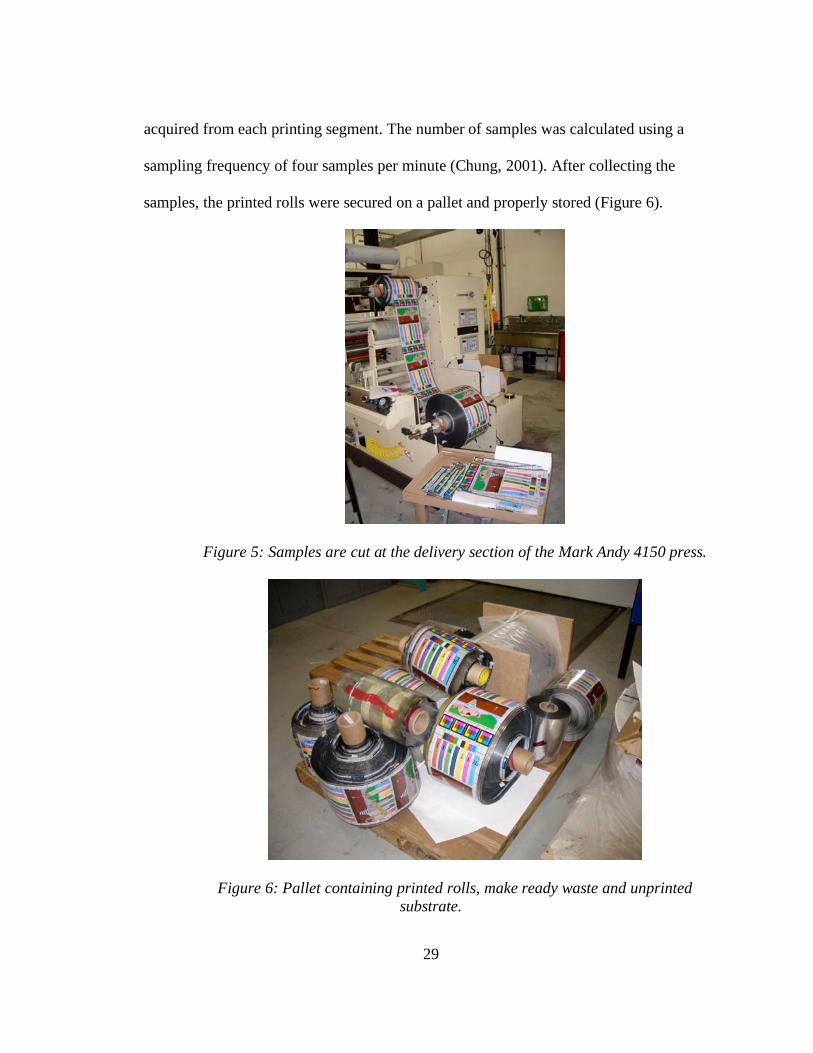
acquired from each printing segment. The number of samples was calculated using a
sampling frequency of four samples per minute (Chung, 2001). After collecting the
samples, the printed rolls were secured on a pallet and properly stored (Figure 6).
Figure 5: Samples are cut at the delivery section of the Mark Andy 4150 press.
Figure 6: Pallet containing printed rolls, make ready waste and unprinted
substrate.
30
Sample Analysis
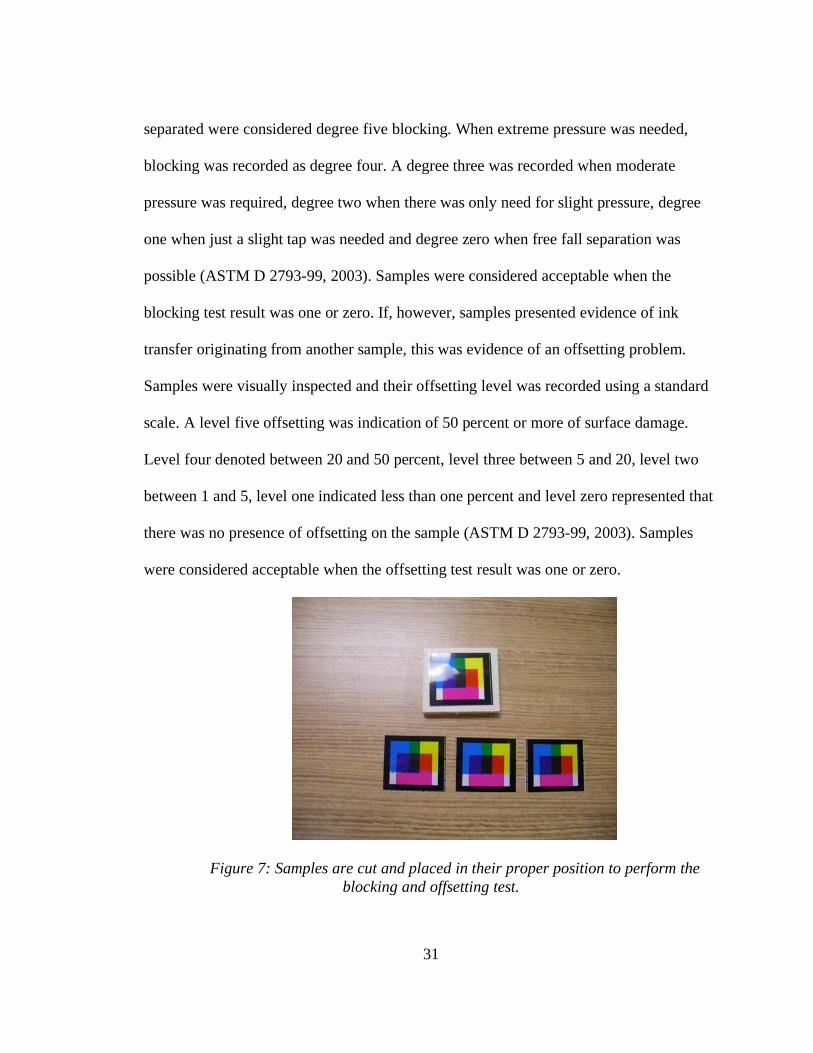
1) Blocking and Offsetting Test. The block resistance test was used to verify that
the printed substrate has the ability to separate from another surface without sticking or
affecting either substrates (offsetting) (Flexography: Principles and Practices, 1980). To
perform this test, each of the four blocking targets were cut and then placed in a proper
position to perform the following tests (Figure 7): “Ink to Ink” (printed side against
printed side), “Ink to Back” (printed side against unprinted side) and “Back to Back”
(unprinted side against unprinted side) (ASTM D 2793-99, 2003). All three tests simulate
the kind of friction a printed shrink label goes through during the printing, converting,
labeling and distribution process. During the printing process, the web is wound up and
the printed side of the substrate is in direct contact with the non-printed side. During the
converting process (and also in the labeling operation), the printed substrate experiences
ink-to-ink friction. This occurs because the label is seamed in the form of a tube. Finally,
after the label is applied, containers will experience friction between them during the
distribution operation. This friction occurs when there is contact between the unprinted
sides of the labels.
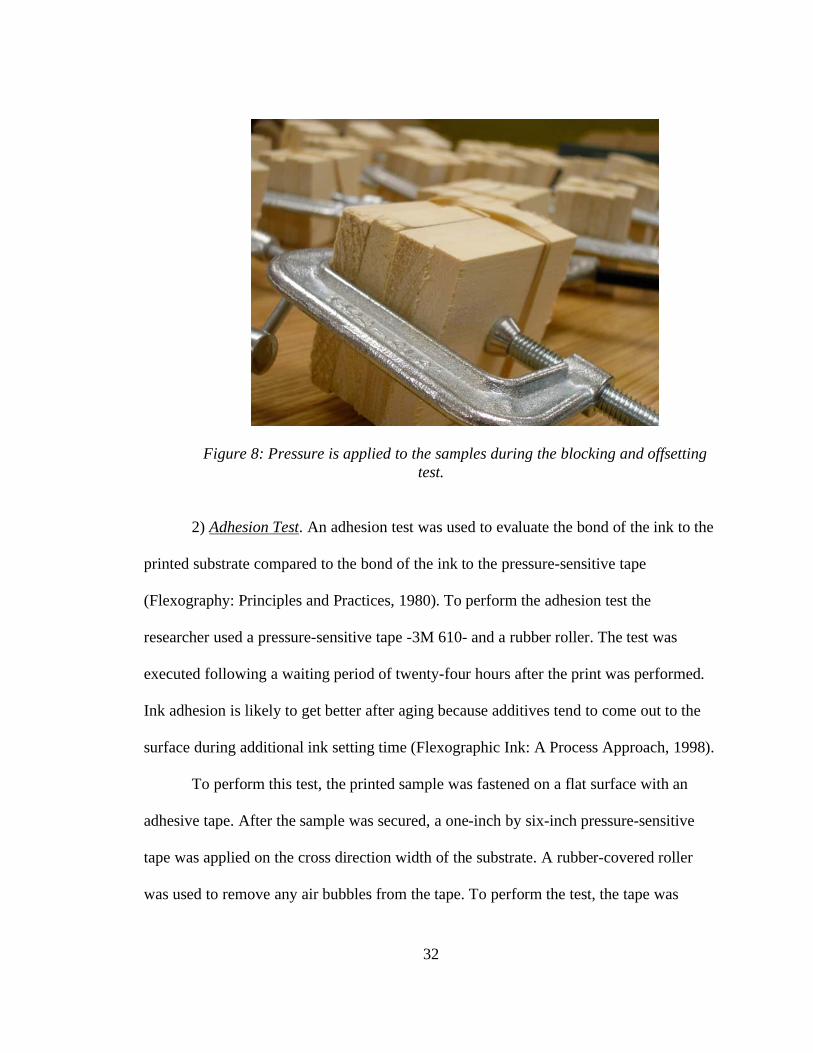
For this test, the samples were secured in a “C” clamp with a pressure between
five and ten pounds per square inch (Figure 8). Pressure was applied for 16 hours. After
this time, the samples were individually inspected. Evidence of samples adhering to each
other was recorded as an indication of blocking. Blocked samples that needed a tool to be
31
separated were considered degree five blocking. When extreme pressure was needed,
blocking was recorded as degree four. A degree three was recorded when moderate
pressure was required, degree two when there was only need for slight pressure, degree
one when just a slight tap was needed and degree zero when free fall separation was
possible (ASTM D 2793-99, 2003). Samples were considered acceptable when the
blocking test result was one or zero. If, however, samples presented evidence of ink
transfer originating from another sample, this was evidence of an offsetting problem.
Samples were visually inspected and their offsetting level was recorded using a standard
scale. A level five offsetting was indication of 50 percent or more of surface damage.
Level four denoted between 20 and 50 percent, level three between 5 and 20, level two
between 1 and 5, level one indicated less than one percent and level zero represented that
there was no presence of offsetting on the sample (ASTM D 2793-99, 2003). Samples
were considered acceptable when the offsetting test result was one or zero.
Figure 7: Samples are cut and placed in their proper position to perform the
blocking and offsetting test.
32
Figure 8: Pressure is applied to the samples during the blocking and offsetting
test.
2) Adhesion Test. An adhesion test was used to evaluate the bond of the ink to the
printed substrate compared to the bond of the ink to the pressure-sensitive tape
(Flexography: Principles and Practices, 1980). To perform the adhesion test the
researcher used a pressure-sensitive tape -3M 610- and a rubber roller. The test was
executed following a waiting period of twenty-four hours after the print was performed.
Ink adhesion is likely to get better after aging because additives tend to come out to the
surface during additional ink setting time (Flexographic Ink: A Process Approach, 1998).
To perform this test, the printed sample was fastened on a flat surface with an
adhesive tape. After the sample was secured, a one-inch by six-inch pressure-sensitive
tape was applied on the cross direction width of the substrate. A rubber-covered roller
was used to remove any air bubbles from the tape. To perform the test, the tape was
33
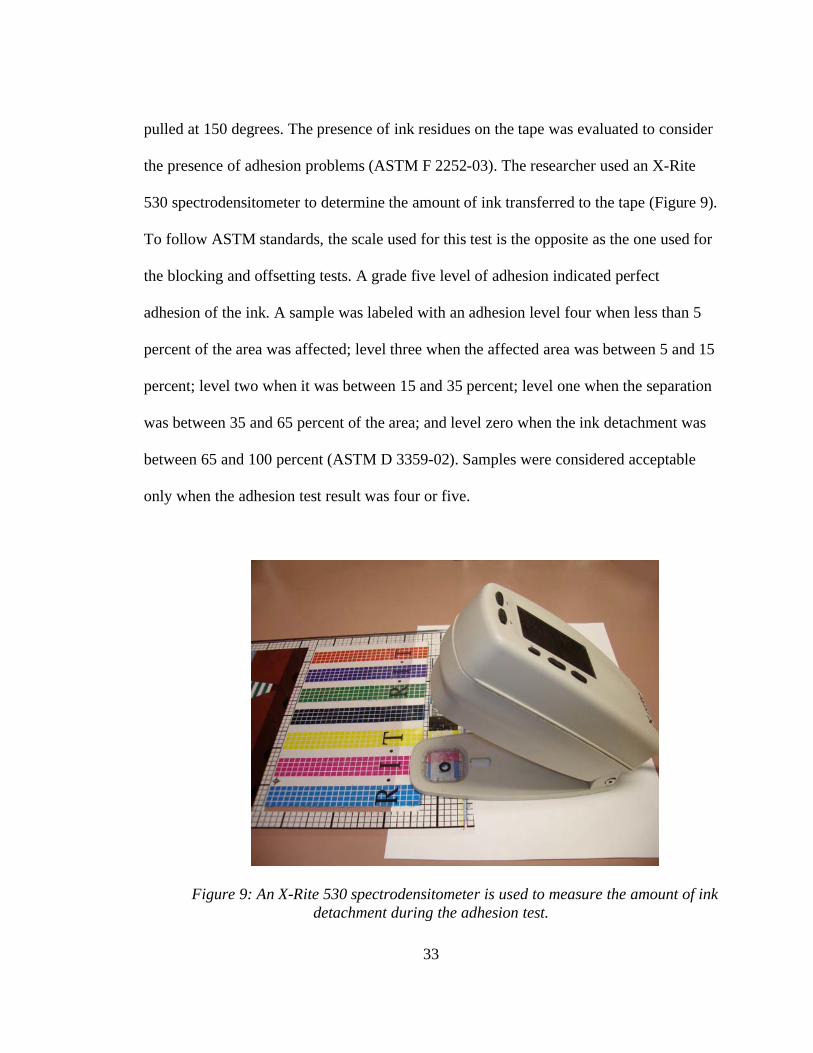
pulled at 150 degrees. The presence of ink residues on the tape was evaluated to consider
the presence of adhesion problems (ASTM F 2252-03). The researcher used an X-Rite
530 spectrodensitometer to determine the amount of ink transferred to the tape (Figure 9).
To follow ASTM standards, the scale used for this test is the opposite as the one used for
the blocking and offsetting tests. A grade five level of adhesion indicated perfect
adhesion of the ink. A sample was labeled with an adhesion level four when less than 5
percent of the area was affected; level three when the affected area was between 5 and 15
percent; level two when it was between 15 and 35 percent; level one when the separation
was between 35 and 65 percent of the area; and level zero when the ink detachment was
between 65 and 100 percent (ASTM D 3359-02). Samples were considered acceptable
only when the adhesion test result was four or five.
Figure 9: An X-Rite 530 spectrodensitometer is used to measure the amount of ink
detachment during the adhesion test.
34
3) Shrinkage Test. The shrinkage test was used to check if the substrate has
suffered from shrinkage or distortion caused by excessive heat during the printing
process. The size and shape of the squares on the printed grid were inspected for any
evidence of deformation. The squares were measured with a metric ruler and the
percentage of shrinkage (if any) was recorded. The level of shrinkage was recorded using
a scale from zero to one hundred percent. A shrinkage level five was an indication of 50
percent or more of substrate shrinkage. Level four denoted between 20 and 50 percent;
level three between 5 and 20; level two between 1 and 5; level one indicated less than 1
percent; and level zero represented that there was no substrate distortion. Additionally,
the printed substrate was also inspected for any evidence of excessive heat, such as burn
or melting marks. Samples were considered acceptable only when the shrinkage test
result was level zero (no shrinkage).
4) Re-wetting Test. A re-wetting test was performed by evaluating the resistance
of the printed ink to the effects of steam and correlating this result with the adhesion
properties of the ink. This test simulated the process in which a shrink label is applied to
a container using a steam shrink oven.
It is important to note that the ink supplier provides a coating specially designed
to protect the ink from the effects of steam. This coating is supplied to customers that will
use a steam oven to shrink their labels. This coating was not used for this project. The re-
35
wetting test is intended to focus on the relationship between adhesion and re-wetting
when steam is applied and not on the resistance of the printed ink to steam.
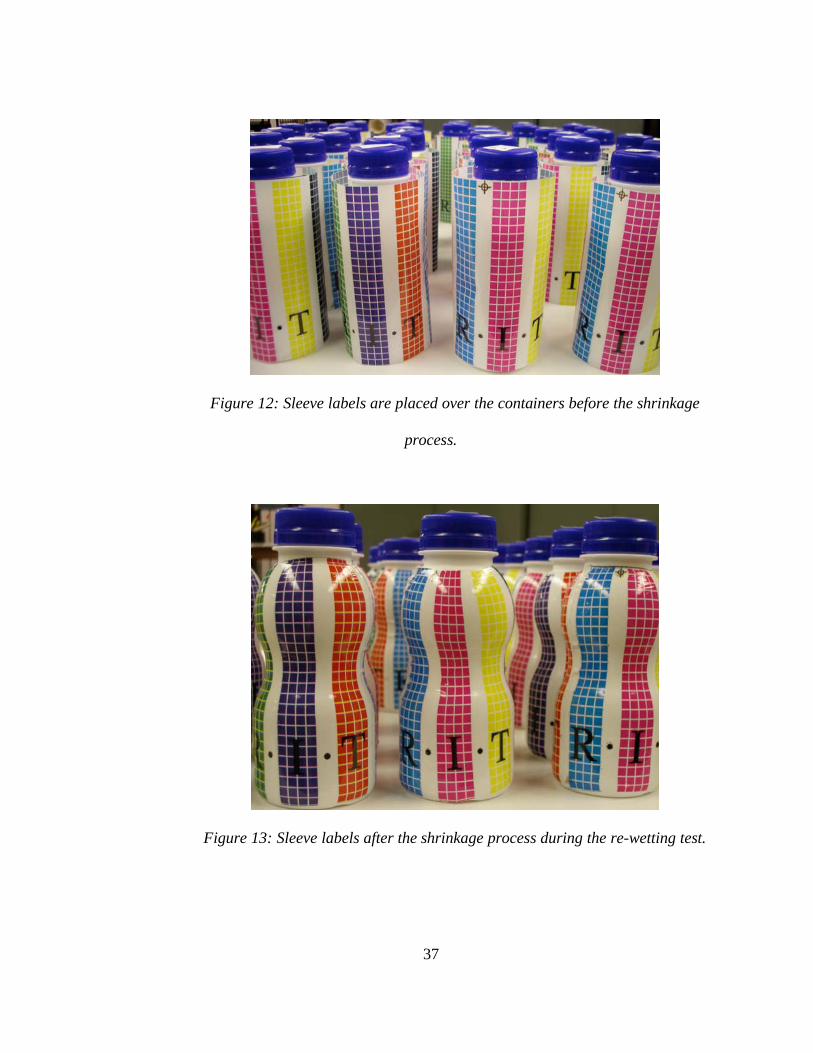
To perform this test, samples were seamed into the form of a sleeve using double-
sided tape. This sleeve was then placed over a plastic container filled with water (Figure
12). The plastic bottle used for this experiment was 6 inches high and had a diameter of
2.3 inches. The bottle was selected because of its accentuated curved shaped and because
it was already using a shrink sleeve label in the market. Water was added to absorb some
of the heat when the label was applied. This also helped maintain the shape of the
container when the label applied pressure to the bottle during the shrinkage process. After
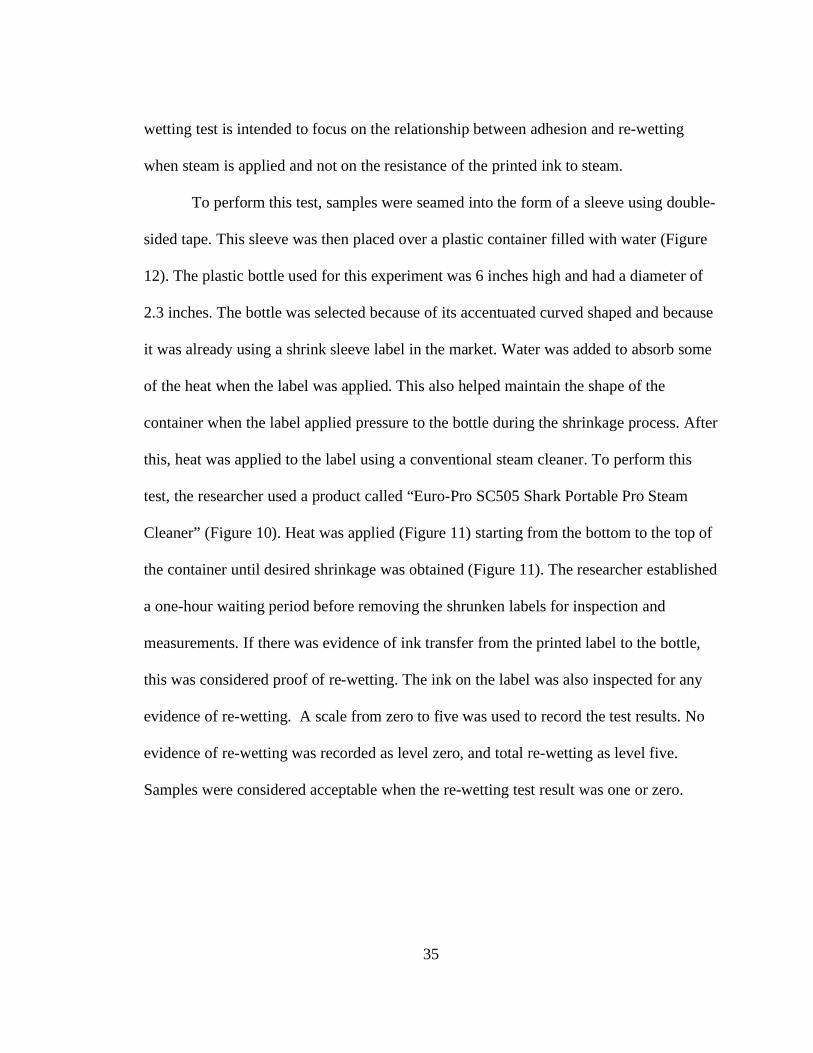
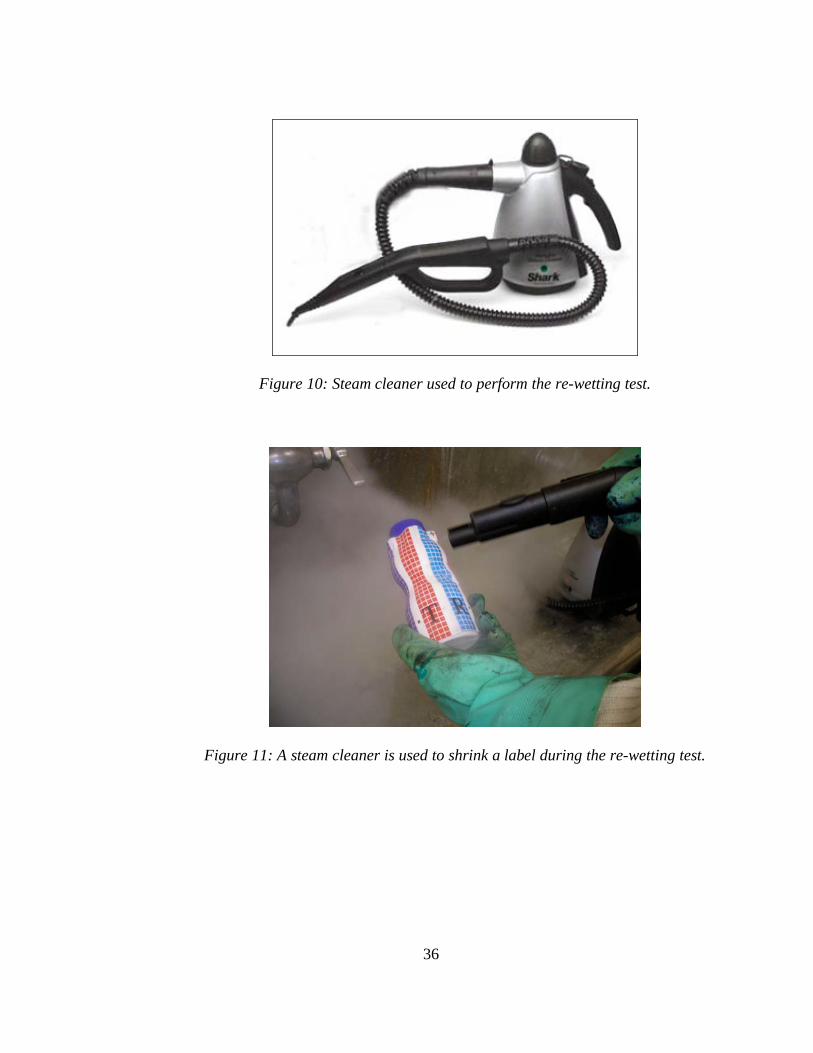
this, heat was applied to the label using a conventional steam cleaner. To perform this
test, the researcher used a product called “Euro-Pro SC505 Shark Portable Pro Steam
Cleaner” (Figure 10). Heat was applied (Figure 11) starting from the bottom to the top of
the container until desired shrinkage was obtained (Figure 11). The researcher established
a one-hour waiting period before removing the shrunken labels for inspection and
measurements. If there was evidence of ink transfer from the printed label to the bottle,
this was considered proof of re-wetting. The ink on the label was also inspected for any
evidence of re-wetting. A scale from zero to five was used to record the test results. No
evidence of re-wetting was recorded as level zero, and total re-wetting as level five.
Samples were considered acceptable when the re-wetting test result was one or zero.
36
Figure 10: Steam cleaner used to perform the re-wetting test.
Figure 11: A steam cleaner is used to shrink a label during the re-wetting test.
37
Figure 12: Sleeve labels are placed over the containers before the shrinkage
process.
Figure 13: Sleeve labels after the shrinkage process during the re-wetting test.
38
Data Analysis
The research objective denotes that at least 95 percent of the samples must portray
acceptable results for all of the tests. This has to occur for at least one of the six printing
segments. To determine if a specific speed segment from a given press run can be
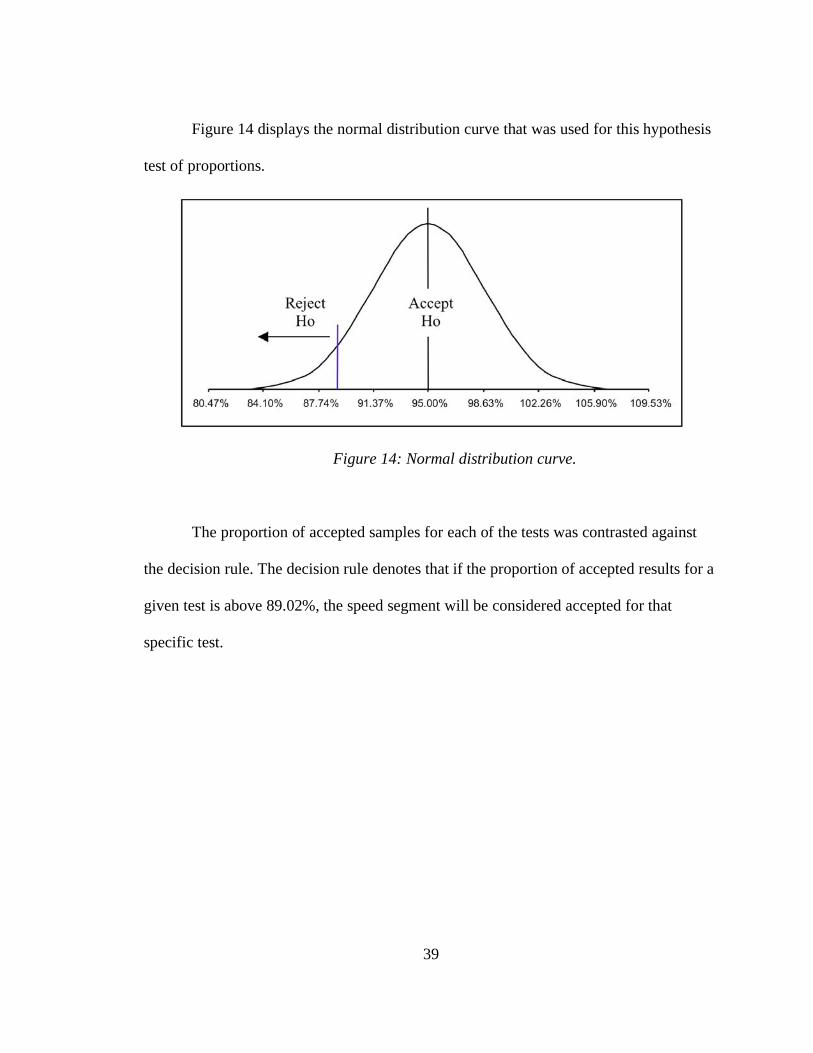
considered acceptable, a lower tail hypothesis test of proportions was conducted.
A hypothesis test was established for a 95% hypothesis proportion (p0 = 95%), a
sample size of 36 (n = 36) and a level of significance of 5% ( -risk = 5%).
Hypotheses:
H0: p p0 p 95%
H1: p < p0 p < 95%
Critical Value:
pbar* = p0 - Z pbar
pbar* = 0.95 - 1.645(0.0363)
pbar* = 89.02%
Decision Rule:
Accept H0 if pbar 89.02%
Reject H0 if pbar < 89.02%
39
Figure 14 displays the normal distribution curve that was used for this hypothesis
test of proportions.
Figure 14: Normal distribution curve.
The proportion of accepted samples for each of the tests was contrasted against
the decision rule. The decision rule denotes that if the proportion of accepted results for a
given test is above 89.02%, the speed segment will be considered accepted for that
specific test.
40
Chapter 5
Results
Press Run Measurements
Measurements were recorded before and during the press run. The researcher inspected
the ink pH and viscosity values, PVC dyne level and dryer temperatures.
Ink pH
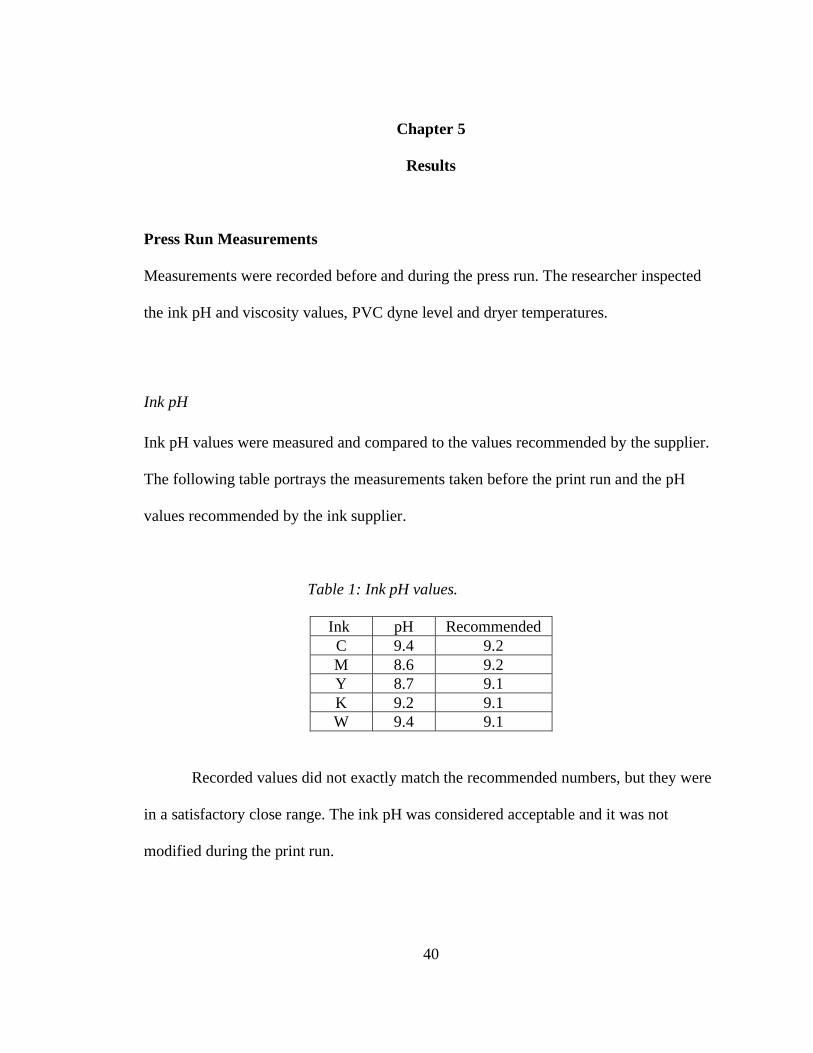
Ink pH values were measured and compared to the values recommended by the supplier.
The following table portrays the measurements taken before the print run and the pH
values recommended by the ink supplier.
Table 1: Ink pH values.
Ink pH Recommended
C 9.4 9.2
M 8.6 9.2
Y 8.7 9.1
K 9.2 9.1
W 9.4 9.1
Recorded values did not exactly match the recommended numbers, but they were
in a satisfactory close range. The ink pH was considered acceptable and it was not
modified during the print run.
41
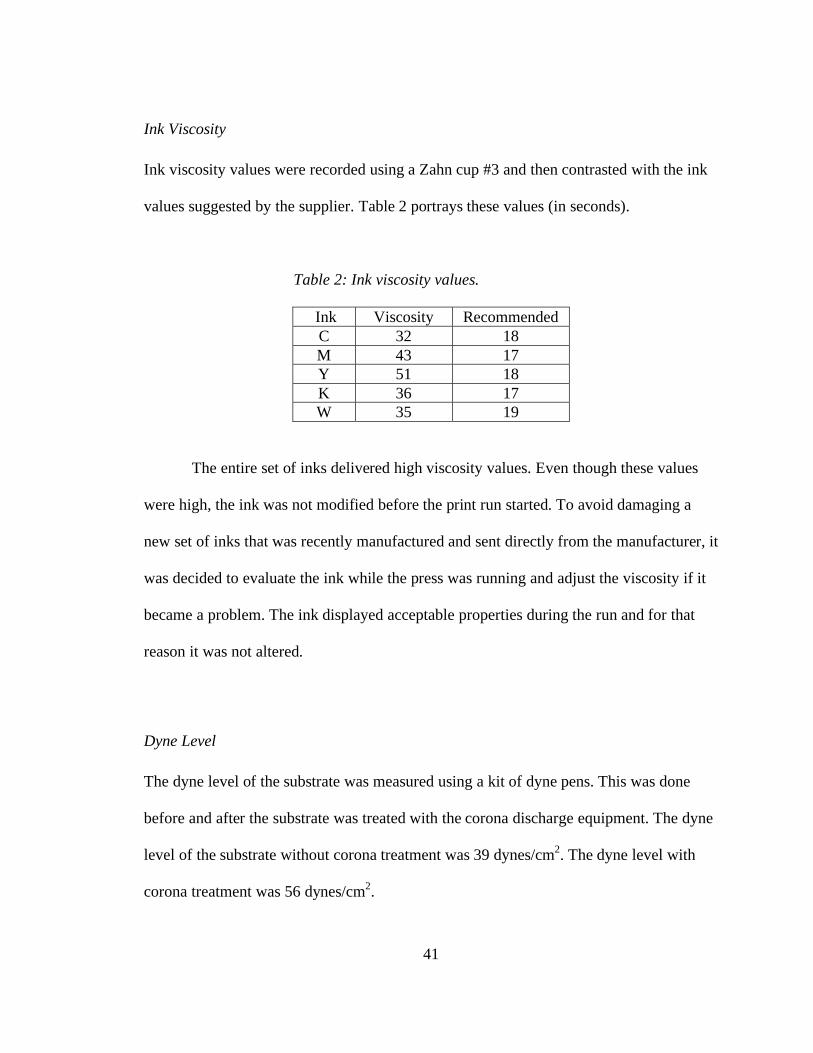
Ink Viscosity
Ink viscosity values were recorded using a Zahn cup #3 and then contrasted with the ink
values suggested by the supplier. Table 2 portrays these values (in seconds).
Table 2: Ink viscosity values.
Ink Viscosity Recommended
C 32 18
M 43 17
Y 51 18
K 36 17
W 35 19
The entire set of inks delivered high viscosity values. Even though these values
were high, the ink was not modified before the print run started. To avoid damaging a
new set of inks that was recently manufactured and sent directly from the manufacturer, it
was decided to evaluate the ink while the press was running and adjust the viscosity if it
became a problem. The ink displayed acceptable properties during the run and for that
reason it was not altered.
Dyne Level
The dyne level of the substrate was measured using a kit of dyne pens. This was done
before and after the substrate was treated with the corona discharge equipment. The dyne
level of the substrate without corona treatment was 39 dynes/cm2. The dyne level with
corona treatment was 56 dynes/cm2.
42
The corona discharge equipment was set to a minimum level. The output
fluctuated around 0.42 kW when it was used to treat the substrate.
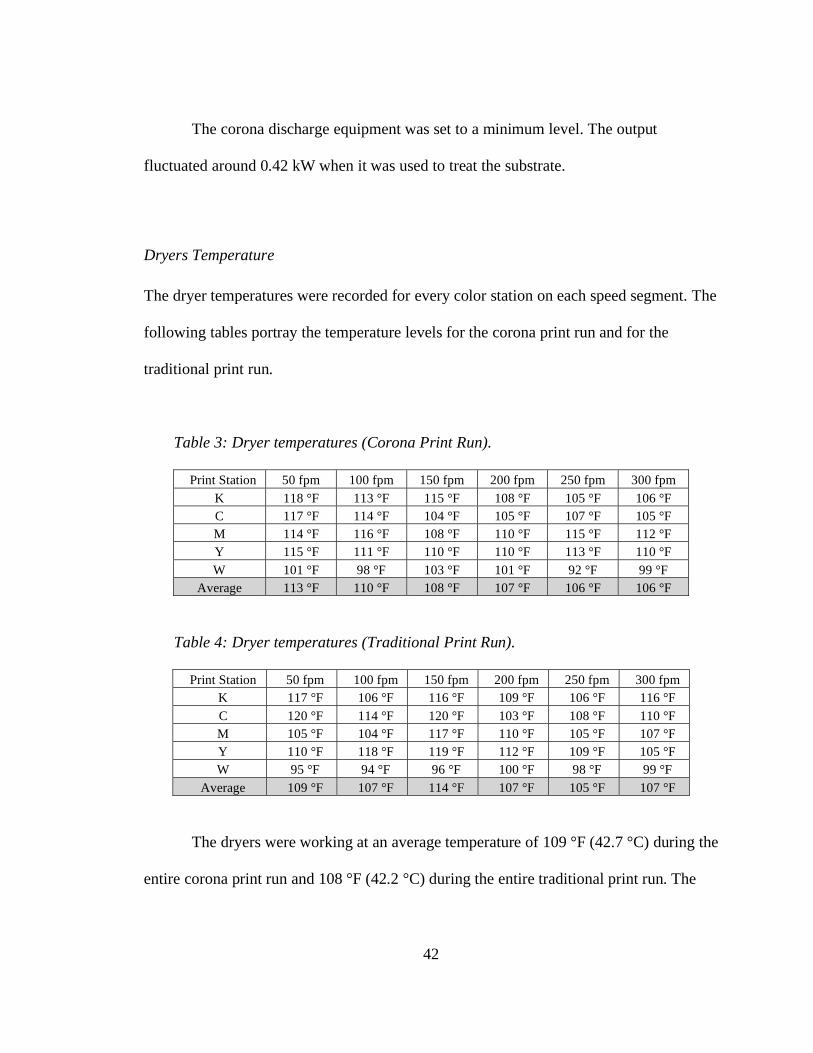
Dryers Temperature
The dryer temperatures were recorded for every color station on each speed segment. The
following tables portray the temperature levels for the corona print run and for the
traditional print run.
Table 3: Dryer temperatures (Corona Print Run).
Print Station 50 fpm 100 fpm 150 fpm 200 fpm 250 fpm 300 fpm
K 118 °F 113 °F 115 °F 108 °F 105 °F 106 °F
C 117 °F 114 °F 104 °F 105 °F 107 °F 105 °F
M 114 °F 116 °F 108 °F 110 °F 115 °F 112 °F
Y 115 °F 111 °F 110 °F 110 °F 113 °F 110 °F
W 101 °F 98 °F 103 °F 101 °F 92 °F 99 °F
Average 113 °F 110 °F 108 °F 107 °F 106 °F 106 °F
Table 4: Dryer temperatures (Traditional Print Run).
Print Station 50 fpm 100 fpm 150 fpm 200 fpm 250 fpm 300 fpm
K 117 °F 106 °F 116 °F 109 °F 106 °F 116 °F
C 120 °F 114 °F 120 °F 103 °F 108 °F 110 °F
M 105 °F 104 °F 117 °F 110 °F 105 °F 107 °F
Y 110 °F 118 °F 119 °F 112 °F 109 °F 105 °F
W 95 °F 94 °F 96 °F 100 °F 98 °F 99 °F
Average 109 °F 107 °F 114 °F 107 °F 105 °F 107 °F
The dryers were working at an average temperature of 109 °F (42.7 °C) during the
entire corona print run and 108 °F (42.2 °C) during the entire traditional print run. The
43
researcher also measured the temperature of the substrate when it was coming out of the
dryer. This temperature fluctuated between 85 °F (29.4 °C) and 90 °F (32.2 °C).
A Note On Print Quality
Print quality issues were observed on some printed samples. A quality problem worth
mentioning is the one observed when printing at 50 fpm. A combination of a slow
running speed (50 fpm) and a relatively large print cylinder repeat size (15 inches) caused
the ink to dry prematurely on the plates. This produced ink buildup on the plates and
subsequent dirty printing defects. Since 50 fpm was the first speed segment, this problem
caused dirty printing throughout the whole run. A way to solve this problem is to use a
smaller repeat cylinder (common in most narrow web label printing applications) or
increase the press speed.
It is important to mention that print quality factors were not the focus of this
research project. Various quality issues were observed throughout the run, such as
misregistration, color densities issues and printing defects. The main focus of the
investigation did not allow for the chance to constantly monitor and correct these issues.
It must be said that in other circumstances these problems could have been easily
corrected.
44
Corona Treatment Print Run
The following section summarizes the results obtained when the corona print run samples
were analyzed. Samples were evaluated by employing a blocking test, an offsetting test,
an adhesion test, a shrinkage test and a re-wetting test. All test results were contrasted
with the appropriate acceptance criterion that summarizes the percentage of acceptable
results for a specific test. Subsequently a hypothesis test determined if a given speed
segment could be considered acceptable for a particular experiment.
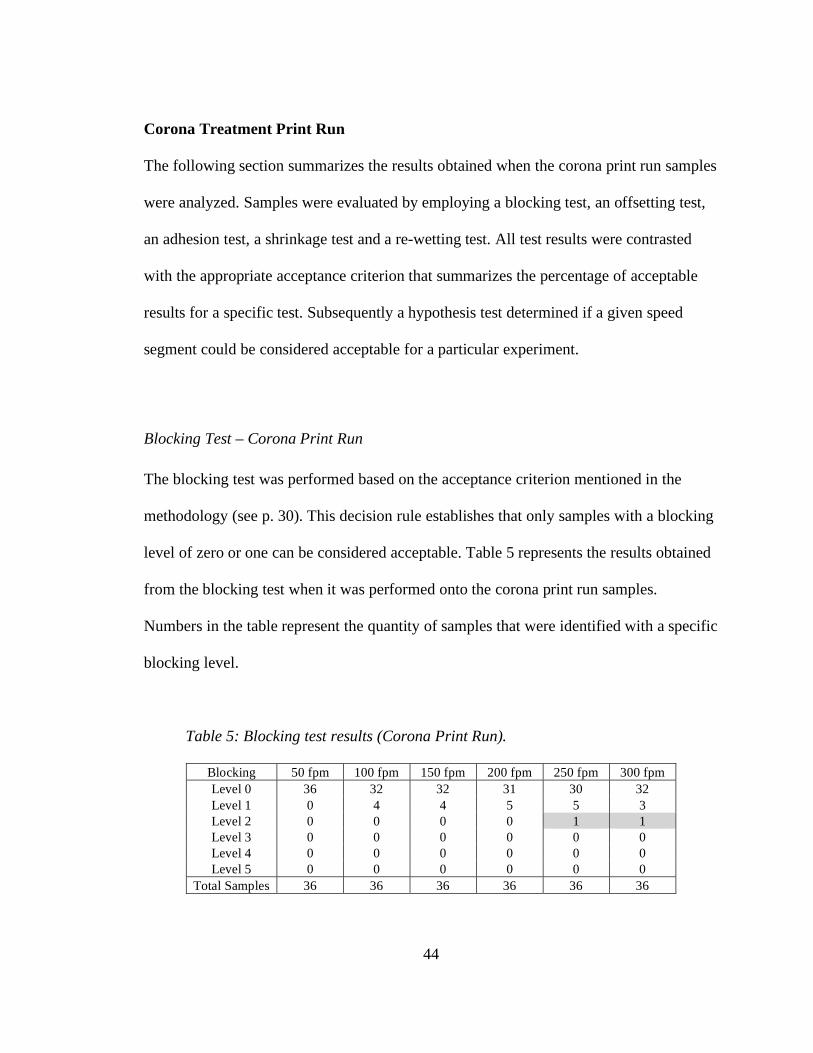
Blocking Test – Corona Print Run
The blocking test was performed based on the acceptance criterion mentioned in the
methodology (see p. 30). This decision rule establishes that only samples with a blocking
level of zero or one can be considered acceptable. Table 5 represents the results obtained
from the blocking test when it was performed onto the corona print run samples.
Numbers in the table represent the quantity of samples that were identified with a specific
blocking level.
Table 5: Blocking test results (Corona Print Run).
Blocking 50 fpm 100 fpm 150 fpm 200 fpm 250 fpm 300 fpm
Level 0 36 32 32 31 30 32
Level 1 0 4 4 5 5 3
Level 2 0 0 0 0 1 1
Level 3 0 0 0 0 0 0
Level 4 0 0 0 0 0 0
Level 5 0 0 0 0 0 0
Total Samples 36 36 36 36 36 36
45
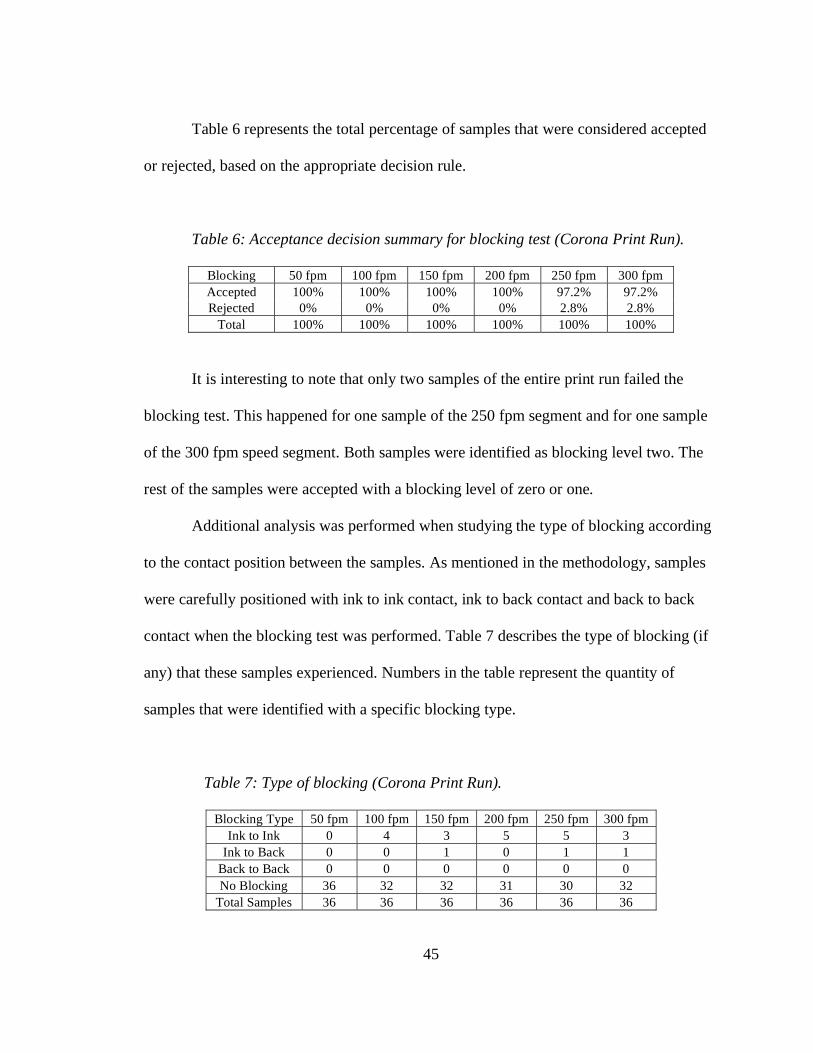
Table 6 represents the total percentage of samples that were considered accepted
or rejected, based on the appropriate decision rule.
Table 6: Acceptance decision summary for blocking test (Corona Print Run).
Blocking 50 fpm 100 fpm 150 fpm 200 fpm 250 fpm 300 fpm
Accepted 100% 100% 100% 100% 97.2% 97.2%
Rejected 0% 0% 0% 0% 2.8% 2.8%
Total 100% 100% 100% 100% 100% 100%
It is interesting to note that only two samples of the entire print run failed the
blocking test. This happened for one sample of the 250 fpm segment and for one sample
of the 300 fpm speed segment. Both samples were identified as blocking level two. The
rest of the samples were accepted with a blocking level of zero or one.
Additional analysis was performed when studying the type of blocking according
to the contact position between the samples. As mentioned in the methodology, samples
were carefully positioned with ink to ink contact, ink to back contact and back to back
contact when the blocking test was performed. Table 7 describes the type of blocking (if
any) that these samples experienced. Numbers in the table represent the quantity of
samples that were identified with a specific blocking type.
Table 7: Type of blocking (Corona Print Run).
Blocking Type 50 fpm 100 fpm 150 fpm 200 fpm 250 fpm 300 fpm
Ink to Ink 0 4 3 5 5 3
Ink to Back 0 0 1 0 1 1
Back to Back 0 0 0 0 0 0
No Blocking 36 32 32 31 30 32
Total Samples 36 36 36 36 36 36
46
For the few samples that had some degree of blocking, “ink to ink” blocking was
the most common occurrence. Out of the 23 samples that presented some level of
blocking, only three were revealed to have “ink to back” blocking and the rest were
described as “ink to ink” blocking.
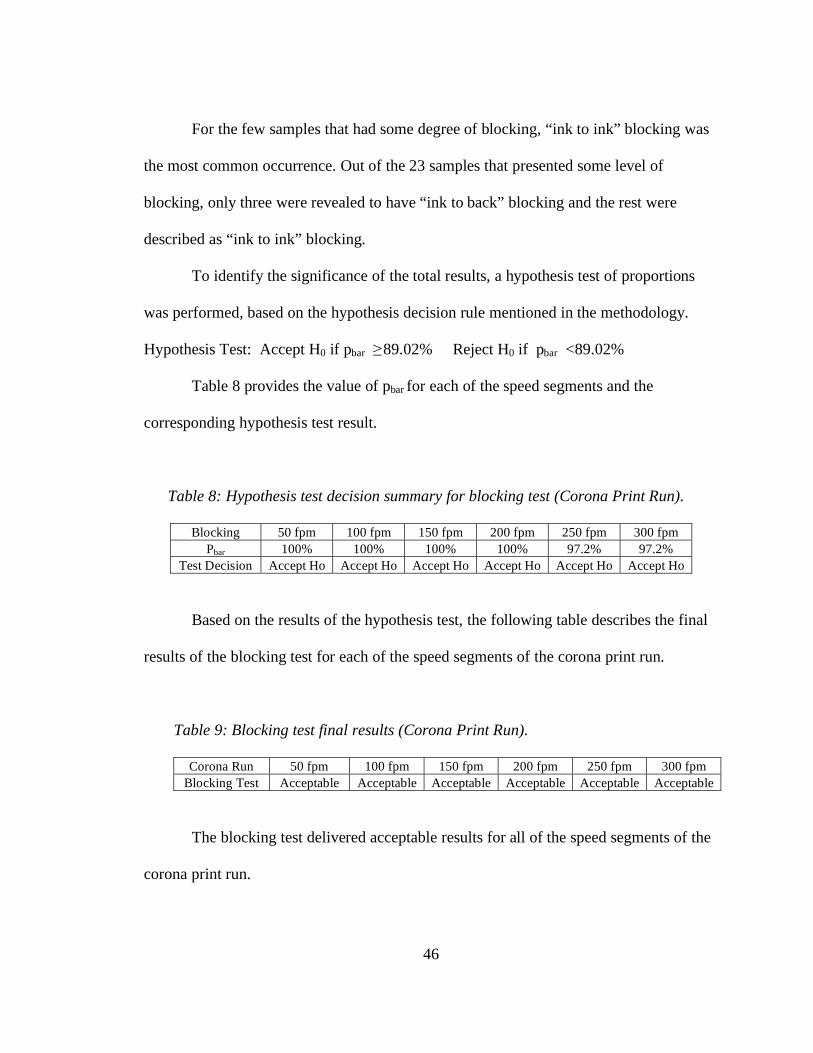
To identify the significance of the total results, a hypothesis test of proportions
was performed, based on the hypothesis decision rule mentioned in the methodology.
Hypothesis Test: Accept H0 if pbar 89.02% Reject H0 if pbar < 89.02%
Table 8 provides the value of pbar for each of the speed segments and the
corresponding hypothesis test result.
Table 8: Hypothesis test decision summary for blocking test (Corona Print Run).
Blocking 50 fpm 100 fpm 150 fpm 200 fpm 250 fpm 300 fpm
Pbar 100% 100% 100% 100% 97.2% 97.2%
Test Decision Accept Ho Accept Ho Accept Ho Accept Ho Accept Ho Accept Ho
Based on the results of the hypothesis test, the following table describes the final
results of the blocking test for each of the speed segments of the corona print run.
Table 9: Blocking test final results (Corona Print Run).
Corona Run 50 fpm 100 fpm 150 fpm 200 fpm 250 fpm 300 fpm
Blocking Test Acceptable Acceptable Acceptable Acceptable Acceptable Acceptable
The blocking test delivered acceptable results for all of the speed segments of the
corona print run.
47
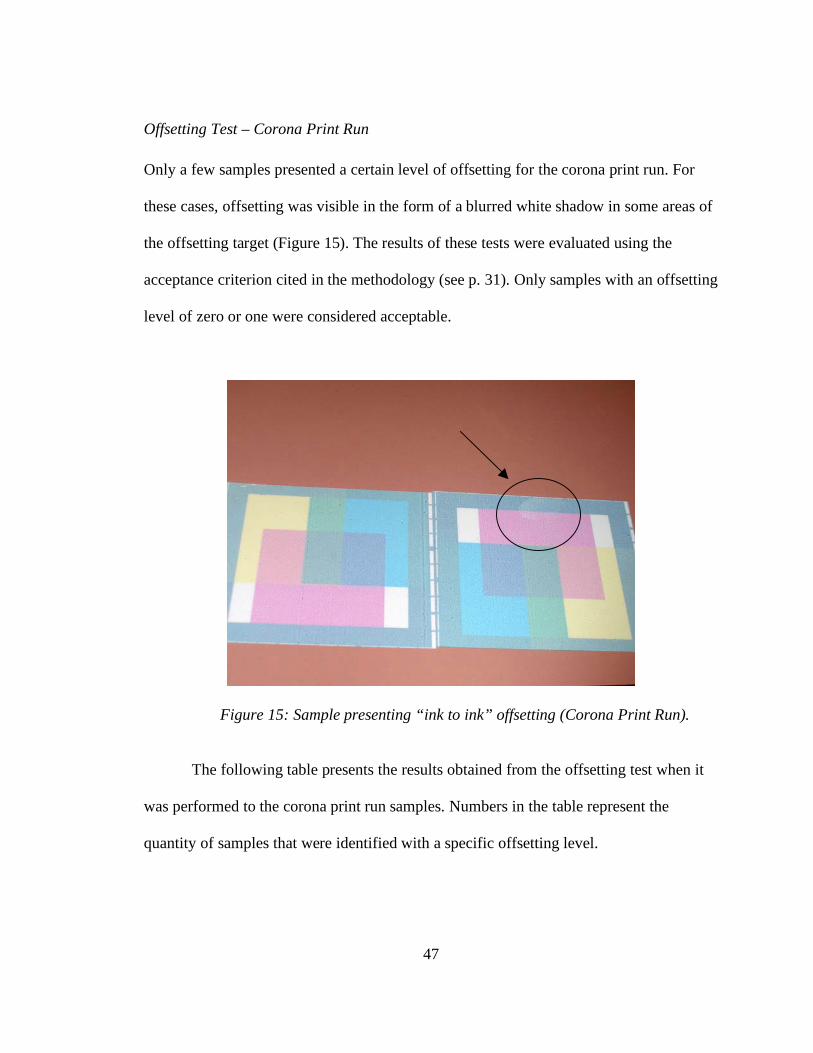
Offsetting Test – Corona Print Run
Only a few samples presented a certain level of offsetting for the corona print run. For
these cases, offsetting was visible in the form of a blurred white shadow in some areas of
the offsetting target (Figure 15). The results of these tests were evaluated using the
acceptance criterion cited in the methodology (see p. 31). Only samples with an offsetting
level of zero or one were considered acceptable.
Figure 15: Sample presenting “ink to ink” offsetting (Corona Print Run).
The following table presents the results obtained from the offsetting test when it
was performed to the corona print run samples. Numbers in the table represent the
quantity of samples that were identified with a specific offsetting level.
48
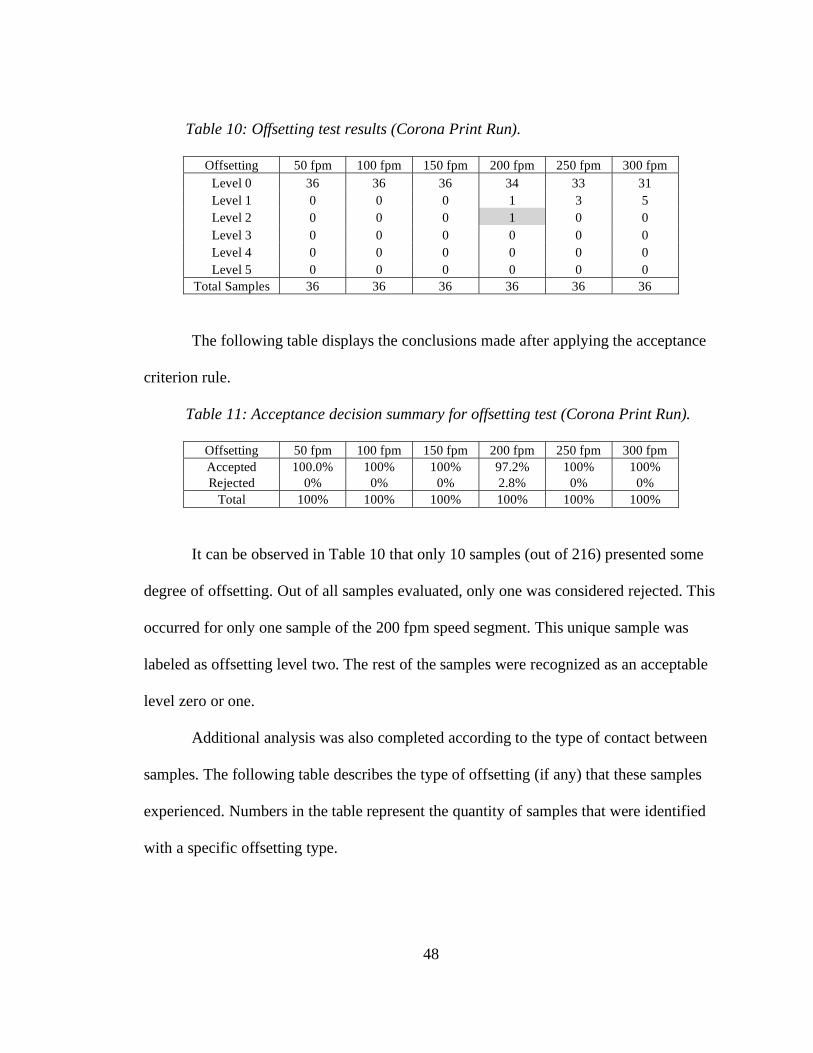
Table 10: Offsetting test results (Corona Print Run).
Offsetting 50 fpm 100 fpm 150 fpm 200 fpm 250 fpm 300 fpm
Level 0 36 36 36 34 33 31
Level 1 0 0 0 1 3 5
Level 2 0 0 0 1 0 0
Level 3 0 0 0 0 0 0
Level 4 0 0 0 0 0 0
Level 5 0 0 0 0 0 0
Total Samples 36 36 36 36 36 36
The following table displays the conclusions made after applying the acceptance
criterion rule.
Table 11: Acceptance decision summary for offsetting test (Corona Print Run).
Offsetting 50 fpm 100 fpm 150 fpm 200 fpm 250 fpm 300 fpm
Accepted 100.0% 100% 100% 97.2% 100% 100%
Rejected 0% 0% 0% 2.8% 0% 0%
Total 100% 100% 100% 100% 100% 100%
It can be observed in Table 10 that only 10 samples (out of 216) presented some
degree of offsetting. Out of all samples evaluated, only one was considered rejected. This
occurred for only one sample of the 200 fpm speed segment. This unique sample was
labeled as offsetting level two. The rest of the samples were recognized as an acceptable
level zero or one.
Additional analysis was also completed according to the type of contact between
samples. The following table describes the type of offsetting (if any) that these samples
experienced. Numbers in the table represent the quantity of samples that were identified
with a specific offsetting type.
49
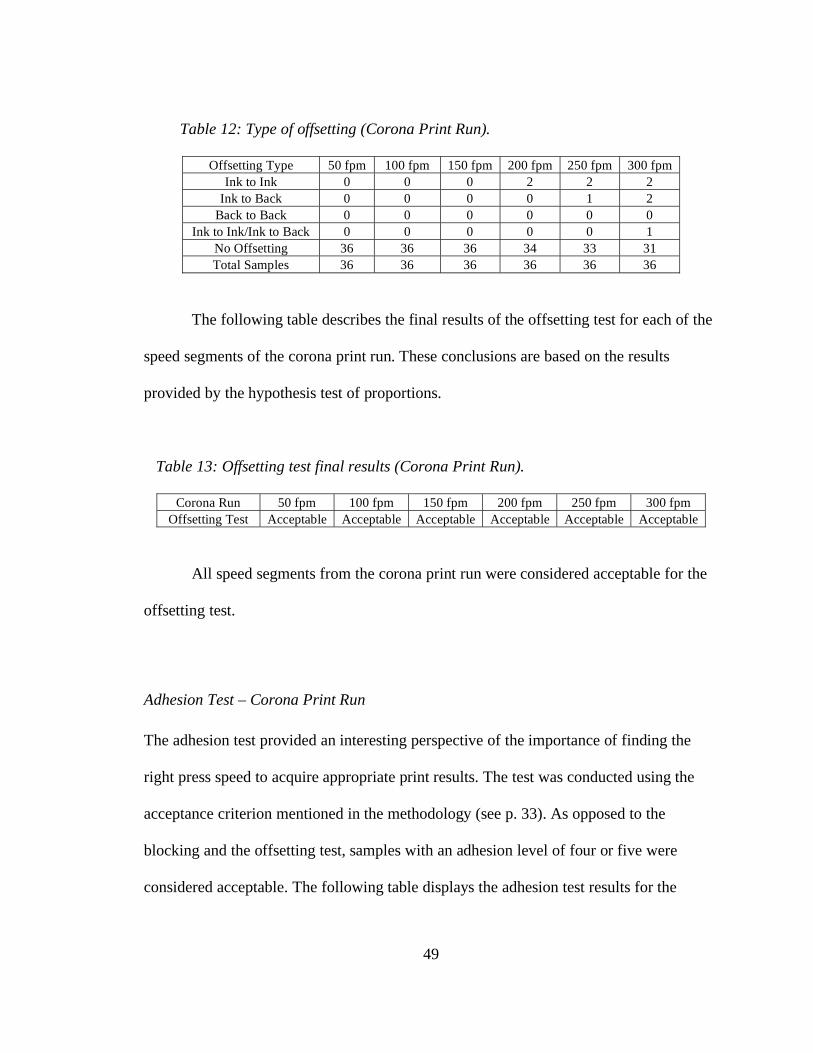
Table 12: Type of offsetting (Corona Print Run).
Offsetting Type 50 fpm 100 fpm 150 fpm 200 fpm 250 fpm 300 fpm
Ink to Ink 0 0 0 2 2 2
Ink to Back 0 0 0 0 1 2
Back to Back 0 0 0 0 0 0
Ink to Ink/Ink to Back 0 0 0 0 0 1
No Offsetting 36 36 36 34 33 31
Total Samples 36 36 36 36 36 36
The following table describes the final results of the offsetting test for each of the
speed segments of the corona print run. These conclusions are based on the results
provided by the hypothesis test of proportions.
Table 13: Offsetting test final results (Corona Print Run).
Corona Run 50 fpm 100 fpm 150 fpm 200 fpm 250 fpm 300 fpm
Offsetting Test Acceptable Acceptable Acceptable Acceptable Acceptable Acceptable
All speed segments from the corona print run were considered acceptable for the
offsetting test.
Adhesion Test – Corona Print Run
The adhesion test provided an interesting perspective of the importance of finding the
right press speed to acquire appropriate print results. The test was conducted using the
acceptance criterion mentioned in the methodology (see p. 33). As opposed to the
blocking and the offsetting test, samples with an adhesion level of four or five were
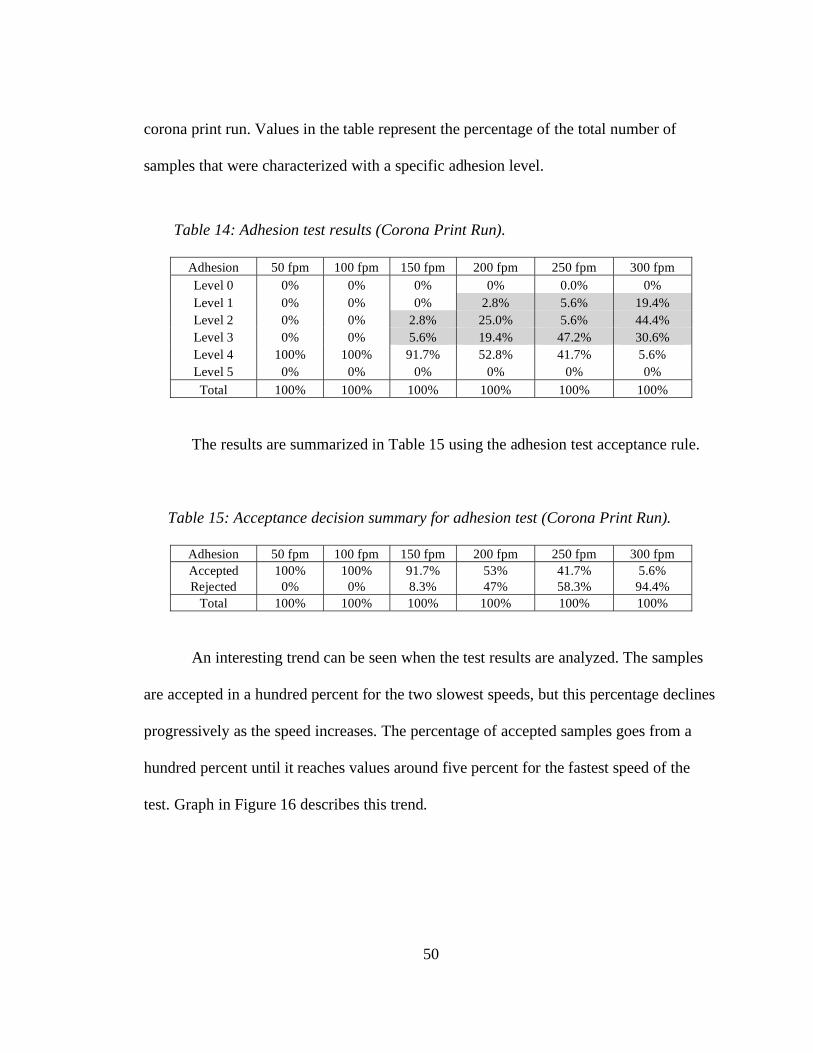
considered acceptable. The following table displays the adhesion test results for the
50
corona print run. Values in the table represent the percentage of the total number of
samples that were characterized with a specific adhesion level.
Table 14: Adhesion test results (Corona Print Run).
Adhesion 50 fpm 100 fpm 150 fpm 200 fpm 250 fpm 300 fpm
Level 0 0% 0% 0% 0% 0.0% 0%
Level 1 0% 0% 0% 2.8% 5.6% 19.4%
Level 2 0% 0% 2.8% 25.0% 5.6% 44.4%
Level 3 0% 0% 5.6% 19.4% 47.2% 30.6%
Level 4 100% 100% 91.7% 52.8% 41.7% 5.6%
Level 5 0% 0% 0% 0% 0% 0%
Total 100% 100% 100% 100% 100% 100%
The results are summarized in Table 15 using the adhesion test acceptance rule.
Table 15: Acceptance decision summary for adhesion test (Corona Print Run).
Adhesion 50 fpm 100 fpm 150 fpm 200 fpm 250 fpm 300 fpm
Accepted 100% 100% 91.7% 53% 41.7% 5.6%
Rejected 0% 0% 8.3% 47% 58.3% 94.4%
Total 100% 100% 100% 100% 100% 100%
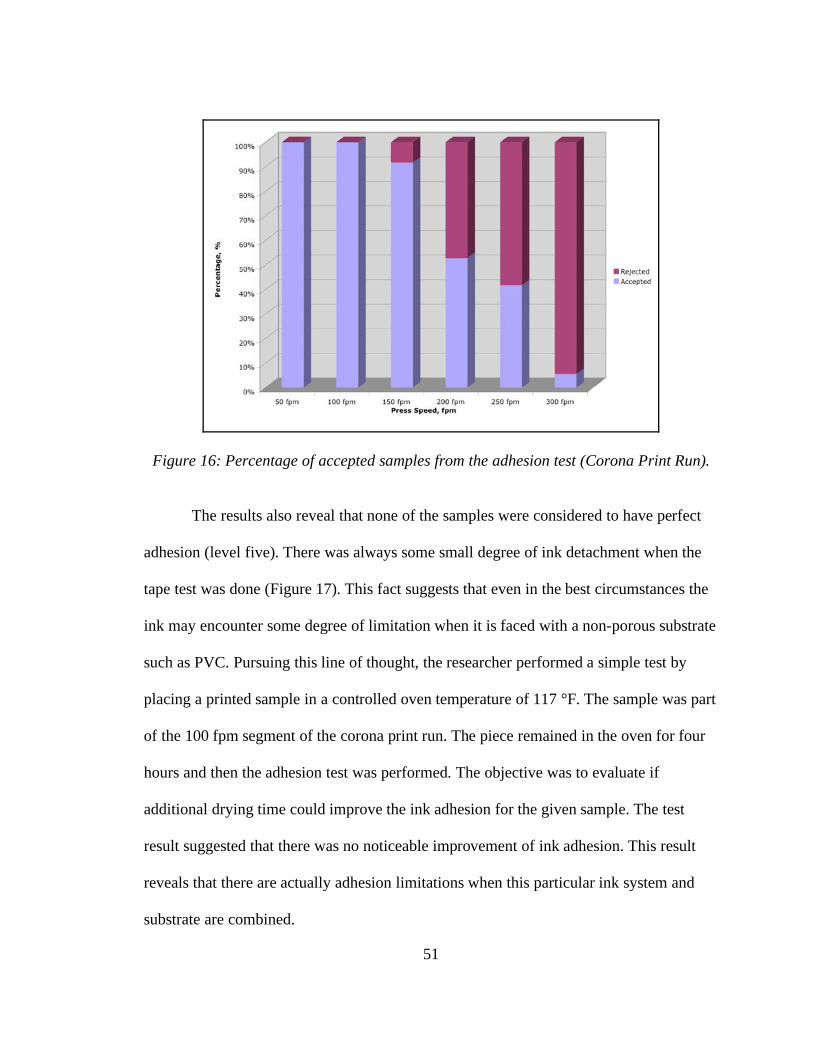
An interesting trend can be seen when the test results are analyzed. The samples
are accepted in a hundred percent for the two slowest speeds, but this percentage declines
progressively as the speed increases. The percentage of accepted samples goes from a
hundred percent until it reaches values around five percent for the fastest speed of the
test. Graph in Figure 16 describes this trend.
51
Figure 16: Percentage of accepted samples from the adhesion test (Corona Print Run).
The results also reveal that none of the samples were considered to have perfect
adhesion (level five). There was always some small degree of ink detachment when the
tape test was done (Figure 17). This fact suggests that even in the best circumstances the
ink may encounter some degree of limitation when it is faced with a non-porous substrate
such as PVC. Pursuing this line of thought, the researcher performed a simple test by
placing a printed sample in a controlled oven temperature of 117 °F. The sample was part
of the 100 fpm segment of the corona print run. The piece remained in the oven for four
hours and then the adhesion test was performed. The objective was to evaluate if
additional drying time could improve the ink adhesion for the given sample. The test
result suggested that there was no noticeable improvement of ink adhesion. This result
reveals that there are actually adhesion limitations when this particular ink system and
substrate are combined.
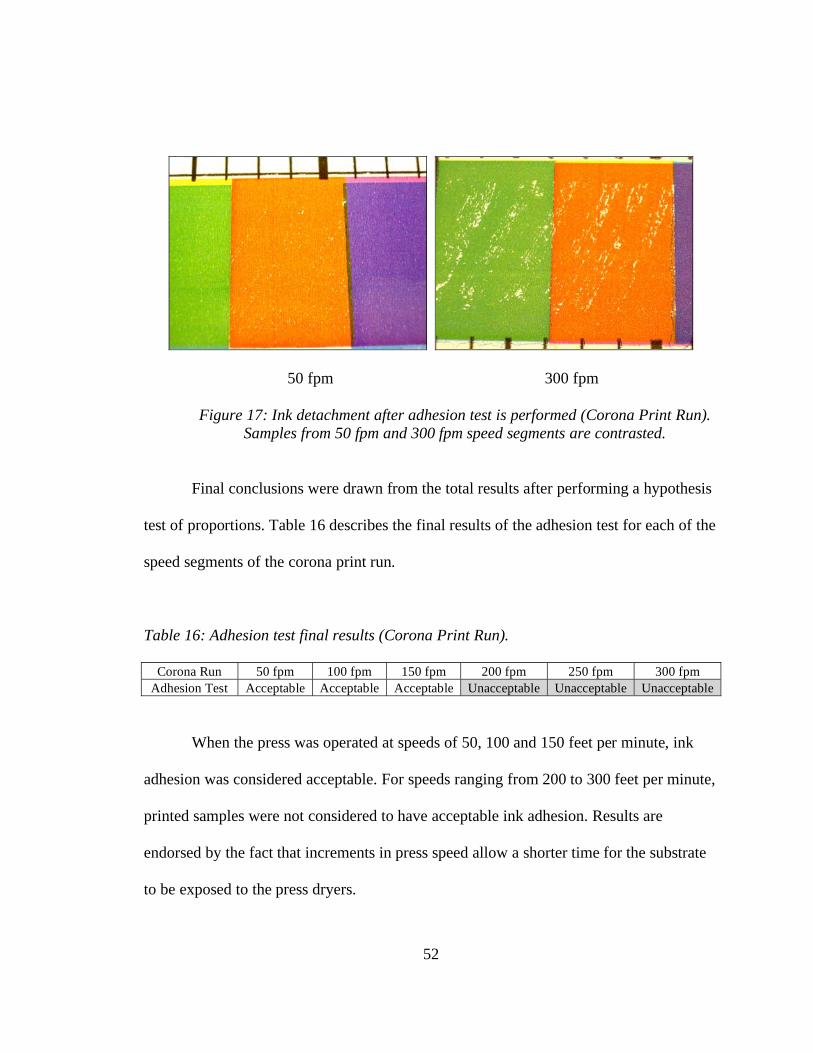
52
50 fpm 300 fpm
Figure 17: Ink detachment after adhesion test is performed (Corona Print Run).
Samples from 50 fpm and 300 fpm speed segments are contrasted.
Final conclusions were drawn from the total results after performing a hypothesis
test of proportions. Table 16 describes the final results of the adhesion test for each of the
speed segments of the corona print run.
Table 16: Adhesion test final results (Corona Print Run).
Corona Run 50 fpm 100 fpm 150 fpm 200 fpm 250 fpm 300 fpm
Adhesion Test Acceptable Acceptable Acceptable Unacceptable Unacceptable Unacceptable
When the press was operated at speeds of 50, 100 and 150 feet per minute, ink
adhesion was considered acceptable. For speeds ranging from 200 to 300 feet per minute,
printed samples were not considered to have acceptable ink adhesion. Results are
endorsed by the fact that increments in press speed allow a shorter time for the substrate
to be exposed to the press dryers.
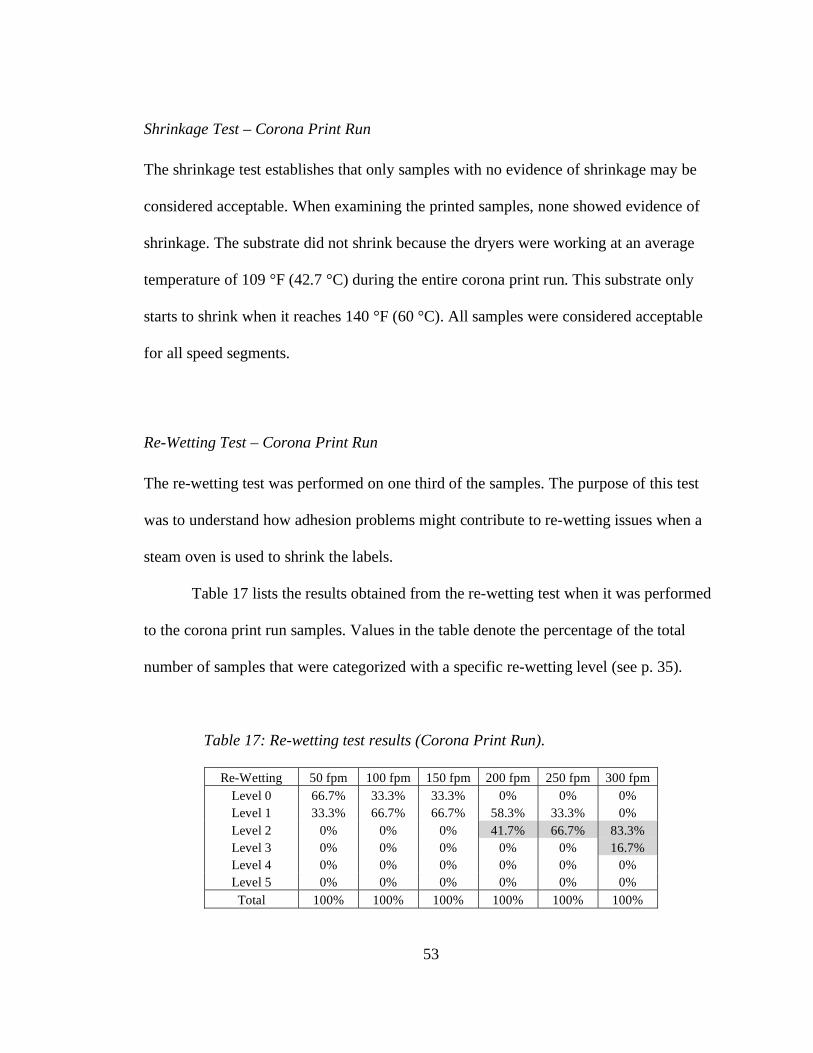
53
Shrinkage Test – Corona Print Run
The shrinkage test establishes that only samples with no evidence of shrinkage may be
considered acceptable. When examining the printed samples, none showed evidence of
shrinkage. The substrate did not shrink because the dryers were working at an average
temperature of 109 °F (42.7 °C) during the entire corona print run. This substrate only
starts to shrink when it reaches 140 °F (60 °C). All samples were considered acceptable
for all speed segments.
Re-Wetting Test – Corona Print Run
The re-wetting test was performed on one third of the samples. The purpose of this test
was to understand how adhesion problems might contribute to re-wetting issues when a
steam oven is used to shrink the labels.
Table 17 lists the results obtained from the re-wetting test when it was performed
to the corona print run samples. Values in the table denote the percentage of the total
number of samples that were categorized with a specific re-wetting level (see p. 35).
Table 17: Re-wetting test results (Corona Print Run).
Re-Wetting 50 fpm 100 fpm 150 fpm 200 fpm 250 fpm 300 fpm
Level 0 66.7% 33.3% 33.3% 0% 0% 0%
Level 1 33.3% 66.7% 66.7% 58.3% 33.3% 0%
Level 2 0% 0% 0% 41.7% 66.7% 83.3%
Level 3 0% 0% 0% 0% 0% 16.7%
Level 4 0% 0% 0% 0% 0% 0%
Level 5 0% 0% 0% 0% 0% 0%
Total 100% 100% 100% 100% 100% 100%
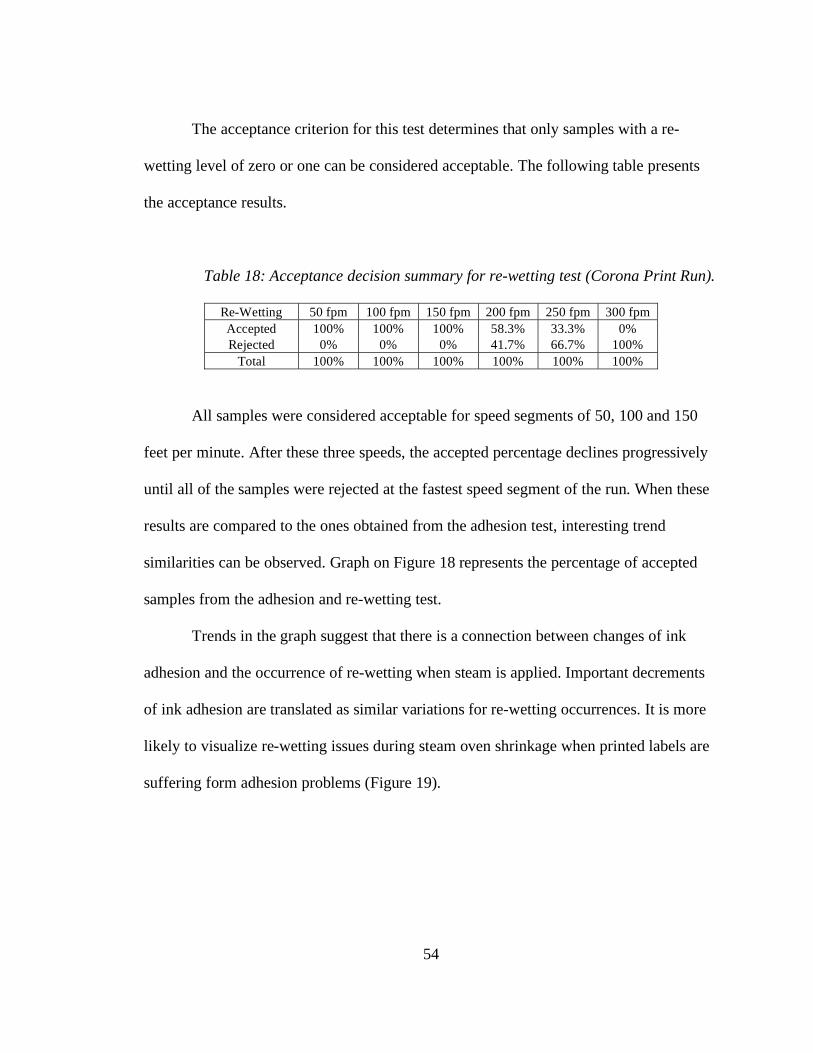
54
The acceptance criterion for this test determines that only samples with a re-
wetting level of zero or one can be considered acceptable. The following table presents
the acceptance results.
Table 18: Acceptance decision summary for re-wetting test (Corona Print Run).
Re-Wetting 50 fpm 100 fpm 150 fpm 200 fpm 250 fpm 300 fpm
Accepted 100% 100% 100% 58.3% 33.3% 0%
Rejected 0% 0% 0% 41.7% 66.7% 100%
Total 100% 100% 100% 100% 100% 100%
All samples were considered acceptable for speed segments of 50, 100 and 150
feet per minute. After these three speeds, the accepted percentage declines progressively
until all of the samples were rejected at the fastest speed segment of the run. When these
results are compared to the ones obtained from the adhesion test, interesting trend
similarities can be observed. Graph on Figure 18 represents the percentage of accepted
samples from the adhesion and re-wetting test.
Trends in the graph suggest that there is a connection between changes of ink
adhesion and the occurrence of re-wetting when steam is applied. Important decrements
of ink adhesion are translated as similar variations for re-wetting occurrences. It is more
likely to visualize re-wetting issues during steam oven shrinkage when printed labels are
suffering form adhesion problems (Figure 19).
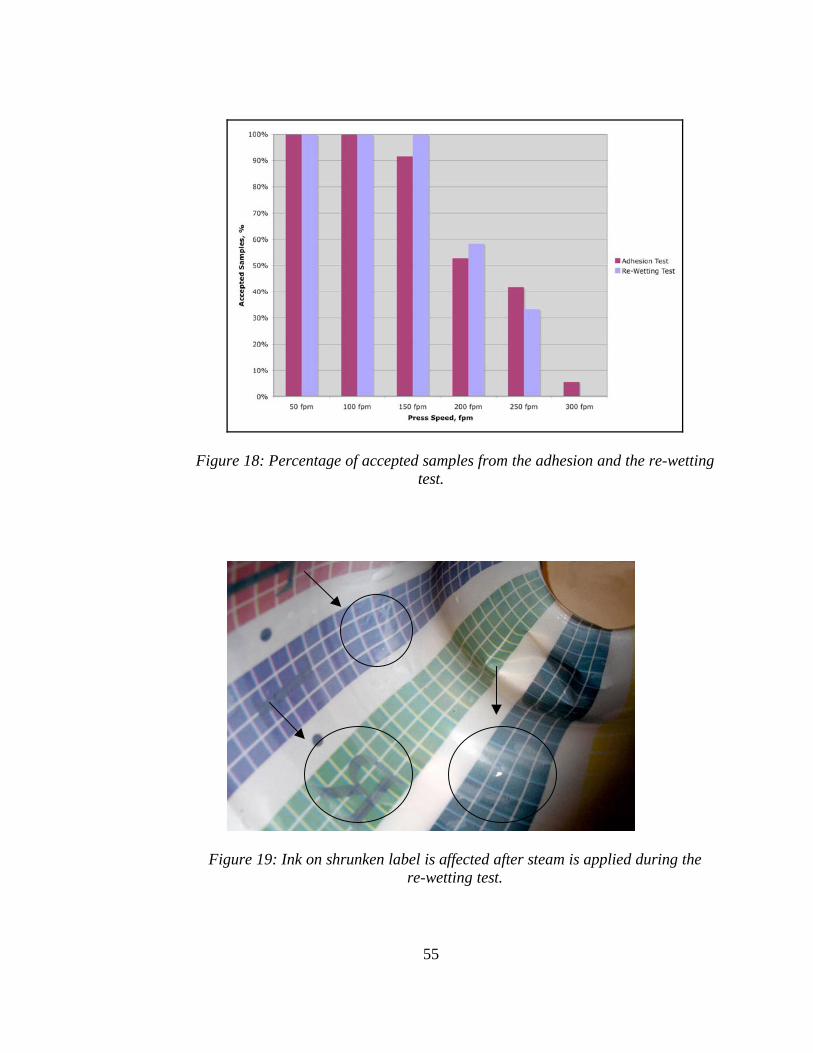
55
Figure 18: Percentage of accepted samples from the adhesion and the re-wetting
test.
Figure 19: Ink on shrunken label is affected after steam is applied during the
re-wetting test.
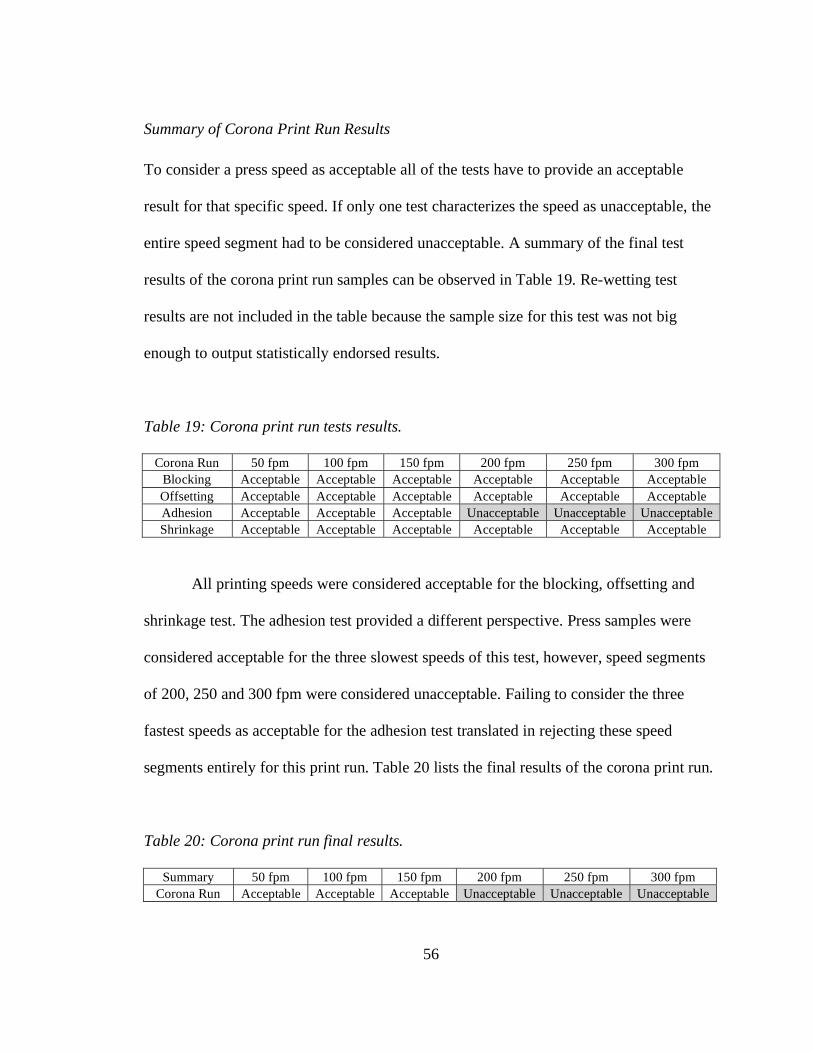
56
Summary of Corona Print Run Results
To consider a press speed as acceptable all of the tests have to provide an acceptable
result for that specific speed. If only one test characterizes the speed as unacceptable, the
entire speed segment had to be considered unacceptable. A summary of the final test
results of the corona print run samples can be observed in Table 19. Re-wetting test
results are not included in the table because the sample size for this test was not big
enough to output statistically endorsed results.
Table 19: Corona print run tests results.
Corona Run 50 fpm 100 fpm 150 fpm 200 fpm 250 fpm 300 fpm
Blocking Acceptable Acceptable Acceptable Acceptable Acceptable Acceptable
Offsetting Acceptable Acceptable Acceptable Acceptable Acceptable Acceptable
Adhesion Acceptable Acceptable Acceptable Unacceptable Unacceptable Unacceptable
Shrinkage Acceptable Acceptable Acceptable Acceptable Acceptable Acceptable
All printing speeds were considered acceptable for the blocking, offsetting and
shrinkage test. The adhesion test provided a different perspective. Press samples were
considered acceptable for the three slowest speeds of this test, however, speed segments
of 200, 250 and 300 fpm were considered unacceptable. Failing to consider the three
fastest speeds as acceptable for the adhesion test translated in rejecting these speed
segments entirely for this print run. Table 20 lists the final results of the corona print run.
Table 20: Corona print run final results.
Summary 50 fpm 100 fpm 150 fpm 200 fpm 250 fpm 300 fpm
Corona Run Acceptable Acceptable Acceptable Unacceptable Unacceptable Unacceptable

57
Final results suggest that the research objective was achieved. To obtain at least
95% acceptable results when printing shrink labels, a press with corona treatment must be
operated at no faster than 150 feet per minute.
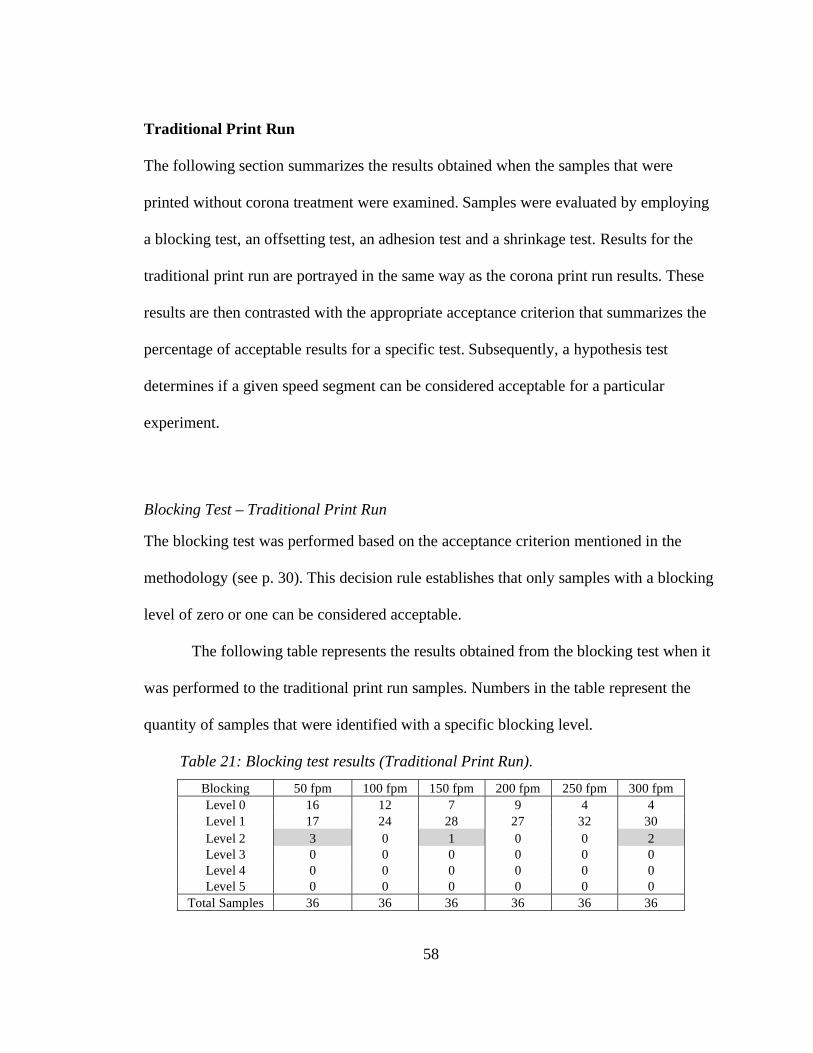
58
Traditional Print Run
The following section summarizes the results obtained when the samples that were
printed without corona treatment were examined. Samples were evaluated by employing
a blocking test, an offsetting test, an adhesion test and a shrinkage test. Results for the
traditional print run are portrayed in the same way as the corona print run results. These
results are then contrasted with the appropriate acceptance criterion that summarizes the
percentage of acceptable results for a specific test. Subsequently, a hypothesis test
determines if a given speed segment can be considered acceptable for a particular
experiment.
Blocking Test – Traditional Print Run
The blocking test was performed based on the acceptance criterion mentioned in the
methodology (see p. 30). This decision rule establishes that only samples with a blocking
level of zero or one can be considered acceptable.
The following table represents the results obtained from the blocking test when it
was performed to the traditional print run samples. Numbers in the table represent the
quantity of samples that were identified with a specific blocking level.
Table 21: Blocking test results (Traditional Print Run).
Blocking 50 fpm 100 fpm 150 fpm 200 fpm 250 fpm 300 fpm
Level 0 16 12 7 9 4 4
Level 1 17 24 28 27 32 30
Level 2 3 0 1 0 0 2
Level 3 0 0 0 0 0 0
Level 4 0 0 0 0 0 0
Level 5 0 0 0 0 0 0
Total Samples 36 36 36 36 36 36
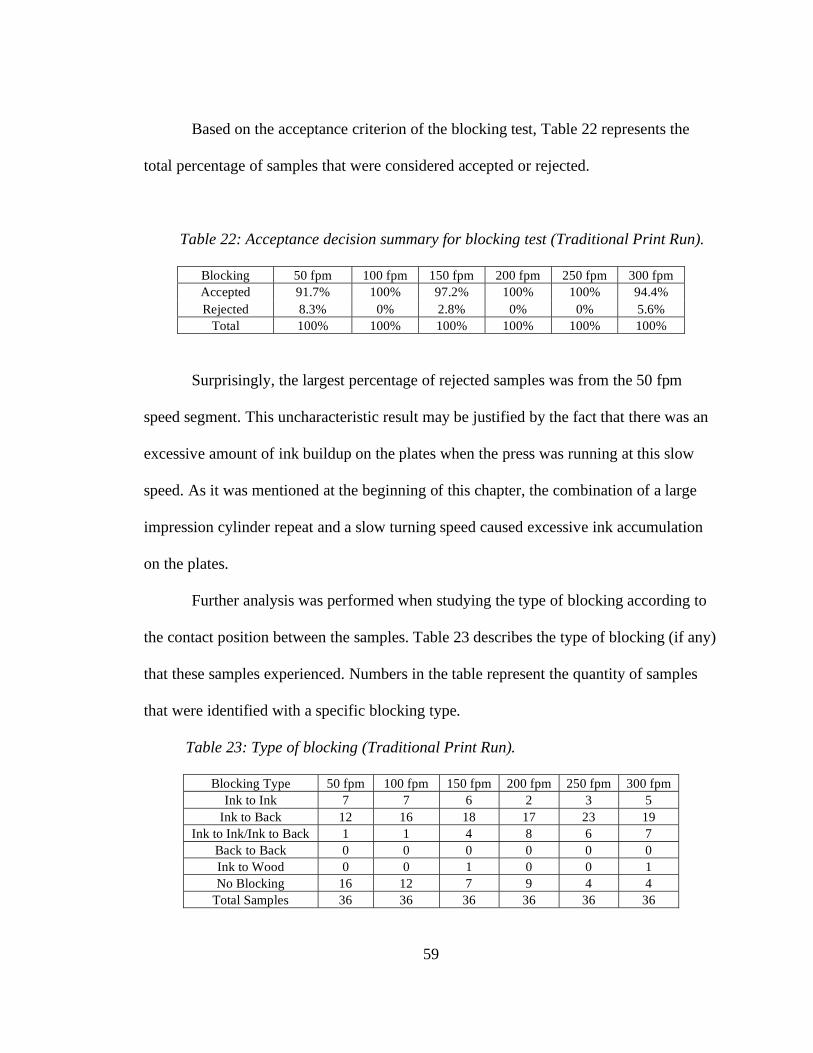
59
Based on the acceptance criterion of the blocking test, Table 22 represents the
total percentage of samples that were considered accepted or rejected.
Table 22: Acceptance decision summary for blocking test (Traditional Print Run).
Blocking 50 fpm 100 fpm 150 fpm 200 fpm 250 fpm 300 fpm
Accepted 91.7% 100% 97.2% 100% 100% 94.4%
Rejected 8.3% 0% 2.8% 0% 0% 5.6%
Total 100% 100% 100% 100% 100% 100%
Surprisingly, the largest percentage of rejected samples was from the 50 fpm
speed segment. This uncharacteristic result may be justified by the fact that there was an
excessive amount of ink buildup on the plates when the press was running at this slow
speed. As it was mentioned at the beginning of this chapter, the combination of a large
impression cylinder repeat and a slow turning speed caused excessive ink accumulation
on the plates.
Further analysis was performed when studying the type of blocking according to
the contact position between the samples. Table 23 describes the type of blocking (if any)
that these samples experienced. Numbers in the table represent the quantity of samples
that were identified with a specific blocking type.
Table 23: Type of blocking (Traditional Print Run).
Blocking Type 50 fpm 100 fpm 150 fpm 200 fpm 250 fpm 300 fpm
Ink to Ink 7 7 6 2 3 5
Ink to Back 12 16 18 17 23 19
Ink to Ink/Ink to Back 1 1 4 8 6 7
Back to Back 0 0 0 0 0 0
Ink to Wood 0 0 1 0 0 1
No Blocking 16 12 7 9 4 4
Total Samples 36 36 36 36 36 36
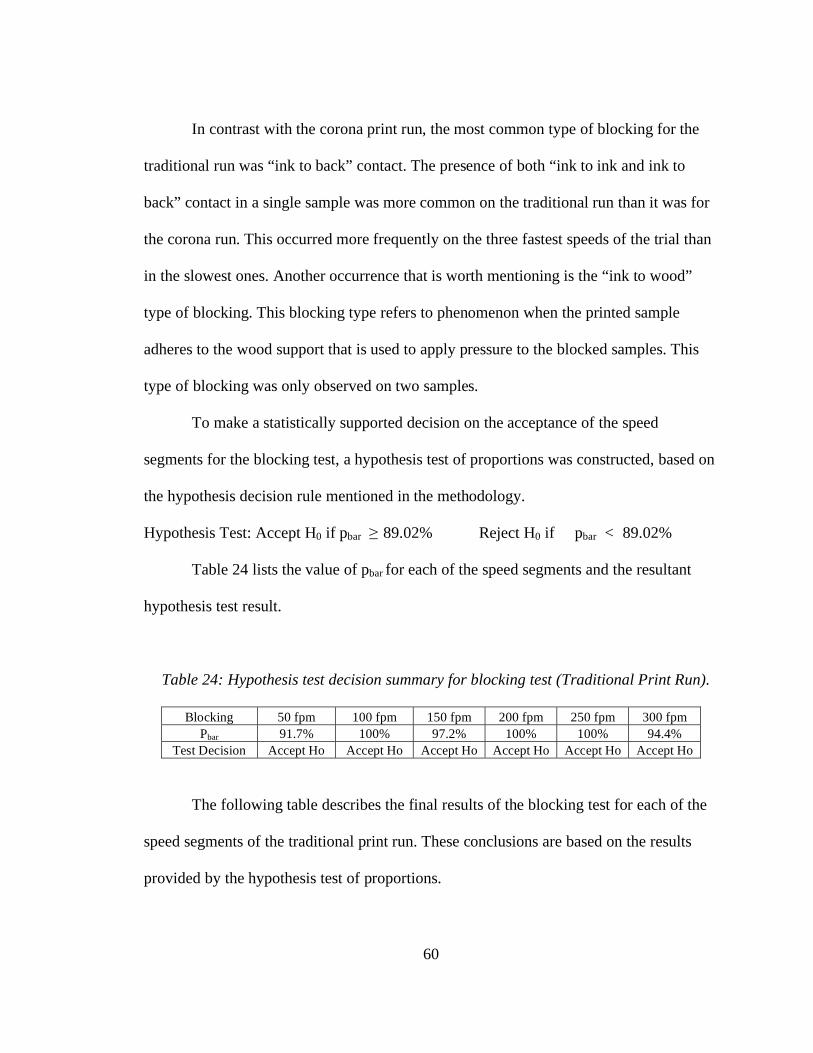
60
In contrast with the corona print run, the most common type of blocking for the
traditional run was “ink to back” contact. The presence of both “ink to ink and ink to
back” contact in a single sample was more common on the traditional run than it was for
the corona run. This occurred more frequently on the three fastest speeds of the trial than
in the slowest ones. Another occurrence that is worth mentioning is the “ink to wood”
type of blocking. This blocking type refers to phenomenon when the printed sample
adheres to the wood support that is used to apply pressure to the blocked samples. This
type of blocking was only observed on two samples.
To make a statistically supported decision on the acceptance of the speed
segments for the blocking test, a hypothesis test of proportions was constructed, based on
the hypothesis decision rule mentioned in the methodology.
Hypothesis Test: Accept H0 if pbar 89.02% Reject H0 if pbar < 89.02%
Table 24 lists the value of pbar for each of the speed segments and the resultant
hypothesis test result.
Table 24: Hypothesis test decision summary for blocking test (Traditional Print Run).
Blocking 50 fpm 100 fpm 150 fpm 200 fpm 250 fpm 300 fpm
Pbar 91.7% 100% 97.2% 100% 100% 94.4%
Test Decision Accept Ho Accept Ho Accept Ho Accept Ho Accept Ho Accept Ho
The following table describes the final results of the blocking test for each of the
speed segments of the traditional print run. These conclusions are based on the results
provided by the hypothesis test of proportions.
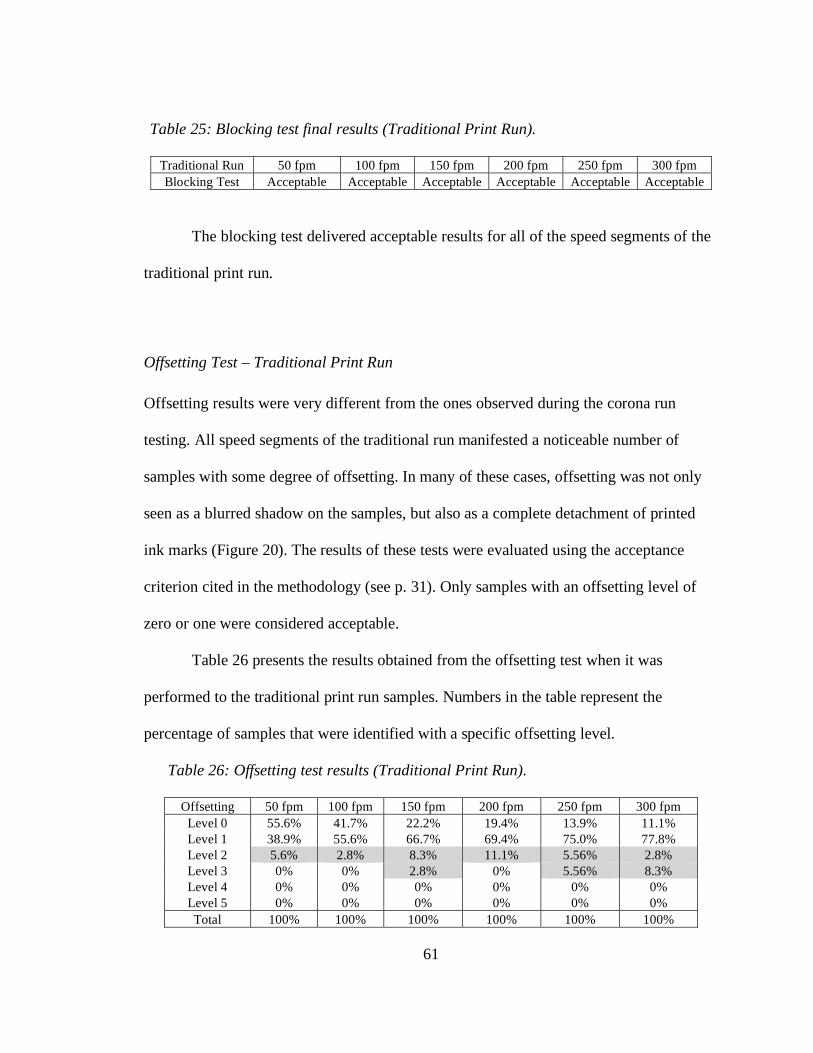
61
Table 25: Blocking test final results (Traditional Print Run).
Traditional Run 50 fpm 100 fpm 150 fpm 200 fpm 250 fpm 300 fpm
Blocking Test Acceptable Acceptable Acceptable Acceptable Acceptable Acceptable
The blocking test delivered acceptable results for all of the speed segments of the
traditional print run.
Offsetting Test – Traditional Print Run
Offsetting results were very different from the ones observed during the corona run
testing. All speed segments of the traditional run manifested a noticeable number of
samples with some degree of offsetting. In many of these cases, offsetting was not only
seen as a blurred shadow on the samples, but also as a complete detachment of printed
ink marks (Figure 20). The results of these tests were evaluated using the acceptance
criterion cited in the methodology (see p. 31). Only samples with an offsetting level of
zero or one were considered acceptable.
Table 26 presents the results obtained from the offsetting test when it was
performed to the traditional print run samples. Numbers in the table represent the
percentage of samples that were identified with a specific offsetting level.
Table 26: Offsetting test results (Traditional Print Run).
Offsetting 50 fpm 100 fpm 150 fpm 200 fpm 250 fpm 300 fpm
Level 0 55.6% 41.7% 22.2% 19.4% 13.9% 11.1%
Level 1 38.9% 55.6% 66.7% 69.4% 75.0% 77.8%
Level 2 5.6% 2.8% 8.3% 11.1% 5.56% 2.8%
Level 3 0% 0% 2.8% 0% 5.56% 8.3%
Level 4 0% 0% 0% 0% 0% 0%
Level 5 0% 0% 0% 0% 0% 0%
Total 100% 100% 100% 100% 100% 100%
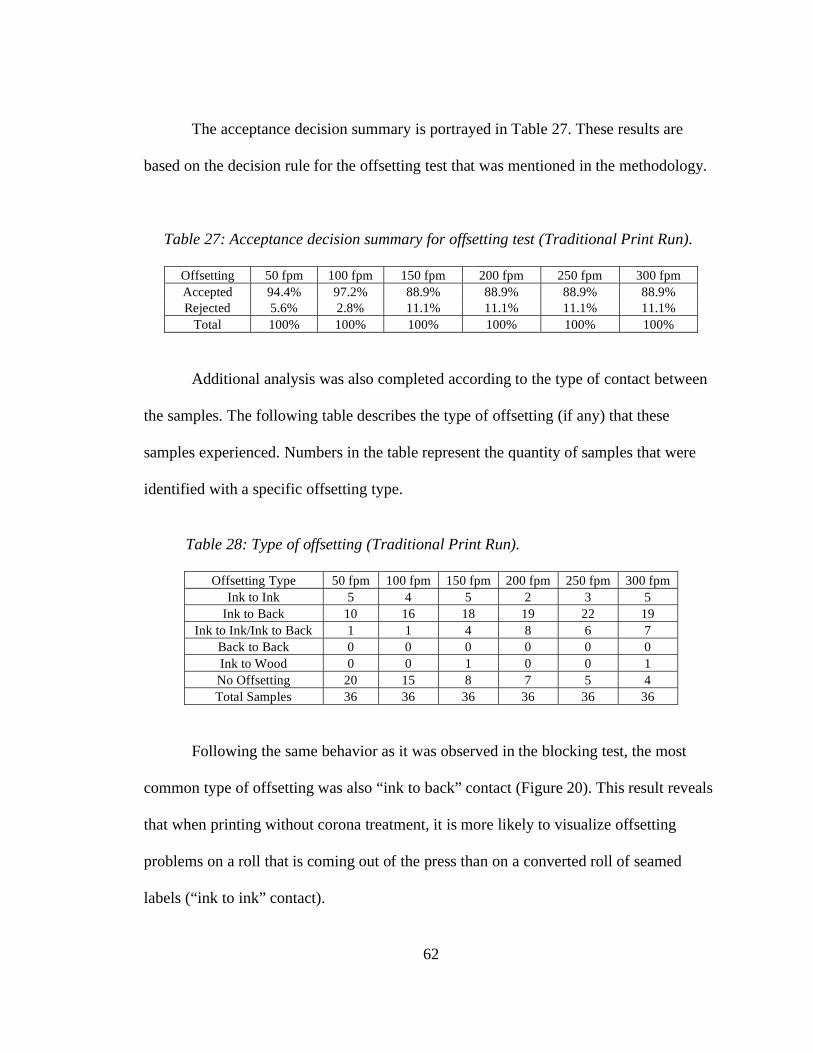
62
The acceptance decision summary is portrayed in Table 27. These results are
based on the decision rule for the offsetting test that was mentioned in the methodology.
Table 27: Acceptance decision summary for offsetting test (Traditional Print Run).
Offsetting 50 fpm 100 fpm 150 fpm 200 fpm 250 fpm 300 fpm
Accepted 94.4% 97.2% 88.9% 88.9% 88.9% 88.9%
Rejected 5.6% 2.8% 11.1% 11.1% 11.1% 11.1%
Total 100% 100% 100% 100% 100% 100%
Additional analysis was also completed according to the type of contact between
the samples. The following table describes the type of offsetting (if any) that these
samples experienced. Numbers in the table represent the quantity of samples that were
identified with a specific offsetting type.
Table 28: Type of offsetting (Traditional Print Run).
Offsetting Type 50 fpm 100 fpm 150 fpm 200 fpm 250 fpm 300 fpm
Ink to Ink 5 4 5 2 3 5
Ink to Back 10 16 18 19 22 19
Ink to Ink/Ink to Back 1 1 4 8 6 7
Back to Back 0 0 0 0 0 0
Ink to Wood 0 0 1 0 0 1
No Offsetting 20 15 8 7 5 4
Total Samples 36 36 36 36 36 36
Following the same behavior as it was observed in the blocking test, the most
common type of offsetting was also “ink to back” contact (Figure 20). This result reveals
that when printing without corona treatment, it is more likely to visualize offsetting
problems on a roll that is coming out of the press than on a converted roll of seamed
labels (“ink to ink” contact).
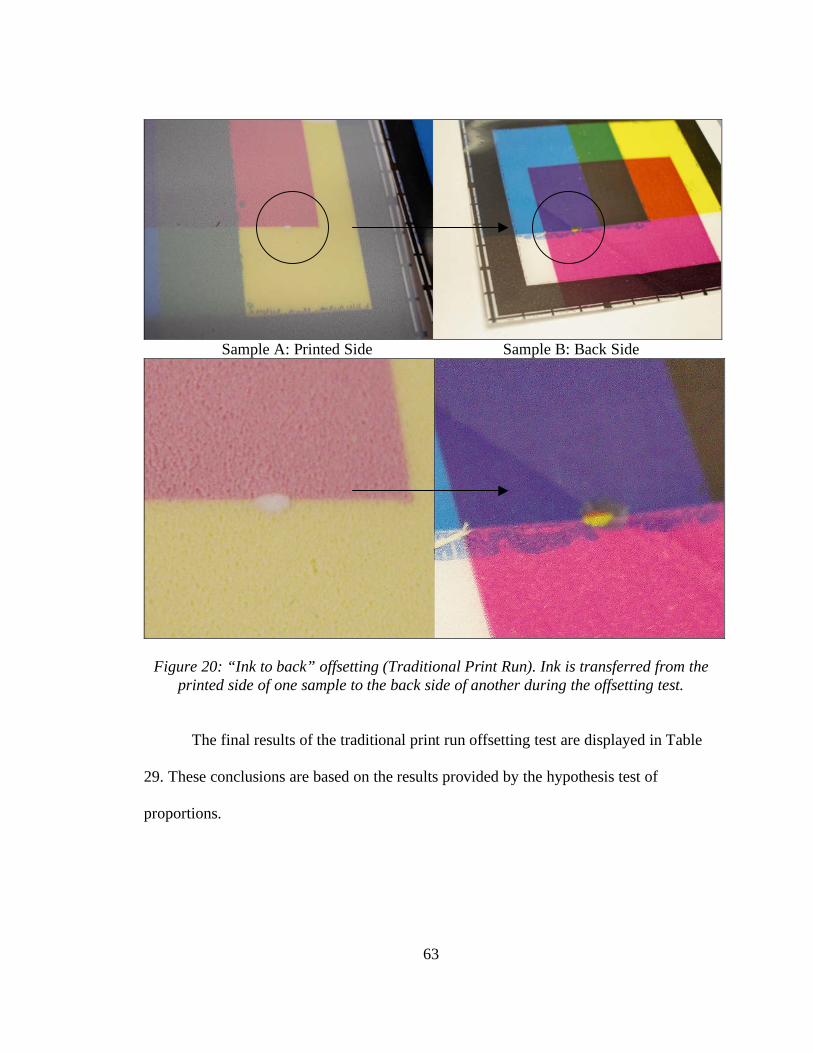
63
Sample A: Printed Side Sample B: Back Side
Figure 20: “Ink to back” offsetting (Traditional Print Run). Ink is transferred from the
printed side of one sample to the back side of another during the offsetting test.
The final results of the traditional print run offsetting test are displayed in Table
29. These conclusions are based on the results provided by the hypothesis test of
proportions.
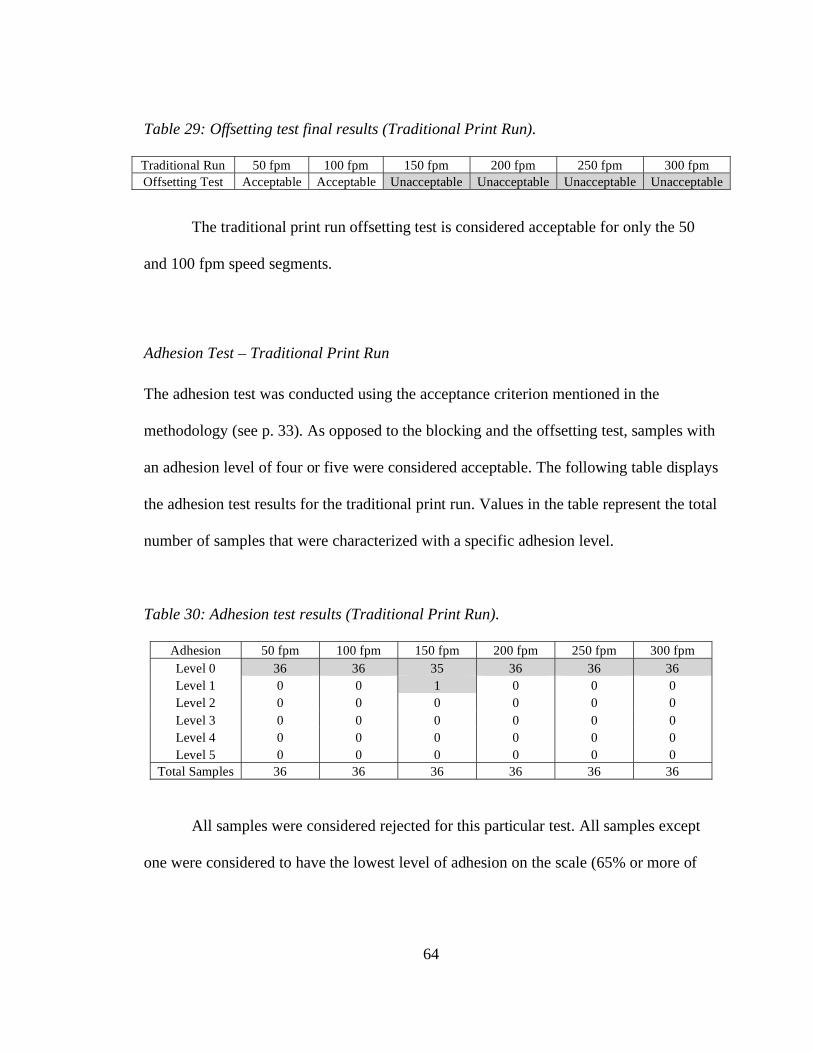
64
Table 29: Offsetting test final results (Traditional Print Run).
Traditional Run 50 fpm 100 fpm 150 fpm 200 fpm 250 fpm 300 fpm
Offsetting Test Acceptable Acceptable Unacceptable Unacceptable Unacceptable Unacceptable
The traditional print run offsetting test is considered acceptable for only the 50
and 100 fpm speed segments.
Adhesion Test – Traditional Print Run
The adhesion test was conducted using the acceptance criterion mentioned in the
methodology (see p. 33). As opposed to the blocking and the offsetting test, samples with
an adhesion level of four or five were considered acceptable. The following table displays
the adhesion test results for the traditional print run. Values in the table represent the total
number of samples that were characterized with a specific adhesion level.
Table 30: Adhesion test results (Traditional Print Run).
Adhesion 50 fpm 100 fpm 150 fpm 200 fpm 250 fpm 300 fpm
Level 0 36 36 35 36 36 36
Level 1 0 0 1 0 0 0
Level 2 0 0 0 0 0 0
Level 3 0 0 0 0 0 0
Level 4 0 0 0 0 0 0
Level 5 0 0 0 0 0 0
Total Samples 36 36 36 36 36 36
All samples were considered rejected for this particular test. All samples except
one were considered to have the lowest level of adhesion on the scale (65% or more of
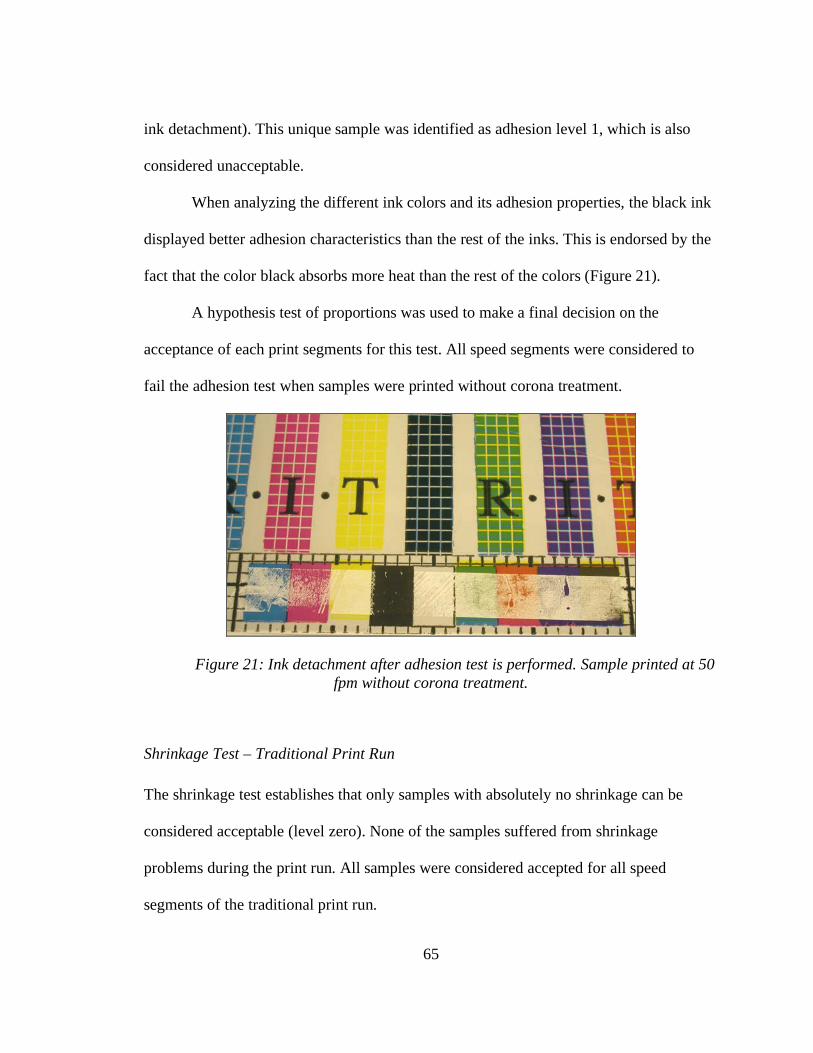
65
ink detachment). This unique sample was identified as adhesion level 1, which is also
considered unacceptable.
When analyzing the different ink colors and its adhesion properties, the black ink
displayed better adhesion characteristics than the rest of the inks. This is endorsed by the
fact that the color black absorbs more heat than the rest of the colors (Figure 21).
A hypothesis test of proportions was used to make a final decision on the
acceptance of each print segments for this test. All speed segments were considered to
fail the adhesion test when samples were printed without corona treatment.
Figure 21: Ink detachment after adhesion test is performed. Sample printed at 50
fpm without corona treatment.
Shrinkage Test – Traditional Print Run
The shrinkage test establishes that only samples with absolutely no shrinkage can be
considered acceptable (level zero). None of the samples suffered from shrinkage
problems during the print run. All samples were considered accepted for all speed
segments of the traditional print run.
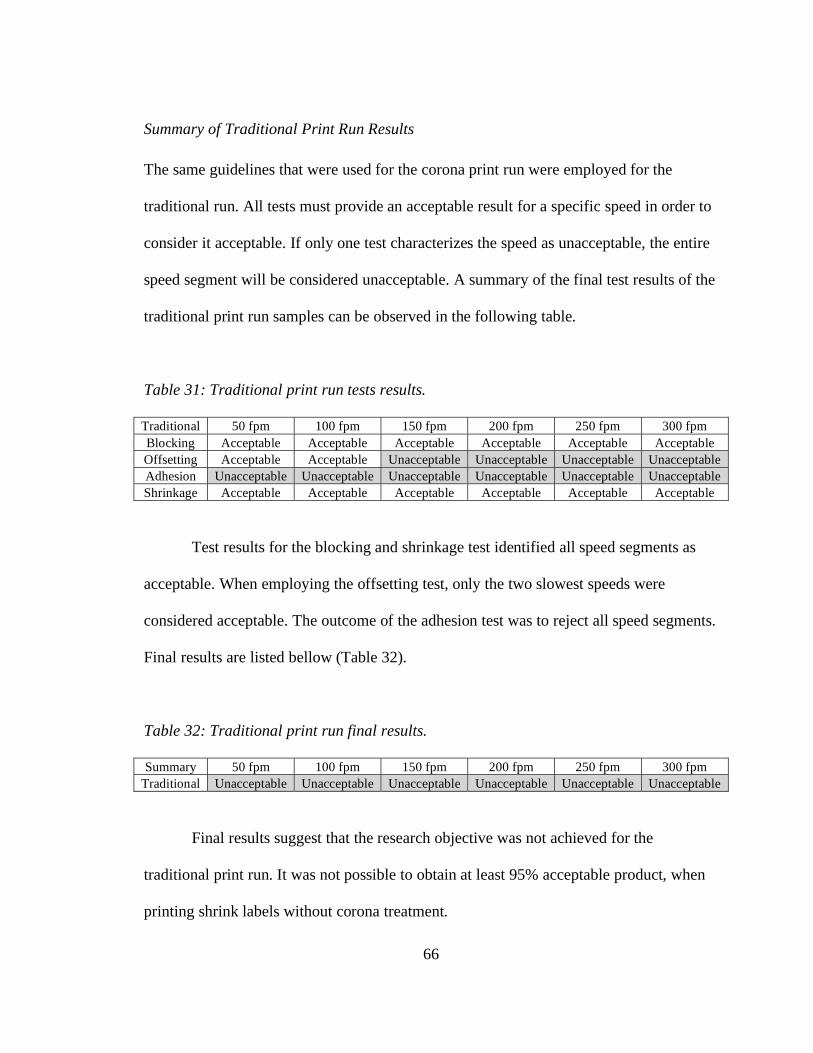
66
Summary of Traditional Print Run Results
The same guidelines that were used for the corona print run were employed for the
traditional run. All tests must provide an acceptable result for a specific speed in order to
consider it acceptable. If only one test characterizes the speed as unacceptable, the entire
speed segment will be considered unacceptable. A summary of the final test results of the
traditional print run samples can be observed in the following table.
Table 31: Traditional print run tests results.
Traditional 50 fpm 100 fpm 150 fpm 200 fpm 250 fpm 300 fpm
Blocking Acceptable Acceptable Acceptable Acceptable Acceptable Acceptable
Offsetting Acceptable Acceptable Unacceptable Unacceptable Unacceptable Unacceptable
Adhesion Unacceptable Unacceptable Unacceptable Unacceptable Unacceptable Unacceptable
Shrinkage Acceptable Acceptable Acceptable Acceptable Acceptable Acceptable
Test results for the blocking and shrinkage test identified all speed segments as
acceptable. When employing the offsetting test, only the two slowest speeds were
considered acceptable. The outcome of the adhesion test was to reject all speed segments.
Final results are listed bellow (Table 32).
Table 32: Traditional print run final results.
Summary 50 fpm 100 fpm 150 fpm 200 fpm 250 fpm 300 fpm
Traditional Unacceptable Unacceptable Unacceptable Unacceptable Unacceptable Unacceptable
Final results suggest that the research objective was not achieved for the
traditional print run. It was not possible to obtain at least 95% acceptable product, when
printing shrink labels without corona treatment.
67
Additional Print Runs
In addition to the corona and traditional print runs, three additional print trials were
performed. Two of the print trials were made using a set of primers intended to improve
ink adhesion. The third trial was done in a working pressroom environment in Caracas,
Venezuela.
Primer Print Runs
The objective of the primer print runs was to evaluate if a primer or coating could be used
to improve ink adhesion when printing shrink films without corona treatment. This
information can be considered valuable for converters that want to print shrink labels and
do not have a corona treatment unit installed on their flexo press.
Two different primers were employed, one was waterbased and the other one was
solvent based. These primers were supplied by two different vendors. The press was run
with settings similar to the traditional print run.
Samples were collected from both print runs and the adhesion test was performed.
Results were then compared to the traditional print run samples in order to evaluate if
there was a noticeable ink adhesion improvement. A final analysis portrayed that none of
the primers delivered a visible improvement of ink adhesion. Both primers showed
evidence that suggested a lack of compatibility with the PVC substrate.
To obtain better results in the future, a new research should monitor the
compatibility of the substrate, the primer and the inks that were used for this trial. A
68
careful study of these variables could deliver a new primer formulation that may improve
the adhesion of ink when printing shrink films without corona treatment.
Press Run in Venezuela
The researcher performed an independent trial in the field, in a working pressroom
environment in Caracas, Venezuela. The performance of this trial was intended to
correlate with results obtained from the main trial executed at RIT. The press run was
done using a six color, ten inch wide Mark Andy Scout press, which does not have a
corona treatment unit installed. The Scout is a compact narrow web flexo press designed
for pressure sensitive label printing. The researcher used the same ink system used for the
traditional and corona print run (Environmental Inks and Coatings, Aqua HS System) and
the same type of substrate (Klockner Pentaplast, Regular Shrink PVC) but it was forty
microns thick (instead of fifty).
The methodology for this trial was very similar to the one employed for the main
print runs. The operator ran the press from 50 fpm to 250 fpm and tests (adhesion,
shrinkage, blocking and offsetting test) were performed on a series of samples. Dryer
temperatures fluctuated between 110 °F and 120 °F. For this trial, the researcher printed a
shrink label that is currently commercialized in Venezuela.
Results obtained from this run were very similar to those gathered from the
traditional print run. Shrinkage issues were not observed during the print run; ink
adhesion failed completely for all of the press speeds; and blocking or offsetting issues
were only seen on samples printed from 150 fpm to 250 fpm.

69
Quality control personnel suggested that even though the labels were not
considered to have appropriate ink adhesion, their commercialization may be possible
since they did not show evidence of blocking or offsetting issues at speeds lower than
150 feet per minute.
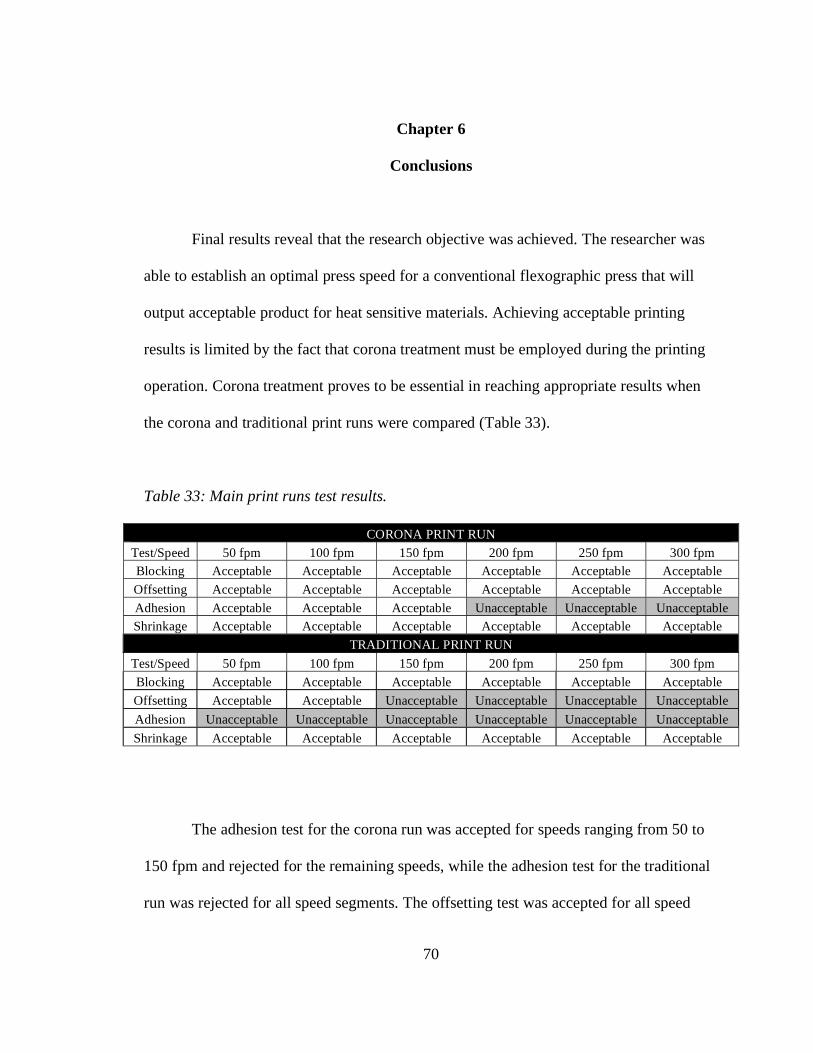
70
Chapter 6
Conclusions
Final results reveal that the research objective was achieved. The researcher was
able to establish an optimal press speed for a conventional flexographic press that will
output acceptable product for heat sensitive materials. Achieving acceptable printing
results is limited by the fact that corona treatment must be employed during the printing
operation. Corona treatment proves to be essential in reaching appropriate results when
the corona and traditional print runs were compared (Table 33).
Table 33: Main print runs test results.
CORONA PRINT RUN
Test/Speed 50 fpm 100 fpm 150 fpm 200 fpm 250 fpm 300 fpm
Blocking Acceptable Acceptable Acceptable Acceptable Acceptable Acceptable
Offsetting Acceptable Acceptable Acceptable Acceptable Acceptable Acceptable
Adhesion Acceptable Acceptable Acceptable Unacceptable Unacceptable Unacceptable
Shrinkage Acceptable Acceptable Acceptable Acceptable Acceptable Acceptable
TRADITIONAL PRINT RUN
Test/Speed 50 fpm 100 fpm 150 fpm 200 fpm 250 fpm 300 fpm
Blocking Acceptable Acceptable Acceptable Acceptable Acceptable Acceptable
Offsetting Acceptable Acceptable Unacceptable Unacceptable Unacceptable Unacceptable
Adhesion Unacceptable Unacceptable Unacceptable Unacceptable Unacceptable Unacceptable
Shrinkage Acceptable Acceptable Acceptable Acceptable Acceptable Acceptable
The adhesion test for the corona run was accepted for speeds ranging from 50 to
150 fpm and rejected for the remaining speeds, while the adhesion test for the traditional
run was rejected for all speed segments. The offsetting test was accepted for all speed
71
segments of the corona print run, but it was rejected for the traditional run when printing
with speeds ranging from 150 to 300 fpm. Both print runs returned identical results for
the blocking and the shrinkage test and were considered acceptable for all speed
segments of both print runs.
Results imply that a decrease of press speed will increase the chances of
improving ink adhesion but this will be limited to ink-substrate compatibility. The
outcome of the re-wetting test suggested that it is more likely to visualize re-wetting
issues during steam oven shrinkage when printed labels are suffering from adhesion
problems. When an ink has not been fully dried during the printing process it will be
more exposed to the effects of steam and therefore, more prone to revert back to a humid
state.
Final conclusions following the test results establish that shrink labels can be
printed on a conventional flexographic press as long as the press uses corona treatment
and that the maximum press speed does not exceed 150 fpm. Printing shrink films
without corona treatment should not be done since ink adhesion fails completely and
blocking and offsetting issues are visible when press speed reaches 150 fpm.
This results and conclusions are obviously limited by the conditions, equipment
and supplies employed during this investigation. Printing companies interested in
achieving similar results should adapt the methods and procedures employed during this
project to fit their own capabilities. It is possible that a printing company that
experiments with a different ink system or with a press equipped with more powerful
72
dryers may be able to output acceptable results at even a higher press speed than 150
fpm.
Recommendations For Further Studies
Future studies may be able to expand on interesting topics related to the development of
shrink label printing. A valuable study may concentrate on the formulation of a primer
that could improve ink adhesion when printing on a shrinkable substrate. This primer
may be able to be a substitute for corona treatment units for converters that lack this
equipment on their presses.
It would also be interesting to construct a mathematical model that may predict
the speed that a press needs to be operated at, to produce acceptable results when printing
shrink labels. This model may be constructed by employing simple physics where speed
equals distance divided by time. This equation in printing terms can be expressed as:
press speed equals dryer length divided by the time the web is exposed to the dryer (dwell
time). To calculate the required dwell time, it is necessary to study the amount of time
that a quantity of printed ink takes to dry when it is subjected to a given level of heat.
This model may be easily applied to any press by introducing variables such as the dryer
length and dryer temperatures.
Color management issues can also be explored. It would be valuable to study the
behavior of color during the shrinkage process. It is known that during the shrinkage
operation, the compression of the substrate may cause changes in color density. Since
results will vary depending on the level of shrinkage, this effect can cause uneven color
73
densities on different sections of the shrunken label. A future research project could be
able to produce a computer filter that could be applied to an artwork before it goes to
press. This filter may be able to compensate for unwanted changes in color density during
the shrinkage process.
These topic recommendations are just a few ideas for future studies that will help
converters understand the science behind shrink label printing. Expanding the knowledge
of this subject will guarantee a more efficient operation for converters and a better
product for their customers.

74
Bibliography
75
Bibliography
Alfaro, J. (2004). Mitsubishi Polyester Films. Label Expo Americas Conferences. Chicago, September 15, 2004.
ASTM D 2793-99 (2003). Standard Test Method for Block Resistance of Organic
Coatings on Wood Panel. ASTM International.
ASTM D 3359-02 (2002). Standard Test Methods for Measuring Adhesion by Tape Test.
ASTM International. ASTM F 2252-03 (2003). Standard Test Methods for Measuring Adhesion by Tape Test.
ASTM International. Behar, H. (2001). The Great Beverage Cover-Up. Beverage World, 120(1706), 75-78. Bisset, D.E., Goodacre, C., Idle, H.A., Leach, R.H. &Williams, C.H. (Eds.) (1979). The
Printing Ink Manual (3rd ed.). London, England: Northwood Publications. Brown, R. (2004a). Shrink-Sleeve: A Flexo Fit. Flexo, 29(8), 52-54. Brown, R. (2004b). OPS Shrink Labeling. Label Expo Americas Conferences. Chicago,
September 15, 2004. Chung, R. & Shimamura, Y. (2001, September). Conducting a Press Run Analysis.
Presented at the IARIGAI Research Conference, Montreal, Canada. Retrieved October 4, 2004, from http://www.rit.edu/~rycppr
Defosse, M. (2004). Guidance to PET bottlers: no more OPS shrink sleeves. Modern
Plastics International. Retrieved November 20, 2004, http://modplas.com/search/
76
search_article.php?searchfile=/2004/textfiles/worldtour/worldtour04012004_05.html
Fairley, M. (2004). Encyclopedia Of Labels and Label Technology. London, England:
Tarsus Publishing Ltd. Flexographic Ink: A Process Approach (1998). Ronkonkoma, NY: Flexographic
Technical Association. Flexography: Principles and Practices (1980). Huntington Station, NY: Flexographic
Technical Association. Flexography: Principles and Practices (1999). Ronkonkoma, NY: Flexographic
Technical Association. Forcino, H. (2002). Benefits Package: Digital Printing For Packaging. Brand, (6), 30-39. Gates, G. (2002). Shrink-sleeve perfection. Flexographic Technical Association.
Retrieved October 20, 2003, from http://www.flexography.org/ flexo/article.cfm?ID=49
Gates, G. (2004). Shrink Sleeve Labeling. Label Expo Americas Conferences. Chicago,
September 15, 2004. Genuario, L. (2004). Shrink Films. Label And Narrow Web. Retrieved November 23,
2004, from http://www.labelandnarrowweb.com/May041.htm George, J. (2004). Avoid Mistakes, Maximize Equity In Converting To a Shrink Label.
Brand Packaging, 8(2), 25-27. Hall, I. (1999). Labels and labeling: a literature review (2nd ed.). Leatherhead, Surrey,
England: Pira International.
77
Keith, H. (2004). Opportunities in Shrink & Stretch Labels 2008. Label Expo Americas
Conferences. Chicago, September 15, 2004. Kelsey, R. (1989). Packaging In Today’s Society (3rd ed.). Lancaster, PA: Technomic
Publishing Company. Kilbo, J. (2004). UV Shrink-Sleeve Printing. Flexo, 29(2), 34-36. Kipphan, H. (2001). Handbook of Print Media. Heidelberg, Germany: Springer. Leaversuch, R. (2002). Full-Body Labels Brighten Face Of Blow Molding. Plastics
Technology. 48(8), 38-43. Linsky, D. (1977). Flexographic Technical Association. Report Of The Proceedings. 19
th
Annual Meeting and Technical Forum. Jericho, NY: Flexographic Technical Association Incorporated.
Machleder, B. (2004). Solvents. Comco Educator Seminar: Shrink Sleeve Labeling For
Profits. Cincinnati, OH. April 7, 2004. Mans, J. (2002). Fancy Labeling Spiffs Up Lawn & Garden Lines. Packaging Digest,
39(4), 36-37. Matos, R. (2004). Latest Technology For Shrink Label Converting. Comco Educator
Seminar: Shrink Sleeve Labeling For Profits. Cincinnati, OH. April 7, 2004. Moran, R. (2003, January). Extreme Type And Edgy Graphics. Flexographic Technical
Association. Retrieved October 20, 2003, from http://www.flexography.org /flexo/article.cfm?ID=53 Mullen, J. (2004). Films For Shrink Sleeve Labels. Label Expo Americas Conferences.
Chicago, September 15, 2004.
78
Mykytiuk, A. (2001). Ready, Set, Explode. Flexible Packaging Magazine, January, 2001. Narrow Web Printing By Flexography (1973). Jericho, NY: Flexographic Technical
Association. Niemuth, D. (2004). Shrink Sleeve Application and Shrinking Systems. Label Expo
Americas Conferences. Chicago, September 15, 2004. Ryback, R. (2004). Technical Advancements In Shrink Sleeve Converting Equipment.
Label Expo Americas Conferences. Chicago, September 15, 2004. Schollmeyer, G. (2003). Between-Color Deck Dryers: Regular Maintenance Is Critical
To Press Operation. Flexo, 28(4), 24-26. Shaping The Future Of Packaging (2000). Retrieved October 20, 2004, from
http://www.comcointl.com/news90.htm Sharon, K. (2003). The Growing Shrink Label. Package Printing, 50(9), 55. Sharon, K. (2004). Amazing Shrink Inks. Package Printing, 51(4), 42-44. Stobbe, B. (1999). Beginning Flexographer: This Is Corona Treating. Flexo, 24(2), 60-65. Todd, R. (1994). Printing Inks. Surrey, England: Pira International. Wingate, P. (2004). Shrink Films for Labels. Label Expo Americas Conferences.
Chicago, September 15, 2004. Wolf, R. (2001). Corona Treating and The Printing Process. Flexo, 26(6), 58-59.