a study of the physical properties of single crystalline...
TRANSCRIPT

Seediscussions,stats,andauthorprofilesforthispublicationat:https://www.researchgate.net/publication/281262428
AstudyofthephysicalpropertiesofsinglecrystallineFe5B2P
ARTICLEinJOURNALOFMAGNETISMANDMAGNETICMATERIALS·AUGUST2015
ImpactFactor:1.97·DOI:10.1016/j.jmmm.2015.10.088·Source:arXiv
CITATIONS
2
READS
46
6AUTHORS,INCLUDING:
TejLamichhane
IowaStateUniversity
6PUBLICATIONS7CITATIONS
SEEPROFILE
SrinivasaThimmaiah
IowaStateUniversity
43PUBLICATIONS320CITATIONS
SEEPROFILE
D.S.Parker
OakRidgeNationalLaboratory
84PUBLICATIONS740CITATIONS
SEEPROFILE
SergeyL.Bud'ko
IowaStateUniversity
819PUBLICATIONS16,777CITATIONS
SEEPROFILE
Allin-textreferencesunderlinedinbluearelinkedtopublicationsonResearchGate,
lettingyouaccessandreadthemimmediately.
Availablefrom:SergeyL.Bud'ko
Retrievedon:09March2016

A study of the physical properties of single crystalline Fe5B2P.
Tej N Lamichhanea,b, Valentin Taufourb, Srinivasa Thimmaiahb, David S. Parkerc, Sergey L. Bud’koa,b, Paul C. Canfielda,b
aDepartment of Physics and Astronomy, Iowa State University, Ames, Iowa 50011, U.S.A.bAmes Laboratory, Iowa State University, Ames, Iowa 50011, U.S.A.
cMaterials Science and Technology Division, Oak Ridge National Laboratory, Oak Ridge, TN 37831
Abstract
Single crystals of Fe5B2P were grown by self-flux growth technique. Structural and magnetic properties are studied. The Curietemperature of Fe5B2P is determined to be 655 ± 2 K. The saturation magnetization is determined to be 1.72 µB/Fe at 2 K. Thetemperature variation of the anisotropy constant K1 is determined for the first time, reaching ∼ 0.50 MJ/m3 at 2 K, and it iscomparable to that of hard ferrites. The saturation magnetization is found to be larger than the hard ferrites. The first principlecalculations of saturation magnetization and anisotropy constant are found to be consistent with the experimental results.
Keywords: single crystal, magnetization, demagnetization factor, Arrott plot, transition temperature, anisotropy constant
1. Introduction
The existence of the ternary Fe5B2P phase was first reportedin 1962[1, 2]. Both references reported the detailed structuralinformation and the Curie temperature for the Fe5B2P phase.Its structural prototype is tetragonal Cr5B3 with the space groupDls
4h− I4/mcm. The Curie temperature was reported to fall be-
tween 615 K to 639 K, depending upon the B content. In 1967,another study reported a Curie temperature of 628 K and a satu-ration magnetization of 1.73 µB/Fe [3]. The Fe5B2P phase wasalso studied using Mossbauer spectroscopy and X-ray diffrac-tion in 1975 [4]. In addition to confirming the Curie tempera-ture range as well as the average saturation magnetic momentper Fe atom, the Mossbauer study identified the average mo-ment contributed by each of the Fe lattice sites in the Fe5B2Punit cell. The Fe(2) (or 4c) sites contribute 2.2 µB/Fe. The Fe(1)(or 16l) sites contribute 1.6 µB/Fe. The average extrapolatedmoment of the both sites at 0 K was reported to be 1.73 µB/Fe.
Fe5B2P is specifically interesting as a possible high transi-tion temperature, rare earth free, hard ferromagnetic material.Given that all prior work on Fe5B2P was made on polycrys-talline samples, we developed a single crystal growth proto-col, measured thermodynamic and transport properties of singlecrystalline samples, and determined the magnetic anisotropy ofthis material. The anisotropy constant K1 is positive, indicatingthat the c axis is the easy axis of magnetization, and has a com-parable size and temperature dependence as hard ferrites suchas SrFe12O19 and BaFe12O19.
2. Experimental Details
2.1. Crystal growth
As part of our effort to search for new, or poorly charac-terized ferromagnetic compounds, we have developed singlecrystal growth protocols for transition metal rich, chalcogenide
and pnictide binary and ternary phases. In a manner similar tosome of our earlier transition metal - sulphur work, [5, 6] westarted by confirming our ability to contain Fe-P binary meltsin alumina crucibles sealed in amorphous silica ampules. Asoutlined by Canfield and Fisk [7] and Canfield, [8] sealed am-poules were decanted after slow cooling by use of a centrifuge.Crucibles with alumina filters [9] were used to allow assessmentand even reuse of the decanted liquid. For this experiment, amixture of freshly ball milled iron powder and red phosphorouslumps were placed in an alumina crucible in an atomic ratioof Fe : P= 0.83 : 0.17. A homogenous liquid exists at 1060 °C(i.e. there was no crystal growth upon cooling from 1200 °C to1060 °C and all of the material decanted). For similar tempera-ture profiles, an initial melt of Fe0.86P0.14 lead to the growth ofdendritic Fe whereas for initial melts of Fe0.81P0.19, Fe0.79P0.21
and Fe0.77P0.23 faceted Fe3P was grown. These data are all con-sistent with the binary phase diagram [10] and indicate that theFe-P binary melt does not have a significant partial pressure ofphosphorous and does not react with alumina.
Silica ampoule
Growth crucible
Alumina filter
Catch crucible
Top buffer
quartz wool
Bottom buffer
quartz wool
Boron pieces
Red P lumps
Fe powder
Figure 1: A schematic assembly of the crystal growth ampoule.
After some optimization, an initial stoichiometry of
Preprint submitted to Elsevier August 25, 2015
arX
iv:1
508.0
5629v1 [c
ond-m
at.m
trl-
sci]
23 A
ug 2
015

(c)
(a)
(b)
[100] [001]
Figure 2: (a) The acid etched single crystals image of Fe5B2P (b) Laue patternalong the hard axis [100] and (c) Laue pattern along the easy axis [001] ofmagnetization.
Fe72P18B10 was used to grow single phase Fe5B2P plates. Ballmilled Fe (Fe lumps obtained from Ames lab), red phospho-rous lumps (Alfa Aesar, 99.999% (metal basis)), and crystallineboron pieces (Alfa Aesar, 99.95%) were placed in an aluminacrucible / filter assembly, sealed in a partial pressure of Ar in anamorphous silica tube (as shown schematically in figure 1). Theampoule was heated over 3 hours to 250 °C, remained at 250 °Cfor 3 hours, heated to 1200 °C over 12 hours, held at 1200 °Cfor 10 hours, and then cooled to 1160 °C over 75 hours. Aftercooling to 1160 °C the ampoule was decanted using a centrifugeand plate like single crystals of Fe5B2P could be found on thegrowth side of the alumina filter. In order to confirm that thegrowth of crystals took place from a complete liquid, we de-canted one growth at 1200 °C, instead of cooling to 1160 °C,and indeed found all of the material decanted.
After growth, single crystals were cleaned by etching in aroughly 6 molar HCl solution. Figure 2(a) shows a picture ofthe etched single crystals.
2.2. Physical properties measurement
The crystal structure and lattice parameters of Fe5B2P weredetermined with both single crystal and powder x-ray diffrac-tion (XRD). The crystal structure of Fe5B2P was determinedfrom single-crystal XRD data collected with the use of graphitemonochromatized MoKα radiation (λ = 0.71073 Å) at roomtemperature on a Bruker APEX2 diffractometer. Reflectionswere gathered by taking four sets of 360 frames with 0.5 scansin ω, with an exposure time of 25 s per frame and the crystal-to-detector distance was 5 cm. The measured intensities werecorrected for Lorentz and polarization effects. The intensitieswere further corrected for absorption using the program SAD-ABS, as implemented in Apex 2 package [11].
For powder XRD, etched single crystals of Fe5B2P wereselected and finely powdered. The powder was evenly spreadover the zero background single crystal silicon wafer sampleholder with help of a thin film of Dow Corning high vacuumgrease. The powder diffraction pattern was recorded withRigaku Miniflex diffractrometer using copper Kα radiationsource over 8.5 hours (at a rate of 3 sec dwell time for per 0.01
to cover the 2θ value up to 100).
To identify the crystallographic orientation of the singlecrystal plates, Laue diffraction patterns were obtained using aMultiwire Laboratories, Limited spectrometer. The resistivitydata were measured in a four-probe configuration using aQuantum Design Magnetic Property Measurement System(MPMS) for temperature control and the external devicecontrol option to interface with a Linear Research, Inc. ac(20mA, 16 Hz) resistance bridge (LR 700).
The sample preparation for magnetization measurements is amajor step in a magnetic anisotropy study. The etched crystalwas cut into a rectangular prismatic shape and the dimensionswere determined with a digital Vernier caliper.
Temperature and field dependent magnetization was mea-sured using the MPMS up to room temperature and a QuantumDesign Versalab Vibration Sample Magnetometer (VSM) withan oven option for higher temperature (T < 1000 K). In MPMS,plastic straw was used to align the sample in desired directions.The sample was glued to the VSM sample heater stick with Zir-car cement obtained from ZIRCAR Ceramics Inc.. While glu-ing, the sample was pushed into the thin layer of Zircar pastespread on the heater stick to ensure a good thermal contact withthe heater stick. When the sample was firmly aligned with thedesired direction it was covered with Zircar cement uniformly.Finally, the VSM heater stick, with the sample glued on it, wascovered with a copper foil so as to (i) better control the heatradiation in the sample chamber, (ii) maintain a uniform tem-perature inside the wrapped foil (due to its good thermal con-ductivity), and (iii) further secure the sample throughout themeasurement.
In the VSM, both zero field cooled (ZFC) as well as fieldcooled (FC) magnetizations were measured and found to be al-most overlapping. The difference between the measured data inthe VSM and the MPMS was found to be less than 3% at 300 K(i.e. at the point of data overlap). We normalized the magneti-zation data from the MPMS with FC VSM data to get a smoothcurve for the corresponding applied field.
2.3. Determination of demagnetization factor for transition
temperature and anisotryopy constant measurement
The demagnetization factors along different directions weredetermined by using a formula developed by Aharoni [12]. Thecalculated demagnetization factors for the field along a, b, andc axes were determined to be 0.21, 0.29, and 0.50 respectively.To verify that demagnetization factors were accurate, we pre-pared a M2 versus H
Mplot for the lower temperature M(H) data
along the easy axis of magnetization as shown in figure 3. TheX-intercept gives the directly measured experimental value ofthe demagnetization factor along the easy magnetization axis[13]. In figure 3, we can clearly see that all the M2 curves areoverlapping near the M2 axis indicating that the demagnetiza-tion factor along the easy magnetization direction does not de-pend on temperature. A value of demagnetization factor of 0.45was determined along the c axis which is not that different fromthe value of 0.50 inferred from the sample dimensions. Based
2

0.0 0.5 1.0 1.5 2.0 2.50.0
2.0x10¹¹
4.0x10¹¹
6.0x10¹¹
8.0x10¹¹
1.0x10¹²
1.2x10¹²
M2 (
A/m
)2
H/M
Fe5B
2P
H || [001]
Demagnetization factor = 0.45
T = 2 K
T = 300 K
Figure 3: An analysis of M(H) isotherms taken at T = 2, 50, 100, 150, 200, 250,300 K and plotted as M2 versus H/M to determine the demagnetization factor.The H/M axis intercept at 0.45 is the experimental demagnetization factor foreasy axis of magnetization.
on this result, we readjusted the two hard axes demagnetizationfactors in proportion such that the total sum of all 3 of themis 1. The experimentally readjusted values for demagnetizationfactors were 0.231, 0.319 and 0.45 along a, b and c axes re-spectively. With the benefit of fourfold symmetry of Fe5B2Punit cell perpendicular to its c axis, magnetization was mea-sured along a and c axes and corresponding demagnetizationfactors were used to calculate the corrected internal magneticfield (Hint). Here Hint = Happlied − NM, where N is the demag-netization factor and M is the magnetization.
3. Results and discussion
IObserved
ICalculated
I background
40 60 80 1000
2000
4000
6000
34 36 38 40 42 44 460
250
500
750
Inte
nsity (
Counts
)
Fe5B
2P
1 2
(a)
Inte
nsity (
Counts
)
2 (degree)
12
(b)
Figure 4: (a) Powder x-ray diffraction pattern of Fe5B2P (b) Enlarged powderX-ray diffraction pattern in between 2θ value of 34 to 46 to show the weakimpurity peaks 1 and 2.
3.1. Lattice parameters determination
The structure solution and refinement for single crystal datawas carried out using SHELXTL program package [14]. Thefinal stage of refinement was performed using anisotropicdisplacement parameters for all the atoms. The refined com-position was Fe5B2.12P0.88(1) with residual R1 = 2.3% (alldata). The off-stoichiometry was due to partial replacementof phosphorus by boron on 4a site in the structure. Accord-ing to the previous report [4] Fe5B2P shows a considerablephase width. All the details about the atomic positions, siteoccupancy factors, and displacement parameters for crystal ofFe5B2.12P0.88(1) are given in tables 1, and 2.
Table 1: Crystal data and structure refinement for Fe5B2P.
Empirical formula Fe5B2.12P0.88
Formula weight 329.42Temperature 293(2) KWavelength 0.71073 ÅCrystal system, space group Tetragonal, I4/mcm
Unit cell dimensions a=5.485(3) Åb = 5.485(3) Åc = 10.348(6) Å
Volume 311.3(4) 103 Å3
Z, Calculated density 4, 7.029 g/cm3
Absorption coefficient 22.905 mm−1
F(000) 615Crystal size 0.01 x 0.05 x 0.08 mm3
θ range () 3.938 to 31.246Limiting indices −7 ≤ h ≤ 7
−7 ≤ k ≤ 7−14 ≤ l ≤ 14
Reflections collected 2113Independent reflections 152 [R(int) = 0.0433]Completeness to θ = 25.242 100.00%Absorption correction multi-scan, empiricalRefinement method Full-matrix least-squares
on F2
Data / restraints / parameters 152 / 0 / 17Goodness-of-fit on F2 1.101Final R indices [I> 2σ(I)] R1 = 0.0140, wR2 = 0.0289R indices (all data) R1 = 0.0180, wR2 = 0.0299Extinction coefficient 0.0243(3)Largest diff. peak and hole 0.485 and -0.474 e.Å−3
Fe5B2P has a tetragonal unit cell with lattice constantsa= 5.485 (3) Åand c = 10.348(3) Å. While analysing the pow-der pattern, the CIF file obtained from single crystal data wasused and the powder pattern was fitted with Rietveld analysisusing GSAS EXPGUI software package [15, 16]. During theRietveld analysis, Fe sites were supposed to be fully occupiedand thermally rigid whereas P and B occupation number werereleased between each other with help of constraints. Finally, awell fitted powder diffraction pattern with Rp = 0.0828 was ob-
3
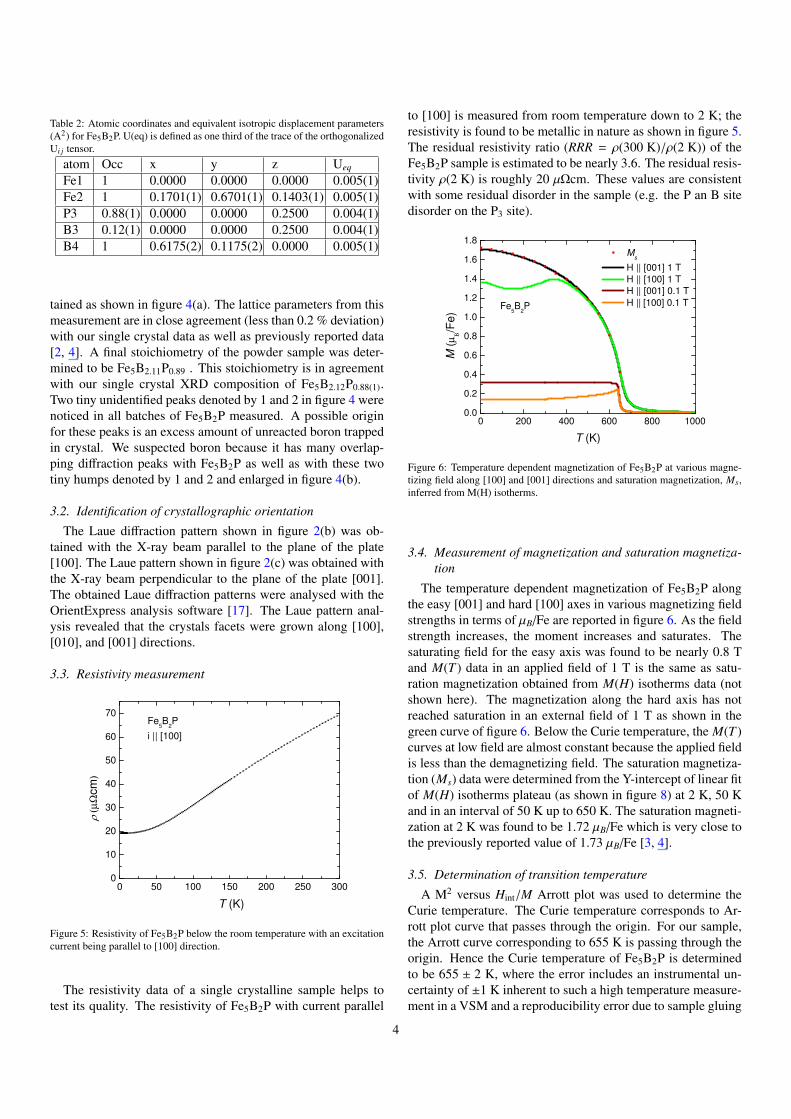
Table 2: Atomic coordinates and equivalent isotropic displacement parameters(A2) for Fe5B2P. U(eq) is defined as one third of the trace of the orthogonalizedUi j tensor.
atom Occ x y z Ueq
Fe1 1 0.0000 0.0000 0.0000 0.005(1)Fe2 1 0.1701(1) 0.6701(1) 0.1403(1) 0.005(1)P3 0.88(1) 0.0000 0.0000 0.2500 0.004(1)B3 0.12(1) 0.0000 0.0000 0.2500 0.004(1)B4 1 0.6175(2) 0.1175(2) 0.0000 0.005(1)
tained as shown in figure 4(a). The lattice parameters from thismeasurement are in close agreement (less than 0.2 % deviation)with our single crystal data as well as previously reported data[2, 4]. A final stoichiometry of the powder sample was deter-mined to be Fe5B2.11P0.89 . This stoichiometry is in agreementwith our single crystal XRD composition of Fe5B2.12P0.88(1).Two tiny unidentified peaks denoted by 1 and 2 in figure 4 werenoticed in all batches of Fe5B2P measured. A possible originfor these peaks is an excess amount of unreacted boron trappedin crystal. We suspected boron because it has many overlap-ping diffraction peaks with Fe5B2P as well as with these twotiny humps denoted by 1 and 2 and enlarged in figure 4(b).
3.2. Identification of crystallographic orientation
The Laue diffraction pattern shown in figure 2(b) was ob-tained with the X-ray beam parallel to the plane of the plate[100]. The Laue pattern shown in figure 2(c) was obtained withthe X-ray beam perpendicular to the plane of the plate [001].The obtained Laue diffraction patterns were analysed with theOrientExpress analysis software [17]. The Laue pattern anal-ysis revealed that the crystals facets were grown along [100],[010], and [001] directions.
3.3. Resistivity measurement
0 50 100 150 200 250 3000
10
20
30
40
50
60
70
(µ
Ωcm
)
T (K)
Fe5B
2P
i || [100]
Figure 5: Resistivity of Fe5B2P below the room temperature with an excitationcurrent being parallel to [100] direction.
The resistivity data of a single crystalline sample helps totest its quality. The resistivity of Fe5B2P with current parallel
to [100] is measured from room temperature down to 2 K; theresistivity is found to be metallic in nature as shown in figure 5.The residual resistivity ratio (RRR = ρ(300 K)/ρ(2 K)) of theFe5B2P sample is estimated to be nearly 3.6. The residual resis-tivity ρ(2 K) is roughly 20 µΩcm. These values are consistentwith some residual disorder in the sample (e.g. the P an B sitedisorder on the P3 site).
0 200 400 600 800 10000.0
0.2
0.4
0.6
0.8
1.0
1.2
1.4
1.6
1.8
Fe5B
2P
Ms
H || [001] 1 T
H || [100] 1 T
H || [001] 0.1 T
H || [100] 0.1 T
M (
µΒ/F
e)
T (K)
Figure 6: Temperature dependent magnetization of Fe5B2P at various magne-tizing field along [100] and [001] directions and saturation magnetization, Ms,inferred from M(H) isotherms.
3.4. Measurement of magnetization and saturation magnetiza-
tion
The temperature dependent magnetization of Fe5B2P alongthe easy [001] and hard [100] axes in various magnetizing fieldstrengths in terms of µB/Fe are reported in figure 6. As the fieldstrength increases, the moment increases and saturates. Thesaturating field for the easy axis was found to be nearly 0.8 Tand M(T ) data in an applied field of 1 T is the same as satu-ration magnetization obtained from M(H) isotherms data (notshown here). The magnetization along the hard axis has notreached saturation in an external field of 1 T as shown in thegreen curve of figure 6. Below the Curie temperature, the M(T )curves at low field are almost constant because the applied fieldis less than the demagnetizing field. The saturation magnetiza-tion (Ms) data were determined from the Y-intercept of linear fitof M(H) isotherms plateau (as shown in figure 8) at 2 K, 50 Kand in an interval of 50 K up to 650 K. The saturation magneti-zation at 2 K was found to be 1.72 µB/Fe which is very close tothe previously reported value of 1.73 µB/Fe [3, 4].
3.5. Determination of transition temperature
A M2 versus Hint/M Arrott plot was used to determine theCurie temperature. The Curie temperature corresponds to Ar-rott plot curve that passes through the origin. For our sample,the Arrott curve corresponding to 655 K is passing through theorigin. Hence the Curie temperature of Fe5B2P is determinedto be 655 ± 2 K, where the error includes an instrumental un-certainty of ±1 K inherent to such a high temperature measure-ment in a VSM and a reproducibility error due to sample gluing
4
0 2 4 6 80.0
5.0x10¹⁰
1.0x10¹¹
1.5x10¹¹
2.0x10¹¹
Tc = 655 K
Fe5B
2P
H || [001]
M
2 (
A/m
)2
Hint
/M
T = 648 K
T = 668 K
Figure 7: The Arrott plot of Fe5B2P. Here M(H) isotherms were measured forthe prismatic sample from 648 K to 668 K with a spacing of 1 K. Internalmagnetic field (Hint) was determined with an experimentally measured demag-netization factor (0.45) for the easy axis of magnetization. The temperaturecorresponding to M2 versus Hint/M isotherm passing through origin gives theCurie temperature. The Curie temperature is determined to be 655 ± 2 K.
process on the heater stick resulting in a variation in thermalcoupling. This Curie temperature is a little bit higher than thepreviously reported window of 615 K to 639 K [3, 4].
To make sure our measurement was correct, magnetization ofa piece of a nickel wire obtained from the Alfa Aesar company(99.98 % metal basis) was measured with the same VSM heaterstick. Using the criterion from reference [18], the Curie temper-ature of nickel sample was determined to be 625± 2 K which isin agreement with VSM Tech Note [19]. The Curie temperatureof nickel is reported to fall between 626 to 633 K [20]. Theseresults confirm the accuracy of measured Curie temperature.
0 1 2 30
200
400
600
800
1000
H || [001]
H || [100]
M (
kA
/m)
H
int (T)
Fe5B
2P
T = 300 K
Area = K1 = 0.38 MJ/m
3
Figure 8: An example of determination of K1 at 300 K with an appropriate axesunits so as to obtain the area in terms of MJ/m3 unit.
3.6. Determination of anisotropy constant K1
The anisotropy constant K1 is the measure of anisotropy en-ergy density and strongly depends on the unit cell symmetryand temperature. One of the conceptually simplest methods
of measuring the anisotropy constant of an uniaxial system isto determine the area between the easy and hard axes M(H)isotherms [21]. Here we measured both the easy and hard axesisothermal M(H) curves starting from 2 K. Then we measuredM(H) curves from 50 K to 800 K in 50 K intervals. A typicalexample of determination of the anisotropy constant by mea-suring the anisotropy area between two magnetization curves isshown in figure 8.
0 100 200 300 400 500 600 7000.0
0.1
0.2
0.3
0.4
0.5
0.6
Fe5B
2P
SrFe12
O19
BaFe12
O19
K1 (
MJ/m
3)
T (K)
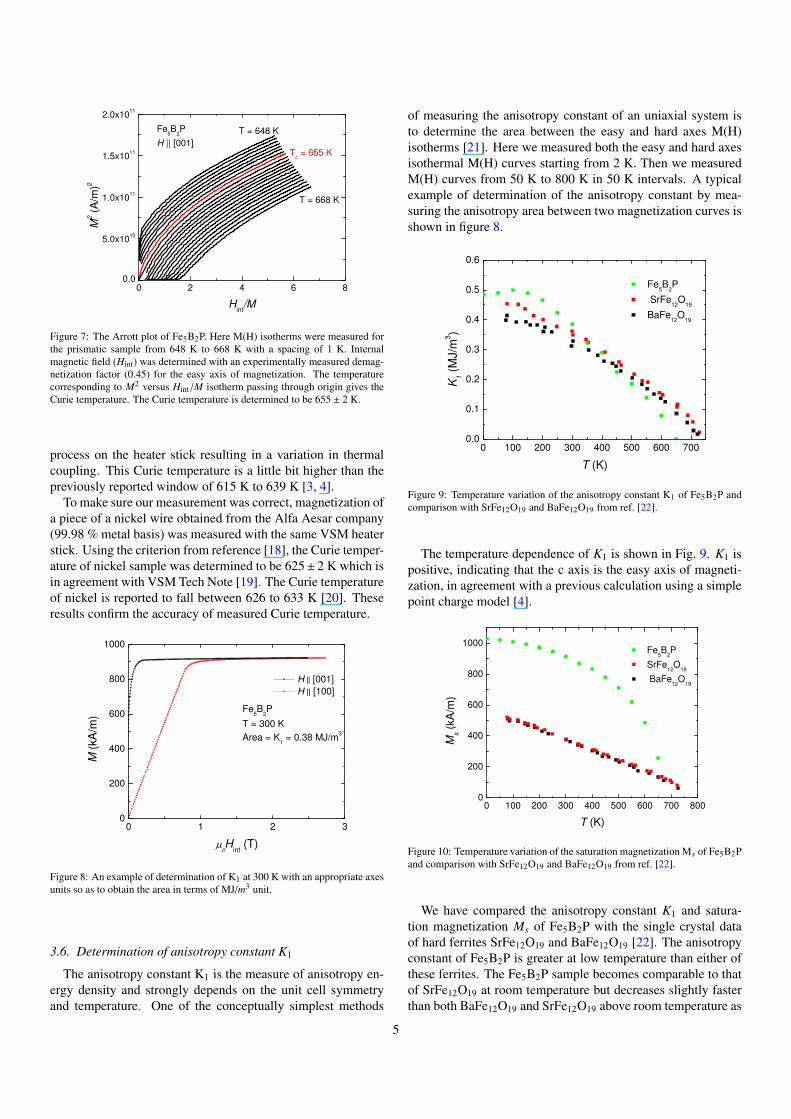
Figure 9: Temperature variation of the anisotropy constant K1 of Fe5B2P andcomparison with SrFe12O19 and BaFe12O19 from ref. [22].
The temperature dependence of K1 is shown in Fig. 9. K1 ispositive, indicating that the c axis is the easy axis of magneti-zation, in agreement with a previous calculation using a simplepoint charge model [4].
0 100 200 300 400 500 600 700 8000
200
400
600
800
1000 Fe
5B
2P
SrFe12
O19
BaFe12
O19
Ms (
kA
/m)
T (K)
Figure 10: Temperature variation of the saturation magnetization Ms of Fe5B2Pand comparison with SrFe12O19 and BaFe12O19 from ref. [22].
We have compared the anisotropy constant K1 and satura-tion magnetization Ms of Fe5B2P with the single crystal dataof hard ferrites SrFe12O19 and BaFe12O19 [22]. The anisotropyconstant of Fe5B2P is greater at low temperature than either ofthese ferrites. The Fe5B2P sample becomes comparable to thatof SrFe12O19 at room temperature but decreases slightly fasterthan both BaFe12O19 and SrFe12O19 above room temperature as
5

shown in figure 9. However, the nature of variation of the satu-ration magnetization of Fe5B2P is different than the hard ferritesas shown in figure 10. Both of the ferrites show a roughly lineardecrease of saturation magnetization with increasing tempera-ture whereas the saturation magnetization of Fe5B2P is foundto be significantly non-linear in T and also significantly largerfor T < 600 K. The saturation magnetization of Fe5B2P is1.53 µB/Fe at 300 K, which is already larger than the valueof 1.16 µB/Fe in SrFe12O19. Since Fe5B2P contains less non-magnetic elements, the volume magnetization of 915 kA/m forFe5B2P is more than twice that of SrFe12O19 (377 kA/m [22]).
4. First principles calculations
In an effort to understand the observed magnetic properties- in particular, the saturation magnetization and magnetocrys-talline anisotropy - of Fe5B2P, we have performed first prin-ciples calculations using the augmented plane-wave densityfunctional theory code WIEN2K [23] within the generalizedgradient approximation (GGA) of Perdew, Burke and Ernzer-hof [24]. Sphere radii of 1.77, 2.15 and 2.06 Bohr were used forB, Fe and P, respectively, and an RKmax of 7.0 was employed,where RKmax is the product of the smallest sphere radius andthe largest plane-wave expansion wave vector. The experimen-tal lattice parameters from Ref. [2] were used and all internalcoordinates were relaxed. All calculations, the internal coor-dinate relaxation excepted, employed spin-orbit coupling and atotal of approximately 10, 000 k-points in the full Brillouin zonewere used for the calculation of magnetic anisotropy. For thesecalculations we computed total energies for the magnetic mo-ments parallel to (100) and (001) and computed the anisotropyas the difference in these energies.
As in the experimental work we find a strong ferromag-netic behavior in Fe5B2P, with a saturation magnetic momentof 1.79 µB per Fe, which includes an average orbital momentof approximately 0.03 µB for each of the Fe sites. We presentthe calculated density-of-states in Fig. 11. The theoretical sat-uration value is in good agreement with the experimental 2 Kmoment of 1.72 µB per Fe. Small negative moments of −0.1 µB
and −0.06 µB per atom are found for the B and P atoms re-spectively, while the spin moments for the three distinct in-equivalent Fe atoms are 1.79, 1.79 and 2.08 µB. These aresignificantly smaller than the values for bcc Fe (approximately2.2 µB) and for the Fe atoms in hexagonal Fe3Sn (approxi-mately 2.4 µB/Fe [25]), limiting the potential performance as ahard magnetic material. Figure 11 displays the reason for this,with the spin-minority DOS substantially larger than the spin-majority DOS around the Fermi energy, reducing the moment.
As in the experiment, the calculated easy axis of the magne-tization is the c-axis, with a T = 0 value for the first anisotropyconstant K1 of 0.46 MJ/m3, which is in excellent agreementwith the experimental value of 0.48 MJ/m3. On a per-Fe ba-sis this is 44 µeV. This is much larger than the ∼ 1 µeV valuefor bcc Fe [26], as might be expected given the non-cubic sym-metry of Fe5B2P, but is roughly consistent with the 60 µeV/Covalue for hcp Co. This is again indicative of the usual require-ment of an anisotropic crystal structure for significant mag-
-5 -2.5 0 2.5 5E-E
F (eV)
-20
-15
-10
-5
0
5
10
15
20
N(E
) (s
tate
s/eV
/unit
cell
) totalBFe1Fe2P
Figure 11: The calculated density-of-states of Fe5PB2
netic anisotropy. Regarding the structure itself, in the per-fectly ordered Fe5B2P structure, eight of the ten Fe atoms havethree boron nearest neighbors and two next-nearest phospho-rus neighbors, with the other two Fe atoms having four boronnearest neighbors. There are no nearest-neighbor Fe-Fe bonds,which is perhaps surprising in a structure which is over 60atomic percent Fe. One may suppose that a variegated bond-ing configuration, with a range of atoms bonding with the Featoms, might be favorable for the magnitude, though not neces-sarily the sign (i.e. axial or planar) of the anisotropy, but this isapparently not realized in this material. In any case, the theoret-ical calculations are generally quite consistent with the resultsof the experimental work performed.
5. Conclusions
Single crystals of Fe5B2P were grown using a self fluxgrowth method within a 40 °C window of cooling. The Curietemperature of Fe5B2P was determined to be 655±2 K. The sat-uration magnetization was determined to be 1.72 µB/Fe at 2 K.The temperature variation of the anisotropy constant K1 was de-termined for the first time, reaching ∼ 0.50 MJ/m3 at 2 K, andfound to be comparable to that of hard ferrites. The saturationmagnetization, in unit of kA/m is found to be larger than thehard ferrites. The first principle calculation values of saturationmagnetization and anisotropy constant using augmented plane-wave density functional theory code were found to be consistentwith experimental work.
6. Acknowledgement
We thank T. Kong, U. Kaluarachchi, K. Dennis, and A. Sap-kota for useful discussion. The research was supported by theCritical Material Institute, an Energy Innovation Hub funded byU.S. Department of Energy, Office of Energy Efficiency and Re-newal Energy, Advanced Manufacturing Office. This work wasalso supported by the Office of Basic Energy Sciences, Materi-als Sciences Division, U.S. DOE. The first principle calculationof this work was performed in Oak Ridge National Laboratory.
6

References
[1] E. Fruchart, A.-M. Triquet, R. Fruchart, A. Michale, Two New Ferro-magnetic Compounds in the Ternary System Iron-Phosphorous-Boron (inFrench), Compt. Rend. Acad. Sci. Paris 255 (1962) 931–933.
[2] S. Rundqvist, X-Ray Investigation of the Ternary System Fe-P-B. SomeFeatures of the System Cr-P-B, Mn-P-B and Ni-P-B, Acta Chem. Scand.16 (1962) 1.
[3] A.-M. Blanc, E. Fruchart, R. Fruchart, Magnetic and CrystallographicStudies of the (Fe1−xCrx)3P Solution Solids and the Ferromagnetic PhaseFe5B2P (in French), Ann. Chim., t.2.
[4] L. Haggstrom, R. Wappling, E. Ericsson, Y. Andersson, S. Rundqvist,Mssbauer and X-ray studies of Fe5PB2, J. Solid State Chem.doi:10.1016/0022-4596(75)90084-5.
[5] X. Lin, S. L. Bud’ko, P. C. Canfield, Development of viable solutions forthe synthesis of sulfur bearing single crystals, Philos. Mag. 92 (19-21)(2012) 2436–2447. doi:10.1080/14786435.2012.671552.
[6] Q. Lin, V. Taufour, Y. Zhang, M. Wood, T. Drtina, S. L. Budko, P. C.Canfield, G. J. Miller, Oxygen trapped by rare earth tetrahedral clus-ters in Nd4FeOS6: Crystal structure, electronic structure, and magneticproperties, J. Solid State Chem. 229 (0) (2015) 41 – 48. doi:http:
//dx.doi.org/10.1016/j.jssc.2015.05.020.[7] P. C. Canfield, Z. Fisk, Growth of single crystals from metallic fluxes, Phi-
los. Mag. 65 (6) (1992) 1117–1123. arXiv:http://dx.doi.org/10.1080/13642819208215073, doi:10.1080/13642819208215073.
[8] P. C. Canfield, Solution Growth of Intermetallic Single Crystals: A Be-ginners Guide, Properties and Appl ications of Complex Intermetallics,(World Scientific, Singapore, 2010) (2010) 93–111.
[9] C. Petrovic, P. C. Canfield, J. Y. Mellen, Growing intermetallic singlecrystals using in situ decanting, Philos. Mag. 92 (19-21) (2012) 2448–2457. doi:10.1080/14786435.2012.685190.
[10] H. Ohtani, N. Hanaya, M. Hasebe, S. Teraoka, M. Abe, Fe-P Phase Dia-gram, ASM Alloy Phase Diagrams Database, P. Villars, editor-in-chief;H. Okamoto and K. Cenzual, section editors.URL http://www1.asminternational.org/AsmEnterprise/
APD,ASMInternational,MaterialsPark,OH,2006.
[11] Bruker, APEX-2, Bruker AXS Inc., Madison, Wisconsin, USA, 10th ed.(2013).
[12] A. Aharoni, Demagnetizing factors for rectangular ferromagnetic prisms,J. Appl. Phys. 83 (6) (1998) 3432–3434. doi:10.1063/1.367113.
[13] A. Arrott, Criterion for ferromagnetism from observations of magneticisotherms, Phys. Rev. 108 (1957) 1394–1396. doi:10.1103/PhysRev.108.1394.URL http://link.aps.org/doi/10.1103/PhysRev.108.1394
[14] SHELXTL-v2008/4, Bruker AXS Inc., Madison, Wisconsin, USA, 2013.[15] A. Larson, R. V. Dreele, ”General Structure Analysis System (GSAS)”,
Los Alamos National Laboratory Report LAUR (1994) 86–748.[16] B. H. Toby, EXPGUI, a graphical user interface for GSAS, J. Appl. Cryst.
34 (2001) 210–213.[17] J. laugier, B. Bochu, LMGP-Suite Suite of Programs for the interpreta-
tion of X-ray Experiments, ENSP/Laboratoire des Matriaux et du GniePhysique, BP 46. 38042 Saint Martin d’Hres, France.URL WWW:http://www.inpg.fr/LMGPandhttp://www.ccp14.ac.
uk/tutorial/lmgp/
[18] A. Arrott, J. E. Noakes, Approximate equation of state for nickel near itscritical temperature, Phys. Rev. Lett. 19 (1967) 786–789. doi:10.1103/PhysRevLett.19.786.URL http://link.aps.org/doi/10.1103/PhysRevLett.19.786
[19] Quantum Design, Tech Note 1097-202, Measured Curie Temperature ofthe VSM Oven Nickel Standard Sample .
[20] B. Legendre, M. Sghaier, Curie temperature of nickel, Journal of Ther-mal Analysis and Calorimetry 105 (1) (2011) 141–143. doi:10.1007/s10973-011-1448-2.URL http://dx.doi.org/10.1007/s10973-011-1448-2
[21] R. M. Bozorth, Determination of ferromagnetic anisotropy in single crys-tals and in polycrystalline sheets, Phys. Rev. 50 (1936) 1076–1081. doi:10.1103/PhysRev.50.1076.URL http://link.aps.org/doi/10.1103/PhysRev.50.1076
[22] B. T. Shirk, W. Bussem, Temperature dependence of Ms and K1 ofBaFe12O19 and SrFe12O19 single crystals., J. Appl. Phys.
[23] P. Blaha and K. Schwarz and G. Madsen and D. Kvasnicka and J. Luitz,
WIEN2k, An Augmented Plane Wave + Local Orbitals Program for Cal-culating Crystal Properties(K. Schwarz, Tech. Univ. Wien, Austria, 2001).
[24] Perdew, John P. and Burke, Kieron and Ernzerhof, Matthias, GeneralizedGradient Approximation Made Simple, Phys. Rev. Lett. 77 (1996)3865–3868. doi:10.1103/PhysRevLett.77.3865.URL http://link.aps.org/doi/10.1103/PhysRevLett.77.
3865
[25] B. C. Sales and B. Saparov and M. A. McGuire and D. J. Singh and D. S.Parker, Ferromagnetism of Fe3Sn and alloy., Sci Rep 4 (2014) 7024.
[26] G. H. O. Daalderop, P. J. Kelly, M. F. H. Schuurmans, First-principlescalculation of the magnetocrystalline anisotropy energy of iron, cobalt,and nickel, Phys. Rev. B 41 (1990) 11919–11937. doi:10.1103/
PhysRevB.41.11919.URL http://link.aps.org/doi/10.1103/PhysRevB.41.11919
7