a test of the cullen and bradley order effect · the laboratory work of cullen and bradley (2004)...
TRANSCRIPT

VOLUME34 . 2005·
Contents
A Comparison of Response ProfIles for Test Formats Used inthe ZoneComparlsonand,fumy Modified General Question Techniques . Donald J. Krapohl and DonnieW. Dutton ..
The Illlpact of Averaging Assigned Scores on Polygraph . Decision Accuracy . Stuart M. Senter, and Andrew H.Ryan
Neural Mechanisms of Decption and.Response.Congruity in a Visual Two-Stimulus Paradigm with Motor . Response JenniferM. C. Vendemia and Robert F. Buzan
An Exploration of Methods for the AnalysisofMultiple. Issue Relevant/Irrelevant Screening Data
.. Donald J. Krapohl, Stuart M, Senter,. and BrettA Stern .
~' PllblishedQuarterly" ,,-,,' © American 'Polygrapl AssC?ciation, 2005
P.O. Box'8037. Chattanobga.,Tenne~see 3,7414-0037
1
10
24
47 .'.

Krapohl & Dutton
A Comparison of Response Profiles for Test Formats Used in the Zone Comparison and Army Modified General Question
Techniques1
Donald J. Krapohl2 & Donnie W. Dutton
Abstract Standardized numerical scores from field cases for two polygraph formats, those used in the Army version of the Modified General Question Technique (MGQT) and the Zone Comparison Technique (ZCT), were examined to determine whether the different positional relationships of relevant and comparison questions would produce differences in scores. The ZCT format places a comparison question immediately before each relevant question, whereas the Army MGQT format does not, providing an opportunity to determine whether the positional differences have a meaningful effect on scores. The laboratory work of Cullen and Bradley (2004) indicated that the placement of comparison questions immediately before the relevant question produces more positive scores than when the relevant question precedes the comparison question. The present data only partially supported the Cullen and Bradley findings. An unanticipated effect emerged in the MGQT data, where scores for the last two questions strongly shifted in the positive direction for both truthtellers and liars. Implications for the field are discussed.
Introduction
The effect of question sequencing is an under-explored area in the field of polygraphy, though it is believed to be of some significance (Marcy, 1975). Because they lack adequate empirical research, test formats3 are a continuing source of debate among practitioners. In the evolution of Comparison Question Test (CQT) polygraphy that began after WWII, two principal lines of question
formats have emerged. The first derives from the Reid school (Inbau & Reid, 1953). This format uses two non-exclusionary probable-lie comparison questions (Waller, 2001) with four relevant questions, along with three irrelevant questions to create a question sequence shown in Table 1. Descendants of the Reid Technique include the Arther Technique, Marcy Technique, and the Army Modified General Question Technique (MGQT).
1 Copyright is retained by the American Polygraph Association. The opinions expressed in this article are those of the authors, and do not necessarily represent those of the US Government or the Department of Defense. 2Comments and reprint requests should be sent to: Donald Krapohl, DoD Polygraph Institute, 7540 Pickens Ave., Ft. Jackson, SC 29207, or by e-mail to [email protected]. 3 The term “format” is used here to denote a particular order of question presentations, or rules that govern the order, along with the types of questions. “Format” is sometimes incorrectly used interchangeably with “technique,” a broader term that encompasses not only the format, but all practices in the pretest and test phase. A few examples of techniques include the Relevant-Irrelevant, Concealed Information, and Directed Lie Techniques, each of which may have more than one format.
Polygraph, 2005, 34(1) 1
A Comparison of Response Profiles for Test Formats
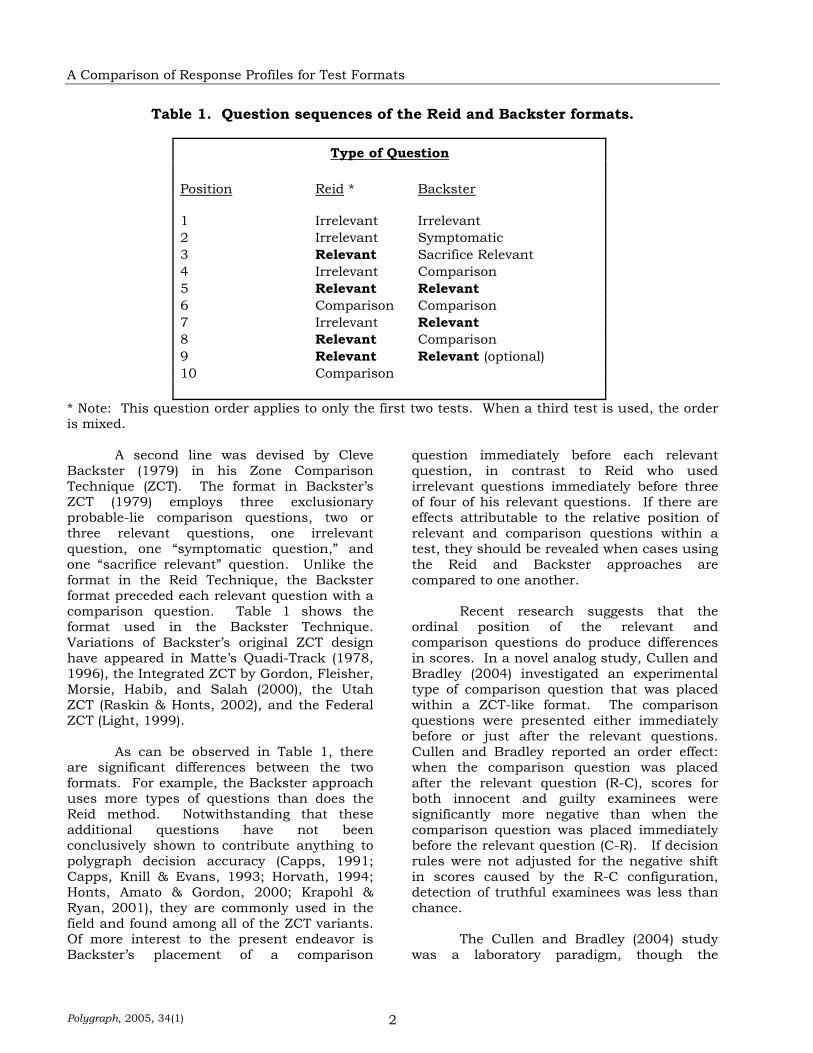
Table 1. Question sequences of the Reid and Backster formats.
Type of Question
Position Reid * Backster
1 Irrelevant Irrelevant 2 Irrelevant Symptomatic 3 Relevant Sacrifice Relevant 4 Irrelevant Comparison 5 Relevant Relevant 6 Comparison Comparison 7 Irrelevant Relevant 8 Relevant Comparison 9 Relevant Relevant (optional) 10 Comparison
* Note: This question order applies to only the first two tests. When a third test is used, the order is mixed. A second line was devised by Cleve Backster (1979) in his Zone Comparison Technique (ZCT). The format in Backster’s ZCT (1979) employs three exclusionary probable-lie comparison questions, two or three relevant questions, one irrelevant question, one “symptomatic question,” and one “sacrifice relevant” question. Unlike the format in the Reid Technique, the Backster format preceded each relevant question with a comparison question. Table 1 shows the format used in the Backster Technique. Variations of Backster’s original ZCT design have appeared in Matte’s Quadi-Track (1978, 1996), the Integrated ZCT by Gordon, Fleisher, Morsie, Habib, and Salah (2000), the Utah ZCT (Raskin & Honts, 2002), and the Federal ZCT (Light, 1999). As can be observed in Table 1, there are significant differences between the two formats. For example, the Backster approach uses more types of questions than does the Reid method. Notwithstanding that these additional questions have not been conclusively shown to contribute anything to polygraph decision accuracy (Capps, 1991; Capps, Knill & Evans, 1993; Horvath, 1994; Honts, Amato & Gordon, 2000; Krapohl & Ryan, 2001), they are commonly used in the field and found among all of the ZCT variants. Of more interest to the present endeavor is Backster’s placement of a comparison
question immediately before each relevant question, in contrast to Reid who used irrelevant questions immediately before three of four of his relevant questions. If there are effects attributable to the relative position of relevant and comparison questions within a test, they should be revealed when cases using the Reid and Backster approaches are compared to one another.
Recent research suggests that the ordinal position of the relevant and comparison questions do produce differences in scores. In a novel analog study, Cullen and Bradley (2004) investigated an experimental type of comparison question that was placed within a ZCT-like format. The comparison questions were presented either immediately before or just after the relevant questions. Cullen and Bradley reported an order effect: when the comparison question was placed after the relevant question (R-C), scores for both innocent and guilty examinees were significantly more negative than when the comparison question was placed immediately before the relevant question (C-R). If decision rules were not adjusted for the negative shift in scores caused by the R-C configuration, detection of truthful examinees was less than chance.
The Cullen and Bradley (2004) study
was a laboratory paradigm, though the
Polygraph, 2005, 34(1) 2
Krapohl & Dutton
prevailing evidence provides optimism regarding cautious generalization of laboratory polygraph research to the field (Kircher, Raskin, Honts & Horowitz, 1988; Patrick & Iacono, 1991; Pollina, Dollins, Senter, Krapohl, & Ryan, 2004). Assuming that the Cullen and Bradley (2004) findings would generalize to the field, we would predict that the scores from the first three relevant questions of the Reid format would be more negative than those of the ZCT format. This is because the former has relevant questions preceded by irrelevant questions while the latter has relevant questions preceded by comparison questions. The purpose of the present research was to test the hypothesis that a Reid-type format would produce scores that fall further in the negative direction than would a ZCT-type format.
Method
Cases All cases came from the DoD Polygraph
Institute database of field polygraph cases, and were confirmed by confession of the guilty party, or by the discovery of reliable physical evidence. They were conducted on digital
polygraphs (Axciton Systems, Houston, TX) by federal, state, and local law enforcement polygraph examiners testing criminal suspects employing a specific-issue polygraph technique. The testing took place between 1993 and 1997.
For ZCT data, the cases had been used
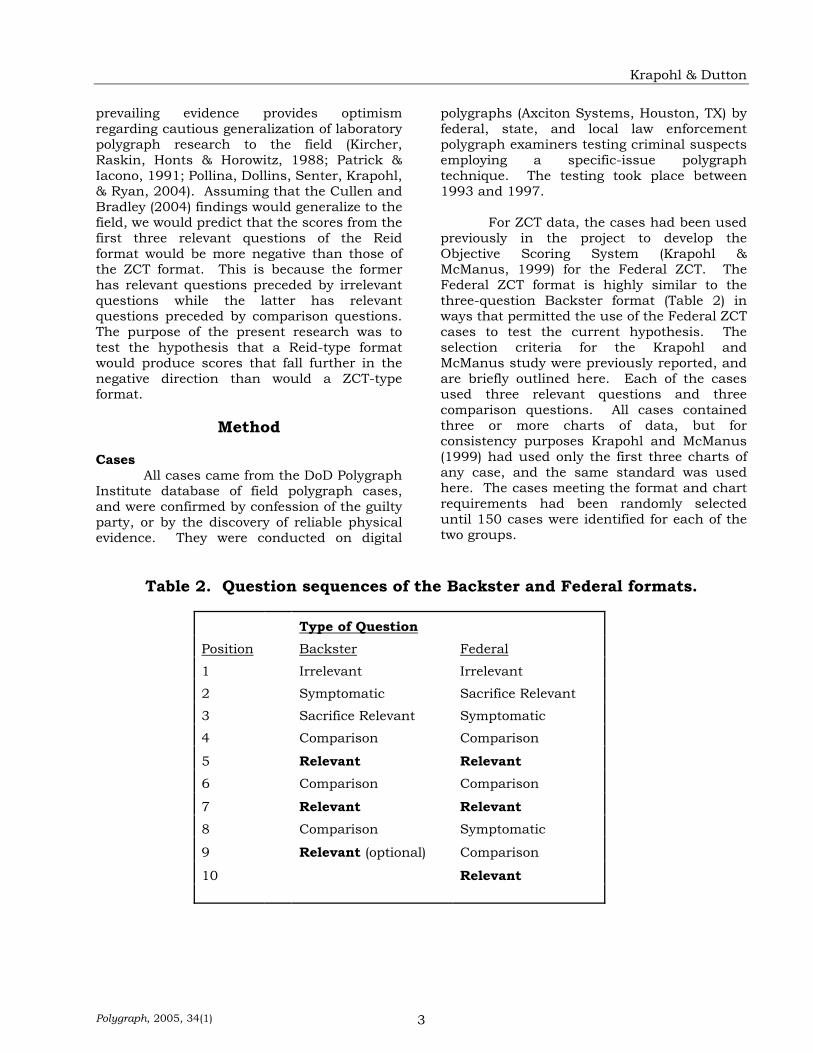
previously in the project to develop the Objective Scoring System (Krapohl & McManus, 1999) for the Federal ZCT. The Federal ZCT format is highly similar to the three-question Backster format (Table 2) in ways that permitted the use of the Federal ZCT cases to test the current hypothesis. The selection criteria for the Krapohl and McManus study were previously reported, and are briefly outlined here. Each of the cases used three relevant questions and three comparison questions. All cases contained three or more charts of data, but for consistency purposes Krapohl and McManus (1999) had used only the first three charts of any case, and the same standard was used here. The cases meeting the format and chart requirements had been randomly selected until 150 cases were identified for each of the two groups.
Table 2. Question sequences of the Backster and Federal formats.
Type of QuestionPosition Backster Federal
1 Irrelevant Irrelevant
2 Symptomatic Sacrifice Relevant
3 Sacrifice Relevant Symptomatic
4 Comparison Comparison
5 Relevant Relevant 6 Comparison Comparison
7 Relevant Relevant 8 Comparison Symptomatic
9 Relevant (optional) Comparison
10 Relevant
Polygraph, 2005, 34(1) 3
A Comparison of Response Profiles for Test Formats
Digital cases conducted with the Reid format were not available. In place of Reid data, cases were selected from the database that employed the Army MGQT. The format of the Army MGQT is identical to that used in the Reid Technique. All cases listed as truthful were selected, for a total of 38. There were 260 deceptive cases available, from which 38 were randomly selected to create a balanced sample. The third chart in the Reid Technique and the MGQT is a mixed-order sequence with some repetition of certain questions. Because order effects of the third chart would be expected to be different from the other two charts, only the first two charts of each MGQT case were used here.
Scoring System
The Objective Scoring System (OSS) version 2 (Krapohl, 2002) was applied to all of the cases. The OSS was designed to be used by manual scorers (Dutton, 2000), but it was automated for this project.
The OSS is a three-feature model that
bases scores on the ratio of the measurement of respiration line length (Timm, 1982), electrodermal response amplitude, and blood volume amplitude. These three features have been found to be the most diagnostic in conventional polygraph recording (Kircher & Raskin, 1988). The ratios are created by dividing the feature measurement of the relevant question by that of a corresponding comparison question.
The OSS version 2 was developed to
score each relevant question against the preceding comparison question, and this method was used here. There is no OSS protocol for the MGQT format to direct which comparison questions should be used for the relevant questions. Because field generalizability was considered important, the rules taught at the DoD Polygraph Institute were employed: The first two relevant questions were always scored against the first comparison question, the third relevant
question was scored against the stronger of the two comparison questions, and the last relevant question was scored against the last comparison question.
Data Analysis
Total scores for the relevant questions were compared between the MGQT and ZCT cases for truthful and deceptive cases. The first relevant question of the ZCT was compared to the first relevant question of the MGQT, and so forth. The ZCT uses only three relevant questions while the MGQT has four relevant questions, and therefore only three statistical comparisons were made. Because of multiple two-tailed t-test comparisons, alpha was set at a conservative .01 to minimize the likelihood of a Type I error. Unequal variance was assumed.
Results
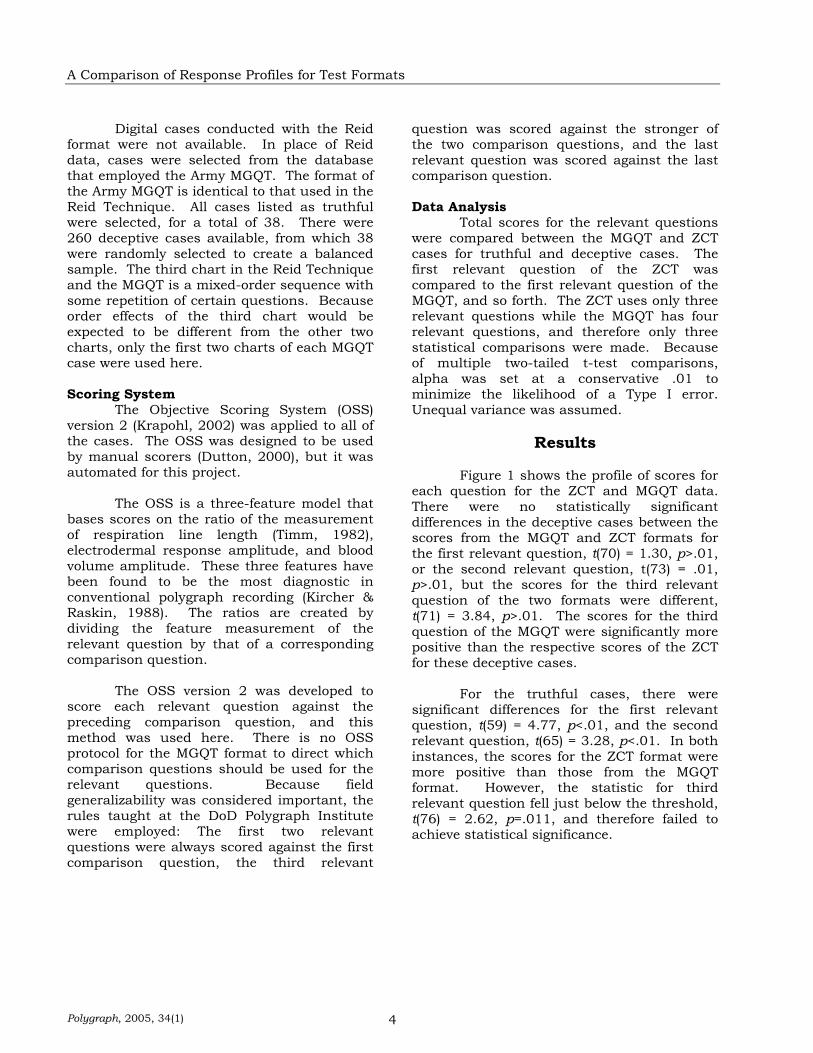
Figure 1 shows the profile of scores for
each question for the ZCT and MGQT data. There were no statistically significant differences in the deceptive cases between the scores from the MGQT and ZCT formats for the first relevant question, t(70) = 1.30, p>.01, or the second relevant question, t(73) = .01, p>.01, but the scores for the third relevant question of the two formats were different, t(71) = 3.84, p>.01. The scores for the third question of the MGQT were significantly more positive than the respective scores of the ZCT for these deceptive cases.
For the truthful cases, there were
significant differences for the first relevant question, t(59) = 4.77, p<.01, and the second relevant question, t(65) = 3.28, p<.01. In both instances, the scores for the ZCT format were more positive than those from the MGQT format. However, the statistic for third relevant question fell just below the threshold, t(76) = 2.62, p=.011, and therefore failed to achieve statistical significance.
Polygraph, 2005, 34(1) 4
Krapohl & Dutton
Figure 1. Average OSS (version 2) scores by relevant question for field ZCT and MGQT Cases.
-15.00
-10.00
-5.00
0.00
5.00
10.00
15.00
R1 R2 R3 R4
Relevant Question
Aver
age
OS
S S
core
MGQT DeceptiveMGQT TruthfulZCT DeceptiveZCT Truthful
Discussion
Because the ZCT format places
comparison questions immediately before relevant questions and the MGQT positions irrelevant questions before the relevant questions, predictions based on the Cullen and Bradley (2004) pattern would suggest that both deceptive and truthful scores from the MGQT questions should be more negative than those from the ZCT questions. Only a subset of the present data is in accord with Cullen and Bradley: the first two relevant questions for truthful examinees were more negative with the MGQT data than with the ZCT data. There was no evidence of more negative scores for the MGQT format with the deceptive cases, contrary to expectations that might arise from the Cullen and Bradley work. The scores for third relevant question of the MGQT were more positive than the corresponding ZCT scores.
There may be several contributors to
this mixed picture. Addressing first the apparent positive shift of the MGQT scores for
the third relevant question for both deceptive and truthful cases, this may be a function of the scoring rules for the MGQT. Recall that the first two MGQT relevant questions had been scored only against the first comparison question, whereas the third MGQT relevant question was scored against the stronger of the format’s two comparison question. The use of the stronger of two comparison questions has previously been implicated in the shifting of scores in the positive direction (Koll, 1979, Krapohl & Dollins, 2003). Therefore, it is not surprising that the scores from the third relevant questions would be more positive than the first two relevant questions. The ZCT scores should not be similarly affected because each relevant question was scored to the immediately preceding comparison question.
There are confounding factors that may
have influenced these scores. While three charts were used with the ZCT data, only two were used with the MGQT cases. Differences in the number of charts were deemed necessary because the question order in the third chart of the MGQT was substantially
Polygraph, 2005, 34(1) 5
A Comparison of Response Profiles for Test Formats
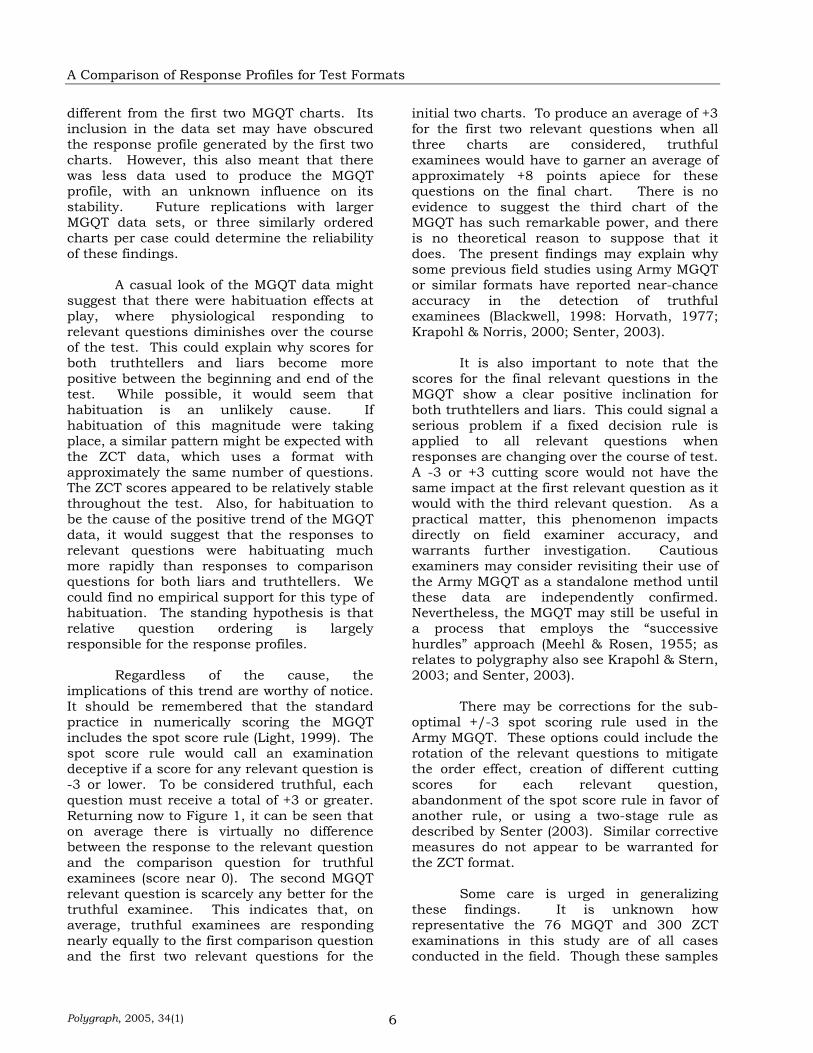
different from the first two MGQT charts. Its inclusion in the data set may have obscured the response profile generated by the first two charts. However, this also meant that there was less data used to produce the MGQT profile, with an unknown influence on its stability. Future replications with larger MGQT data sets, or three similarly ordered charts per case could determine the reliability of these findings.
A casual look of the MGQT data might
suggest that there were habituation effects at play, where physiological responding to relevant questions diminishes over the course of the test. This could explain why scores for both truthtellers and liars become more positive between the beginning and end of the test. While possible, it would seem that habituation is an unlikely cause. If habituation of this magnitude were taking place, a similar pattern might be expected with the ZCT data, which uses a format with approximately the same number of questions. The ZCT scores appeared to be relatively stable throughout the test. Also, for habituation to be the cause of the positive trend of the MGQT data, it would suggest that the responses to relevant questions were habituating much more rapidly than responses to comparison questions for both liars and truthtellers. We could find no empirical support for this type of habituation. The standing hypothesis is that relative question ordering is largely responsible for the response profiles.
Regardless of the cause, the
implications of this trend are worthy of notice. It should be remembered that the standard practice in numerically scoring the MGQT includes the spot score rule (Light, 1999). The spot score rule would call an examination deceptive if a score for any relevant question is -3 or lower. To be considered truthful, each question must receive a total of +3 or greater. Returning now to Figure 1, it can be seen that on average there is virtually no difference between the response to the relevant question and the comparison question for truthful examinees (score near 0). The second MGQT relevant question is scarcely any better for the truthful examinee. This indicates that, on average, truthful examinees are responding nearly equally to the first comparison question and the first two relevant questions for the
initial two charts. To produce an average of +3 for the first two relevant questions when all three charts are considered, truthful examinees would have to garner an average of approximately +8 points apiece for these questions on the final chart. There is no evidence to suggest the third chart of the MGQT has such remarkable power, and there is no theoretical reason to suppose that it does. The present findings may explain why some previous field studies using Army MGQT or similar formats have reported near-chance accuracy in the detection of truthful examinees (Blackwell, 1998: Horvath, 1977; Krapohl & Norris, 2000; Senter, 2003).
It is also important to note that the
scores for the final relevant questions in the MGQT show a clear positive inclination for both truthtellers and liars. This could signal a serious problem if a fixed decision rule is applied to all relevant questions when responses are changing over the course of test. A -3 or +3 cutting score would not have the same impact at the first relevant question as it would with the third relevant question. As a practical matter, this phenomenon impacts directly on field examiner accuracy, and warrants further investigation. Cautious examiners may consider revisiting their use of the Army MGQT as a standalone method until these data are independently confirmed. Nevertheless, the MGQT may still be useful in a process that employs the “successive hurdles” approach (Meehl & Rosen, 1955; as relates to polygraphy also see Krapohl & Stern, 2003; and Senter, 2003).
There may be corrections for the sub-
optimal +/-3 spot scoring rule used in the Army MGQT. These options could include the rotation of the relevant questions to mitigate the order effect, creation of different cutting scores for each relevant question, abandonment of the spot score rule in favor of another rule, or using a two-stage rule as described by Senter (2003). Similar corrective measures do not appear to be warranted for the ZCT format.
Some care is urged in generalizing
these findings. It is unknown how representative the 76 MGQT and 300 ZCT examinations in this study are of all cases conducted in the field. Though these samples
Polygraph, 2005, 34(1) 6
Krapohl & Dutton
may be considered adequate for many polygraph studies, the cases were conducted by those who underwent independent quality control reviews of their work, and consequently the quality of the cases may be different from those in other settings.
It should also be remembered that OSS
scores were used rather than any of the various forms of manual scoring. The OSS was selected because it afforded an objective metric not attainable with manual scoring, and owing to its amenability to automation, it provided perfect reliability. However, the scores for the OSS are not equivalent to manual scores, and these scores may depart significantly from those of scoring systems with other rules (Krapohl & Dollins, 2003). The strong effect found in the present data suggests that the trends in Figure 1 will be confirmed in subsequent research using manual scoring systems, but the numerical values will probably not be identical to those depicted here.
A replication of this study is needed,
especially given the implications of the findings. The data revealed patterns in responses that were not predicted by previous research, nor adequately explained by any theory we could locate. Only a further exploration can resolve their authenticity, and begin to uncover their causes.
Acknowledgements
We are grateful to Dr. Stuart Senter, Mr. Gary Light and Dr. Tim Weber for their insightful comments on an earlier draft of this paper. This article is one in a series under the heading Best Practices, and will appear simultaneously in the publications of the American Polygraph Association, the American Association of Police Polygraphists, the Canadian Association of Police Polygraphists, and the Latin American Association of Polygraphists.
References Backster, C. (1979). Standardized Polygraph Notepack and Technique Guide. Blackwell, N.J. (1998). PolyScore 3.3 and psychophysiological detection of deception examiner rates
of accuracy when scoring examination from actual criminal investigations. DoDPI97-R-006. DTIC AD Number A355504/PAA. Department of Defense Polygraph Institute. Ft. McClellan, AL
Capps, M.H. (1991). Predictive value of the sacrifice relevant. Polygraph, 20(1), 1-6. Capps, M.H., Knill, B.L., & Evans, R.K. (1993). Effectiveness of the symptomatic questions.
Polygraph, 22(4), 285-298. Cullen, M.C., & Bradley, M.T. (2004). Positions of truthfully answered controls on control question
tests with the polygraph. Canadian Journal of Behavioural Science, 36(3), 167-176. Dutton, D.W. (2000). Guide for performing the objective scoring system. Polygraph, 29(2), 177-
184. Gordon, N.J., Fleisher, W.L., Morsie, H., Habib, W., & Salah, K. (2000). A field validity study of the
integrated zone comparison technique. Polygraph, 29(2), 220-225. Honts, C.R., Amato, S., & Gordon, A. (2000). Validity of outside-issue questions in the control
question test. Final report to the DoD Polygraph Institute. Grant No. N00014-98-1-0725. DTIC AD Number A376666.
Horvath, F. (1977). The effect of selected variables in interpretation of polygraph records. Journal
of Applied Psychology, 62, 127- 136.
Polygraph, 2005, 34(1) 7

A Comparison of Response Profiles for Test Formats
Horvath, F.S. (1994). The value and effectiveness of the sacrifice relevant question: An empirical assessment. Polygraph, 23(4), 261-279.
Inbau, F.E., & Reid, J.E. (1953). Lie detection and criminal interrogation (3rd ed.). Williams &
Wilkins: Baltimore. Kircher, J.C., & Raskin, D.C. (1988). Human versus computerized evaluations of polygraph data in
a laboratory setting. Journal of Applied Psychology, 73(2), 291-302. Kircher, J.C., Raskin, D.C., Honts, C.R., & Horiwitz, S.W. (1988). Generalizability of mock crime
laboratory studies of the control question polygraph technique. Psychophysiology, 25(4), 462-463.
Koll, M. (1979). Analysis of zone charts by various pairings of control and relevant questions.
Polygraph, 8(2), 154-160. Krapohl, D.J. (2002). Short Report: Update for the Objective Scoring System. Polygraph, 31(4),
298-302. Krapohl, D.J., & Dollins, A.B. (2003). Relative efficacy of the Utah, Backster, and federal scoring
rules: A preliminary investigation. Polygraph, 32(3), 150-165. Krapohl, D.J., & Norris, W.F. (2000). An exploratory study of traditional and objective scoring
systems with MGQT field cases. Polygraph, 29(2), 185-194. Krapohl, D.J., & McManus, B. (1999). An objective method for manually scoring polygraph data.
Polygraph, 28(3), 209-222. Krapohl, D.J., & Ryan, A.H. (2001). A belated look at symptomatic questions. Polygraph, 30(3),
206-212. Krapohl, D.J., & Stern, B.A. (2003). Principles of multiple-issue polygraph screening a model for
applicant, post-conviction offender, and counterintelligence testing, Polygraph, 32(4), 201-210. Light, G.D. (1999). Numerical evaluation of the Army zone comparison test. Polygraph, 28(1), 37-
45. Marcy, L.P. (1975). The forensic polygraph examination: Instrumentation and technique. Paper
presented at the American Psychological Association Seminar, Chicago, IL. Matte, J.A. (1978). Polygraph Quadri-Zone comparison technique. Polygraph, 7(4), 266-280. Matte, J.A. (1996). Forensic Psychophysiology Using the Polygraph: Scientific Truth Verification – Lie
Detection. Buffalo Printing Company: Williamsville, NY. Meehl, P.E., & Rosen, A. (1955). Antecedent probability and the efficiency of psychometric signs,
patterns, and cutting scores. Psychological Bulletin, 52(3), 194-216. Patrick, C.J, & Iacono, W.G. (1991). A comparison of field and laboratory polygraphs in the
detection of deception. Psychophysiology, 28(6), 632-638.
Pollina, D., Dollins, A., Senter, S., Krapohl, D., & Ryan, A. (2004). A comparison of polygraph data obtained from individuals involved in mock crimes and actual criminal investigations. Journal of Applied Psychology, 89, 1099–1105.
Polygraph, 2005, 34(1) 8

Krapohl & Dutton
Raskin, D.C., & Honts, C.R. (2002). The comparison question test. In Kleiner (Ed.) Handbook of Polygraph Testing. Academic Press: San Diego.
Senter, S.M. (2003). Modified general question test decision rule exploration. Polygraph, 32(4),
251-263. Timm, H.W. (1982). Analyzing deception from respiration patterns. Journal of Police Science and
Administration, 10(1), 47-51. Waller, J.F. (2001). A concise history of the comparison question. Polygraph, 30(3), 192-195.
Polygraph, 2005, 34(1) 9
The Impact of Averaging Assigned Scores on Polygraph
Polygraph, 2005, 34(1)
10
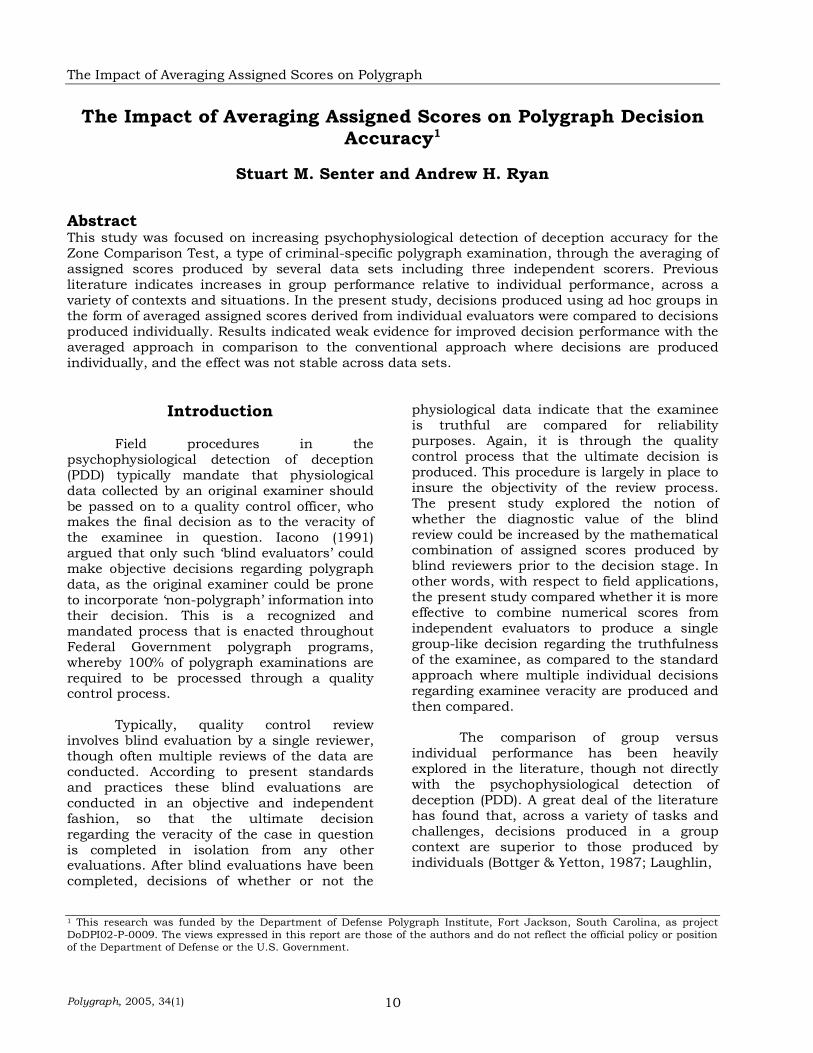
The Impact of Averaging Assigned Scores on Polygraph Decision Accuracy1
Stuart M. Senter and Andrew H. Ryan
Abstract This study was focused on increasing psychophysiological detection of deception accuracy for the Zone Comparison Test, a type of criminal-specific polygraph examination, through the averaging of assigned scores produced by several data sets including three independent scorers. Previous literature indicates increases in group performance relative to individual performance, across a variety of contexts and situations. In the present study, decisions produced using ad hoc groups in the form of averaged assigned scores derived from individual evaluators were compared to decisions produced individually. Results indicated weak evidence for improved decision performance with the averaged approach in comparison to the conventional approach where decisions are produced individually, and the effect was not stable across data sets.
Introduction
Field procedures in the psychophysiological detection of deception (PDD) typically mandate that physiological data collected by an original examiner should be passed on to a quality control officer, who makes the final decision as to the veracity of the examinee in question. Iacono (1991) argued that only such ‘blind evaluators’ could make objective decisions regarding polygraph data, as the original examiner could be prone to incorporate ‘non-polygraph’ information into their decision. This is a recognized and mandated process that is enacted throughout Federal Government polygraph programs, whereby 100% of polygraph examinations are required to be processed through a quality control process.
Typically, quality control review involves blind evaluation by a single reviewer, though often multiple reviews of the data are conducted. According to present standards and practices these blind evaluations are conducted in an objective and independent fashion, so that the ultimate decision regarding the veracity of the case in question is completed in isolation from any other evaluations. After blind evaluations have been completed, decisions of whether or not the
physiological data indicate that the examinee is truthful are compared for reliability purposes. Again, it is through the quality control process that the ultimate decision is produced. This procedure is largely in place to insure the objectivity of the review process. The present study explored the notion of whether the diagnostic value of the blind review could be increased by the mathematical combination of assigned scores produced by blind reviewers prior to the decision stage. In other words, with respect to field applications, the present study compared whether it is more effective to combine numerical scores from independent evaluators to produce a single group-like decision regarding the truthfulness of the examinee, as compared to the standard approach where multiple individual decisions regarding examinee veracity are produced and then compared.
The comparison of group versus individual performance has been heavily explored in the literature, though not directly with the psychophysiological detection of deception (PDD). A great deal of the literature has found that, across a variety of tasks and challenges, decisions produced in a group context are superior to those produced by individuals (Bottger & Yetton, 1987; Laughlin,
1 This research was funded by the Department of Defense Polygraph Institute, Fort Jackson, South Carolina, as project DoDPI02-P-0009. The views expressed in this report are those of the authors and do not reflect the official policy or position of the Department of Defense or the U.S. Government.

Senter & Ryan
Polygraph, 2005, 34(1) 11
1980; Laughlin & Ellis, 1986; Michaelsen, Watson, & Black, 1989; Miller, 1996; Schwenke & Valacich, 1994; Stroop, 1932; Thompson, Peterson, & Brodt, 1996; Valacich, Wheeler, Mennecke, & Wachter, 1995), though in some cases the results are mixed (Grofman, Feld, & Owen; Lebie, 1998; Libby & Blashfield, 1978; Libby, Trotman, & Zimmer, 1987; Miner, 1984; Morgan & Tindale, 2002; Schloper & Insko, 1992). The focal question for the present study was whether the combination of evaluator inputs prior to the decision stage would produce higher accuracy than if decisions were produced individually. Polygraph decision process
This study focused on decisions produced with polygraph data using comparison question test (CQT) methodology. The CQT approach includes, among other questions, relevant and comparison questions. Relevant questions address the specific issue or crime in question (e.g. Did you steal any of that money?), while comparison questions query the examinee’s personal involvement in acts similar to the issue in question (e.g. Did you ever steal anything from someone who trusted you?). The assumption behind the CQT approach is that deceptive individuals will be more concerned with, and thus produce larger physiological responses to relevant questions than to comparisons questions. The reverse assumption is made regarding nondeceptive individuals, who are expected to be more concerned with comparison questions than with relevant questions, thus producing larger physiological responses to comparison questions than to relevant questions. Typically three repetitions of each question sequence are presented to the examinee, producing three charts of physiological data.
Decisions are produced following the CQT approach by assigning scores to pairs of relevant and comparison questions for each of three physiological channels (respiration, electrodermal, cardiovascular). In a given pairing, if the relevant question elicits greater physiological responses than the comparison question, a negative value is assigned. If the comparison question elicits a larger response than the relevant question, a positive value is assigned. For more information regarding specifics related to score assignment see Bell,
Raskin, Honts, and Kircher (1999) and Swinford (1999).
Following the completion of score assignment, decisions are produced in various ways, depending on the testing format. The present study focused on a common specific-issue format known as the Zone Comparison Test (ZCT), which uses three relevant and three comparison questions in addition to other questions that are not scored (DoDPI, 2002). Table 1 provides a commonly used question framework. Table 1 Question Sequence for Zone Comparison Test
1. Irrelevant 2. Sacrifice Relevant 3. Symptomatic 4. Comparison 5. Relevant 6. Comparison 7. Relevant 8. Symptomatic 9. Comparison 10. Relevant
There are two primary decision rules that are typically implemented with the ZCT. The first is the total score rule (3T), which simply involves summing all of the assigned scores to a single value and comparing those to predefined thresholds. Generally these thresholds are -6 and +6, with values meeting the former producing deceptive decisions and values meeting the latter producing nondeceptive decisions. Values ranging from -5 to +5 result in no opinion (NO) decisions. The second is the spot score rule (3S) which encompasses the 3T rule, but with some caveats. The 3S rule requires that values be summed for each of the three relevant/comparison question pairs, producing three ‘spot’ scores. Deceptive decisions are produced either with a total score of -6 or lower or with any of the three spot scores with a value of -3 or lower. Nondeceptive decisions are produced only with a total score of +6 or higher and a value of +1 or higher for all three spot scores. All other cases produce NO decisions. Senter and Dollins (2004a; 2004b) showed that decisions produced using polygraph data are highly

The Impact of Averaging Assigned Scores on Polygraph
Polygraph, 2005, 34(1)
12
Figure 1. Approach taken to produce decisions for individuals
dependent on the decision thresholds or rules used after score assignment. However, for sake of simplicity, and following the notion that this is an exploratory initial report, only the 3T rule was used to produce decisions in the present project.
The approach taken in this study was to compare the average of the independent accuracy rates produced by assigned scores from individual evaluators with those produced by averaging the assigned scores prior to the decision process. Figures 1 and 2 illustrate the two different processes. Five sets of data were used to compare these two approaches. Three of these used data from laboratory studies and two used data sets from field studies. Given the greater evidence toward group superiority, we predicted that decision accuracy rates attained using the averaged approach would exceed that of decisions produced individually. Method: Laboratory Data
The assigned scores collected from three sets of laboratory mock crime polygraph
data were used (Table 2). The mock crime scenarios were all similar in nature, with programmed deceptive participants being required to steal something from a secretary’s desk.
Participants who were programmed nondeceptive did not complete the mock crime scenario. Both deceptive and nondeceptive participants were tested regarding their involvement in the mock theft. For more specifics regarding the mock crime scenarios, please refer to Kircher and Raskin (1988) and DoDPI Staff (2001). ZCT formats were conducted for each laboratory study.
All scorers were Federally-certified polygraph examiners with at least ten years of polygraph experience. Each scorer evaluated each case individually, assigning values to each relevant/comparison question pair. These scores were then used to produce decisions individually and the averaged together to produce an ad hoc group decision, using the 3T decision rule. All calculations and decisions were produced using spreadsheet software.
+6
Evaluator 1
RC1 RC2 RC3
+1 +5 0
Total
Decision
Evaluator 3
RC1 RC2 RC3
+2 +3 -1
Total
Decision
+4
Evaluator 2
RC1 RC2 RC3
+3 +4 +2
Total
Decision
+9

Senter & Ryan
Polygraph, 2005, 34(1) 13
Table 2 Frequency of Observations in Laboratory Data Sets
N Cases
Study Deceptive Truthful N Scorers N Decisions
Kircher & Raskin (1988) 50 50 3 300 DoDPI Staff (2001) Study 1 16 16 3 96 DoDPI Staff (2001) Study 2 16 16 3 96
Total 82 82 9 492
Figure 2. Approach taken to produce averaged decisions
It was necessary to define the cutoffs used by the various decision rules more precisely in the present study than what is usually implemented. Due to the averaging process, numerical totals often included decimal values such as ‘.3’ and ‘.7’ were commonly encountered. Thus, it was decided to adjust the decision rules in the following
manner. For the 3T rule, values greater than 5.0 produced a nondeceptive decision and values less than -5.0 produced a deceptive decision. Thus, values of 5.3 and -5.3 resulted in nondeceptive and deceptive decisions, respectively. Ultimately this adheres to the ‘greater than 5’, ‘less than -5’
Decision
+3+1 +2
+2.0
+4+5 +3
+4.0
+2 0 -1
+0.3
Total
+9+6 +4
+6.3
RC1 RC2 RC3
Total
RC1 RC2 RC3
Total
RC1 RC2 RC3
Total
Evaluator 2Evaluator 1 Evaluator 3
RC1 RC2 RC3

The Impact of Averaging Assigned Scores on Polygraph
Polygraph, 2005, 34(1)
14
thresholds in the typical application of the total score rule.
Decision accuracy was calculated in two ways. First, correct decisions (deceptive decisions for deceptive cases or nondeceptive decisions for nondeceptive cases) were calculated as a percentage of all decisions, including wrong decisions (nondeceptive decisions for deceptive cases or deceptive decisions for nondeceptive cases) and NO decisions (5.3 or -5.3 thresholds not crossed). This calculation is depicted by the ‘correct’ column in Figures 3-7. The ‘wrong’ and ‘NO’ are also included. Second, correct decisions were calculated and reported as a function of definitive decisions only, or in other words, the percentage of correct decisions excluding NO decisions. This calculation is depicted by the ‘accuracy’ column in Figures 3-7.
The data were analyzed using Pairwise proportion tests (Siegal & Castellan, 1988), calculated on the proportion of correct, wrong, and NO decisions. Paired t-tests (Gravetter & Wallnau, 2000), were also calculated on total decisions using a system where correct decisions were coded as +1, wrong decisions were coded as -1 for wrong,
and NO decisions were coded as 0. These values are then summed and divided by the number of cases, resulting in an accuracy index ranging from +1.0 to -1.0, with values approaching +1 indicating higher accuracy rates. These tests were also calculated for decisions using deceptive and nondeceptive cases separately. In addition, the proportions of complete agreement (each individual scorer decision agreement with the averaged decision) and average individual agreement (average proportion of agreement each scorer had with the average) and were calculated, and Spearman correlations (Gravetter & Wallnau) were reported for the accuracy index described above. All alpha levels were set at .05.
Results
Figures 3-5 show the percentage of correct, wrong, and NO for each approach and for each study. The accuracy column at the right of each panel indicates the percentage of correct decisions produced when either a deceptive or nondeceptive decision was rendered.
Figure 3. Correct, wrong, and NO decisions as a function of participant status and decision approach using Kircher and Raskin (1988) data.
CORRECT
WRONG NO
ACCURACY0
10
20
30
40
50
60
70
80
90
100
PER
CE
NT
CORRECT
WRONG NO
ACCURACY0
10
20
30
40
50
60
70
80
90
100
PER
CE
NT
INDAVG
APPROACH
DECEPTIVE NONDECEPTIVE
Senter & Ryan
Polygraph, 2005, 34(1) 15
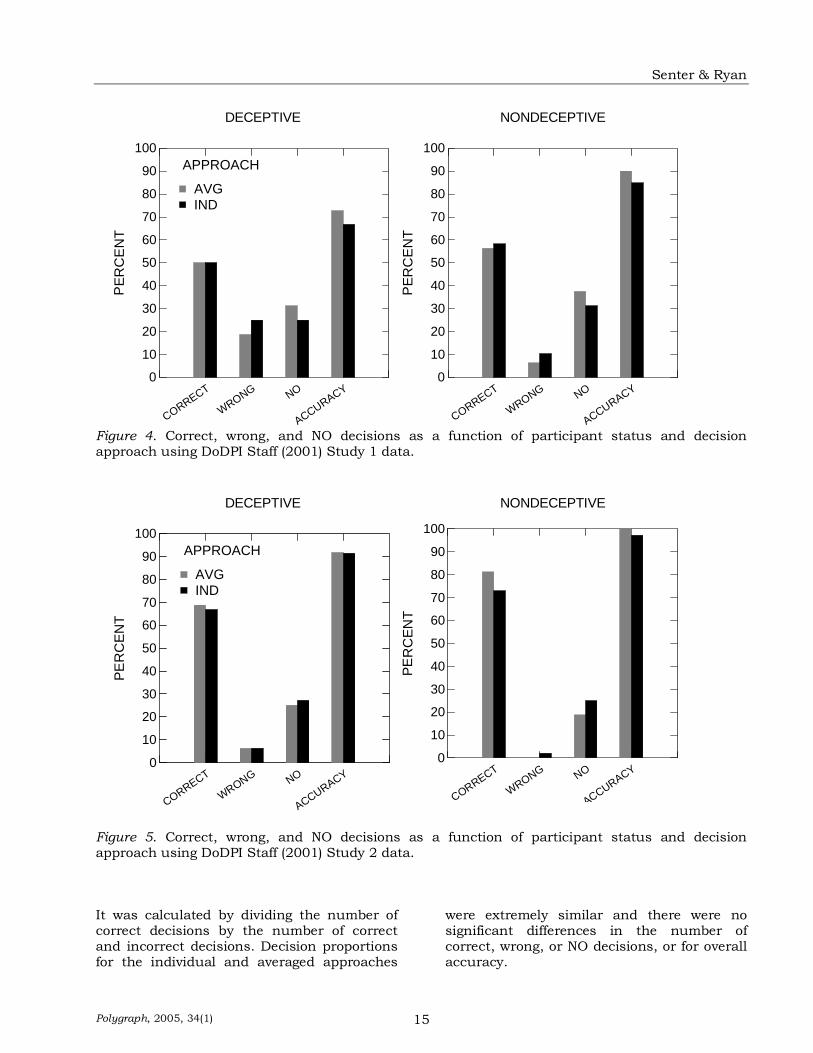
Figure 4. Correct, wrong, and NO decisions as a function of participant status and decision approach using DoDPI Staff (2001) Study 1 data.
Figure 5. Correct, wrong, and NO decisions as a function of participant status and decision approach using DoDPI Staff (2001) Study 2 data. It was calculated by dividing the number of correct decisions by the number of correct and incorrect decisions. Decision proportions for the individual and averaged approaches
were extremely similar and there were no significant differences in the number of correct, wrong, or NO decisions, or for overall accuracy.
CORRECT
WRONG NO
ACCURACY0
10
20
30
40
50
60
70
80
90
100
PER
CEN
T
CORRECT
WRONG NO
ACCURACY0
10
20
30
40
50
60
70
80
90
100
PER
CEN
T
DECEPTIVE NONDECEPTIVE
INDAVG
APPROACH
CORRECT
WRONG NO
ACCURACY0
10
20
30
40
50
60
70
80
90
100
PER
CE
NT
CORRECT
WRONG NO
ACCURACY0
10
20
30
40
50
60
70
80
90
100
PER
CE
NT
DECEPTIVE NONDECEPTIVE
INDAVG
APPROACH

The Impact of Averaging Assigned Scores on Polygraph
Polygraph, 2005, 34(1)
16
Table 3 shows accuracy index calculations for both individual and averaged approaches, for deceptive, nondeceptive, and total cases. Excepting deceptive cases in the Kircher and Raskin study, the averaged approach produced slightly higher scores for both deceptive and nondeceptive cases in the
laboratory data. Paired t-test results are reported in Table 4. As shown, the only significant difference produced by the individual and averaged approaches was for truthful cases in the Kircher and Raskin study, though this difference for the DoDPI Staff Study 2 did approach significance.
Table 3 Accuracy Indices for Laboratory Data Sets
Study Approach Deceptive Nondeceptive Total
Kircher & Raskin (1988) Individual .65 .71 .68 Averaged .64 .78 .71 DoDPI Staff (2001) Study 1 Individual .25 .48 .37 Averaged .31 .50 .41 DoDPI Staff (2001) Study 2 Individual .60 .71 .66 Averaged .63 .81 .72
Table 4 Paired T-Test Results for Comparing Accuracy Index for Laboratory Data Sets
Study Sample df T p
Kircher & Raskin (1988) Deceptive 49 -0.26 .80 Nondeceptive 49 2.40 .02 Total 99 1.64 .11 DoDPI Staff (2001) Study 1 Deceptive 15 1.00 .33 Nondeceptive 15 0.44 .67 Total 31 1.08 .29 DoDPI Staff (2001) Study 2 Deceptive 15 0.37 .72 Nondeceptive 15 2.08 .06 Total 31 1.65 .11
Table 5 shows the proportion of
complete and average individual agreement with the averaged approach across the three laboratory studies, in addition to Spearman correlation coefficients for the individual and averaged accuracy indices. Assuming a liberal estimate of 0.33 for chance agreement (three
potential decision types produced by three independent scorers, compared to a fourth decision source), all proportions of agreement were statistically greater than chance (p < .05). Finally, all correlation coefficients were statistically significant.

Senter & Ryan
Polygraph, 2005, 34(1) 17
Table 5 Proportion of Complete and Average Scorer Agreement and Spearman Correlations using Individual and Averaged Approaches with Laboratory Data Sets
Complete Average
Study Agreement Agreement r
Kircher & Raskin (1988) .69 .87 .83 DoDPI Staff (2001) Study 1 .63 .83 .92 DoDPI Staff (2001) Study 2 .66 .88 .81
Discussion
Though the overall trend across the three laboratory data sets showed slightly higher accuracy rates in all situations (excepting deceptive cases in the Kircher & Raskin data), as a whole, these data suggest minimal differences between the individual and averaged approaches. No evidence was found for differences in the proportion of decisions produced by the two approaches. In addition, high levels of agreement and strong positive correlations were found between decisions produced by the two approaches. Evidence for differences in decision performance was found for nondeceptive cases in the Kircher and Raskin data, and a marginal (p = .06) difference was found for nondeceptive cases in the DoDPI Staff Study 2. The marginal effect of the nondeceptive cases from DoDPI Staff Study 2 is likely due to the relatively weak power afforded by the small number of cases (n = 16).
Thus, while there is strong evidence for commonalities between the individual and averaged approaches there is some evidence for an accuracy advantage for the averaged approach over the conventional individual approach. The differences appear to be strongest with nondeceptive cases.
For each of the three laboratory data
sets, slightly higher accuracy was produced for nondeceptive cases, though none of these differences reached statistical significance. A common criticism of laboratory polygraph data is that results derived from them cannot be generalized to the real world, given the lack of real-world jeopardy inherent in the process
(National Research Council, 2003). This criticism is partially reflected in the three laboratory data sets explored here. Slightly lower accuracy rates for deceptive participants could be attributed to weaker responses to the relevant questions, potentially attributable to the mock crime context of these studies. Criticisms are also leveled at polygraph data collected in the field, primarily due to the fact that only a subset of cases can be confirmed regarding the actual state of the examinee, raising the possibility that samples used in such studies could be biased (Iacono, 1991). In many ways, the two data sources have complementary strengths and weaknesses, whereby the shortcoming of one is a strong point of the other. Thus, it is recommended that polygraph research incorporate both data sources. However, Pollina, Dollins, Senter, Krapohl, and Ryan (in press) produced evidence suggesting that the two data sources appear to produce similar accuracy rates, primarily suggesting that laboratory data may well be a successful analogue to field performance. While the purpose of the present study is not to replicate nor extend the results of the Pollina et al. (in press) study, we chose to explore the impact of the averaging procedure with two sets of field data, to check for convergence of results. Method: Field Data
Assigned scores were used from two field polygraph studies (Table 6). The same procedures that were implemented using the laboratory data sets were used. Scorers were all certified polygraph examiners with at least ten years of experience.

The Impact of Averaging Assigned Scores on Polygraph
Polygraph, 2005, 34(1)
18
Table 6 Frequency of Observations in Field Data Sets
N Cases
Study Deceptive Truthful N Scorers N Decisions
Blackwell (1999) 65 35 3 300 Krapohl et al. (2001) 50 50 3 300
Total 115 85 6 600
Results
Figures 6 and 7 show the results for
the two field studies. No significant differences were found for either field study in terms of correct, wrong, or NO decisions, or with overall accuracy, as a function of decision procedure. The only subtle evidence
for differences was found for the proportion of correct decisions for deceptive participants in the Blackwell (1999) data, where the difference in the percentage of correct decisions produced using the averaging versus individual procedures was marginally significant (p < .07).
Figure 6. Correct, wrong, and NO decisions as a function of participant status and decision approach using Blackwell (1999) data.
CORRECT
WRONG NO
ACCURACY0
10
20
30
40
50
60
70
80
90
100
PER
CEN
T
CORRECT
WRONG NO
ACCURACY
T i l
0
10
20
30
40
50
60
70
80
90
100
PER
CEN
T
INDAVG
APPROACH
DECEPTIVE NONDECEPTIVE
Senter & Ryan
Polygraph, 2005, 34(1) 19
Figure 7. Correct, wrong, and NO decisions as a function of participant status and decision approach using Krapohl et al. (2001) data.
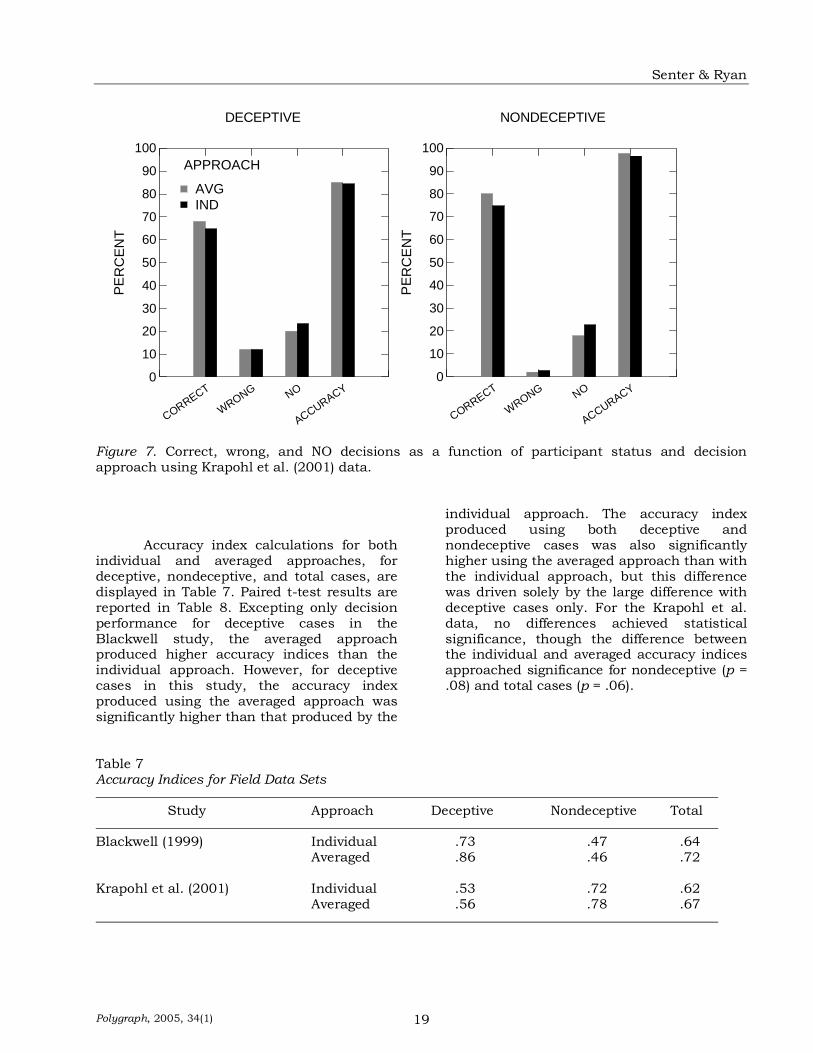
Accuracy index calculations for both individual and averaged approaches, for deceptive, nondeceptive, and total cases, are displayed in Table 7. Paired t-test results are reported in Table 8. Excepting only decision performance for deceptive cases in the Blackwell study, the averaged approach produced higher accuracy indices than the individual approach. However, for deceptive cases in this study, the accuracy index produced using the averaged approach was significantly higher than that produced by the
individual approach. The accuracy index produced using both deceptive and nondeceptive cases was also significantly higher using the averaged approach than with the individual approach, but this difference was driven solely by the large difference with deceptive cases only. For the Krapohl et al. data, no differences achieved statistical significance, though the difference between the individual and averaged accuracy indices approached significance for nondeceptive (p = .08) and total cases (p = .06).
Table 7 Accuracy Indices for Field Data Sets
Study Approach Deceptive Nondeceptive Total
Blackwell (1999) Individual .73 .47 .64 Averaged .86 .46 .72 Krapohl et al. (2001) Individual .53 .72 .62 Averaged .56 .78 .67
CORRECT
WRONG NO
ACCURACY0
10
20
30
40
50
60
70
80
90
100
PER
CEN
T
CORRECT
WRONG NO
ACCURACY0
10
20
30
40
50
60
70
80
90
100
PE R
CE
NT
INDAVG
APPROACH
DECEPTIVE NONDECEPTIVE
The Impact of Averaging Assigned Scores on Polygraph
Polygraph, 2005, 34(1)
20
Table 8 Paired T-Test Results for Comparing Accuracy Index for Field Data Sets
Study Sample df T p
Blackwell (1999) Deceptive 49 4.59 .00 Nondeceptive 49 -0.19 .85 Total 99 3.14 .00 Krapohl et al. (2001) Deceptive 49 0.93 .36 Nondeceptive 49 1.77 .08 Total 99 1.90 .06
Table 9 shows the complete and average individual agreement and Spearman correlation coefficients for decisions produced using the two approaches. All proportions of agreement were statistically greater than the
chance level of 0.33 (p < .05), and the correlation coefficients were also statistically significant.
Table 9 Proportion of Complete and Average Scorer Agreement and Spearman Correlations using Individual and Averaged Approaches with Field Data Sets
Complete Average
Study Agreement Agreement r
Blackwell (1999) .50 .81 .76 Krapohl et al. (2001) .56 .83 .79
Discussion
Overall, results using field data sets were similar to those produced using the laboratory data sets. Once again, no statistically significant differences were produced for the proportion of correct, wrong, or NO decisions. In addition, significant levels of agreement were produced using the averaged and individual approaches, though levels of complete agreement were somewhat lower for the field data than for the laboratory data. Finally, there was some evidence for decision performance between the two approaches using the accuracy index.
One difference found in the analysis of
the laboratory and field data sets was the source of differences found using the accuracy index. For the laboratory data, evidence for averaged versus individual performance differences appeared exclusively for nondeceptive cases. This was true also for the Krapohl et al. data set, which approach statistical significance, but not for the Blackwell data set, which showed no difference for nondeceptive cases, but a large difference for deceptive cases. The Blackwell data set is different from the other four sets in that it did not contain an equal proportion of deceptive and nondeceptive cases. The large proportion of deceptive cases in this data set may, in some way, be the source of it discrepancy from the other four data sets.

Senter & Ryan
Polygraph, 2005, 34(1) 21
General Discussion
The simple purpose of the present study was to determine whether decisions produced using ad hoc groups would be more accurate than those produced individually. The results of the present study, using a total of 364 individual decisions across five data sets suggest partial evidence for an accuracy advantage of using group decisions versus individual decisions in the manner attempted here. These results are consistent with much of the ‘group versus individual’ literature cited earlier, where in many contexts, those in groups tend to outperform individual efforts.
From a positive standpoint, the present study included a rather large sample size, and was diverse in nature, exploring data from different laboratory and field studies. However, there are a number of limitations associated with this study that should be noted. First, only one type of decision rule was integrated into the present study. While a multitude of possible decision rules exist (Senter & Dollins, 2004a; 2004b; 2001; Senter, Dollins, & Krapohl, 2004), only the total score rule was used in the present study, primarily for information management reasons. Second, only ZCT format examinations were included, whereas other possible formats exist that could be explored. Third, the ad hoc group approach is only a single approach that can be taken to achieve a comparison between group and individual
performance. Group performance can be explored in a more interactive, dynamic context where members of the group discuss their score assignments, rather than simply combining their individual assigned scores, as was the approach taken in the present study. A variety of approaches can be taken and are necessary in order to flesh out this question more thoroughly. Fourth, as with any detection of deception approach, there is inherent the problem of determining the effectiveness of any such technique, be it polygraph or otherwise, in the real world. Both laboratory and field data sets were used in the present study, but from many perspectives, though one may complement the strengths and weaknesses of the other, they are both viewed as flawed (Iacono, 1991; National Research Council, 2003).
In conclusion, the results of the present study suggest partial evidence that decisions produced individually and averaged are different from group-like decisions produced from averaged assigned scores. In the context of a real-world polygraph examination, a group-like approach is taken with respect to ultimate decision confirmation, but scores are not combined prior to the decision stage. The present work suggests some evidence that this subtle modification to the existing decision process might provide an increase in decision performance.
References
Bell, B. G., Raskin, D. C., Honts, C. R., & Kircher, J. C. (1999). The Utah numerical scoring system. Polygraph, 28, 1-9.
Blackwell, N. J. (1999). Polyscore 3.3 and psychophysiological detection of deception examiner rates
of accuracy when scoring examinations from actual criminal investigations. Polygraph, 28, 149-175,
Bottger, P. C., & Yetton, P. W. (1987). Improving group performance by training in individual
problem solving. Journal of Applied Psychology, 72(4), 651-657. Department of Defense Polygraph Institute Staff (2001). Test of a mock theft scenario for use in the
Psychophysiological Detection of Deception: IV. Polygraph, 30(4), 244-253. Gravetter, F. J., & Wallnau, L. B. (2000). Statistics for the Behavioral Sciences (5th ed.). United
States: Wadsworth.
The Impact of Averaging Assigned Scores on Polygraph
Polygraph, 2005, 34(1)
22
Grofman, B., Feld, S. L., & Owen, G. (1984). Group size and the performance of a composite group majority: Statistical truths and empirical results. Organizational Behavior and Human Performance, 33, 350-359.
Iacono, W. G. (1991). Can we determine the accuracy of polygraph tests? Advances in
Psychophysiology, 4, 201-207. Kircher, J. C., & Raskin, D. C. (1988). Human versus computerized evaluations of polygraph data
in a laboratory setting. Journal of Applied Psychology, 73(2), 291-302. Krapohl, D. J., Dutton, D. W., & Ryan, A. H. (2001). The rank order scoring system: Replication
and extension with field data. Polygraph, 30, 172-181. Laughlin, P. R. (1980). Social combination processes of cooperative, problem-solving groups on
verbal intellective tasks. In M. Fishbein (Ed.), Progress in social psychology. Hillsdale, NJ: Erlbaum.
Laughlin, P. R., & Ellis, A. L. (1986). Demonstrability and social combination processes on
mathematical intellective tasks. Journal of Experimental Social Psychology, 22, 177-189. Lebie, L. (1998). Group and individual identification of abstract works of art. Dissertation Abstracts
International, 58(10-B), 5699. Libby, R., & Blashfield, R. K. (1978). Performance as a composite as a function of the number of
judges. Organizational Behavior and Human Performance, 21, 121-129. Libby, R., & Trotman, K. T., & Zimmer, I. (1987). Member variation, recognition or expertise, and
group performance. Journal of Applied Psychology, 72(1), 81-87. Michaelson, L. K., Watson, W. E., & Black, R. H. (1989). A realistic test of individual versus group
versus consensus decision making. Journal of Applied Psychology, 74(5), 834-839. Miller, N. R. (1996). Information, individual errors, and collective performance: Empirical evidence
on the Condorcet Jury Theorem. Group Decision and Negotiation, 5, 211-228. Miner, F. C. (1984). Group versus individual decision making: An investigation of performance
measures, decision strategies, and process losses/gains. Organizational Behavior and Human Performance, 33, 112-124.
Morgan, P.M., & Tindale, R.S. (2002). Group vs individual performance in mixed-motive situations:
Exploring an inconsistency. Organizational Behavior and Human Decision Processes, 87(1), 44-65.
National Research Council (2003). The Polygraph and Lie Detection. The National Academies Press:
Washington, DC. Pollina D. A., A. Dollins, S. Senter, D. Krapohl, & A. Ryan (in press). A comparison of polygraph
data obtained from individuals involved in mock crimes and actual criminal investigations. Journal of Applied Psychology.
Schloper, J., & Insko, C. A. (1992). The discontinuity effect in interpersonal and intergroup
relations: Generality and mediation. In W. Stroebe & W. Hewstone (Eds.), European Review of Social Psychology. New York: Wiley.
Senter & Ryan
Polygraph, 2005, 34(1) 23
Schwenk, C. & Valacich, J. S. (1994). Effects of devil’s advocacy and dialectical inquiry on individuals versus groups. Organizational Behavior and Human Decision Processes, 59, 210-222.
Senter, S. M., & Dollins, A. B. (2004). Comparison of three versus three or five question series
contingency rules: A replication. Polygraph, 33(4), 223-232. Senter, S. M., & Dollins, A. B. (2004). Optimal combinations of decision rules and question series
usage rules: An exploration. Manuscript submitted for publication. Senter, S. M., & Dollins, A. B. (2001). New Decision Rule Development: Exploration of a Two-Stage
Approach. (Report No. DoDPI01-R-0006). Fort Jackson, SC: Department of Defense Polygraph Institute.
Senter, S. M., Dollins, A. B., & Krapohl, D. J. (2004). Comparison of Utah and DoDPI scoring
accuracy: Equating veracity decision rule, chart rule, and number of data channels used. Polygraph, 33(4), 214-222.
Siegel, S., & Castellan, N. J. (1988). Nonparametric statistics for the behavioral sciences (2nd ed.).
New York: McGraw-Hill. Stroop, J. R. (1932). Is the judgment of the group better than that of the average member of the
group? Journal of Experimental Psychology, 15, 550-562. Swinford, J. (1999). Manually scoring polygraph charts utilizing the seven-position numerical
analysis scale at the Department of Defense Polygraph Institute. Polygraph, 28, 10-27. Thompson, L., Peterson, E., & Brodt, S. E. (1996). Team negotiation: An examination of integrative
and distributive bargaining. Journal of Personality and Social Psychology, 70, 66-78. Valacich, J. S., Wheeler, B. C., Mennecke, B. E., & Wachter, R. (1995). The effects of numerical and
logical group size on computer-mediated idea generation. Organizational Behavior and Human Decision Processes, 62(3), 318-329.
Neural Mechanism of Deception
Polygraph, 2005, 34,1 24
Neural Mechanisms of Deception and Response Congruity in a Visual Two-Stimulus Paradigm with Motor Response1
Jennifer M. C. Vendemia2 and Robert F. Buzan3
Abstract The influence of deception and stimulus congruity on brain event-related potentials (ERP) was studied in 43 college-aged participants. Previous ERP studies of deception manipulated recollection of past events to study waveforms associated with deceptive responses. To circumvent the memory issue, participants in the current study viewed questions to which they were randomly prompted to respond with varying levels of deception and congruity. ERPs were analyzed with temporal principal components analysis and electrical current dipole source analysis. Four waveforms were affected by the experimental manipulations: an early positive component (P3a) in the cingulate gyrus, a subsequent centro-parietal positivity (P3b) with multiple cortical sources, a late occurring negativity (N4) in the inferior frontal gyrus, and a late positive complex in regions of the temporal gyrus and anterior cingulate. The findings are used to formulate a preliminary theory of deception in which early attentional processes are followed by evaluative and decision-making processes, and then by a final reanalysis.
Event-related potentials (ERPs) have been used to understand the neurocognitive processes associated with deception. Based on the mechanisms known to elicit these potentials, conflicting cognitive theories of the processes underlying deception have been developed (Boaz, Perry, Raney, Fischler, & Shuman, 1991). Theorists argue that the process of deception may involve attentional capture (Allen & Iacono, 1997), working memory load (Dionisio, Granholm, Hillix, & Perrine, 2001; Stelmack, Houlihan, & Doucet, 1994), or perceived incongruity with semantic and episodic memory (Boaz et al., 1991). To address the issue of attentional capture, the current study used an attention-switching paradigm, and to address the issue of working memory load, utilized a paradigm involving multiple levels of difficulty. Using sentence evaluation instead of denial of recall-based information eliminated the issue of episodic memory.
Three waveforms have been reported in deception research, the P3b, P3a, and N4. They vary in the way they are generally produced and in the way they have been studied in relation to deception. The P3b is by far the most frequently reported component of the three, and is typically studied in the context of the so-called “Guilty Knowledge” (GK) oddball paradigm. In the general oddball paradigm, an infrequently occurring stimulus is presented in a sequence of frequently occurring stimuli. The “oddball” stimulus produces a large positive ongoing peak with a latency of 350-600 ms and a distribution whose maximum amplitude is at parietal sites and whose minimum amplitude is at anterior sites (Verlager, 1997). Similarly, the GK/oddball consists of low probability stimuli that involve guilty knowledge presented among a series of high probability stimuli that do not involve guilty knowledge. In this paradigm, the
1 This research was supported by a grant from the Department of Defense Polygraph Institute, # DABT60-00-1-1000, and a Major Research Instrumentation Award, # BCS-9977198. I wish to acknowledge Dr. John Richards for his technical advice and support, and William Campbell for his aid in computer program design, testing participants, and data editing. Address and Affiliation 2Jennifer M. C. Vendemia, Department of Psychology, University of South Carolina, Columbia, SC, 29208. Phone (803) 777-6738, [email protected]. Correspondence concerning this article should be addressed to Jennifer M. C. Vendemia, Department of Psychology, University of South Carolina, Columbia, SC, 29208. Electronic mail may be sent via Internet to [email protected]. 3Robert F. Buzan, Department of Psychology, University of South Carolina, Columbia, SC, 29208. Phone (803) 777-6738, [email protected].

Vendemia & Buzan
Polygraph, 2005, 34,1 25
low probability guilty knowledge item elicits a larger P3 component than the non-targets (Allen, Iacono, & Danielson, 1992). Although, researchers reporting ERPs from the GK/oddball in this area do not explicitly describe this waveform as a P3b, its spatio-temporal characteristics suggest it matches those of the P3b (Rosenfeld, Ellwanger, Nolan, Wu, Bermann, & Sweet, 1999).
The GK/oddball effect has been
demonstrated across multiple design permutations with visual and auditory stimuli. Across these studies, the P3 component of the ERP reliably and accurately indicates the presence of concealed knowledge (Allen & Iacono, 1997; Allen et al., 1992; Bashore & Rapp, 1993; Ellwanger, Rosenfeld, Sweet, & Bhatt, 1996; Farwell & Donchin, 1991; Rosenfeld, 1995, 1998; Rosenfeld, Sweet, Chuang, Ellwanger, & Song, 1996). However, the P3b is involved in many types of higher cortical functions including stimulus evaluation (Gevins, Cutillo, & Smith, 1995; Ruchkin, Johnson, Canoune, Ritter, & Hammer, 1990, Verleger, 1997), attention resource allocation (Comerchero & Polich, 1999), and updating of information held in working memory (Donchin & Coles, 1988; Ruchkin, Johnson, Canoune, & Ritter, 1990). Precisely which of these underlying processes are involved in deception is unclear, and in the GK/oddball task an often criticized confound of episodic memory further obscures the findings (Allen & Iacono, 1997).
In the psychophysiological detection of
deception field the GK paradigm is now referred to as the concealed knowledge paradigm instead of the guilty knowledge paradigm because peripheral nervous system responses in this context are associated with the possession of the knowledge rather than the guilt associated with the knowledge. A second problem with this paradigm is the potential for item contamination, whereby target items could generate responses in truthful participants due to familiarity or simple exposure to target information.
Because of the confounds involved with
the GK paradigm, the current study used a specific form of the comparison question test (CQT) called the directed lie comparison test (DLC). In the DLC, participants are instructed
to lie to specific questions throughout the exam. The DLC is divided into two main categories dependent on question content: (1) Trivial DLC and (2) personally significant DLC (Krapohl & Sturm, 1997). The DLC is more standardized than other forms of the CQT, it requires less psychological manipulation, it is less intrusive to participants, and it has been said to be easier to explain in court (Raskin, Kircher, Horowitz, & Honts, 1989). The validity of the test has been established in laboratory (Horowitz, 1988) and field (Honts & Raskin, 1988) studies using traditional polygraph measures.
Two main theories of deception, the
attention theory and the working memory load theory, suggest different patterns of response for the P3b based on the antagonistic effects of attention and workload (Kok, 2001). Attention theorists argue that attentional capture of the low frequency GK items increases the amplitude of the P3b while working memory load theorists argue that the increased working memory demands required for deceptive processing suppresses the P3b. In the current study, a low probability paradigm was not used so the effects of attention and workload could be parametrically equated on a trial-by-trial basis.
Like the P3b, the P3a is elicited by an
oddball paradigm. In one variant of the oddball, the three-stimulus paradigm, the P3a occurs in response to novel-infrequent stimuli presented in addition to the “typical” oddball stimuli. The P3a can be elicited by shifts in attention (Comerchero & Polich, 1999), switching from difficult to easy task demands (Comerchero & Polich, 1999; Harmony et al., 2000), and alerting (Katayama & Polich, 1998). Across studies reporting the P3a in an oddball, it is alerting stimuli combined with initial attentional allocation, that produce the phenomenon (Katayama & Polich, 1998). The term “P3a” is applied to an assortment of early P3 components with anterior distributions, and the exact conditions necessary to evoke a P3a vary across paradigm and stimulus demands (Katayama & Polich, 1998). In general, the waveform is characterized as a positive going peak with an anterior distribution, and a latency of 250-350 ms (Comerchero & Polich, 1999; Harmony et al., 2000; Spencer, Dien, & Donchin, 1999).

Neural Mechanism of Deception
Polygraph, 2005, 34,1 26
Two ERP studies of deception reported an early positivity with spatio-temporal characteristics similar to the P3a (Matsuda, Hira, Nakata, & Kakigi, 1990; Pollina & Squires 1998). Neither of the reported studies involved the oddball paradigm: (a) Pollina and Squires (1998) employed graded judgments of true and false sentences and (b) Matsuda et al., (1990) used a two-stimulus target detection task in which the first stimulus involved participant related information. Although the findings were mixed, Pollina and Squires (1998) suggested that the P3a occurred in probably true conditions. The present study used an attention-switching paradigm, so a P3a was expected. In addition, the amplitude of the P3a was anticipated to be larger preceding truthful responses than deceptive responses.
Unlike P3b and P3a, the last
component reported in studies of deception, the N4 component, is sensitive to semantic incongruity. Researchers argue that deception represents an incongruity between internal truth and external response (Bashore & Rapp, 1993). The N4 is a large negative going peak at around 400 ms with maximum amplitude in anterior and temporal regions. It is produced by stimuli that are incongruent in relation to the preceding context and is predominantly limited to linguistic information. The N4 component has been elicited by the possession of concealed knowledge in sentence completion tasks involving false sentence completions (Boaz et al., 1991) and in a two-stimulus target detection task (Matsuda et al., 1990). Bashore and Rapp (1993) suggest that the N4 is reactive to anomalies in semantic and episodic memory as well as to inconsistencies in language semantics. A study that did not share language inconsistence, but did share anomalies in semantic and episodic memory found no differences in N4 amplitude. In that study participants made graded truth-value judgments that were sometimes inconsistent with memory, and these failed to alter N4 amplitude or latency (Pollina & Squires, 1998). In a two-stimulus task, the N4 was not found to be sensitive to deception although it was found to be sensitive to response congruity with the second stimulus (Stelmack, Houlihan, & Doucet, 1994; Stelmack, Houlihan, Doucet, & Belisle, 1994).
Similar to the preceding study, the current study used “True” and “False” second stimulus prompts following a first stimulus that consisted of a sentence. In this paradigm, participants had to agree or disagree with the second stimulus. The response demand created congruous and incongruous memory related conditions in addition to those with a deception component. The current study did not contain a memory component so congruity with episodic and semantic memory could not be examined, but it was expected that the N4 would be sensitive to response congruity as well as deception.
The P3b, P3a, and N4 components
have not been uniformly successful in the identification of deception. This is partially due to paradigm variation, but is also the result of two major problems within the field of ERP deception research. First, the current topographical identification of components is not sensitive enough to adequately describe the waveforms. It has been reported consistently in the ERP literature that the P3 component is comprised of multiple neural sources, and that different combinations of those sources result in different topographies (Katayama & Polich, 1998; Verlager, 1997). At this time, no deception ERP study exists with sufficient spatial resolution to capture topographical variation and identify the underlying neural sources.
One goal of the present study is to
develop a model of deception based on the underlying neuronal substrates of the ERP components. In order to trace those substrates, a combination of temporal and spatial techniques was necessary. Based on the temporal localizations, raw data was extracted for dipole source localization. Dipole parameters were initialized on the basis of a priori knowledge of the cortical generators of the relevant waveforms, information derived from the principle components analyses (PCAs), and evidence from previous fMRI, PET, rCBF, and ERP studies.
Dipole source localization (ECD) and
functional magnetic resonance imaging (fMRI) studies suggested that the P3b in motor response tasks such as the GK/oddball might be generated in regions of the hippocampal formation, thalamus, and parietal lobe

Vendemia & Buzan
Polygraph, 2005, 34,1 27
(Yamazaki, Kamijo, Kiyuna, Takaki, & Kuroiwa, 2001; Opitz, Mecklinger, von Cramon, & Kruggel, 1999). The P3a has been localized to the frontal lobes through studies of frontal lobe damage (Alho et al., 1998; Knight, 1991; Nasman & Dorio, 1993), and also localized to regions of the temporal lobe with ECD (Barcelo & Francesco, 1998). N4 activations have been identified in the superior temporal gyrus and right prefrontal cortex (Opitz, Mecklinger, von Cramon, & Kruggel, 1999). Because intracranial sources of the mechanisms of deception-related processes have not been investigated previously, the goal of the localization process in the present study was to provide a framework for a neurocognitive theory of deception, and to provide potential constraints for future dipole studies on individual data.
The second major problem in the field
of ERP deception research is the lack of systematic evaluation of the conflicting theoretical perspectives of deception. Attention theories have been evaluated in a paradigm that capitalizes on attentional capture, while working memory load theory utilizes paradigms without an attention-switching component. This is problematic because task difficulty and attention demands have differential effects on the amplitudes of the P3a and P3b (Kok, 2001). With respect to the P3b, task difficulty reduces the amplitude while attentional demands increase the amplitude. However, the amplitude of the P3a is related to attention-switching, or attentional capture (Comerchero & Polich, 1999; Harmony et al., 2000). In studies involving attentional switching the P3a is suppressed during the primary task and enhanced following attentional capture by the secondary task (Wilson, Swain, & Ullsperger, 1998) while in a working memory load task with two stimuli it is more likely enhanced during the primary task when the first stimulus involves an alerting component.
The additional uncertainty about the
role of memory in deception has created problems for measurement of both the P3 and N4 complex. If the P3b is the result of recognition of a familiar object within a series of unfamiliar objects, then what role does the P3 play specifically in the process of deception? If the N4 is sensitive to
incongruities in semantic and episodic memory, is it also sensitive to response incongruities?
One way to answer these questions is
to utilize a paradigm that combines congruity, workload, and attention switching and then evaluate all of the relevant waveforms. In the current study, a two-stimulus paradigm was used in which the first stimulus consisted of a question and the second of a “true” or “false” prompt. Similar to studies by Stelmack (Stelmack, Houlihan, & Doucet, 1994; Stelmack, Houlihan, Doucet, & Belisle, 1994) participants were asked to evaluate the first stimulus and, based on its truth-value, agree or disagree to the second stimulus. The two-stimulus paradigm differs from the oddball paradigm in two important ways. First, all stimuli are equiprobable. The effects of stimulus probability on the P3 are mitigated. Stelmack theorized that lying, as a cognitively challenging task, would attenuate P3 amplitude. In his studies, stimuli were blocked, which reduced attentional capture and increased working memory load. Second, unlike the oddball paradigm, the stimuli under investigation do not need to include a recognition memory component so that the effects of congruity and deception on the ERP can be evaluated within the same waveform without the influence of memory.
The two-stimulus paradigm has yielded
mixed results: in a study of 20 men, the P3 amplitude did decrease during deceptive responding, but in a follow-up study of 20 women, the P3 amplitude increased following deceptive responding (Stelmack, Houlihan, Doucet, & Belisle, 1994). The nature of the findings may be the result of relatively small sample sizes combined with the lack of screening for a number of factors known to affect P3 amplitude and an insufficient number of ERP trials to generate averaged potentials.
The present study used sentence
evaluation instead of a mock crime scenario, and presented the stimuli randomly instead of in blocks. The purpose of random sentence presentation was to capture components involved in attention switching and updating of cognitive workload. P3a, P3b, and N4 were evaluated with respect to previous literature.

Neural Mechanism of Deception
Polygraph, 2005, 34,1 28
It was hypothesized that if P3b were sensitive to deceptive responses in a manner similar to that of the GK/oddball paradigm, a greater P3b would be associated with deceptive responses than with truthful responses. However, if the P3b were sensitive to deceptive information in a manner similar to studies of working memory load, the amplitude of the P3b would be smaller during deception. The P3a would be associated with changes in focused attention, such as alerting, and attention switching. Reliable studies of the P3a have been limited to simple stimuli utilized in an oddball paradigm. Although, the relationship of deception and the P3a is unclear, those conditions involving alerting stimuli and attention switching should increase the amplitude of the P3a. The dominant effects of congruity would be associated with the N4, and as predicted from the literature, incongruous responses would be associated with greater N4 amplitude than congruous responses.
Methods
Participants
Participants were 42 undergraduate students (22 women, 20 men) recruited from the University of South Carolina student population. Their ages ranged from 18 – 43 (M = 21.00, SD = 5.77). All had normal or corrected to normal vision with no known color impairments. Because of reported differences in the amplitude and latency of the P3 waveform, all participants were right-handed (Polich & Hoffman, 1998). Participants were also screened for a variety of neurological and medical disorders known to alter EEG/ERP characteristics, and asked to avoid drugs, alcohol, and caffeine for 24-hours preceding recording, in line with recommendations from Duffy (1989).
Apparatus and Stimuli
Each participant sat in a comfortable chair approximately 122 cm from a 29” color video computer monitor (NEC Multisync XM29) displaying at 1280 horizontal and 1024 vertical pixels.
The two-stimulus paradigm involved
the pairing of a first stimulus that participants evaluated followed by a second stimulus to which they responded. The first stimulus
included a series of 60 sentences that were obviously true or false (e.g., “I am human”). These stimuli were derived from a set of 100 true or false sentences that had been pre-tested for comprehension with an undergraduate sample at the university. A sample of the sentences in Table 1 shows ten of the statements used: each statement was short and easy to understand. The second stimulus consisted of the word “TRUE” or “FALSE”.
Participants were instructed to indicate
agreement or disagreement with the second stimulus by key-press. The sentence presentation lasted 2500 ms, followed by a 750 ms fixation point, and the second stimulus that lasted 1000 ms.
Table 1 Examples of the First Stimulus Sentences with Base Values of True or False Truth Base
Value Sentences
True A piano is a musical instrument.
Glue is Sticky.
French fries are made with potatoes.
A day is longer than an hour. Poodles are dogs. False
The sun is closer to Earth than the moon.
Grass is red.
People are born wearing clothes.
Snakes have legs.
Elephants are smaller than rabbits.
Participants responded to the second
stimulus by indicating agreement or disagreement with a key press. Participants were cued by sentence color to respond deceptively on 50% of the trials and truthfully on the other 50%. The stimuli were presented in red or blue, and participants were randomly assigned “deceptive” and “truthful” colors. For each condition participants were required to make a congruent response (agree) on 50% of

Vendemia & Buzan
Polygraph, 2005, 34,1 29
the trials and an incongruent (disagree) response on the other 50% of the trials.
As shown in Figure 1 when
participants were colored cued to be truthful and the second stimulus provided a truthful answer they responded with a congruent truthful key press. When color cued to be truthful but the second stimulus did not provide a truthful answer they responded with
an incongruent truthful key press. When color cued to be deceptive and the second stimulus provided a deceptive answer they responded with a congruent deceptive key press. Finally, when color cued to be deceptive but the second stimulus did not provide deceptive answer they responded with an incongruent deceptive key press. ERP data were collected on three blocks of 60 randomized trials each. This resulted in 45 trials of each trial type.
Figure 1. Time course of stimuli administration for the two-stimulus paradigm. In the example, if the color blue (in black) cued a truthful response and red (in white) a deceitful response, congruent true would occur if stimulus 1 was true and stimulus 2 was the word “TRUE”, incongruent true would occur if stimulus 1 was true but stimulus 2 was the word “FALSE” and so on. In the first case the participant is truthful by agreeing with stimulus 2, and in the second case the participant is truthful by disagreeing with stimulus 2.
Procedure Participants arrived at the lab on the
day of the experiment and were familiarized with the research procedure before signing the
consent form. They practiced on a pencil and paper measure that included all stimuli used in the study. Participants did not score differently on the deceptive vs. true conditions
Incongruent Truthful
Congruent Deceptive
Incongruent Deceptive
Congruent Truthful
The grass is green. +
True
The grass is green.
+
False
The grass is green.
+
False
The grass is green.
True
Stimulus 2 1000 ms
Fixation Prompt750 ms
Stimulus 1 2500 ms

Neural Mechanism of Deception
Polygraph, 2005, 34,1 30
of the paper and pencil task t(29)=1.41 p = 0.08. Following the paper task they were seated in front of the monitor, were fitted for the sensor net, and received additional computer-based practice. They were required to attain 60% correct during practice to begin the experiment.
During the experiment participants
initiated each trial by key press. They were instructed to blink during the period between trials. Blinking during trials was measured by the difference between electrical activity above and below the eye. Trials with blinks were not used in the analyses. Recording and Segmenting of EEG for ERP
ERPs in truthful and deceptive conditions were recorded using a 128 channel “Geodesic Sensor Net” with the EGI system (Electrical Geodesics, Incorporated, Eugene, OR; Tucker, Liotti, Potts, Russell, & Posner, 1994). The net was positioned according to its anatomically marked locations. Sites on this cap can be interpolated to those of the “International 10-20” system (Luu & Ferree, 2000; Srinivasan, Tucker, & Murias, 1998). The signal was referenced to the vertex. Impedances were kept below 100 kΩ, and the signal was amplified with the EGI “NetAmps” that consist of high-impedance amplifiers and a PowerPC-based computer system. The EGI “NetStation” computer program was used to control zero and gain calibrations for each participant, impedance calibration, A/D sampling (250 Hz), and EEG data storage. Band-pass filters were set at 0.1 to 100 Hz with 20K amplification.
A second computer was time-
synchronized with the PowerPC running the Netstation computer program so that time and trial information was stored with the EEG recordings. The data were segmented offline using a 600 ms baseline and 1000 ms post-stimulus period. Electrodes that exceeded a 70 µV threshold were eliminated from further analysis. Trials that contained more than 10 “bad” electrodes, an eyeblink, or an incorrect response to the second stimulus were eliminated. After this stage of data analysis any participant with more than 13% of the experimental trials rejected for any reason were eliminated from further analyses. Five of
the original 48 participants were eliminated through these procedures. For the rest of the participants missing data were replaced using the averaged potential of the five closest electrodes.
Data were rereferenced to an average
reference from the vertex reference, baseline corrected using the 600 ms pre-stimulus interval, and filtered from 3 to 13 Hz using a second order Butterworth Polynomial.
Cortical Source Modeling Procedure
Dipole modeling of the intracranial sources for the waveforms in truthful and deceptive conditions was conducted using EMSE (Scherg, 1990; Scherg, 1992; Scherg & Picton, 1991; Huizenga & Molenaar, 1994). Time intervals for analysis included the time point with the highest loading for each principal component and the maximum amplitude of the corresponding waveform in each of the four conditions. The results were used in concert with existing literature to constrain the dipoles. To explore the deviation of spatial topography across truthful and deceptive conditions, and to aid in the process of determining when dipole models might differ across conditions, t-tests were performed on each of the spatial PCAs. The results were combined with data from previous studies to constrain the dipoles.
A structural MR recording was made
for an individual whose scalp/skull landmarks fell within one standard deviation of the mean head measurements for all participants (e.g., nasion-inion diameter and circumference). On the basis of these head measurements and the known locations of the Sensor Net electrodes, an electrode placement map was generated for this individual as well as a spherical head model. The localization of the equivalent current dipoles estimated in the EMSE program were then translated into saggital, coronal, and axial coordinates in the Talariach system for localization purposes (Talairach, & Tournoux, 1988).
Results
Behavioral Measures
A 2 x 2 repeated measures ANOVA (Deception x Congruity) identified two main effects in the reaction time data. Participants’

Vendemia & Buzan
Polygraph, 2005, 34,1 31
response latencies were significantly longer in the incongruent condition than in the congruent condition F(1,42) = 68.51, p = 0.001, and were significantly longer in the deceptive condition than in the truthful condition, F(1, 42) = 12.22, p = 0.001. As shown by Figure 2 there were no interactions. In order to address the potential influence of
gender as demonstrated by Stelmack, Houlihan, Doucet, and Belisle (1994), unpaired t-tests were conducted by gender. There were no significant differences in reaction time between men and women, t(41) =-0.45, p = 0.66. Gender was excluded from subsequent analyses.
Figure 2. Average reaction time (ms) for truthful and deceptive responses across congruent and incongruent conditions. Principal Component Analyses
Following filtering, data were analyzed by a temporal Principal Components Analysis (PCA), based on the correlation matrix, using a 0 – 600 ms window. The first 15 factors explained 99.26% of the variance, and were retained. PCs with minimum loadings of .9 were plotted to represent independent sources of temporal activity in the ERP signal (Spencer et al., 1999). The first principal component coincided with the P1 waveform and was eliminated from further analyses. Unexpectedly, two components aligned with the P3a and another component aligned with a waveform labeled the late positive complex. These additional components were included in
the analyses. The late positive complex will be discussed within the context of its relationship to the P3b. Figure 3 shows the loadings for the principal components coinciding with the waveforms of interest, the P3a, P3b, N4, and late positive complex (PCs 2 - 7). PCs were submitted to 2 x 2 (Deception x Congruity) repeated measures ANOVAs.
P3a. Two potential components
aligned temporally with the P3a, both of these components were positive and were distributed over the anterior regions. A 2 x 2 (Deception x Congruity) repeated measures ANOVA was performed on each component. The loadings for the first component (PC4) were strongest at
650
700
750
800
850
900
950
1000
1050
1100
Congruent Incongruent
Mea
n R
eact
ion
Tim
e (m
s)
.
TruthfulDeceptive

Neural Mechanism of Deception
Polygraph, 2005, 34,1 32
260ms. The results of the ANOVA indicate that this waveform was significantly larger for congruous responses than incongruous responses, F(1, 42) = 9.48, p = .004. The second P3a component’s maximum amplitude was slightly later, occurring at 296 ms. For this component, PC6, a main effect of congruity was identified as well as interactions between deception and congruity. Figure 4 shows, that different from PC4, across all
participants, this component was larger for incongruent than congruent responses. A small interaction between congruity and deception occurred such that PC6 was larger for truth than deception when the response was congruent, but the opposite was the case when the response was incongruent F(1, 42) = 4.79, p = .034.
El
ectro
de 1
7 (F
pz)
Elec
trode
16
(Afz
)
Elec
trode
11
(Fz)
Elec
trode
6 (F
cz)
Elec
trode
55
(Cpz
)
Congruent Truthful Incongruent Truthful Congruent Deceptive Incongruent Deceptive
2 -2
Prin
cipa
l Com
pone
nt L
oadi
ngs
-1
0
1
200 400 600
Figure 3. Loading weights for Principal Components 2-7 (left) compared to the average ERPs recorded at frontal, central, and parietal midline sites (Fpz, Afz, Fz, FCz, CPz) from 43 participants during deception and truthful responses across congruent and incongruent conditions (left). In the incongruent deceptive condition at the frontal midline electrodes the P3a (264, 292 ms) amplitude is smallest, but at the central electrodes the P3b (472 ms) amplitude is greatest.
P3b and late positivity. PCs in the 450 – 550 ms range aligned with positive deflections in the centro-parietal area and fronto-temporal region. As Figure 4 shows, two 2 x 2 (Deception x Congruity) repeated measures ANOVAs revealed different effects between the components. The highest loading for the PC2 was at 472 ms. Results indicated main effects of deception and congruity, but
no interactions. This component was larger for truthful responses than for deceptive responses F(1, 42) = 6.63, p = .014, and larger for congruent stimuli than for incongruent stimuli F(1, 42) = 8.36, p = .006. PC7’s highest loading occurred at 516 ms. The distribution for this component was fronto- temporal in nature. Results indicated one main effect for deception such that the

Vendemia & Buzan
Polygraph, 2005, 34,1 33
P3a PC4 (260 ms) PC6 (296 ms)
z Sco
re
Congruent Incongruent Congruent Incongruent P3b PC2 (472 ms) PC7 (516 ms)
z Sco
re
Congruent Incongruent Congruent Incongruent N4
PC5 (428 ms)
z Sco
re
Congruent Incongruent ____________________________
* Main effect of deception, ** Main effect of congruity, *** Interaction
Figure 4. Mean PCA scores for the P3a (PC4, PC6), P3b (PC2), N4 (PC5), and late positive complex (PC7).
-0.5-0.4-0.3-0.2-0.1
00.10.20.30.40.5
-0.5-0.4-0.3-0.2-0.1
00.10.20.30.40.5
-0.4
-0.3
-0.2
-0.1
0
0.1
0.2
0.3
-0.4
-0.3
-0.2
-0.1
0
0.1
0.2
0.3
-0.5-0.4-0.3-0.2-0.1
00.10.20.30.40.50.6 - 0.6
- 0.4
- 0.2
0
0.2
0.4
0.6
Truthful Deceptive
**
** ***
* **
*
** ***
Neural Mechanism of Deception
Polygraph, 2005, 34,1 34
component was significantly larger for deceptive than truthful responses F(1, 42) = 6.71, p = .013.
N4. The fifth PC aligned along a
waveform with a maximum negative amplitude at 428 ms and the frontal distribution typical of the N4 waveform. As expected, the 2 x 2 (Deception x Congruity) repeated measures ANOVA revealed a main effect for response congruity. Figure 4 shows that the N4 was significantly larger for incongruent than congruent responses, F(1, 42) = 31.32, p = .0001. An interaction between congruity and deception occurred such that the PC5 was of greater magnitude during deceptive responses than truthful responses in the congruent condition, but was of lesser magnitude in the incongruent condition, F(1, 42) = 7.59, p = .009
Electrical Current Dipole Source
Localization Analyses. The ECDs were constrained based on data from spatial principal components analyses performed on the raw data corresponding to the loadings of each of the temporal PCs. This information was combined with relevant data from lesion, fMRI, PET, rCBF, and ERP studies, and those regions that were common to the literature and to the analyses were entered into the dipole analysis. For this reason spatial PCA analyses are presented in conjunction with each of the ECD analyses.
Dipoles were entered into the model
and allowed to vary until a satisfactory dipole solution was obtained. After the solution was obtained individual dipoles were dropped from the model in a stepwise manner. If the removal of a dipole did not significantly change the amount of variance explained it was dropped from the analysis. This process was continued until each of the remaining dipoles contributed significantly to the final model.
P3a. Intracranial sources for the PCs
were constrained using data from earlier research. The intracranial sources for P3a (PC4 and PC6) were constrained using rCBF and fMRI studies of the three-stimulus oddball task with visual or auditory stimuli (Clark, Fannon, Lai, Benson, & Bauer, 2000; Ebmeier et al., 1995). The spatial PCA of the 4th temporal component, which explained 94.1%
of the topographic variance of PC4, suggested potential dipoles in the posterior, right anterior, and along the median of the anterior and central regions. A t-test (truth vs. deception) on the spatial PC’s suggested a different topographic distribution for those electrodes lying along the anterior median regions, t(42) = 2.65, p = .011. Because the data were based on group distributions and not individual participants, the data lacks the specificity of individual ECDs: it was impossible to achieve strong solutions for all of the components. The models presented in Table 2 were nearly identical across truthful and deceptive conditions and yielded solutions with a single dipole in the right anterior cingulate explaining 85.94% of the variance for truthful responses and 84.94% of the variance for deceptive responses.
The spatial PCA on the 6th temporal
PC, which explained 90.42% of the topographic variance of the component, suggested activity across the anterior, posterior, and right parietal regions. Although t-tests (truth vs. deception) on the components derived from spatial PCA on temporal PC6 data found no differences between conditions, the ECD solutions for PC6 did differ between deception conditions. In the truthful condition a single dipole in the left anterior cingulate explained 91.34% of the variance while in the deceptive condition a single dipole in the corpus callosum explained 91.78% of the variance.
P3b and long latency complex. The intracranial sources for the P3b (PC2) were constrained using data from previous source localization studies of the oddball paradigm with a motor response (Yamakazi et al., 2000; Yamakazi et al., 2001), and the results of the spatial PCA performed on temporal PC2.
Results from the spatial PCA, shown in
Figure 5, suggested activity over the posterior region, right anterior and central region, and anterior median region. The t-tests revealed no significant differences in topographic distribution for any of the spatial PCs. The ECD yielded a multiple solution with identical dipoles in both conditions as shown in Table 2. The solution explained 93.65% of the variance in the truthful condition and 93.11% of the variance in the deceptive condition.

Vendemia & Buzan
Polygraph, 2005, 34,1 35
Figure 5. Topographical Distribution of Cortical Activity by Time and Task Condition.
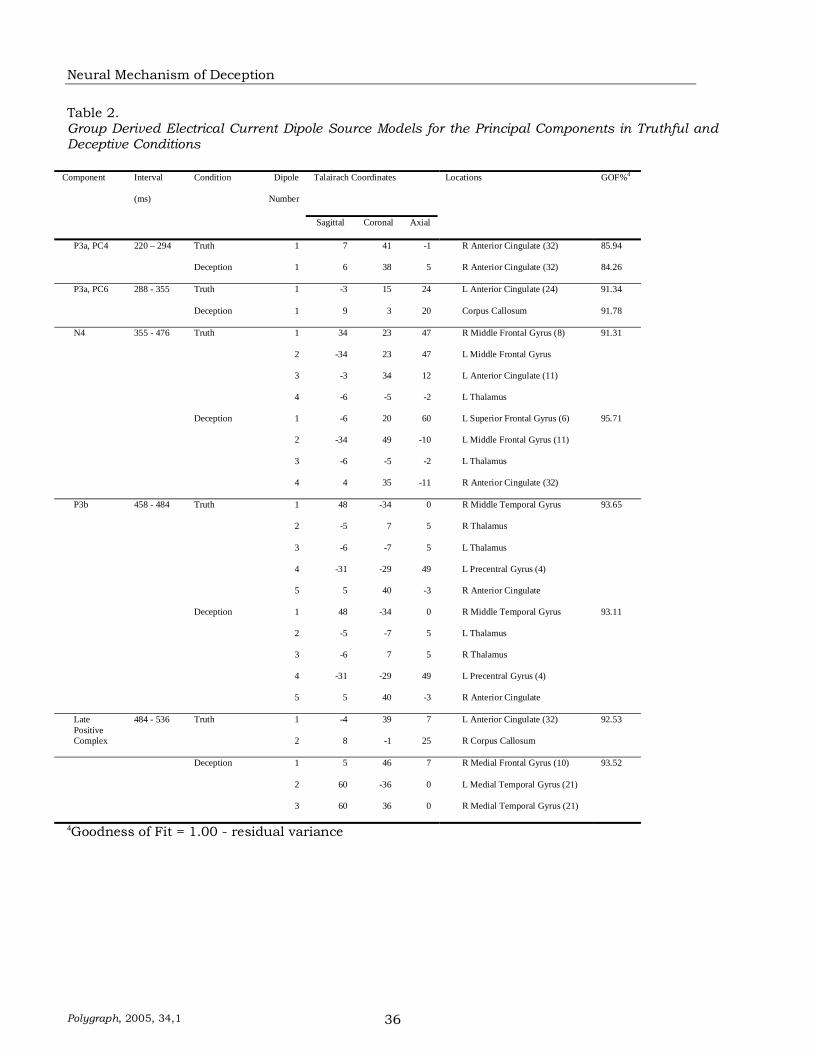
Neural Mechanism of Deception
Polygraph, 2005, 34,1 36
Table 2. Group Derived Electrical Current Dipole Source Models for the Principal Components in Truthful and Deceptive Conditions
Component Interval
(ms)
Condition Dipole
Number
Talairach Coordinates Locations GOF%4
Sagittal Coronal Axial
P3a, PC4 220 – 294 Truth 1 7 41 -1 R Anterior Cingulate (32) 85.94
Deception 1 6 38 5 R Anterior Cingulate (32) 84.26
P3a, PC6 288 - 355 Truth 1 -3 15 24 L Anterior Cingulate (24) 91.34
Deception 1 9 3 20 Corpus Callosum 91.78
N4 355 - 476 Truth 1 34 23 47 R Middle Frontal Gyrus (8) 91.31
2 -34 23 47 L Middle Frontal Gyrus
3 -3 34 12 L Anterior Cingulate (11)
4 -6 -5 -2 L Thalamus
Deception 1 -6 20 60 L Superior Frontal Gyrus (6) 95.71
2 -34 49 -10 L Middle Frontal Gyrus (11)
3 -6 -5 -2 L Thalamus
4 4 35 -11 R Anterior Cingulate (32)
P3b 458 - 484 Truth 1 48 -34 0 R Middle Temporal Gyrus 93.65
2 -5 7 5 R Thalamus
3 -6 -7 5 L Thalamus
4 -31 -29 49 L Precentral Gyrus (4)
5 5 40 -3 R Anterior Cingulate
Deception 1 48 -34 0 R Middle Temporal Gyrus 93.11
2 -5 -7 5 L Thalamus
3 -6 7 5 R Thalamus
4 -31 -29 49 L Precentral Gyrus (4)
5 5 40 -3 R Anterior Cingulate
Late Positive
484 - 536 Truth 1 -4 39 7 L Anterior Cingulate (32) 92.53
Complex 2 8 -1 25 R Corpus Callosum
Deception 1 5 46 7 R Medial Frontal Gyrus (10) 93.52
2 60 -36 0 L Medial Temporal Gyrus (21)
3 60 36 0 R Medial Temporal Gyrus (21)
4Goodness of Fit = 1.00 - residual variance
Vendemia & Buzan
Polygraph, 2005, 34,1 37
Dipoles were located in the right middle temporal gyrus, bilateral thalamus, right anterior cingulate, and left precentral gyrus.
The PC7 aligned along a long latency positive complex with a topographical maximum located in the temporal and frontal regions. A similar component has been identified in studies of the Stroop Effect (Liotti, Woldorff, Perez III, & Mayberg, 2000), so data from these studies was used to constrain the dipole analyses. The first ten spatial components derived from the spatial PCA of temporal PC7, explaining 93.60% of the topographic variance, revealed distributions over the middle anterior region, middle posterior region, and along the left and right sides of the temporal cortex. The t-tests performed on the spatial PCs suggested no differences in the distribution of the components across conditions; however, the ECDs did differ across conditions. Figure 6 shows that in the truthful condition, a 2-dipole model with sites in the left medial frontal gyrus and right corpus callosum explained 92.53% of the variance while in the deceptive condition, a 3-dipole model with sites in the right anterior cingulate and bilateral temporal gyrus explained 93.52% of the variance.
N4. The intracranial sources for the N4
(PC5) were constrained with data derived from a spatial PCA performed on PC5. As Figure 6 shows the spatial PCA, explaining 93.34% of the topographic variance of the N4, suggested sources in the posterior, anterior and temporal regions. This information was combined with fMRI, frontal lobe lesion, and previous ECD studies that suggested the N4 would be related to changes in the anterior cingulate, middle temporal gyrus, occipital cortex, and hippocampus (Liotti, Woldorff, Perez III, & Mayberg, 2000; Peterson, Skudlarski, Gatenby, Zhang, Anderson, & Gore, 1999; Stuss, Floden, Alexander, Levine, & Katz, 2001).
The t-tests run on the spatial PCA
components revealed a non-significant trend suggesting a topographic difference in the distribution of this component over the median region, t(42) = 1.86, p = .07, and a significant difference in the topographic distribution over the anterior median region, t(42) = 2.84, p = .007. The ECD yielded a 3-dipole solution for the truth condition
explaining 91.23% of the variance and a 4-dipole solution for the deceptive condition explaining 95.71%. As shown in Table 2, dipoles for the truth condition were located in bilateral sites of the middle frontal gyrus, and in the left anterior cingulate while dipoles for the deceptive condition were localized to the left superior frontal gyrus, the left middle frontal gyrus, the left thalamus, and the right anterior cingulate gyrus.
Discussion
In this study, five PCs were identified
with different temporal, topographical, and source localizations that reflected the contributions of underlying neuronal processes involved in deception. Researchers have argued about the roles of attention, working memory load, and evaluation of congruity in deceptive processing. The use of HD-ERP recordings allowed for clearer localization of waveforms in spatiotemporal domains and for the exploration of their intracranial sources. While the P3a appeared to be associated at some levels with attentional processes, the P3b was strongly related to working memory load, and the late positive complex may have been related to final evaluation of truth or deception.
The reaction time data supported the
conclusions that deceptive responses were more challenging than truthful responses and that incongruent responses were more challenging than congruent responses. The P3b (PC2) also varied predictably with task difficulty as previously found in studies by Stelmack (Stelmack, Houlihan, & Doucet, 1994; Stelmack, Houlihan, Doucet, & Belisle, 1994).
In the current study, as task difficulty
and reaction time increased, the amplitude of the P3b decreased, which most likely reflects a working memory load explanation (Kok, 2001; McGarry-Roberts et al., 1992; Picton, 1992). Interestingly, although there were main effects for deception and congruity there was no interaction between these conditions. It may be that the P3b represents different underlying neuronal sources during processing of these two types of information (Picton, 1992; Yamazaki et al., 2001). The spatial component structure of the P3b suggested dipoles along

Neural Mechanism of Deception
Polygraph, 2005, 34,1 38
Figure 6. P3a, P3b, N4, and late positive complex dipole solutions projected onto the axial, saggital and coronal MRI sections for one representative participant. Dipole solutions for the waveforms involved regions of the (A) anterior cingulate, (B) corpus callosum, (C) middle frontal gyrus, (D) thalamus, (E) superior frontal gyrus, (F) middle temporal gyrus, (G) medial temporal gyrus, (H) precentral gyrus, and (I) medial frontal gyrus.
.

Vendemia & Buzan
Polygraph, 2005, 34,1 39
the posterior, anterior, and right central regions of the brain. The ECD solution corresponded with the spatial component structure and mimicked prior research on the P3b during tasks involving motor response, which suggests that many of the same evaluative, selection, and attentional processes were at work (Yamazaki et al., 2000; Yamazaki et al., 2001). A dipole located in the contralateral precentral gyrus was most likely related to intention of motor movement (Boecker, Brunia, & Cluitmans, 1994; Cramer, Finklestein, Schaechter, Bush, & Rosen, 1999). However, activation of the right middle temporal gyrus has not been reported in these studies. Yamazaki et al., (2000) reported this dipole localization in the 140 – 180 ms range preceding the range in which was identified in the current study.
In the present study, the dipole in the
middle temporal gyrus may have been correlated with working memory demands associated with the processing of word stimuli. Activations in the middle temporal gyrus have been identified during the processing of abstract and concrete words (Kiehl et al., 1999), during the processing of semantic and syntactic words (Friederici, Opitz, & von Cramon, 2000), and during the processing of recently observed words (Yonelinas, Hopfinger, Buonocore, Kroll, & Baynes, 2001). Because the middle temporal gyrus dipole has not been associated with the P3b during sensory tasks, but was identified during the word-related two-stimulus paradigm; it is likely to be involved in the processing of word stimuli and issues of congruity as opposed to deception.
P3b amplitude was suppressed during
deceptive responding, but the underlying dipole structure did not differ between deceptive and truthful responses. This suggests that the same decision making processes are involved in both conditions. Congruity processing and deceptive processing may involve differing underlying neuronal sources, such as those in the middle temporal gyrus, but telling the truth and telling a lie involve the same sources.
Although the patterns of activity of the
P3b suggested a working memory load explanation, the activity of the P3a component
suggested an attentional explanation. Two components aligned with the P3a: PC4 and PC6. Both were sensitive to the effects of congruity; however, between the waveforms, the pattern of responses was different. Across conditions the PC4 responded in a manner more consistent with the pattern of expected responses in an attention-switching paradigm (Comerchero & Polich, 1999; Katayama & Polich, 1998). Similar to difficult tasks involving redirection of attention back to a non-target condition, the PC4 P3a was larger preceding the easier congruent responses (Comerchero & Polich, 1999). During the relatively more challenging incongruent responses, the PC4 P3a was reduced. A similar effect was not identified for deception.
Unlike the PC4, the greatest amplitude
for PC6 occurred during incongruent responses rather than congruent responses. Within incongruent responses, deceptive responses were associated with greater amplitude. This pattern of reactivity is more representative of the expected pattern of reactivity of the P3b during an attention-switching paradigm (Comerchero & Polich, 1999).
The ERP data for the components
suggest an anterior distribution for both as illustrated in Figure 2. However, the spatial distribution of PC6 was dominated by an anterior pattern of responses associated with the P3a (Yamazaki et al, 2001), while PC4’s spatial component distribution was nearly identical to the P3b. The dipole analyses revealed single dipoles in regions of the anterior cingulate for both components during truthful responding. During deceptive responding the dipole solution for PC4 remained localized to the anterior cingulate while the solution for PC6 changed to the corpus callosum. The anterior cingulate is associated with attention (Knight, 1991). Greater firing of anterior cingulate neurons has been associated with tasks demanding greater degrees of attention (Davis, Hutchison, Lozano, Tasker, & Dostrovsky, 2000), and tasks involving the orienting response (Williams et al., 2000). Lesion of these neurons interrupts attentional processing (Knight, 1991). The corpus callosum is involved in interhemispheric communication
Neural Mechanism of Deception
Polygraph, 2005, 34,1 40
and all levels of cognitive processing including attentional processing (Gazzaniga, 2000); however, its role here is unclear.
Taken together these data suggest that
the components may represent differing aspects of the P3a and that the P3a is implicated in attentional processes rather than workload processes. While PC4 illustrates the prototypical pattern of reactivity of a P3a during an attention-switching paradigm (Comerchero & Polich, 1999), PC6 illustrates the spatial component structure of the waveform (Yamazaki et al., 2001). If both components are involved in the P3a and both represent attentional processing, why are they differentially susceptible to the effects of deception and congruity? It may be that deception places different attentional demands on participants than congruity and this caused the separation of the P3a into distinct components; however, it is more likely that attentional demands set up in the experimental paradigm altered the way the components were effected (Kok, 2001).
Participants were prepared by the first
stimulus to respond in a deceptive or truthful manner. They remained in a state of preparedness until the second stimulus appeared. In the post experiment interviews most participants reported that they kept the “lie” responses in their working memory either through rehearsal or some other strategy until the second stimulus appeared. They were not equally prepared for the congruity condition. Once the second stimulus appeared they had to switch their attention resources to adapt to the task level.
Further research manipulating the
degree of preparedness for deceptive and contiguous responses needs to be done to evaluate their effects on the P3a. Another way to assess sustained attention in this paradigm would be to measure contingent negative variation preceding stimulus two, as this waveform is known to be involved in preparedness (Cui et al., 2000; Regan & Howard, 1995).
An unexpected late positive complex,
the PC7, was identified at 517 ms, which may be the so-called late positive complex. Similar to the P3b, the late positive complex was
suppressed during deceptive responses, but unlike the P3b, the late positive complex was not sensitive to congruity. The late positive complex is typically found in linguistic studies involving sentence evaluation (Friederici, & Mecklinger, 1996). Linguistic researchers argue that the effect is localized to the temporo-parietal region and the anterior cortex, and responds primarily to violation of syntactical expectations, stimulus salience, and reanalysis (Coulson, King, & Kutas, 1998; Liotti et al., 2000). The dipole source localizations for the late positive complex in the temporal gyrus support a linguistic explanation; however, this component did not vary with congruity, which does not support a linguistic explanation.
In the current study, amplitude of the
late positive complex was larger for truthful than deceptive responses. There is some evidence that conditions of high working memory load and sustained performance decreases the late positive complex when strategies that engage the frontal lobes are involved (Gevins & Smith, 2000). The dipole solution for the late positive complex demonstrated clear involvement of the frontal lobes during deceptive responding. Unlike the P3b, the dipole solutions for the late positive complex were not the same across truthful and deceptive conditions as shown in Figure 6. During deception temporal and frontal regions were activated, but during truthful responding the anterior cingulate was activated. It is unclear at this point what role the late positive complex might play in deceptive responding, but it is clear that both attention and working memory load are involved.
The late positive complex has been
demonstrated in tasks with sufficient challenge to require a final reanalysis before a response can be made (Friederici, & Mecklinger, 1996). This study may have produced such demands due to its difficulty; however, it may be the case that frontal lobe processes are involved in deceptive responding. This finding needs to be replicated in further studies of the two-stimulus paradigm involving deceptive responding before a conclusion can be reached.

Vendemia & Buzan
Polygraph, 2005, 34,1 41
The last component, the N4, was strongly and predictably related to congruity. Additional findings suggested that during the congruent condition, deceptive responses were correlated with larger negative amplitudes of the N4, but that during the incongruent condition truthful responses were correlated with larger negative amplitudes of the N4. This relationship was most likely due to the strong effect of congruity on the N4. Previous researchers using paradigms with congruity components may have also identified this finding as the result of the strong effect of congruity. For example Boaz et al., (1991) utilized a paradigm in which the N4 was measured during true or false sentence completions. In those cases in which the word was incongruent with previous knowledge an N4 occurred. This created a significant confound with congruity. In the current paradigm, congruity and deception were found to interact, but deception produced no individual effect on N4 amplitude.
Activation of the anterior cingulate
suggests an ongoing attentional process represented in this waveform while activations in the frontal gyrus may be related to changes in working memory load. As working memory load increases activity in the medial frontal gyri decreases while activity in middle frontal gyri increase (Grasby, Frith, Friston, & Simpson, 1994). These findings are consistent with the N4 findings, activity in the middle frontal regions increased during the greater working memory load conditions of congruity and deception.
These findings can be combined to
form a preliminary neuroscientific theory of deception. Previous theories of deceptive responding have postulated attention, working memory load, and congruity as sources of ERP variation between deception and truth. The current study suggests that processes related to all three theories underlie deception. The P3a, with neuronal sources in the anterior cingulate may be the result of orienting
towards task related stimuli such as congruity and deception. It is possible that the inherent incongruity of deception is also attended to at this time. Following that initial attentional response, processing of congruity occurs during the N4 across multiple regions of the frontal lobe. The following P3b engages decision-making processes, and response selection. Although, these processes engage identical underlying neuronal sources, the greater workload demands of deception and congruity individually suppress the amplitude of the P3b. For the late positive complex, information from the dipole analyses suggests that the neuronal substrata of attention and final evaluation differed across truthful and deceptive responding.
In conclusion, the data from temporal
and spatial PCA’s combined with ECD techniques have allowed for the identification of these components by temporal and spatial localization, by underlying process, and through neuronal source (Donchin, Ritter, & McCallum, 1978; Fabiani, Gratton, & Coles, 2000; Spencer, et al., 1999). The findings suggest that deception involves processes of attention, workload, and late evaluation, which are reflected in unique patterns of ERP components derived from underlying neuronal sources. This is the first time a study combining the separate theories of deception has been conducted, and results are preliminary. In addition, the use of averaged data to derive dipoles results in solutions that obfuscate individual differences in the data. Studies that examine these differences on an individual basis need to be conducted. However, the findings do indicate that more than one waveform should be evaluated, and that within waveforms underlying neuronal sources should be investigated. Also, comparisons between this study and previous research demonstrate that researchers need to carefully judge attention and workload demands when choosing experimental paradigms.
Neural Mechanism of Deception
Polygraph, 2005, 34,1 42
References
Alho, K., Winkler, I., Escera, C., Huotilainen, J. V., Jääskeläinen, I. P., Pekkonen, E., & Ilmoniemi, R. J. (1998). Processing of novel sounds and frequency changes in the human auditory cortex: Magnetoencephalographic recordings. Psychophysiology, 35, 211-224.
Allen, J. J., & Iacono, W. G. (1997). A comparison of methods for the analysis of event-related
potentials in deception detection. Psychophysiology, 34, 234-240. Allen, J. J., Iacono, W. G., & Danielson, K. D. (1992). The identification of concealed memories
using the event-related potential and implicit behavioral measures: A methodology for prediction in the face of individual differences. Psychophysiology, 29, 504-522.
Barcelo, F., & Francisco, R. J. (1998). Non-frontal P3b-like activity evoked by the Wisconsin Card
Sorting Test. Neuroreport: An International Journal for the Rapid Communication of Research in Neuroscience, 9, 747-751.
Bashore, T. R., & Rapp, P. E. (1993). Are there alternatives to traditional polygraph procedures?
Psychological Bulletin, 113, 3-22. Boaz, T. L., Perry, N. W., Raney, G., Fischler, I. S., & Shuman, D. (1991). Detection of guilty
knowledge with event-related potentials. Journal of Applied Psychology, 76, 788-795. Boecker, K. B. E., Brunia, C. H. M., & Cluitmans, P. J. M. (1994). A spatio-temporal dipole model of
the readiness potential in humans: I. Finger movement. Electroencephalography and Clinical Neurophysiology, 91, 275-285.
Clark, V. P., Fannon, S., Lai, S., Benson, R., & Bauer, L. (2000). Responses to rare visual target and
distractor stimuli using event-related fMRI. Journal of Neurophysiology, 83, 3133-3139. Comerchero M. D., & Polich, J. (1999). P3a and P3b from typical auditory and visual stimuli.
Clinical Neurophysiology, 110, 24-30. Cramer, S. C., Finklestein, S. P., Schaechter, J. D., Bush, G., & Rosen, B. R. (1999). Activation of
distinct motor cortex regions during ipsilateral and contralateral finger movements. Journal of Neurophysiology, 81, 383-387.
Coulson, S., King, J. W., & Kutas, M. (1998). ERPs and domain specificity: Beating a straw horse.
Language and Cognitive Processes, 13, 653-672. Cui, R. Q., Egkher, A., Huter, D., Lang, W., Lindinger, G., & Deecke, L. (2000). High resolution
spatiotemporal analysis of the contingent negative variation in simple or complex motor tasks and a non-motor task. Clinical Neurophysiology, 111, 1847-1859.
Davis, K. D., Hutchison, W. D., Lozano, A. M., Tasker, R. R., & Dostrovsky, J. O. (2000). Human
anterior cingulate cortex neurons modulated by attention-demanding tasks. Journal of Neurophysiology, 83, 3575-3577.
Dionisio, D. P., Granholm, E., Hillix, W. A., & Perrine, W. F. (2001). Differentiation of deception
using pupillary response as an index of cognitive processing. Psychophysiology, 38, 205–211.
Donchin, E., & Coles, M. G. H. (1988). Is the P300 a manifestation of context updating? Behavioral
and Brain Sciences, 121, 357-374.

Vendemia & Buzan
Polygraph, 2005, 34,1 43
Donchin, E., Ritter, W., & McCallum, W. C. (1978). Cognitive psychophysiology: The endogenious components of the ERP. In E. Callaway, P. Tueting, & S. H. Koslow (Eds.), Brain event-related potentials in man. New York: Academic Press.
Duffy, F. H. (1989). Brain electrical activity: Clinical applications. Psychiatry Research, 29, 379-384. Ebmeier, K. P., Steele, J.D., MacKenzie, D. M., O’Carroll, R. E., Kydd, R. R., Glabus, M. F.,
Blackwood, D. H. R., Rugg, M. D., & Goodwin, G. M. (1995). Cognitive brain potentials and regional cerebral blood flow equivalents during two- and three-sound auditory tasks. Electroencephalography and Clinical Neurophysiology, 95, 434-443.
Ellwanger, J., Rosenfeld, J. P., Sweet, J. J., & Bhatt, M. (1996). Detecting simulated amnesia for
autobiographical and recently learned information using the P300 event-related potential. International Journal of Psychophysiology, 23, 9-23.
Fabiani, M., Gratton, G., & Coles, M. G. H. (2000). Event-related brain potentials: Methods, theory
and applications. In J. T. Cacioppo, G. G. Tassinary, & G. G. Berntson (Eds.), Handbook of psychophysiology (pp. 53-84). New York: Cambridge.
Farwell, L. A., & Donchin, E. (1991). The truth will out: Interrogative polygraphy (“lie detection”)
with event-related brain potentials. Psychophysiology, 28, 531-547. Friederici, A. D., & Mecklinger, A. (1996). Syntactic parsing as revealed by brain responses: First-
pass and second-pass parsing processes. Journal of Psycholinguistic Research, 25, 157-175. Friederici, A. D., Opitz, B., von Cramon, D. Y. (2000). Segregating semantic and syntactic aspects of
processing in the human brain: An fMRI investigation of different word types. Cerebral Cortex, 10, 698-705.
Gazzaniga, M. S. (2000). Cerebral specialization and interhemispheric communication: Does the
corpus callosum enable the human condition? Brain, 123, 1293-1326. Gevins, A., Cutillo, B., & Smith, M. E., (1995). Regional modulation of high resolution evoked
potentials during verbal and non-verbal matching tasks. Electroencephalography and Clinical Neurophysiology, 94, 129-147.
Gevins, A., & Smith, M. E. (2000). Neurophysiological measures of working memory and individual
differences in cognitive ability and cognitive style. Cerebral Cortex, 10, 829-839. Grasby, P. M., Frith, C. D., Friston, K. J., & Simpson, J. (1994). A graded task approach to the
functional maping of brain areas implicated in auditory verbal memory. Brain, 117, 1271-1282.
Hamony, T., Bernal., J., Fernández, T., T., Silva-Pereyra, J., Fernández-Bouzas, A., Marosi, R.
Rodríguez, M., & Reyes, A. (2000). Primary task demands modulate P3 amplitude. Cognitive Brain Research, 9, 53-60.
Huizenga, H. M., & Molenaar, P. C. M. (1994). Estimating and testing the sources of evoked
potentials in the brain. Multivariate Behavioral Research, 29, 237-262. Katayama, J., & Polich, J. (1998). Stimulus context determines P3a and P3b. Psychophysiology, 35,
23-33.
Neural Mechanism of Deception
Polygraph, 2005, 34,1 44
Kiehl, K. A., Liddle, P. F., Smith, A. M., Mendrek, A., Forster, B. B., & Hare, R. D. (1999). Neural pathways involved in the processing of concrete and abstract words. Human Brain Mapping, 7, 225-233.
Knight, R. T. (1991). Evoked potential studies of attention capacity in human frontal lobe lesions. In
H. S. Levin & H. M. Howard (Eds.), Frontal lobe function and dysfunction (pp. 139-153). NY: Oxford University Press.
Kok, A. (2001). On the utility of P3 amplitude as a measure of processing capacity.
Psychophysiology, 39, 557-577. Liotti, M., Woldorff, M. G., Perez III, R., and Mayberg, H. S. (2000). An ERP study of the temporal
course of the Stroop color-word interference effect. Neuropsychologia, 38, 701-711. Luu, P., & Ferree, T. (2000). Determination of the Geodesic Densor Nets’ electrode positions and their
10-10 International equivalents. (Technical Note). Eugene, OR: Electrical Geodesics Incorporated.
Matsuda, T., Hira, S, Nakata, M., & Kakigi, S. (1990). The effect of one’s own name upon event
related potentials: Event related (P3 and CNV) as an index of deception. Japanese Journal of Physiological Psychology and Psychophysiology, 8, 9-18.
McGarry-Roberts, P. A., Stelmack, R. M., Campbell, K. B. (1992). Intelligence, reaction time, and
event-related potentials. Intelligence, 16, 289-313. Nasman, V. T., & Dorio, P. J. (1993). Reduced P3b category response in prefrontal patients.
International Journal of Psychophysiology, 14, 61-74. Opitz, B., Mecklinger, A., von Cramon, D. Y., & Kruggel, F. (1999). Combining electrophysiological
and hemodynamic measures of the auditory oddball. Psychophysiology, 36, 142-147. Peterson, B. S, Skudlarski, P., Gatenby, J. C., Zhang, H., Anderson, A. W., & Gore, J. C. (1999). An
fMRI study of Stroop word-color interference: Evidence for cingulate subregions subserving multiple distributed attentional systems. Biological Psychiatry, 45, 1237-1258.
Picton, T. W. (1992). The P300 wave of the human event-related potential. Journal of Clinical
Neurophysiology, 9, 456-479. Polich, J., & Hoffman, L. D. (1998). P300 and handedness: On the possible contribution of the
corpus callosal size to ERPs. Psychophysiology, 35, 497-507. Pollina, D. A. & Squires, N. K. (1998). Many-valued logic and event-related potentials. Brain and
Language, 63, 321-345. Regan, M. & Howard, R. (1995). Fear conditioning, preparedness, and the contingent negative
variation. Psychophysiology, 32, 208-214. Rosenfeld, J. P. (1995). Alternative views of Bashore and Rapp’s (1993). Alternatives to traditional
polygraphy: A critique. Psychological Bulletin, 117, 159-166. Rosenfeld, J. P. (1998). Event-related potentials in detection of deception. International Journal of
Psychophysiology, 30, 27. Rosenfeld, J. P., Ellwanger, J. W., Nolan, K., Wu, S., Bermann, R. G., & Sweet, J. (1999). P300
scalp amplitude distribution as an index of deception in a simulated cognitive deficit model. International Journal of Psychophysiology, 33, 3-19.

Vendemia & Buzan
Polygraph, 2005, 34,1 45
Rosenfeld, J. P., Sweet, J. J., Chuang, J., Ellwanger, J., & Song, L. (1996). Detection of simulated malingering using forced choice recognition enhanced with event-related potential recording. The Clinical Neuropsychologist, 10, 163-179.
Ruchkin, D. S., Johnson, R., Canoune, H. L., Ritter, W. & Hammer, M. (1990). Multiple sources of
the P3b associated with different types of information. Psychophysiology, 27, 157-176. Ruchkin, D. S., Johnson, R., Canoune, H. L., & Ritter, W. (1990). Short-term memory storage and
retention: An event-related brain potential study. Electroencephalography and Clinical Neurophysiology, 76, 419-439.
Scherg, M. (1990). Fundamentals of dipole source potential analysis. In F. Grandon, M. Hoke, & G.
L. Romani (Eds.), Auditory evoked magnetic fields and potentials (Vol. 6, pp. 40-69). Basel: Karger.
Scherg, M. (1992). Functional imaging and localization of electromagnetic brain activity. Brain
Topography, 5, 103-111. Scherg, M., & Picton, T. W. (1991). Separation and identification of event-related potential
components by brain electrical source analysis. In C. H. M. Brunia, G. Mulder, & M. N. Verbaten. (Eds.), Event-related brain research (pp. 24-37). Amsterdam: Elsevier Science Publishers.
Spencer, K. M., Dien, J., & Donchin, E. (1999). A componential analysis of the ERP elicited by novel
events using a dense electrode array. Psychophysiology, 36, 409-414. Srinivasan, R., Tucker, D. M., & Murias, M. (1998). Estimated the spatial Nyquist of the human
EEG. Behavioral Research Methods, Instruments, & Computers, 30, 8-19. Stelmack, R. M., Houlihan, M., & Doucet, C. (1994). Event-related potentials and the detection of
deception: A two-stimulus paradigm. Ottawa: University of Ottawa. (NTIS No. AD-A318 987/5INZ).
Stelmack, R. M., Houlihan, M., Doucet, C., & Belisle, M. (1994). Event-related potentials and the
detection of deception: A two-stimulus paradigm. Psychophysiology, 7, s94. Stuss, D. T., Floden, D., Alexander, M. P., Levine, B, & Katz, D. (2001). Stroop performance in focal
lesion patients: Dissociation of processes and frontal lobe lesion location. Neuropsychologia, 39, 771-786.
Talairach, J., & Tournoux, P. (1988). Co-planar stereotaxic atlas of the human brain. NY: Thieme
Medical Publishers. Tucker, D. M., Liotti, M., Potts, G. F., Russell, G. S., & Posner, M. I. (1994). Spatiotemporal
Analysis of Brain Electrical Fields. Human Brain Mapping, 1, 134-152. Verleger, R. (1997). On the utility of P3 latency as an index of mental chronometry.
Psychophysiology, 34, 131-156. Wilson, G. F., Swain, C. R., Ullsperger, P. (1998). ERP components elicited in response to warning
stimuli: the influence of task difficulty. Biological Psychology, 47, 137-158.
Neural Mechanism of Deception
Polygraph, 2005, 34,1 46
Williams, L. M., Brammer, M. J., Skerrett, D., Lagopolous, J., Rennie, C., Kozek, K., Olivieri, G., Peduto, T., & Gordon, E. (2000). The neural correlates of orienting: An integration of fMRI and skin conductance orienting. Neuroreport: For Rapid Communication of Neuroscience Research, 11, 3011-3015.
Yamazaki, T., Kamijo, A., Fukuzumi, S., Kiyuna, T., Takaki, Y., & Kuroiwa, Y. (2000). Multiple
equivalent current dipole source localization of visual event-related potentials during oddball paradigm with motor response. Brain Topography, 12, 159-175.
Yamazaki, R., Kamijo, K., Kiyuna, T., Takaki, Y., Kuroiwa, Y. (2001). Multiple dipole analysis of
visual event-related potentials during oddball paradigm with silent counting. Brain Topography, 13, 161-168.
Yonelinas, A. P., Hopfinger, J. B., Buonocore, M. H., Kroll, N. E. A., & Baynes, K. (2001).
Hippocampal, parahippocampal and occipital-temporal contributions to associative and item recognition memory: An fMRI study. Neuroreport: For Rapid Communication of Neuroscience Research, 12, 359-363.

Krapohl, Senter, & Stern
An Exploration of Methods for the Analysis of Multiple-Issue Relevant/Irrelevant Screening Data
Donald J. Krapohl, Stuart M. Senter, and Brett A. Stern1
Abstract Decisions resulting from traditional and two experimental methods of analyzing data from Relevant/Irrelevant (RI) screening tests were compared to one another for accuracy and to the decisions from the original examiner. Field cases were selected using stratified random sampling from a large archive. The original examiner had an average by-question accuracy of 81%, while a blind scorer using global evaluation and an experimental method (Robins Scoring System, RSS) each produced 73% accuracy for the same questions. A preliminary RI algorithm, which was not developed to make by-question decisions, had a by-case average accuracy of 73%. Intra-scorer reliability for the blind scorer’s by-question decisions was statistically significant, while reliability for the RSS decisions was not. These findings indicate that the Relevant/Irrelevant screening test should perform better as the first stage of a “successive hurdles” screening process (Meehl & Rosen, 1955) than as a stand-alone methodology. The data also indicate that, based on the approaches explored in the current paper, human blind scoring may be the method of choice for independent quality control reviews of RI screening data.
Introduction The polygraph screening test called the Relevant/Irrelevant (RI) is widely used in law enforcement to help select candidates for police positions. This version of the RI is a multiple-issue test as opposed to the type used to test criminals regarding their involvement in a particular crime. The RI screening test has from three to five relevant questions (e.g., Have you ever committed a serious crime?), each typically covering a different topic, along with buffering irrelevant questions (e.g., Are the lights on in this room?). Some user organizations, for efficiency and scope of coverage, employ compound relevant questions. In the “best practices” model the RI screening test is the first step in a successive-hurdles approach (Meehl & Rosen, 1955: as relates to polygraphy see Krapohl & Stern, 2003).
The existing evidence suggests that this type of RI test is suitable for screening, but as a stand-alone tool it does not have the validity to act as a diagnostic test for deception (Crowe, Peters, Saurez, & Claeren, 1988; Grimsley & Yankee, 1985;
Horowitz, Kircher, Honts, & Raskin, 1997; Yankee, Giles, & Grimsley, 1986). Rather, it is best used to base a dichotomous decision regarding whether the candidate has passed the screening phase or whether more interviewing and testing are warranted. A lack of reactivity to the relevant questions may be sufficient cause to release the examinee from the session and issue a favorable report. A consistent reaction to a question on the RI test would prompt the examiner to probe the topic more directly with the examinee, or provide guidance to a background investigator on what areas to give special attention. However, a diagnostic opinion of deception is not justified solely on the basis of physiological responding to a single screening test question. Collective field experience has shown that these reactions are not infrequently the product of examinee concerns over peripheral issues unrelated to deception or the withholding of disqualifying information. A very focused post-RI single-issue test can confirm with greater confidence the positive result from the RI screening test phase. This method is analogous to the manner in which medical screening tools are
1 The authors are with the U.S. Department of Defense Polygraph Institute. Mr. Krapohl is the Deputy Director, Dr. Senter is a Research Scientist, and Mr. Stern is a Senior Instructor. Request for reprints should be sent to the first author at: DoDPI, 7540 Pickens Ave., Ft. Jackson, SC 29207, or to [email protected].
Polygraph, 2005, 34,1 47

Exploration Methods for Analysis of Multiple-Issue Relevant/Irrelevant Screening Data
Polygraph, 2005, 34,1 48
used, where a positive finding can prompt further testing to confirm the results, but the screening tool is not used by itself to render a diagnosis that a patient has a condition or disease. The polygraph screening examination, when conducted as a successive hurdles process, using more intricate, sensitive, and specialized testing is more accurate, at least in theory, than the screening test used exclusively, following the logic of Krapohl and Stern (2003). It is worth noting that optimizing the successive hurdles approach requires that the initial screening phase be more sensitive to deceptiveness than to truthfulness. In other words, the better screening test would have a high true positive rate even at the cost of a lower true negative rate. Subsequent processes in the successive hurdles model can help discriminate between false positives and true positives, correcting the false positives. However, because testing is terminated when a decision of truthfulness is made, there is no opportunity to correct for false negatives that might arise in the initial screening phase. Hence the emphasis on detecting lies. This approach may, to the uninitiated, appear to be biased against truthtellers because it detects them less well in the earliest stage, but at closer inspection the process is revealed as the most effective method for boosting overall accuracy.
The analysis of the tracings on RI screening charts is somewhat different from that used with other polygraph tests. Despite decades of use, there is no accepted quantification system for the RI technique as there is for Comparison Question Technique (CQT). An exhaustive search through the literature resulted in the location of a single experimental method (Ansley & Weir, 1976). This method was abandoned by its developers because it was unwieldy and not effective (Ansley, personal communication, 1997). To date no validated scoring system has been reported in the literature for the RI.
Traditionally, examiners begin by evaluating the RI data holistically. In other words, they examine the entire data set en toto rather than immediately summing the parts. Examiners then gauge the arousal of each relevant question against those of the irrelevant questions and other relevant questions. Consistent and significant reactions that occur repeatedly to the same relevant question would indicate that that question possesses more salience than the others.2 When a consistent or significant response is noted to a relevant question following a proper pretest, it is more likely than not that the examinee has not fully disclosed information related to that question.
Distinguishing these consistent and
significant reactions contained in inherently noisy biological signals is to some extent an art, and proficiency likely relies heavily upon an examiner’s experience and knowledge. The development of an analytical system that is more objective and more accurate than those in current practice would provide immediate benefits to law enforcement screening programs that use the RI technique. It was therefore of interest to explore differences in the traditional method of interpretation, often called “global analysis”, and other methods that entail greater objectivity.
Miritello (1999) reported a method for numerically scoring multiple-issue Modified General Question Technique (MGQT) screening charts that used a rank order of responses as the method of analysis. The method was developed as a collaborative effort by the late Dr. James Robins, Kathleen Miritello, and Dr. Charles Honts in 1987, and will hereafter be referred to as the Robins Scoring System (RSS). Ranks were assigned to responses by channel according to response magnitude, then summed by question. In the final step these sums were divided by a maximum possible value, the latter number being derived by summing the highest single number for each polygraph channel for each
2 Evaluators of RI data need not rely exclusively on irrelevant question responses as a benchmark against which to compare relevant responses, particularly when the irrelevant questions are not serving their intended purpose (e.g., absorb the orienting response, assist with dissipation of lingering response, satisfy technique protocol for pattern avoidance). In other

Krapohl, Senter, & Stern
words, relevant question responses can be assessed only against other relevant question responses. Attempts to alter the interpretation of the test by evoking response to irrelevant questions would be ineffective. chart. This resulted in each question receiving a ratio between 0.00 and 1.00. Dr. Robins and the first author conducted internal unpublished evaluations of the RSS with a fixed cutting score, and found it could distinguish responses associated with known deception at better than 80% when used with multiple-issue MGQT employment screening examinations.
Some organizations have used an abbreviated form of RSS. The field rank order scoring system, or “high three” as it is sometimes called, ranks only the highest three responses, using ranks from 3 to 1. Like RSS, when question totals are relatively equal it offers support for releasing the examinee. When the sum for any one question differs significantly from those from the remaining questions it warrants additional scrutiny. Despite the apparent success of the RSS with MGQT examinations, there may be a problem applying this method to RI screening cases. Unlike the MGQT, there are no comparison questions in the RI examination. In the RSS, ratios obtained for each relevant and comparison question are dispersed between 0.00 and 1.00, with a mean of 0.50. When a cutting score is used, at least one question will usually surpass that cutting score. For the truthful examinees tested with Comparison Question Techniques, the probable-lie comparison questions (PLCs) are typically the questions that have ratios which exceed this threshold, while the ratios for relevant questions are lower than the threshold. Because the RI format does not use comparison questions, it is likely that a relevant question would pass the threshold irrespective of whether the examinee is answering truthfully. To resolve whether this truly takes place, the RSS was tested in this study. While there is no fielded automated algorithm for the RI technique, there exists a prototype RI algorithm developed by the Johns Hopkins Applied Physics Laboratory (Harris & McQuarrie, 2002). The algorithm was trained with field cases conducted with the Axciton® computer polygraph, and for which ground
truth was independently verified. To date there has been no independent test of the performance of that algorithm. The prototype RI algorithm was used to score all of the cases in this study. Cases used in this exploratory study came from the field. The data had been collected from live polygraph screening cases of job applicants conducted by a large security firm under contract with a Federal agency. The data collection was exhaustive, and ground truth was established by official records, medical testing, or examinee confession for every relevant question of every examinee. The archive represented a rare and unique opportunity to test analytical methods for the RI screening test. Because these were field cases, there were decisions rendered by the original testing examiners. These examiners had access to the physiological data, in addition to some extrapolygraphic information such as verbal and nonverbal behaviors during the polygraph sessions, and a small amount of background information in the form of a job application that did not address any of the polygraph topics. The testing examiners did not have access to ground truth before the examinations nor the outcomes of the RI algorithm. The decisions of the testing examiners are reported in this study.
The purpose of this exploratory study was to determine how each of the analysis methods performed against chance, and ultimately to provide an indication of effect sizes so that subsequent studies can have starting points for assessing optimal analytical approaches.
Method
Examiners. Two senior Federal examiners who had experience with the RI in the field participated as evaluators of the PDD data. One examiner was randomly assigned to interpret the RI charts globally, and the other performed the rankings of responses on the RI charts using the RSS. The original examiner,
Polygraph, 2005, 34,1 49

Exploration Methods for Analysis of Multiple-Issue Relevant/Irrelevant Screening Data
Polygraph, 2005, 34,1 50
whose data are also reported here, employed global analysis to form his opinion of truthfulness or deception.
Apparatus. All physiological data were
collected with an Axciton (Houston, TX) computer polygraph. The Axciton is a four-channel physiological data recorder with two respiration channels, and one channel each for electrodermal and cardiovascular activity. The Axciton can render strip charts and electronic copies of the recordings, both of which were used in portions of this study.
Automated Analysis Software. One of
the four analytical tools tested was the preliminary RI algorithm developed by Johns Hopkins University Applied Physics Laboratory (Polyscore version 4.0). Detection and removal of artifacts was performed solely by the software. The principal investigator performed minor editing of physiological records, such as correction of question labels.
Robins Scoring. On each chart the
examiner began by locating the largest reaction for each of the three polygraph channels on that chart, and assigned a “0” to that reaction. Because the largest reaction in one channel may have occurred on a different question than that for another channel, the ranks were not always the same for all channels for a given question. The examiner then located the second largest reaction within each channel, and assigned a “1” to it. This process was repeated until all three channels of all relevant questions on the chart had been ranked. The examiner then moved to the next chart, and ranked the questions using the same strategy. Once all of the charts had been evaluated, the ranks were summed for each relevant question, and then those totals were divided by the number of possible ranks. This created a ratio between 0.0 and 1.0 for each of the four relevant questions.
Case Selection. One hundred
confirmed field RI cases were used. They were collected by a large security firm in major southeastern city as part of the preliminary RI algorithm development project. Two experienced polygraph examiners, employees of the security firm, conducted all of the polygraph examinations and all subjects were
applicants for employment with the firm. The examinee population was 97.4% African Americans and 61.8% females, all of whom reported that they were in good health and free from the effects of alcohol or non-prescription drugs. There were four relevant questions in those examinations. They covered: (1) convictions or fines for traffic violations in the State of Georgia in the previous seven years; (2) having been granted bankruptcy in the previous seven years in the State of Georgia; (3) having used marijuana in the previous 30 days, and; (4) having been convicted of a felony in the State of Georgia.
Urinalysis testing, police reports,
Georgia official state records, and posttest admissions were used in establishing ground truth. Table 1 lists the source of confirmation by posttest confession, records (including urinalysis), and both. The 100 selected cases were subject to stratified random sampling for three categories of cases: (1) those for which the subject was verified to have been truthful to all relevant questions, (2) those to which the subject was untruthful to one relevant question, and (3) those to which the subject was untruthful to more than one relevant question. While it would have been preferred to randomly select one-third of the cases from each of the three categories, there were only 20 cases available in which the examinee had been untruthful to more than one relevant question. All of these multi-deception cases were used. The remaining 80 cases consisted of 41 verified truthful and 39 in which it was verified that the examinee had lied to only a single relevant question. The 41 verified truthful were randomly selected from all truthful cases, and the 39 verified ‘single’ deceptive cases were randomly selected from all such cases.
Of the 39 single-deception cases, 19
were selected from among those deceptive to the issue of traffic offenses, and 20 from those that were deceptive to marijuana use. It was observed that in the single-deception cases, there were no confirmed deceptions to the issues of bankruptcy or felony convictions in the data pool. Among all 100 cases there were no confirmed deceptions to the issue of bankruptcy.
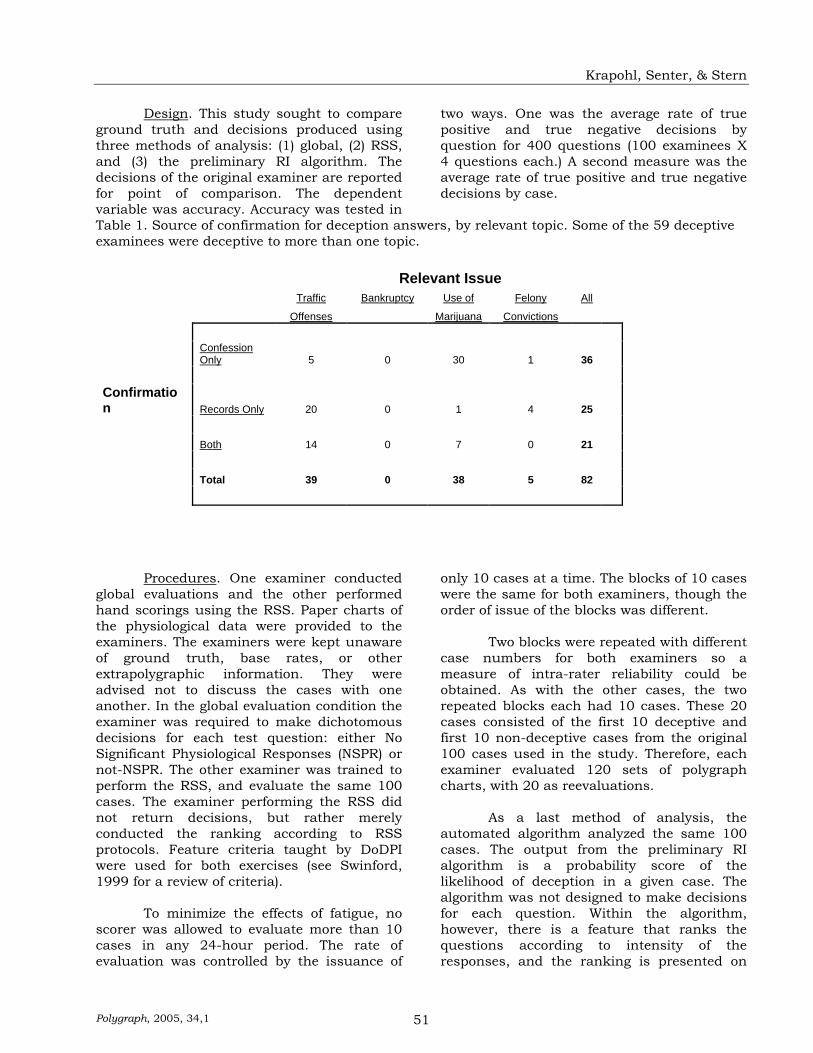
Krapohl, Senter, & Stern
Design. This study sought to compare ground truth and decisions produced using three methods of analysis: (1) global, (2) RSS, and (3) the preliminary RI algorithm. The decisions of the original examiner are reported for point of comparison. The dependent variable was accuracy. Accuracy was tested in
two ways. One was the average rate of true positive and true negative decisions by question for 400 questions (100 examinees X 4 questions each.) A second measure was the average rate of true positive and true negative decisions by case.
Table 1. Source of confirmation for deception answers, by relevant topic. Some of the 59 deceptive examinees were deceptive to more than one topic. Relevant Issue Traffic Bankruptcy Use of Felony All
Offenses Marijuana Convictions
Confession Only 5 0 30 1 36
Confirmation Records Only 20 0 1 4 25 Both 14 0 7 0 21 Total 39 0 38 5 82
Procedures. One examiner conducted
global evaluations and the other performed hand scorings using the RSS. Paper charts of the physiological data were provided to the examiners. The examiners were kept unaware of ground truth, base rates, or other extrapolygraphic information. They were advised not to discuss the cases with one another. In the global evaluation condition the examiner was required to make dichotomous decisions for each test question: either No Significant Physiological Responses (NSPR) or not-NSPR. The other examiner was trained to perform the RSS, and evaluate the same 100 cases. The examiner performing the RSS did not return decisions, but rather merely conducted the ranking according to RSS protocols. Feature criteria taught by DoDPI were used for both exercises (see Swinford, 1999 for a review of criteria).
To minimize the effects of fatigue, no
scorer was allowed to evaluate more than 10 cases in any 24-hour period. The rate of evaluation was controlled by the issuance of
only 10 cases at a time. The blocks of 10 cases were the same for both examiners, though the order of issue of the blocks was different.
Two blocks were repeated with different
case numbers for both examiners so a measure of intra-rater reliability could be obtained. As with the other cases, the two repeated blocks each had 10 cases. These 20 cases consisted of the first 10 deceptive and first 10 non-deceptive cases from the original 100 cases used in the study. Therefore, each examiner evaluated 120 sets of polygraph charts, with 20 as reevaluations.
As a last method of analysis, the
automated algorithm analyzed the same 100 cases. The output from the preliminary RI algorithm is a probability score of the likelihood of deception in a given case. The algorithm was not designed to make decisions for each question. Within the algorithm, however, there is a feature that ranks the questions according to intensity of the responses, and the ranking is presented on
Polygraph, 2005, 34,1 51
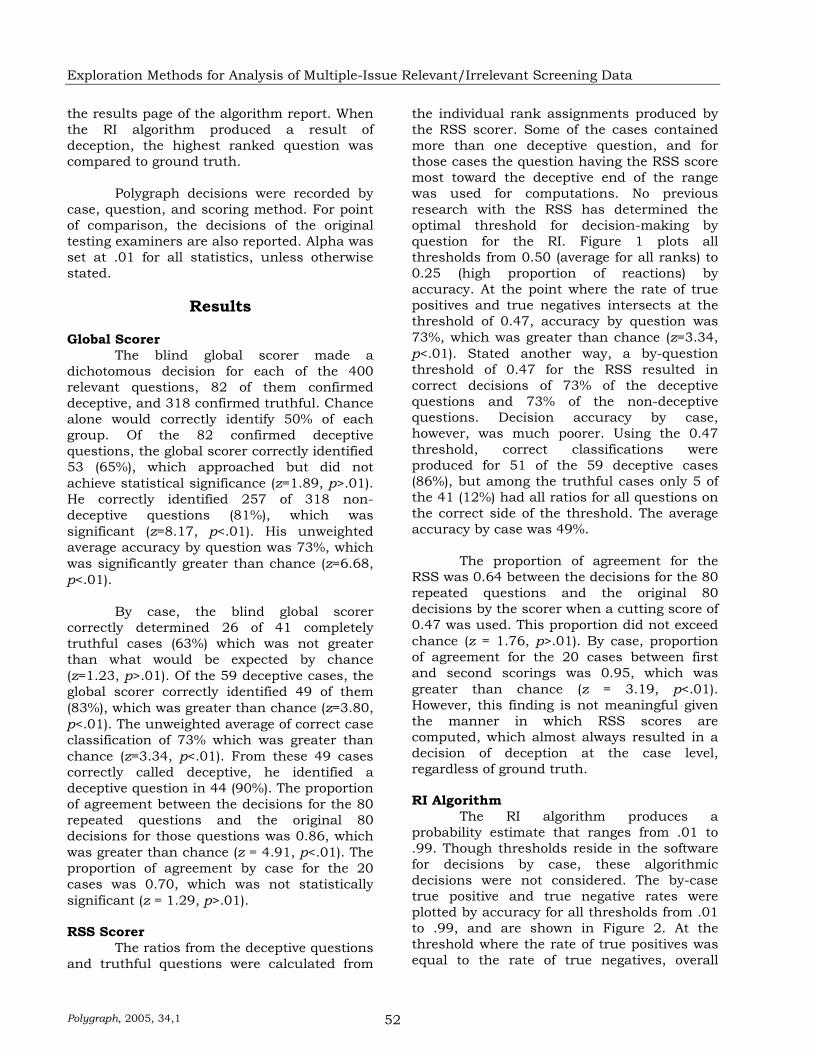
Exploration Methods for Analysis of Multiple-Issue Relevant/Irrelevant Screening Data
Polygraph, 2005, 34,1 52
the results page of the algorithm report. When the RI algorithm produced a result of deception, the highest ranked question was compared to ground truth.
Polygraph decisions were recorded by
case, question, and scoring method. For point of comparison, the decisions of the original testing examiners are also reported. Alpha was set at .01 for all statistics, unless otherwise stated.
Results Global Scorer The blind global scorer made a dichotomous decision for each of the 400 relevant questions, 82 of them confirmed deceptive, and 318 confirmed truthful. Chance alone would correctly identify 50% of each group. Of the 82 confirmed deceptive questions, the global scorer correctly identified 53 (65%), which approached but did not achieve statistical significance (z=1.89, p>.01). He correctly identified 257 of 318 non-deceptive questions (81%), which was significant (z=8.17, p<.01). His unweighted average accuracy by question was 73%, which was significantly greater than chance (z=6.68, p<.01).
By case, the blind global scorer correctly determined 26 of 41 completely truthful cases (63%) which was not greater than what would be expected by chance (z=1.23, p>.01). Of the 59 deceptive cases, the global scorer correctly identified 49 of them (83%), which was greater than chance (z=3.80, p<.01). The unweighted average of correct case classification of 73% which was greater than chance (z=3.34, p<.01). From these 49 cases correctly called deceptive, he identified a deceptive question in 44 (90%). The proportion of agreement between the decisions for the 80 repeated questions and the original 80 decisions for those questions was 0.86, which was greater than chance (z = 4.91, p<.01). The proportion of agreement by case for the 20 cases was 0.70, which was not statistically significant (z = 1.29, p>.01). RSS Scorer The ratios from the deceptive questions and truthful questions were calculated from
the individual rank assignments produced by the RSS scorer. Some of the cases contained more than one deceptive question, and for those cases the question having the RSS score most toward the deceptive end of the range was used for computations. No previous research with the RSS has determined the optimal threshold for decision-making by question for the RI. Figure 1 plots all thresholds from 0.50 (average for all ranks) to 0.25 (high proportion of reactions) by accuracy. At the point where the rate of true positives and true negatives intersects at the threshold of 0.47, accuracy by question was 73%, which was greater than chance (z=3.34, p<.01). Stated another way, a by-question threshold of 0.47 for the RSS resulted in correct decisions of 73% of the deceptive questions and 73% of the non-deceptive questions. Decision accuracy by case, however, was much poorer. Using the 0.47 threshold, correct classifications were produced for 51 of the 59 deceptive cases (86%), but among the truthful cases only 5 of the 41 (12%) had all ratios for all questions on the correct side of the threshold. The average accuracy by case was 49%. The proportion of agreement for the RSS was 0.64 between the decisions for the 80 repeated questions and the original 80 decisions by the scorer when a cutting score of 0.47 was used. This proportion did not exceed chance (z = 1.76, p>.01). By case, proportion of agreement for the 20 cases between first and second scorings was 0.95, which was greater than chance (z = 3.19, p<.01). However, this finding is not meaningful given the manner in which RSS scores are computed, which almost always resulted in a decision of deception at the case level, regardless of ground truth. RI Algorithm The RI algorithm produces a probability estimate that ranges from .01 to .99. Though thresholds reside in the software for decisions by case, these algorithmic decisions were not considered. The by-case true positive and true negative rates were plotted by accuracy for all thresholds from .01 to .99, and are shown in Figure 2. At the threshold where the rate of true positives was equal to the rate of true negatives, overall

Krapohl, Senter, & Stern
accuracy was 73%, which was greater than chance (z=3.34, p<.01). The RI algorithm was not designed to make decisions by question, however it does rank individual relevant questions by response magnitude. Using a threshold probability of .27 for decisions of deception by case, which is where the proportion of true positives is equal to the proportion of true negatives, 43 of the 59 deceptive cases were correctly identified (73%). From these 43 cases, there were 37 times
where a deceptive question was ranked as the highest of the 4 relevant questions (86%). If the likelihood of correctly classifying a deceptive case is 73% (assuming balanced accuracy of identifying truthtellers and liars), and the probability of identifying the correct question within a deceptive case is 86%, the overall probability of pinpointing a deceptive question when it is present is 63% with the RI algorithm used as it was here. Reliability was not tested because the algorithmic processes
Figure 1. Decision accuracy by question across cutting scores for the Robins Scoring System.
0.00
0.20
0.40
0.60
0.80
1.00
0.50 0.45 0.40 0.35 0.30 0.25
Cutting Score
Dec
isio
n A
ccur
acy
Deceptive Questions
Non-DeceptiveQuestions
was fully automated, which would result in perfect reliability. Original Examiner The original examiner correctly identified 58 of the 82 deceptive issues (71%) and 288 of the 318 non-deceptive issues (91%). There were four cases where the examiner produced an Inconclusive decision on the 16 relevant questions, and all were non-deceptive cases. Average by-question accuracy, counting Inconclusives as errors, was 81% which was greater than chance (z=9.14, p<.01). For the 41 non-deceptive cases, the original examiner correctly
identified 27 (66%), and 52 of the 59 deceptive cases (88%), for an average by-case accuracy of 77%. Reliability figures were not computed for the original examiner decisions, as no repeated data collections were available. Figures 3 and 4 summarize the decision accuracy of the four approaches reported here.
With an average accuracy of 81% by question, the original examiner appeared to have outperformed the remaining methods of analysis. Repeated tests of proportions across all pairs found the original examiner to have significantly higher accuracy than the algorithm (z=7.27, p<.001) or either the global
Polygraph, 2005, 34,1 53

Exploration Methods for Analysis of Multiple-Issue Relevant/Irrelevant Screening Data
Polygraph, 2005, 34,1 54
or RSS scorer (z=4.36, p<.001) at the by-question level. Both global and RSS scorings produced by-question accuracy greater than that from the algorithm (z=3.03, p<.001). For accuracy by case, the only significant
difference was that the original examiner had a higher accuracy than the RSS scorer (z=4.10, p<.001).
Figure 2. Decision accuracy by case across cutting scores for the APL RI Algorithm.
0.00
0.20
0.40
0.60
0.80
1.00
0.10 0.20 0.30 0.40 0.50 0.60 0.70 0.80 0.90 1.00
Cutting Scores
Dec
isio
n A
ccur
acy
Deceptive Cases(n=59)
Non-DeceptiveCases (n=41)
. Figure 3. Summary of Decision Accuracy by Question
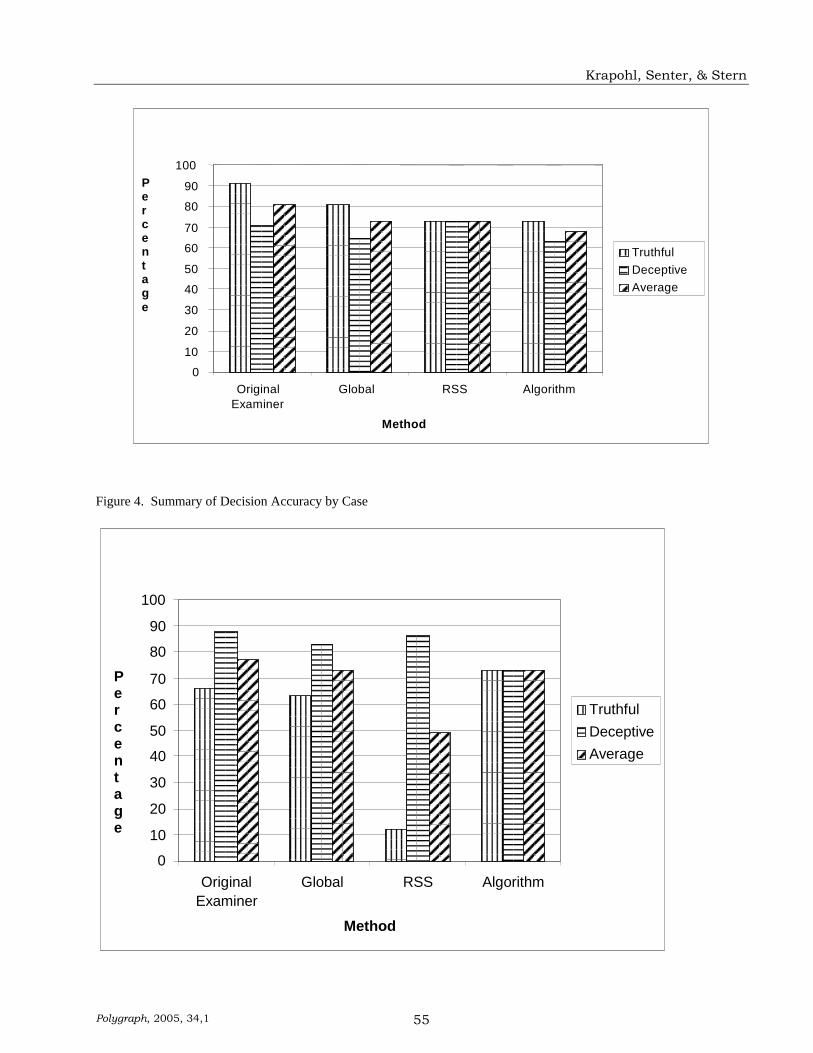
Krapohl, Senter, & Stern
0 10 20 30 40 50 60 70 80 90
100
Original Examiner
Global RSS Algorithm
Method
P e r c e n t a g e
TruthfulDeceptiveAverage
Figure 4. Summary of Decision Accuracy by Case
0 10
20
30
40 50
60 70
80 90
100
Original Examiner
Global RSS Algorithm
Method
P e r c e n t a g e
Truthful DeceptiveAverage
Polygraph, 2005, 34,1 55

Exploration Methods for Analysis of Multiple-Issue Relevant/Irrelevant Screening Data
Polygraph, 2005, 34,1 56
Successive Hurdles Analysis As stated earlier in this article, to maximize the value of the successive hurdles approach, it is essential that the initial screening reduce the likelihood of a false negative error. This is because in the successive hurdles method there is no means for recapturing false negative errors. When a person passes the screening phase, testing is typically terminated, while positive results, both true and false, can be addressed in subsequent processes, following a winnowing process. Both liars and truthtellers who pass the test undergo no more processing to verify their negative results (see Figure 5). Following this logic, it would therefore be important to establish decision rules that maximize detection of deception, setting the sensitivity as high as possible, and keeping in mind that there will be limitations placed on sensitivity due to the resource requirements for handling the increased proportion of positive results.
We conducted a post hoc analysis of decision accuracy when sensitivity (the ability to detect deception) was arbitrarily set at 0.90 for those scoring systems that permitted the adjustment of thresholds: the automated algorithm and the RSS. Because the algorithm was not developed to make decisions at the question level, we only tested it at the case level. Also, because the RSS appears to only work at the question level, there was no attempt to examine accuracy at the case level for that method. The decision threshold for which a sensitivity of 0.90 was achieved with the algorithmic data was a probability value of 0.13 (see Figure 2). In other words, 90% of the deceptive cases would be correctly classified if the algorithm determined that the probability of deception was 0.13 or greater. The threshold of 0.13 also gave rise to a true negative percentage of 56%. As reported earlier,
Figure 5. Flow chart of the successive hurdles approach in RI screening. A negative result indicates that the examinee has produced no indications of deception and has completed the testing process. A tentative-positive result simply indicates that the person must complete additional testing.
balanced accuracies were found at 73%. This subsequent analysis also produced an average accuracy of 73%, though accuracy rates were, of course, not balanced across deceptive and nondeceptive cases.3
Capturing 90% of the deceptive questions with the RSS was accomplished using an RSS threshold of 0.55 (see Figure 1). The 0.55 threshold resulted in a correct classification of truthful questions of only 41%. Average accuracy for truthful and
NEGATIVESTAGE 1
STAGE 2
STAGE 3
TENTATIVEPOSITIVE
TENTATIVE POSITIVE
NEGATIVE TENTATIVE POSITIVE
NEGATIVE

Krapohl, Senter, & Stern
deceptive questions for the 0.55 RSS threshold was 65%. For practical reasons it may be more useful to catch one lie at a time per examinee rather than every lie with every examinee in one RI test. For the 59 liars, 90% could correctly have a lie identified with an RSS threshold of 0.48. This same threshold resulted in 65% accurate decisions by question for the 41 truthful examinees. However, the truthful examinees each had 4 relevant questions, with a probability of correct classification of 65% per question. With this data set, none of 41 truthful
examinees would have been called truthful to all 4 questions.
To further illustrate the successive hurdles approach, in the previous examples 44% of truthful cases and 59% of truthful questions would have been false positives. However, following the logic of the successive hurdles approach, these instances would simply result in additional testing, as shown in Figure 5. In other words, it is somewhat of a misnomer to use the term false positive in this case. More appropriately, such instances are simply incomplete.
3 For normally distributed scores, there is an inverse relationship between improvements in detecting truthtellers and detecting liars: changes in thresholds to increase one often results in a decrease in the other of roughly the same magnitude. For example, the algorithm here showed that setting the threshold so that 90% of liars were caught resulted in identifying only 56% of the truthtellers. One may note that the 17% increase in catching liars over the balanced accuracy approach (73%) was paid for by a 17% decrease in detecting truthtellers (also 73% in the balanced method). Therefore, accuracy is not created out of nothing, but simply shifted from one group to another group when thresholds are changed.
Ground Truth, or Not An issue emerged during the data collection phase that may have influenced detection accuracy. It was noted that in some cases, it was uncertain whether examinees knew what their official records held. For example, in one instance and examinee had been stopped for speeding two years prior to her polygraph examination, and given a ticket. She failed to appear for her court date, and she was convicted of the speeding offense in absentia. It was not clear from the documentation that the examinee even knew of the conviction for the speeding offense. If she was unwitting of her traffic conviction during her polygraph examination, technically she was not deceptive when denying the conviction. Accuracy computations, which relied largely on information in documents that examinees rarely see, may have been reduced to some unknown degree. By way of contrast, it seems likely that examinees who had used marijuana in the 30 days prior to the polygraph examination would recall the event. As a test of this possibility, a post hoc analysis was conducted on the
human decisions where ground truth indicated deception to only the traffic conviction issue or only to the marijuana use issue. Of the 19 cases where the examinee had been deceptive only to the traffic offense question, the blind global evaluator correctly detected the deception in nine cases. The blind global evaluator correctly identified 17 of the 20 times the examinees had been deceptive to the marijuana use question. A test of proportions found these detection rates to be significantly different (z = 2.49, p < .01). Similarly, the RSS found the marijuana question produced a more deceptive ratio on average (0.35) than did the traffic conviction question (0.41), a difference that was statistically significant (t(37) = 2.77, p < .01).
The original examiner detected 11 of these 19 traffic conviction deceptions, and 20 of the 20 marijuana use deceptions. This difference was also significant (z = 3.25, p < .01). However, the testing examiner was aware of the content of the test questions, while the blind scorers were not. The exceptional performance of the original examiner in detecting deception on the marijuana question could merely reflect a bias for making decisions of deception on this topic. To test for
Polygraph, 2005, 34,1 57

Exploration Methods for Analysis of Multiple-Issue Relevant/Irrelevant Screening Data
Polygraph, 2005, 34,1 58
bias, we examined the original examiner’s decisions on the questions of traffic convictions and marijuana use where the examinee had been truthful. A bias would be revealed if the original examiner made more false positive decisions on the marijuana question than on the traffic conviction question. On the traffic conviction question, the examiner made 23 decisions of deception on the 61 instances where the examinee had been truthful. For the question on marijuana use, the examiner made 15 erroneous decisions of deception for 62 examinees. While the proportion of erroneous decisions was lower for the marijuana use question, and in the opposite direction from the suspected bias, the difference was not significant (z = 1.50, p > .01). These data do not support the conclusion that the original examiner’s better detection of deception on marijuana use was due to a bias, and is consistent with the possibility that examinees may have had better recall of marijuana use than of traffic convictions.
Discussion
None of the blind evaluation methods
tested here performed as well as the original examiner, at least at the per-question level. This was not an unexpected finding. Most studies that have compared blind analysis with decisions of the original examiner have found the latter to perform better. This trend has been interpreted as suggesting that examiners who interact with examinees are including extrapolygraphic information in their decision processes that appears to boost their decision accuracy. Iacono (1991) concurred with this perspective, and argued that estimations of polygraph accuracy should be made by blind evaluators. Future investigators may undertake the exploration of how the extrapolygraphic information can be systematically included in the polygraph decision process.
The present findings for the blind
evaluations further confirm that the multiple-issue RI test is an imperfect stand-alone tool for applicant screening. Even considering the slightly higher accuracy of the original examiner, errors averaged about 20%. The error rate can be expected to be higher in
circumstances where the examiner is not as proficient, the test includes more than four relevant topics, or the relevant areas are more ambiguous. A combination of examiner competence, a tighter testing protocol, and quality control oversight could minimize these errors. A successive-hurdles approach could further control the error rate, especially false positives. We would argue that a best practices model would include all of these components.
For all of the experimental scoring
methods tested with these data, decision rules were established according to the goals of the study. These decision rules can, and probably should, be modified if these scoring methods incorporated into field practice. This is because decision rules determine the types and relative proportions of errors, and the cost of errors is something that should be considered when decision thresholds are set. It may be permissible in some settings to employ decision rules that have much higher rates of positive outcomes than in others simply because the cost of false negatives is especially dire. Also, the base rate of deception will affect overall accuracy. If the decision rules of the screening test are made sensitive to deception, and the base rate of deception among the examinees is high, there will be a higher level of accuracy for the screening phase than when the base rate is very low. The factors that affect polygraph screening decision rules are discussed in greater detail in Krapohl and Stern (2003). Limitations
A primary limitation of the present study would be the inclusion of a small sample size, especially with variable phenomena, such as individual physiology. While the sample size of the present study certainly achieved sufficient statistical power to discover significant effects, more data is always preferable in the context of polygraph research, due to a variety of individual variables whose impact on the polygraph process is largely unknown. A related weakness is the homogenous nature of the sample, which was comprised primarily of African Americans. Although research has topic has produced little evidence for differences in polygraph effectiveness as a

Krapohl, Senter, & Stern
function of examinee race (Buckley & Senese, 1991; Krapohl & Gary, 2004; Reed, 1993), generalizations from this study should be made with caution.
Another weakness of the present study concerns the dynamic nature of the RI testing structure. This testing format is developed with an emphasis on pattern avoidance, with the goal of making the question sequence difficult or impossible for the examinee to detect. Thus, each RI examination is likely unique from any other, raising concerns over standardization. At the present time, it is unknown if any question sequence or configuration within the RI framework provides optimal diagnostic value, though the widely-held assumption is that no such ‘optimal’ configuration exists.
A final weakness of the study is that it
is unknown how much of the differences in decision accuracy could be accounted for by differences in evaluator skills. An exceptionally gifted evaluator may make it appear that one evaluation system is superior to another being performed by a lesser-skilled evaluator, even when no real differences exist between the evaluation systems. Future researchers should consider determining the chart evaluation skills of the blind evaluators a priori, and making matched assignments to control for this factor.
Typically, field data in detection of
deception research can be criticized due to the lack of independent confirmation of ground truth. In many instances, polygraph cases are included in field studies where ground truth is partially determined by the polygraph decisions, and false positive and false negative errors are systematically excluded, resulting in an inflation of the accuracy rate collected in the study (Iacono, 1991). However, a strength of the present study was the independent approximations of ground truth via methods independent of the polygraph decisions, such as state records and urinalysis results.
Conclusions
With the above limitations in mind,
comparisons of the three different analytical methods permit some tentative conclusions.
First, the RSS does not appear to be a suitable approach for producing decisions with RI testing. It was found to have low reliability, and combined with its subpar by-case accuracy it would have little to contribute to either the original examiner or an independent quality control reviewer.
Second, though the algorithm
implemented in the present study has perfect reliability, its poor performance at the by-question level may limit its usefulness to field examiners. However, the high reliability and moderately good by-case accuracy produced by the algorithm may permit very limited application to field examiners who do not have independent quality control available to them.
Third, global evaluation appears to
have good intra-scorer reliability, albeit less than the perfect reliability of the algorithm. However, global evaluation can be conducted on the by-question level, while the algorithm cannot, at least in its current stage of development. Under these conditions, global evaluation is a strong candidate method for quality assurance reviews of RI screening tests. This situation may change when there is a by-question algorithmic method.
Finally, there is evidence that the
ground truth criterion in this study may have been partially flawed, which could have reduced decision accuracies. There was a significant difference in the ability of the original and blind scorers to detect marijuana use as compared to traffic offenses. One explanation may be that these two questions covered different expanses of time, 30 days for marijuana, and seven years for traffic offenses. Recency may have had an influence on examinee recall, favoring recollections regarding drug use. Also, while marijuana use requires the examinee to have been present during the event, traffic convictions can take place even when an examinee is not in court to witness the outcome. In addition, there is the issue of salience: examinees may have perceived the use of marijuana as immediately disqualifying for the job, while traffic offenses may be much less so. The greater salience to the marijuana question may have elicited larger polygraph reactions during deception, making them easier to detect than deceptions
Polygraph, 2005, 34,1 59
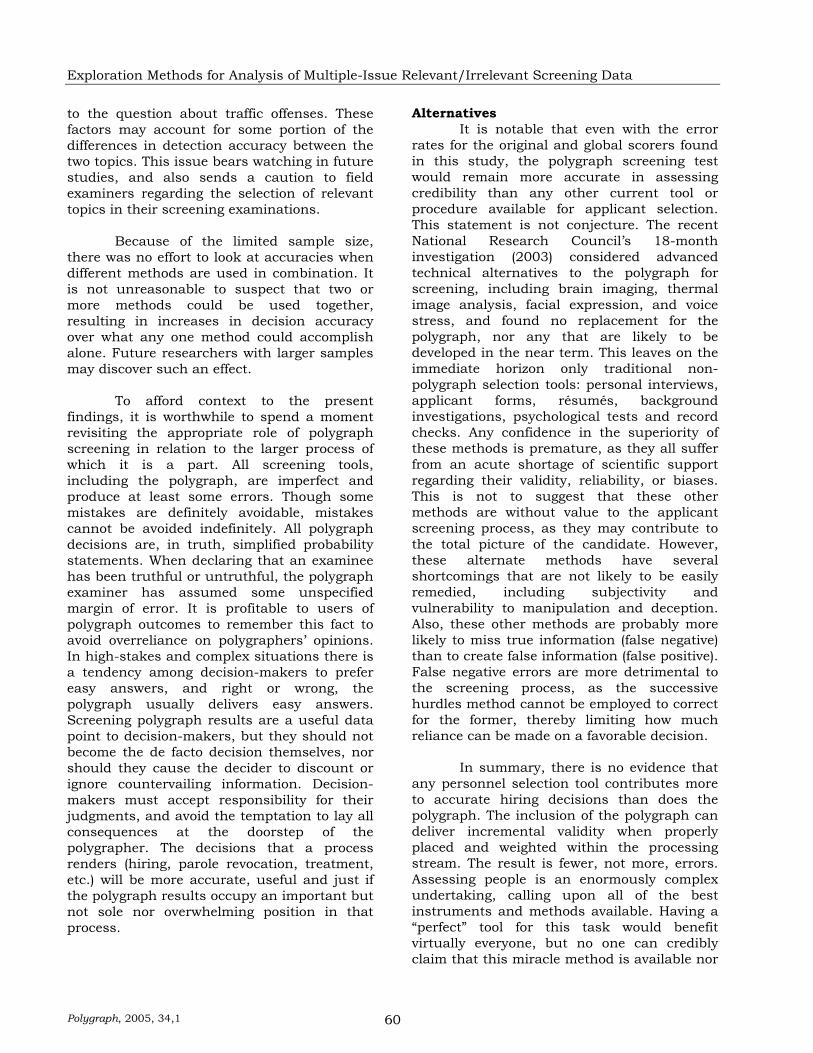
Exploration Methods for Analysis of Multiple-Issue Relevant/Irrelevant Screening Data
Polygraph, 2005, 34,1 60
to the question about traffic offenses. These factors may account for some portion of the differences in detection accuracy between the two topics. This issue bears watching in future studies, and also sends a caution to field examiners regarding the selection of relevant topics in their screening examinations.
Because of the limited sample size,
there was no effort to look at accuracies when different methods are used in combination. It is not unreasonable to suspect that two or more methods could be used together, resulting in increases in decision accuracy over what any one method could accomplish alone. Future researchers with larger samples may discover such an effect.
To afford context to the present
findings, it is worthwhile to spend a moment revisiting the appropriate role of polygraph screening in relation to the larger process of which it is a part. All screening tools, including the polygraph, are imperfect and produce at least some errors. Though some mistakes are definitely avoidable, mistakes cannot be avoided indefinitely. All polygraph decisions are, in truth, simplified probability statements. When declaring that an examinee has been truthful or untruthful, the polygraph examiner has assumed some unspecified margin of error. It is profitable to users of polygraph outcomes to remember this fact to avoid overreliance on polygraphers’ opinions. In high-stakes and complex situations there is a tendency among decision-makers to prefer easy answers, and right or wrong, the polygraph usually delivers easy answers. Screening polygraph results are a useful data point to decision-makers, but they should not become the de facto decision themselves, nor should they cause the decider to discount or ignore countervailing information. Decision-makers must accept responsibility for their judgments, and avoid the temptation to lay all consequences at the doorstep of the polygrapher. The decisions that a process renders (hiring, parole revocation, treatment, etc.) will be more accurate, useful and just if the polygraph results occupy an important but not sole nor overwhelming position in that process.
Alternatives It is notable that even with the error rates for the original and global scorers found in this study, the polygraph screening test would remain more accurate in assessing credibility than any other current tool or procedure available for applicant selection. This statement is not conjecture. The recent National Research Council’s 18-month investigation (2003) considered advanced technical alternatives to the polygraph for screening, including brain imaging, thermal image analysis, facial expression, and voice stress, and found no replacement for the polygraph, nor any that are likely to be developed in the near term. This leaves on the immediate horizon only traditional non-polygraph selection tools: personal interviews, applicant forms, résumés, background investigations, psychological tests and record checks. Any confidence in the superiority of these methods is premature, as they all suffer from an acute shortage of scientific support regarding their validity, reliability, or biases. This is not to suggest that these other methods are without value to the applicant screening process, as they may contribute to the total picture of the candidate. However, these alternate methods have several shortcomings that are not likely to be easily remedied, including subjectivity and vulnerability to manipulation and deception. Also, these other methods are probably more likely to miss true information (false negative) than to create false information (false positive). False negative errors are more detrimental to the screening process, as the successive hurdles method cannot be employed to correct for the former, thereby limiting how much reliance can be made on a favorable decision.
In summary, there is no evidence that any personnel selection tool contributes more to accurate hiring decisions than does the polygraph. The inclusion of the polygraph can deliver incremental validity when properly placed and weighted within the processing stream. The result is fewer, not more, errors. Assessing people is an enormously complex undertaking, calling upon all of the best instruments and methods available. Having a “perfect” tool for this task would benefit virtually everyone, but no one can credibly claim that this miracle method is available nor
Krapohl, Senter, & Stern
is it soon coming. To the contrary, from what is known about the vagaries of human behavior makes it optimistic in the extreme to hold that such a tool will ever be invented. This leaves decision-makers to choose from among those imperfect methods that do exist. The polygraph is one of those methods, and though not 100% accurate, it may be 100% better than whatever comes in second
Acknowledgements
We are very grateful for the
expertise lent to this project by Mr. William Gary and Mr. Scott Manners. We also appreciate the suggestions from Raymond Nelson, who reviewed an earlier version of the manuscript. The views expressed in this article are those of the authors, and do not necessarily represent those of the Department of Defense or the US Government.
References
Ansley, N., & Weir, R. (1976). A numerical scoring system for Relevant-Irrelevant Polygraph Tests. Paper presented at the 1976 Annual Seminar of the American Polygraph Association.
Buckley, J.P., & Senese, L.C. (1991). The influence of race and gender on blind polygraph chart
analyses. Polygraph, 20(4), 247-258. Crowe, M.J., Peters, R.D., Suarez, Y.M., & Claeren, L. (1988). The research project to compare the
relative validity of the positive control and the relevant-irrelevant polygraph techniques. Jacksonville, AL: Jacksonville State University; Contract #MDA 904-87-C-2293.
Grimsley, D.L., & Yankee, W.J. (1985). The effect of response type in a relevant-irrelevant polygraph
examination. Final report NSA contract MDA904-84-R-2284. Harris, J.C., & McQuarrie, A.D. (2002). The relevant/irrelevant algorithm description and validation
results. Johns Hopkins University Applied Physics Laboratory; Laurel, MD. Prepared under contract DABT60-00-P-1199 for The Department of Defense Polygraph Institute.
Horowitz, S.W., Kircher, J.C., Honts, C.R., & Raskin, D.C. (1997). The role of comparison questions
in physiological detection of deception. Psychophysiology, 34(1), 108-115. Iacono, W.G. (1991). Can we determine the accuracy of polygraph tests? Advances in
Psychophysiology, 4, 201-207. Krapohl, D. J., & Gary, W. B. (2004). Exploration into the effect of race on polygraph scores and
decisions. Polygraph, 33(4), 234-239. Krapohl, D.J., & Stern, B.A. (2003). Principles of multiple-issue polygraph screening: A model for
applicant, post-conviction offender, and counterintelligence testing. Polygraph, 32(4), 201-210. Meehl, P.E., & Rosen, A. (1955). Antecedent probability and the efficiency of psychometric signs,
patterns, and cutting scores. Psychological Bulletin, 52(3), 194-216. Miritello, K.M. (1989). Rank Order Analysis. Paper presented at the Department of Defense
Polygraph Institute. National Research Council (2002). The polygraph and lie detection. Retrieved on April 12, 2004 from
http://www.nap.edu/catalog/10420.html.
Polygraph, 2005, 34,1 61

Exploration Methods for Analysis of Multiple-Issue Relevant/Irrelevant Screening Data
Polygraph, 2005, 34,1 62
Reed, S. (1993). Subcultural report -- Effects of examiner's and examinee's race on psychophysiological detection of deception outcome accuracy. Report DoDPI94-R-0012. Department of Defense Polygraph Institute. Ft. McClellan, AL.
Swinford, J. (1999). Manually scoring polygraph charts utilizing the seven-position numerical
analysis scale at the Department of Defense Polygraph Institute. Polygraph, 28, 10-27. Yankee, W.J., Giles, F., & Grimsley, D.L. (1986). A comparison between control question and
relevant-irrelevant polygraph test formats in a screening situation. NSA contract #MDA904-86-R-2192.