a thesis submitted in fulfillment of the requirements for...
TRANSCRIPT

ANODIC OXIDATION OF TITANIUM IN SULPHURIC ACID (H2SO4) FOR BIOMEDICAL
APPLICATION
NOOR HAFIZA MOHD IDRUS
A thesis submitted in fulfillment of the requirements for the award of the Degree of
Master of Mechanical Engineering
Faculty of Mechanical and Manufacturing Engineering
Universiti Tun Hussein Onn Malaysia
December 2013
1
ABSTRACT
Titanium (Ti) is widely used in the biomedical field because it is light, strong and
biocompatible. However, Ti is non-bioactive and does not show any apatite forming
ability after being implanted into the body. Anodic oxidation is one of the traditional
methods to modify the surface of Ti into titanium oxide (TiO2), thereby enhancing
the biocompatiblity properties. Anodisation was done by supplying direct current
(d.c) through ananode and a cathode consisting of Ti substrate soaked in the
electrolyte of strong sulphuric acid solution (H2SO4) with pH ranged from 0.3 to 2.1.
Different voltages ranged from 10 to 300 V were applied to investigate its effect on
the TiO2 formation whereas the effect of H2SO4 concentrations on TiO2 production
was studied by using three different concentrations of 0.5 M, 1.5 M and 3.0 M,
respectively. Characterisation was made in terms of microstructure using field
emission scanning electron microscope (FESEM), mineralogy using x-ray diffraction
(XRD) whereas the sample color were captured using a digital camera. In vitro test
was also conducted on anodised Ti by soaking the samples in simulated body fluid
(SBF) for seven days to study the growth of hydroxyapatite (HAP). HAP growth can
be enhanced by ultraviolet (UV) irradiation. An alternative group of in vitro samples
were exposed to UV and the HAP growth rate was compared with those unexposed.
The porosity of TiO2 increased as higher voltage and H2SO4 concentration was used.
Though variable in shape, the porosity of TiO2 was found to be directly proportional
to the applied voltage and electrolyte concentration. The XRD analysis showed that
the anatase phase started at a lower voltage in higher electrolyte concentrations.
Increasing voltage contributed to more anatase formation and also induced rutile
phase. The HAP growth was enhanced by UV irradiation in the in vitro test as HAP
grew more and appeared denser on the surface of TiO2 where UV light was used as
compared to the SBF immersion in dark condition.

1
TABLE OF CONTENTS
PAGE
DECLARATION i
DEDICATION ii
ACKNOWLEDGEMENT iii
ABSTRACT iv
ABSTRAK v
TABLE OF CONTENTS vi
LIST OF TABLES ix
LIST OF FIGURES xi
CHAPTER 1 INTRODUCTION
1.1 Background 1
1.2 Problem Statement 2
1.3 Objectives 3
1.4 Scope of Study 3
CHAPTER 2 LITERATURE REVIEW
2.1 Introduction 4
2.2 Titanium and Titanium Alloy 5
2.2.1 Titanium Properties 6

2
2.2.2 Uses of Titanium and Titanium Alloy In Biomedical Application 8
2.3 Titanium Dioxide (TiO2) 112.3.1 TiO2 and Application 13
2.4 Ultra Violet (UV) Light 15
2.4.1 Reaction TiO2 with UV light 16
2.5 Oxidation 18
2.5.1 Anodic Oxidation 202.5.2 Anodic Oxidation Parameters 21
2.5.3 Applied Voltage 22
2.5.4 Time of Oxidation 26
2.5.5 H2SO4 Electrolyte 28
2.5.6 Concentration of Electrolyte 30
2.6 Biological Test (In Vitro) 31
2.6.1 Simulated Body Fluid (SBF) 32
2.6.2 Hydroxyapatite Formation 34
2.7 Effect of UV in SBF 36
CHAPTER 3 METHODOLOGY
3.1 Introduction 41
3.2 Anodic Oxidation 43
3.2.1 Preparation of Samples 443.2.2 Acid Dilution 45
3.3 Color, Morphology, and Mineralogy
Analysis 46
3.3.1 Color Analysis 473.3.2 Morphology Analysis (FESEM) 473.3.3 Phase Analysis (XRD) 48
3.4 In Vitro Test (SBF) 48
3.4.1 SBF under UV Light 53
CHAPTER 4 RESULTS AND DISCUSSION
4.1 Introduction 54

3
4.2 Colouration of Anodised Ti 554.2.1 Effect of Applied Voltage 564.2.2 Effect of H2SO4 Concentration 57
on TiO2 Colouration4.3 Microstructure of Anodised Sample 58
(TiO2)4.3.1 TiO2 Microstructure Development 62
4.4 Mineralogy of TiO2 634.4.1 Effect of Applied Voltage 634.4.2 Effect of H2SO4 Concentration 73
on TiO2 Phase Formation4.5 Biological Test (In Vitro) 754.5.1 In Vitro in SBF with and 75
without UV4.5.2 Mechanism of HAP Formation 88
and TiO2 Distribution4.5.3 Element Analysis of Anodised Ti 90
after SBF Test
CHAPTER 5 CONCLUSION AND RECOMMENDATION
5.1 Conclusion 99
5.2 Recommendation 100
REFERENCES 101
APPENDICES Appendix A: Details of Titanium and Chemicals
Appendix B: XRD Graph
Appendix C: EDS
Appendix D: Papers Published

4
LIST OF TABLES
PAGE
2.1 Basic Properties of Titanium (Lui et al., 2004) 7
2.2 Uses of titanium and its alloy in biomedical 8
application (Liu et al., 2004)
2.3 Refractive index, density, and crystal 11
structure of TiO2 (Carp et al., 2004)
2.4 Basic and historical information on TiO2 12
(Carp et al., 2004)
2.5 Summary of previous study on photocatalysis activity 18
of anodic oxidation TiO2 film by degrading methyl
orange (Wang et al., 2006)
2.6 Result summary of previous study on anodic 22oxidation using 1 M H2SO4 with different voltages(Yang et al., 2004)
2.7 TiO2 phase structures appear by different voltage applied 23
(Yang et al., 2004)
2.8 Surface morphology evolution on anodised cp Ti 23
(Ou et al., 2010)
2.9 Five stages of voltage effecting TiO2 microstructure 24
(Abdullah and Sorrell, 2010)
2.10 Effect of anodising time to pore diameter of TiO2 cell 26Structure (Oh et al., 2005)
2.11 Effect of time and voltage on TiO2 structure 26 (Abdullah and Sorrell, 2007)
2.12 Types of acid solution electrolyte 29
2.13 Effect of different type of electrolyte on anodised Ti 29
(Song et al., 2008)

5
2.14 The ion concentration of simulated body fluid and human 33
blood plasma (Kokubo and Takadama, 2006)
3.1 Anodic oxidation parameter 433.2 Materials and equipment necessary for anodic 43
oxidation experiment.3.3 Materials and apparatus necessary for SBF test 483.4 Reagent used to prepare SBF 504.1 Effect of voltage on TiO2 coloration 564.2 Effect of H2SO4 concentration on TiO2 colouration 574.3 Result of TiO2 surface microstructure based on FESEM 60
micro image4.4 Effect of anodizing voltage and electrolyte concentration 61
on TiO2 pore diameter4.5 ICDD number for XRD data 634.6 Mineralogy of Ti anodised in 0.5 M H2SO4 as function 64
of applied voltage4.7 Mineralogy of Ti anodised in 1.5 M H2SO4 as function 67
of applied voltage.4.8 Mineralogy of Ti anodised in 3.0 M H2SO4 as function 70
of applied voltage4.9 Comparison of phase formation between different H2SO4 73
concentration (0.5, 1.5 and 3.0 M).4.10 Summary of TiO2 microstructure observations
for Ti anodised 76in 0.5 M H2SO4 after soaking in SBF for 7 days with and without UV irradiation.
4.11 Summary of TiO2 microstructure observations
for Ti anodised 80in 1.5 M H2SO4 after soaking in SBF for 7 days with and without UV irradiation.
4.12 Summary of TiO2 microstructure observations
for Ti anodised 84in 3.0 M H2SO4 after soaking in SBF for 7 days with and without UV irradiation.
LIST OF FIGURES
PAGE
6
2.1 Jewellery made by titanium (Bartlett, 2005). 6
2.2 The artificial hip joint (Liu et al., 2004). 9
2.3 Bone screw and bone plate made from Ti 9
(Liu et al., 2004).
2.4 Artificial tooth (Liu et al., 2004). 10
2.5 Artificial heart valve (Liu et al., 2004). 10
2.6 Rutile form of titanium oxide. 11
2.7 Crystal structure of: (a) anatase, (b) rutile and 12(c) brookite (Carp et al., 2004).
2.8 Solar cell screen printing machine. 13
2.9 Tent material without any coating (left) compared 14
with TiO2 coated tent material (right)
(Hashimoto et al., 2005).
2.10 Conventional side mirror (left) compared with anti 15fogging side mirror coated with TiO2 (right) (Hashimoto et al., 2005).
2.11 Visible light and ultraviolet wavelength. 16
2.12 Photoinduced phenomena of TiO2 (Carp et al., 2004). 172.13 Schematic diagram of anodic oxidation process. 212.14 SEM micrograph of (A) Ti without any treatment and 24
anodised Ti at (B) 90 V, (C) 155 V and (D) 180 V (Yang et al., 2006).
2.15 Two types of bone structure; cortical bone (left) and 25trabecular bone (right) (Ott, 2004).
2.16 TiO2 thickness variation with anodising time 27
(Abdullah and Sorrell, 2007).
2.17 SEM micrograph of anodised Ti at 155 V in H2SO4 30concentration of (A) 0.5 M, (B) 1.0 M and (C) 3.0 M (Yang et al., 2004).
2.18 Ion migration during anodisation. 31
2.19 FESEM micrograph of hydroxyapatite precipitation 34on Ti surface anodized in H2SO4 at different voltages after soaked in SBF for 1 day and 7 days (Cui et al., 2009).
2.20 Apatite formation mechanism (Kim et al., 2003). 352.21 Hydroxyapatite precipitation during SBF immersion 37
under dark (a-d) and UV irradiation (e-h) conditions (Ueda et al., 2009).

7
2.22 Surface morphology of anodised Ti (a,d) before
38immersed in SBF, (b,e) after immersed in SBF for 2 days under dark condition, and (c,f) after immersed in SBF under UV irradiation.
2.23 SEM micrograph of CHT specimens after soaking 39in SBF; (a) specimen expose to UV in air; (b) specimen expose to UV in water condition (Uetsuki et al., 2010).
2.24 FESEM images of the unpolished surfaces of Ti 40substrates treated with NaOH and oxidised at 400 °C, 600 °C, and 800 °C, followed by soaking in SBF without and with UV irradiation for 1 day. (Abdullah and Sorrell, 2012).
3.1 Methodology flow chart. 42
3.2 Schematic diagram of anodic oxidation apparatus. 44
3.3 SBF preparation apparatus. 51
3.4 pH meter for measuring pH and temperature of SBF. 51
3.5 Schematic diagram of in vitro test of TiO2. 52
3.6 Schematic diagram of UV irradiation of anodised Ti 53
during SBF immersion.
4.1 TiO2 colours as function of applied voltage and electrolyte 55
concentration.
4.2 FESEM micro-images of Ti surface after being anodised 58
at different voltage (20 – 100 V) and in different
electrolyte concentrations (0.5 – 3.0 M).
4.3 FESEM micro-images of Ti surface after being anodized 59
at different voltage (120 – 200 V) and in different
electrolyte concentrations (0.5 – 3.0 M).
4.4 Schematic diagram of TiO2 microstructure development. 62
4.5 XRD pattern of Ti anodised in 0.5 M H2SO4 at low 65
(20 – 40 V) and intermediate (60 – 100 V) voltage. 4.6 XRD pattern of Ti anodised in 0.5 M H2SO4 at high 66
(120 – 200 V) voltage.
4.7 XRD pattern of Ti anodised in 1.5 M H2SO4 at low 68
(20 – 40 V) and intermediate (60 – 100 V) voltage.4.8 XRD pattern of Ti anodised in 1.5 M H2SO4 at high 69
(120 – 200 V) voltage.
4.9 XRD pattern of Ti anodised in 3.0 M H2SO4 at low 71

8
(20 – 40 V) and intermediate (60 – 100 V) voltage.4.10 XRD pattern of Ti anodised in 3.0 M H2SO4 at high 72
(120 – 200 V) voltage.4.11 Ion concentration in different H2SO4 molar. 74
4.12 FESEM micro-images of Ti anodised in 0.5 M H2SO4
77
at 20 V, 60 V and 80 V, followed by soaking in SBF
without and with UV irradiation for 7 days.
4.13 FESEM micro-images of Ti anodised in 0.5 M H2SO4
78
at 100 V and 140 V, followed by soaking in SBF
without and with UV irradiation for 7 days.
4.14 FESEM micro-images of Ti anodised in 0.5 M H2SO4
79
at 160 V and 200 V, followed by soaking in SBF
without and with UV irradiation for 7 days.
4.15 FESEM micro-images of Ti anodised in 1.5 M H2SO4
81
at 20 V, 60 V and 80 V, followed by soaking in SBF
without and with UV irradiation for 7 days.
4.16 FESEM micro-images of Ti anodised in 1.5 M H2SO4
82
at 100 V and 140 V, followed by soaking in SBF
without and with UV irradiation for 7 days.
4.17 FESEM micro-images of Ti anodised in 1.5 M H2SO4
83
at 160 V and 200 V, followed by soaking in SBF
without and with UV irradiation for 7 days.
4.18 FESEM micro-images of Ti anodised in 3.0 M H2SO4 85
at 20 V, 60 V and 80 V, followed by soaking in SBF
without and with UV irradiation for 7 days.
4.19 FESEM micro-images of Ti anodised in 3.0 M H2SO4 86
at 100 V and 140 V, followed by soaking in SBF
without and with UV irradiation for 7 days.
4.20 FESEM micro-images of Ti anodised in 3.0 M H2SO4 87

9
at 160 V and 200 V, followed by soaking in SBF
without and with UV irradiation for 7 days.
4.21 Effect of H2SO4 concentrations on HAP formation and 88
distribution.
4.22 Schematic diagram of hydroxyapatite formation mechanism 89
in this study as modified from work by Kim et al., 2003
and Ueda et al., 2009.
4.23 EDS result of sample anodised at 160 V in 1.5 M H2SO4 90
after soaked in SBF without UV.
4.24 EDS result of sample anodised at 200 V in 3.0 M H2SO4 91
after soaked in SBF with UV.
4.25 Ca element of hydroxyapatite on Ti samples anodised 92
in 0.5 M H2SO4 after in vitro test with and without UV.
4.26 P element of hydroxyapatite on Ti samples anodised 93
in 0.5 M H2SO4 after in vitro test with and without UV.
4.27 Ca element of hydroxyapatite on Ti samples anodised 94
in 1.5 M H2SO4 after in vitro test with and without UV.
4.28 P element of hydroxyapatite on Ti samples anodised 94
in 1.5 M H2SO4 after in vitro test with and without UV.
4.29 Ca element of hydroxyapatite on Ti samples anodised 95
in 3.0 M H2SO4 after in vitro test with and without UV.
4.30 P element of hydroxyapatite on Ti samples anodised 96
in 1.5 M H2SO4 after in vitro test with and without UV.
4.31 Schematic diagram of HAP formation under UV
irradiation as modified from work by Ueda et al., 2009. 97

1
CHAPTER 1
INTRODUCTION
1.1 Background
Anodic oxidation is a process of producing and increasing the natural oxide layer on
a metal substrate (Abdullah and Sorrell, 2007). It is traditional method used to
modify surface and properties of metal substrate. The process involved direct current
flow through the electrolytic solution while the substrates immersed in the solution.
The voltage of direct current used in anodic oxidation in various solutions usually
may range from 1 to 300 V. It can perform in acid solution and alkaline solution
either, but acid solution (H2SO4) usually being used because it result to thicker
titanium dioxide layer (Diamanti and Pedeferri, 2006). However the thickness may
vary depends on parameters used such as voltage, concentrations of acid and time.
The application of anodic oxidation contributes to the development of
biomaterial used in medical applications. Anodic oxidation is used to modify the
surface structure and properties of titanium and titanium alloys to form titanium
dioxide in order to enhance biocompatibility and long term stability of implant
grafted onto bone. Anodisation was employed to produce calcium phosphate coating
in metallic implant. Titanium dioxide been used in medical application such dental
implant, artificial medical implant and bone replacement (Liu et al., 2004). Ultra
violet also knows as UV light is used to enhance the hydroxyapatite on TiO2 surface.

2
1.2 Problem Statement
Sintered hydroxyapatite and glass ceramic are bioactive materials which form
bioactive bonding with the living bone after they are implanted in bone site. Their
fracture resistance however, not enough to replace bones under load bearing
condition (Yang et al., 2004). So, at the time being, metals such as stainless steel,
Co-Cr alloys, titanium and titanium alloy are used for this purpose due to their high
fracture toughness. These metal however are non bioactive and they show no apatite
forming ability after being implanted into bone.
These metal will undergoes corrosion process which it leads to form oxides
layer or hydroxide when exposing to the atmosphere and reacts with the present of
water vapour and air. This phenomenon can actually protect the surface for further
alterations. By using anodic oxidation, titanium surface will be modified where the
oxide and properties can be controlled for desired biomedical application. This study
is tended to improve the biocompatibility of titanium and to produce different surface
on titanium substrate.
The In Vitro test in SBF can predict the growth of HAP on anodised Ti after
implanted. TiO2 also is one of photocatalyst candidate which can react with UV light
to enhance some chemical reaction including HAP formation. The SBF are done
under UV light to enhance the reaction and formation of HAP on anodised Ti.

3
1.3 Objectives
The Objectives of this research are:
1. To produce titanium dioxide (TiO2) on titanium (Ti) substarte using anodic
oxidation.2. To investigate the effect of applied voltage and H2SO4 electrolyte
concentration on morphology and mineralogy of TiO2.3. To assess the in vitro bioactivity of the TiO2 layer in simulated body fluid
(SBF).4. To observe the effect of ultra violet (UV) irradiation on hydroxyapatite
precipitation on anodised Ti.
1.4 Scope of study
1. Preparation of TiO2 on Ti substrate using anodic oxidation method at different
applied voltage (10 - 200 V).2. Acid sulphuric solution (H2SO4) is use as electrolyte at different concentration
(0.5, 1.5, and 3.0 M).3. Biological test was done on anodised titanium using simulated body fluid
(SBF) with and without UV light for 7 days.4. The characterisation of TiO2 will be performed using:
a) X-ray diffraction (XRD - mineralogyb) Field emission scanning electron microscope (FESEM) -
microstructurec) Digital camera – colour
d) Element Dispersive Spectroscopy EDS – HAP element (Calcium and
Phosphorus).

1
CHAPTER 2
LITERATURE REVIEW
2.1 Introduction
Titanium (Ti) is widely used as biomedical implant especially in orthopedic and
dental implant because it has excellent mechanical properties and biocompatibility.
Titanium dioxide (TiO2) produced by several surface modification techniques helps
to improve the bonding between natural bone and implant. Anodic oxidation
technique performed on Ti substrate was reported to produce stronger adhesion
between the oxide and substrate (Schvezov et al., 2010 and Anpo et al., 2005). The
parameter used during anodic oxidation such as applied voltage, types and
concentration of electrolyte, anodisation time, and current density determine the
microstructure and crystalline composition of TiO2 coating obtained by this method.
Simulated body fluid (SBF) test is done to obtain and evaluate in vitro result, thus in
vivo can be predicted. By immersing anodised Ti in SBF for several days,
hydroxyapatite (HAP) formations are observed and the mechanisms are discussed
based on the result of different anodising parameter. An approach of irradiating UV
light during SBF immersion had been reported to induce apatite forming ability. By
exposing to UV light, a better result might be obtained with more HAP growth on
TiO2 surface. A review on previous studies and some fundamental on each topic are
discussed.
2
2.2 Titanium and Titanium Alloy
The history of titanium was started as early as 1970 by William Gregor who had
discovered titanium but was named by Martin Heinrich Klaproth in 1795, referring to
the mythological first sons of the earth, Titans (Liu et al., 2004). The two most useful
properties of titanium in metal form are corrosion resistance and the highest strength-
to-weight ratio of any metal. In its unalloyed condition, titanium is as strong as some
steels and 45% lighter which make it suitable to be used as medical implant for
biomedical applications.
Due to its lightweight properties, Ti and its alloy have been considered for
variety of applications to high speed commercial aircraft structure (Brewer et al.,
1988). The high specific strength, unique corrosion resistance and non magnetic
properties of titanium resulted in wide application of titanium in chemical and ship
building industries. Over 35 years, titanium has been used in creating jewellery.
Interesting and unusual jewellery was created by colouring titanium using heating or
anodising method (Bartlett, 2005). Figure 2.1 shows some interesting jewellery made
by titanium metal since 1982.
Titanium and titanium alloys are widely used in biomedical devices and
components, especially as hard tissue replacements such as in cardiac and
cardiovascular applications because of their desirable properties; relatively low
modulus, good fatigue strength, formability, machinability, corrosion resistance, and
biocompatibility (Donachie, 1988).
Titanium as per other metal with exception of gold naturally have a thin layer
of oxides (1.5-10 nm) form on their surface because of the reaction with aqueous
vapour present in the air (Diamanti et al., 2006; Kuromoto et al., 2007). Further
alteration is restricted by this thin layer oxide on titanium surface. Titanium alloys
cannot meet all of the clinical requirements for applications and so has to be
modified in order to improve its biological properties. Surface modification
techniques such as plasma spraying, blasting, etching, and sintering, anodic plasma-
chemical treatment, anodic oxidation under galvanostatic and potentiostatic mode as
well as ion implantation are often performed to obtain rougher surface, thereby
expanding the use of titanium and its alloys in the biomedical field (Kuromoto et al.,
2007).

3
Figure 2.1: Jewellery made by titanium (Bartlett, 2005).
2.2.1 Titanium Properties
Titanium is a transition element which means it is a chemical element with valence
electrons in two shells instead of only one. Titanium belongs in Group IV of Period 4
in the periodic table.
It has an atomic number of 22 and atomic weight of 47.9. Titanium had been
widely used because of its most useful properties such as corrosion resistance and
4
highest strength to weight ratio compared to other metals. Some other useful
properties are lower modulus, low density, lightweight, strong, and superior
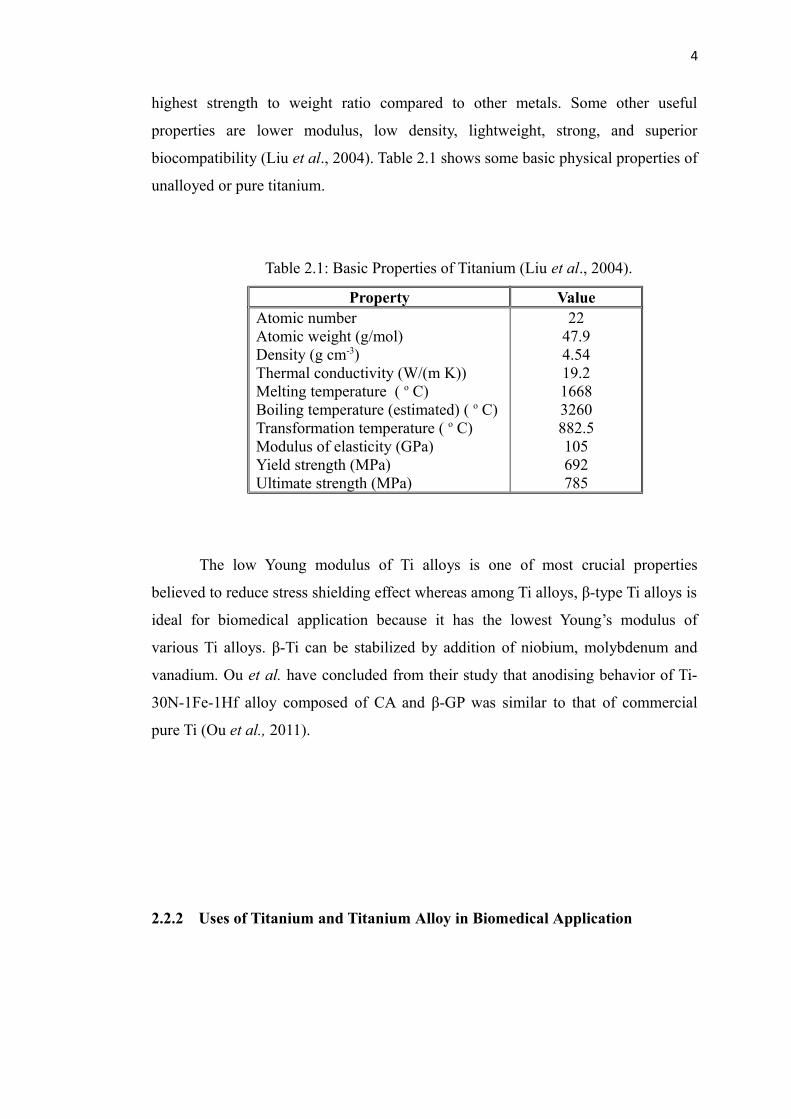
biocompatibility (Liu et al., 2004). Table 2.1 shows some basic physical properties of
unalloyed or pure titanium.
Table 2.1: Basic Properties of Titanium (Liu et al., 2004).
Property ValueAtomic numberAtomic weight (g/mol)Density (g cm-3)Thermal conductivity (W/(m K))Melting temperature ( o C)Boiling temperature (estimated) ( o C)Transformation temperature ( o C)Modulus of elasticity (GPa)Yield strength (MPa)Ultimate strength (MPa)
2247.94.5419.216683260882.5105692785
The low Young modulus of Ti alloys is one of most crucial properties
believed to reduce stress shielding effect whereas among Ti alloys, β-type Ti alloys is
ideal for biomedical application because it has the lowest Young’s modulus of
various Ti alloys. β-Ti can be stabilized by addition of niobium, molybdenum and
vanadium. Ou et al. have concluded from their study that anodising behavior of Ti-
30N-1Fe-1Hf alloy composed of CA and β-GP was similar to that of commercial
pure Ti (Ou et al., 2011).
2.2.2 Uses of Titanium and Titanium Alloy in Biomedical Application

5
Hard tissues especially in orthopedics and dentals are often damaged due to
accidents, aging, diseases and other causes. In biomedical field, surgically
substituting the damaged hard tissues with artificial replacements is often practiced
(Liu et al., 2004). The titanium dioxide resulting from different technique of
surface modification process is biocompatible to be implemented as artificial
body replacement since the properties of titanium surface has been modified
to be bioactive to react with body fluid.
Titanium and titanium alloy is widely used as artificial implant such as hip
joint implant, artificial tooth, and artificial heart valve and even for osteosynthesis
implant (Liu et al., 2004). The uses of titanium and its alloy in biomedical
application are summarised in Table 2.2.
Table 2.2: Uses of titanium and its alloy in biomedical application (Liu et al., 2004).
Field Application FigureOrthopedics 1. Total hip joint
replacement (femoral head, cup, and stem).
2. Bone screws.3. Bone plate.
Figure 2.2
Figure 2.3
Dental implant Three types:1. Subsperiosteal2. Prosthesis3. Transosteal
Figure 2.4
Cardiovascular Artificial heart valve Figure 2.5

6
Figure 2.2: The artificial hip joint (Liu et al., 2004).
Figure 2.3: Bone screw and bone platemade from Ti (Liu et al., 2004).
(TiO2)

7
Figure 2.4: Artificial tooth (Liu et al., 2004).
Figure 2.5: Artificial heart valve (Liu et al., 2004).
Ti
TiO2
Ti

8
2.3 Titanium Dioxide (TiO2)
About 95% of titanium ore extracted from the Earth is destined for refinement into
titanium dioxide. Titanium dioxide, also known as titanium (IV) oxide or titania, is
the naturally occurring oxide of titanium. Naturally TiO2 exists in three crystalline
phase, anatase and rutile are stable phases while brookite is non-stable (Goresy et al.,
2001, and Kuromoto et al., 2007). From the result of biological evaluation in
simulated body fluid (SBF), the anodic TiO2 substrateshowed bioactive activity.
Optical properties of titanium dioxide are summarised in Table 2.3, while
some basic and historical information are given in Table 2.4. Rutile form of titanium
dioxide is shown in Figure 2.6 whereas the crystal structure of TiO2 can be seen in
Figure 2.7.
Table 2.3: Refractive index, density, and crystal structure of TiO2
(Carp et al., 2004)
Phase
RefractiveIndex
(grand/petit)
Density(kg.m-3)
SystemStructure
ng np
Anatase 2.5688
2.6584
3830 Tetragonal
Rutile 2.9467
2.6506
4240 Tetragonal
Brookite 2.8090
2.6770
4170 Rhombohedral
9
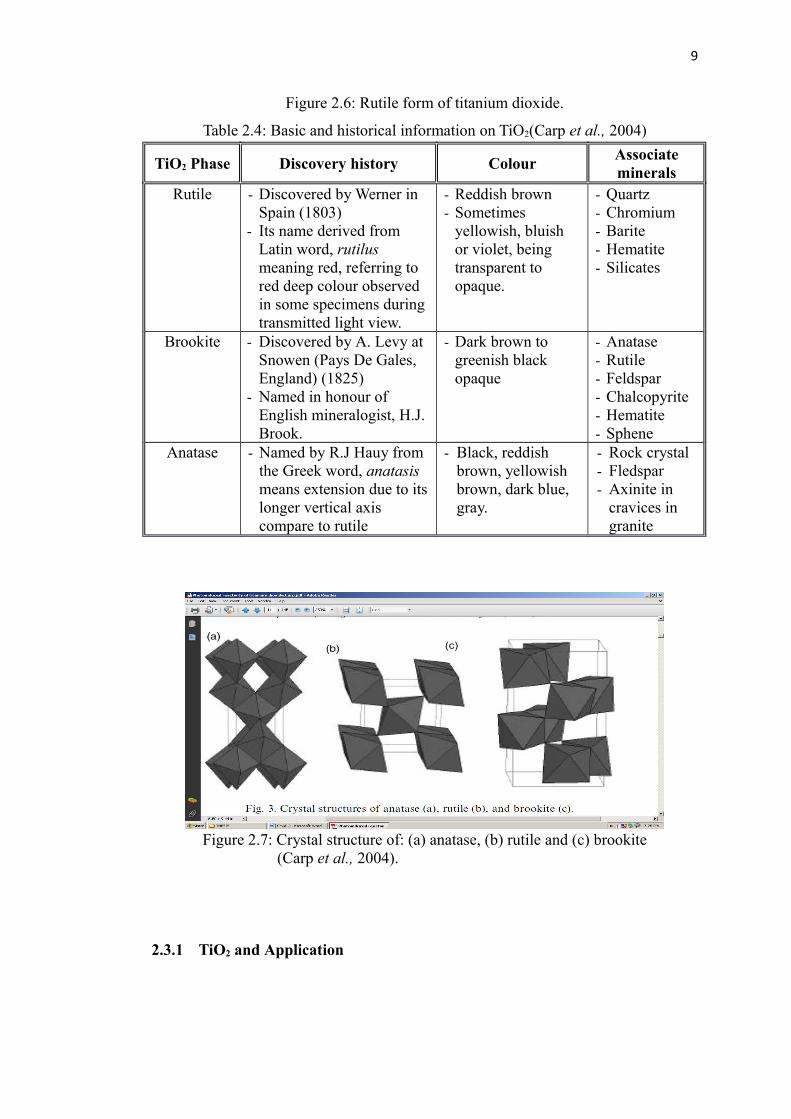
Figure 2.6: Rutile form of titanium dioxide.
Table 2.4: Basic and historical information on TiO2(Carp et al., 2004)
TiO2 Phase Discovery history ColourAssociateminerals
Rutile - Discovered by Werner in Spain (1803)
- Its name derived from Latin word, rutilus meaning red, referring to red deep colour observed in some specimens during transmitted light view.
- Reddish brown- Sometimes
yellowish, bluish or violet, being transparent to opaque.
- Quartz- Chromium- Barite- Hematite- Silicates
Brookite - Discovered by A. Levy at Snowen (Pays De Gales, England) (1825)
- Named in honour of English mineralogist, H.J. Brook.
- Dark brown to greenish black opaque
- Anatase- Rutile- Feldspar- Chalcopyrite- Hematite- Sphene
Anatase - Named by R.J Hauy from the Greek word, anatasis means extension due to itslonger vertical axis compare to rutile
- Black, reddish brown, yellowish brown, dark blue, gray.
- Rock crystal- Fledspar- Axinite in
cravices in granite
Figure 2.7: Crystal structure of: (a) anatase, (b) rutile and (c) brookite(Carp et al., 2004).
2.3.1 TiO2 and Application
10
TiO2 is widely used as a white pigment in paint with total production of 51%, 19% in
plastic, and 17% in paper. Furthermore, in the last few years, the usage of TiO2 as
white pigment has increased in some sectors including textile, food, leather, and
pharmaceuticals (Carp et al., 2004) due to some reasons such as high refractive
index, it can be produced at high purity and the appropriate particle range (Abdullah
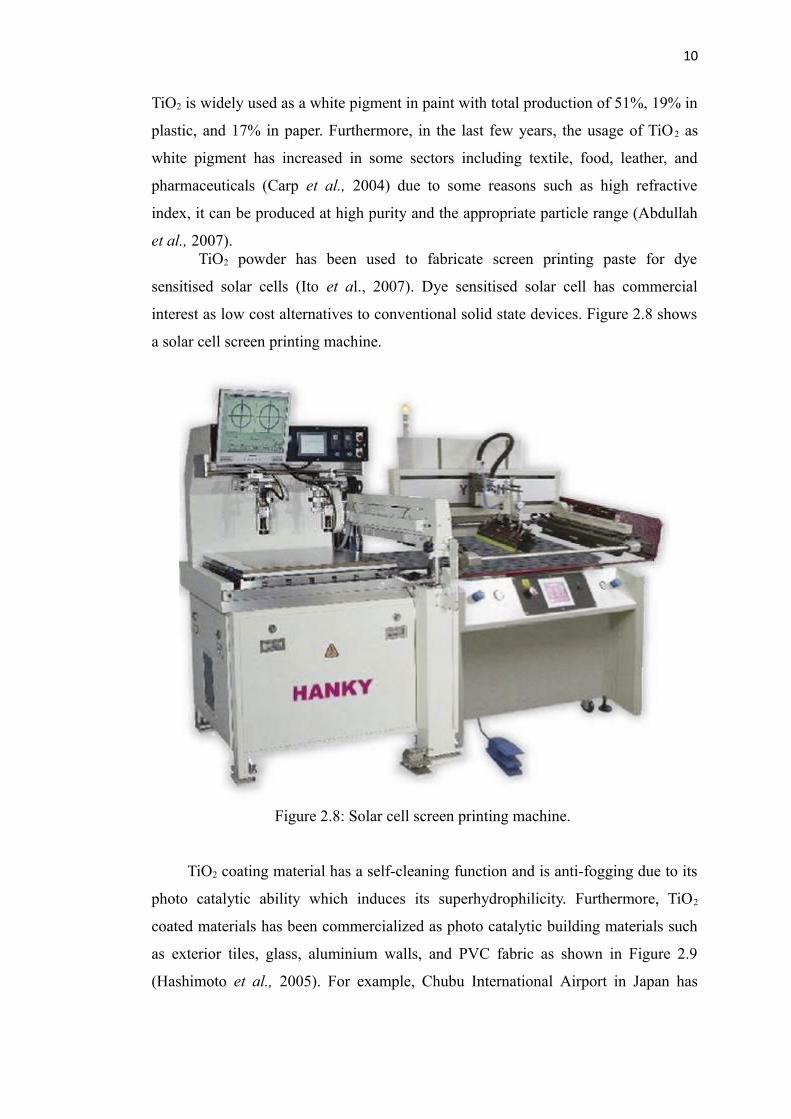
et al., 2007).TiO2 powder has been used to fabricate screen printing paste for dye
sensitised solar cells (Ito et al., 2007). Dye sensitised solar cell has commercial
interest as low cost alternatives to conventional solid state devices. Figure 2.8 shows
a solar cell screen printing machine.
Figure 2.8: Solar cell screen printing machine.
TiO2 coating material has a self-cleaning function and is anti-fogging due to its
photo catalytic ability which induces its superhydrophilicity. Furthermore, TiO2
coated materials has been commercialized as photo catalytic building materials such
as exterior tiles, glass, aluminium walls, and PVC fabric as shown in Figure 2.9
(Hashimoto et al., 2005). For example, Chubu International Airport in Japan has

11
been installed with photo catalytic exterior glass. Stains on TiO2 coated material or
building can easily washed by water or rainfall.
Figure 2.9: Tent material without any coating (left) compared with TiO2 coated tent material (right) (Hashimoto et al., 2005).
Water droplets occur on mirror or glass area during fogging weather when the
haze condensate. On TiO2 coated glass, no water droplets are forms because the
surface is highly hydrophilic but thin film of water is formed in replacement,
preventing fogging and resulting in clearer vision through the glass surface
(Hashimoto et al., 2005). Moreover, Japan automobile industry has installed anti
fogging side mirror to their cars (Figure 2.10).
Figure 2.10: Conventional side mirror (left) compared with anti fogging side mirror coated with TiO2 (right) (Hashimoto et al., 2005).

12
2.4 Ultra Violet (UV) Light
In our solar system, the sun emits electromagnetic radiation of different energy or
wavelengths. Some of the radiation is visible and can be seen by human eyes such as
the radiation that makeup colours of rainbows. The radiation which cannot be seen
by human eyes, beyond the violet or end of visible light is called ultraviolet light.
The wavelength of UV light spans the range between 200 and 400 nm. It is divided
into three groups (Jiang et al., 2009):
1. UVA (320–400 nm)2. UVB (290–320 nm)3. UVC (200 – 290 nm)
UV light that penetrates our skin is made up of two type of radiation which is UVA
and UVB. UVA is the less energetic portion of the UV spectrum. Before reaching to
ground level, it is only absorbed slightly by ozone layer. Some studies showed that
UVA is hazardous because it causes skin damage, pre mature photo aging, wrinkling,
and also eye damage (Heisler and Grant, 2000; Kimlin et al., 2002).
UVB comprises the most energetic wavelengths and it reaches the ground
level even though it is strongly absorbed by stratospheric ozone. UVB has harmful
effects in some biological systems such as disrupted proteins (DNA), causes skin
sunburn, skin cancer and eye cataracts in humans, loss of productivity and other
harsh effects in plants (Setlow, 1974; WHO, 2002; Parisi et al., 2007). However,
UVB can also be beneficial. It can initiate the production of vitamin D that helps
build and maintain human bone and it could prevent certain types of cancer (Turnbull
et al., 2005).
UVC is the high energetic portion of the UV spectrum and it is all absorbed
by ozone layer and others atmospheric constituents and does not reach the earth
surface (Jacovides et al., 2012). Figure 2.11 illustrates visible light, UVA and UVB
wavelength.
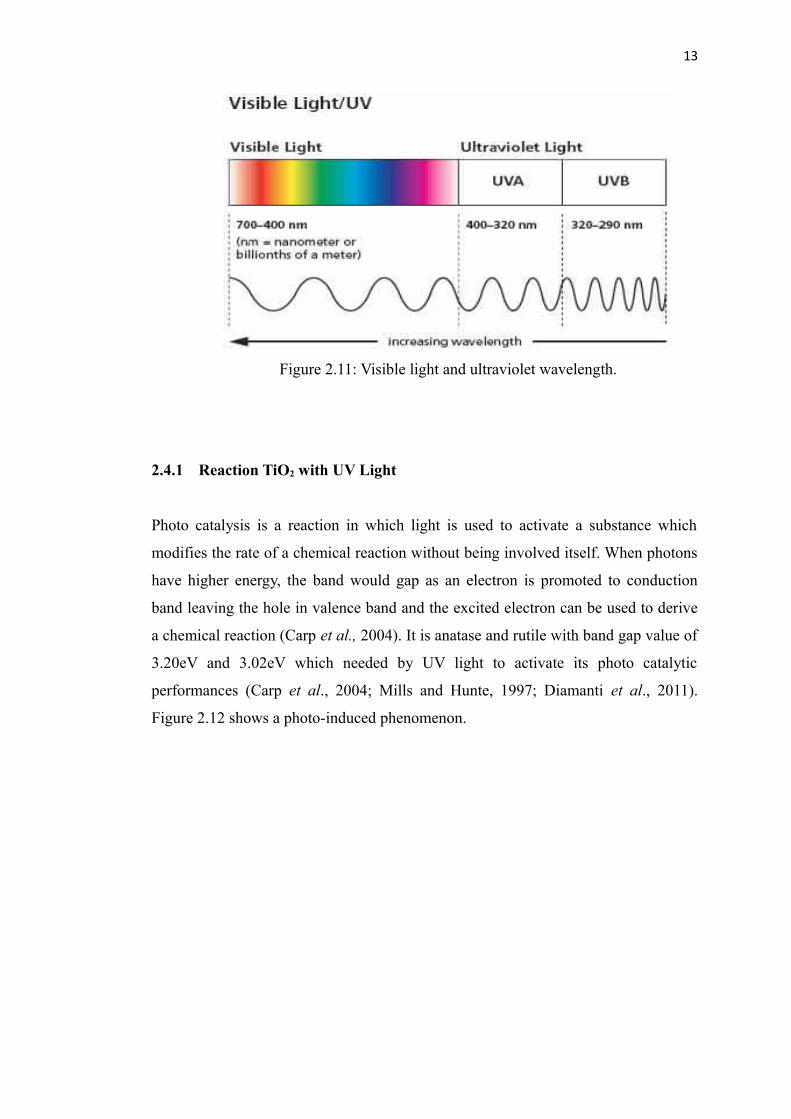
13
Figure 2.11: Visible light and ultraviolet wavelength.
2.4.1 Reaction TiO2 with UV Light
Photo catalysis is a reaction in which light is used to activate a substance which
modifies the rate of a chemical reaction without being involved itself. When photons
have higher energy, the band would gap as an electron is promoted to conduction
band leaving the hole in valence band and the excited electron can be used to derive
a chemical reaction (Carp et al., 2004). It is anatase and rutile with band gap value of
3.20eV and 3.02eV which needed by UV light to activate its photo catalytic
performances (Carp et al., 2004; Mills and Hunte, 1997; Diamanti et al., 2011).
Figure 2.12 shows a photo-induced phenomenon.

14
Figure 2.12: Photo-induced phenomena of TiO2 (Carp et al., 2004)).
TiO2 is an ideal photo catalyst option to be used in industry due to its useful
properties such as highest stability, low cost, virulence, anti-photo corruption, high
photo catalysis, and strong oxidation ability (Hashimoto et al., 2005; Wang et al.,
2007). TiO2 can induce and accelerate some chemical reaction when exposed to UV
light irradiation (Hashimoto et al., 2005). Anatase is the most active photo catalyst of
the three phase of TiO2. The photo catalytic ability of TiO2 was found to be able to increase the
degradation of hazardous chemical in wastewater or in air (Mantzavinos and
Psillakis, 2004; Nakano et al., 2003; Chiron et al., 2000; Frank and Bard, 1977) such
as endocrine disruptors, injurious volatile compounds, and organic pollutant
(Masahashi et al., 2008). Wang et al., have studied the photo catalytic activity of
porous TiO2 films prepared by anodic oxidation (Wang et al., 2006). Photo catalysis
of TiO2 produced under different condition was studied by degrading the methyl
orange and the result are summarised in Table 2.5.
Table 2.5: Summary of previous study on photo catalysis activity of anodic oxidationTiO2 film by degrading methyl orange (Wang et al., 2006).
Parameter Value/Type Main observation Finding

15
Anodisationvoltage
80- 140 VDegradation rate increased by increasing voltage
-The amount of anatase increased by increasing voltage leads to increase in photo catalysis activity.-Rutile formed at 150V lower the degradation rate.150 V
Worse degradation rate
pH of methylorange
AcidDegradation rate is highest at pH 1
-Hydroxyl in acid has strong oxidation ability which is important factor inphoto catalysis.
Alkaline
Degradation rate lowest at pH 9 and continue to increase from 9
Type ofelectrolyte
HydrofluoricAcid
Low degradation rate
-TiO2 film produced in H2SO4 is thicker than that inHF. Therefore, more TiO2 can facilitate to improve photo catalysis.
Sulphuric AcidHigh degradation rate
2.5 Oxidation
Oxidation is a process in which oxygen molecules interact or combine with a
substance that will change its chemical properties. It is precisely defined as the loss
of electrons in the atoms when two or more substances interact. Commonly,
oxidation is assumed to be bad or harmful such as causing rust or corrosion in
automobiles. The oxide layers build up as surface elements lose their electrons while
the negatively charged elements react with oxygen in air or with water molecules.
Oxidation also brings benefits in some areas, especially in the medical field.
Oxidation is used in surface modification of metal to be implanted in the human
body. In this study, the oxidation process occurs on titanium surface to produce
titanium dioxide for uses biomedical uses. Specifically the method of anodic
oxidation will be implemented on titanium surface modification to improve its
biocompatibility. Examples of a few types of oxidation are listed below:
1. Sol gel oxidation - Hydrolysis and condensation of alkoxide-based
precursors. Sol-gel process can be used to produce a wide range of oxides in
16
various forms, including powders, fibers, coatings and thin films, and porous
membranes.
2. High temperature oxidation - Corrosion process involving the reaction
between the metal and the atmospheric oxygen at elevated temperatures.
3. Micro arc oxidation - An electrochemical surface treatment process for
generating oxide coatings on metals. Similar to anodic oxidation, but it
employs higher potentials, discharges occur and resulting plasma which
modifies the structure of the oxide layer.
4. Thermal oxidation – A process that produces thin layer of oxide, usually
silicon dioxide, on the surface of a wafer. This method forces an oxidizing
agent to diffuse into the water at high temperature and react with it.
5. Anodic oxidation – Electrolytic process used to increase the thickness of the
natural oxide layer on the metal surface.
2.5.1 Anodic Oxidation
Anodic oxidation is a reaction where the atoms in an element lose electrons and the
valence of the element is correspondingly increased or a process in which a
substance combined with oxygen. It is also known by the British as electrolytic
passivation process used to increase the thickness of the natural oxide layer on the
surface of metal parts. It is a well-established method to produce different types of
protective oxide coating on metals. The process is called "anodic" because the part to
be oxidised from the anode electrode of an electrical circuit.
The anodised metal oxide is grown by passing a direct current through an
electrolytic solution, with the metal substrate serving as the anode, the positive
electrode. The current releases hydrogen at the cathode the negative electrode and

17
oxygen at the surface of the metal film anode, creating a build-up of metal oxide.
Alternating current and pulsed current is also possible but rarely used. There are
three substrates or metal base commonly been anodise which are aluminium,
titanium and magnesium. In this research, titanium will be anodised.
Anodic oxidation is one of the surface modification techniques which are
necessary to improve chemical bond between Ti substrate with bone tissue. An
alternative of anodic oxidation, plasma spraying hydroxyapatite (HAP) is also
accepted extensively in clinic involving coating of bioactive material (HAP) on Ti
substrate. This method however, has some disadvantages such as weak adhesion
between HAP layer for implantation and plasma spray, high temperature process and
difficulty to control HA layer composition and crystallinity based on desired
application (Ou et al., 2010).
The schematic diagram of anodic oxidation process is shown in Figure 2.13.
Anodic oxidation of titanium metal in simple electrolyte would produce anatase or
rutile on their surfaces by conditioning the anodic oxidation process, which might be
sufficient for preparation of titanium metal with high apatite-forming ability.
Figure 2.13: Schematic diagram of anodic oxidation process.
Power supply
Cathode (-)Anode (+)Electrons flow
Titaniumsubstrate
Oxidelayer Electrolyte

18
2.5.2 Anodic Oxidation Parameters
Process parameters are some aspect to be controlled during the experiment (anodic
oxidation) on titanium substrate to produce titanium dioxide. Titanium dioxide may
present differently in both amorphous and crystalline structures, depending on
process parameters. Crystalline oxides, that is, anatase and rutile, present several
peculiar features, such as photo catalytic behavior, superhydrophilicity and
biocompatible properties (Diamanti and Pedeferri, 2006).
The different parameters applied, will result to different surface and different
thickness of titanium dioxide. The growth behavior of the titanium dioxide also can
be varied over quite a wide range by altering the anodic parameters (Diamanti and
Pedeferri, 2006; Kuromoto et al., 2007), such as:
1. Applied voltage2. Time3. Concentrations of electrolyte4. Current density5. Agitation speed6. Surface area ratios of cathode to anode
2.5.3 Applied Voltage
The different porosity for implant can be obtained by applying different voltages
during anodisation. The amount of voltage applied will somehow affect the result.
The higher the voltage applied, the thicker the surface of titanium dioxide being
produced. Commonly the amount of voltage applied in anodic oxidation may range
from 1 to 300 volt. The low potentials which range between 1 to 130 volt allow the
obtaining of a smooth, amorphous oxide, about 3–100 nm thick (Diamanti and

19
Pedeferri, 2006). The porosity and the pore size increase with the increasing voltage.
The porous region would form due to dielectric breakdown as the film breaks down
locally while the voltage increases. The formation of TiO2 occurs when O2- ions
migrate into the metal-film interface and Ti4+ ions migrate from metal Ti to film-
electrolyte boundary. Larger crates or pores can also be observed at higher voltage
due to pores interconnection with each other (Kuromoto et al., 2006).
Table 2.6: Result summary of previous study on anodic oxidation using 1 M H2SO4 with different voltages (Yang et al., 2004).
H2SO4 concentration(Molar, M)
Voltage range (V) Description
1
90 - 180 Porous surface>105 Spark discharge occurred
90 - 155Porosity and pore size
increase
155 - 180Porosity and structure not
change
Table 2.6 summarises the result of previous study done by Yang et al, on
anodic oxidation using 1 mol H2SO4 with dissimilar voltages (Yang et al., 2004).
They reported pore size increased by increasing in applied voltage. However the
porosity somehow becomes fixed at 155 V. At applied voltage 90V, some other
researchers reported the beginning of anatase formation (Yang et al., 2004; Daimanti
and Pedeferri, 2006). The intensity of anatase increased by increasing voltage up to
155 V and some amount of rutile started to appear (Table 2.7). However, at very high
voltage only rutile appeared on the surface. In another study, Cui et al., reported
anatase phase converted into rutile with the increase of applied voltage from 100 to
150V (Cui et al., 2009).
Table 2.7: TiO2 phase structures appear by different voltage applied(Yang et al., 2004).
Voltage Applied (V) TiO2 Structure90 Anatase155 Anatase and rutile180 Only rutile
20
Table 2.7 shows the phase structure of titanium dioxide, produced by
different voltage applied to anodic oxidation process. The surface morphology
evolution of anodised cp Ti obtained by Ou et al., in their study was summarised in
Table 2.8 (Ou et al., 2010). From their result, obviously TiO2 thickness increased
with increasing voltage (Ou et al., 2010).
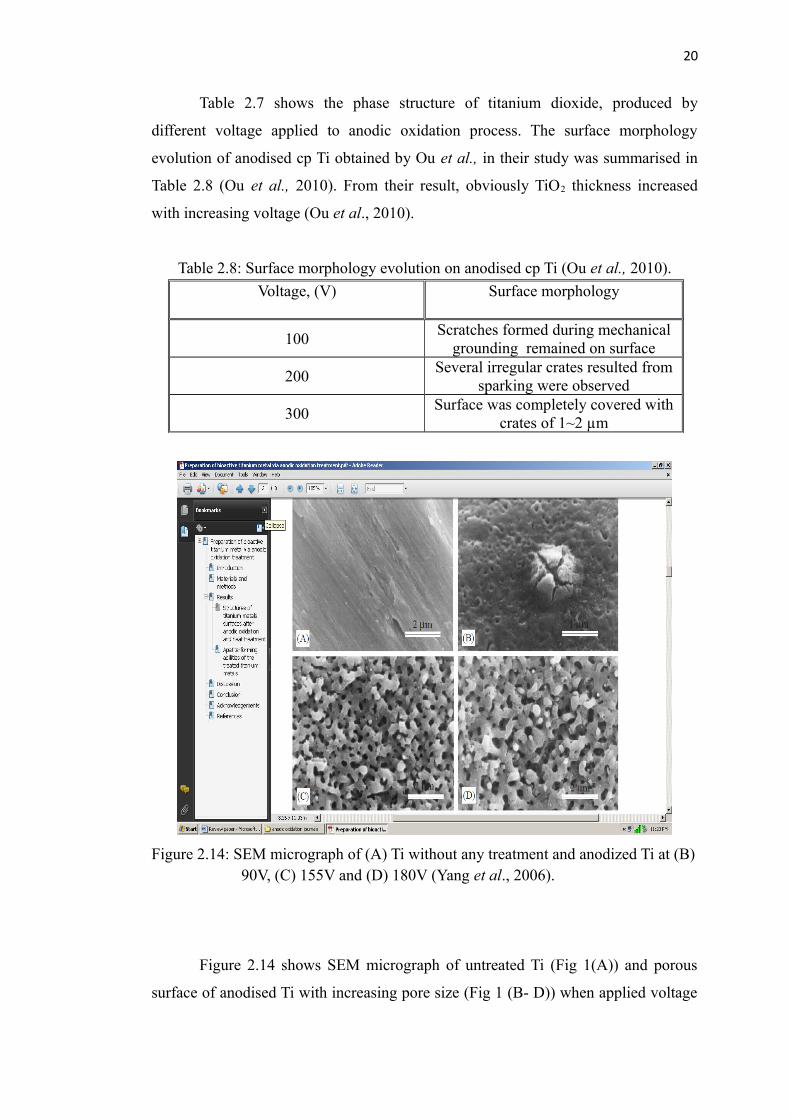
Table 2.8: Surface morphology evolution on anodised cp Ti (Ou et al., 2010).
Voltage, (V) Surface morphology
100Scratches formed during mechanical
grounding remained on surface
200Several irregular crates resulted from
sparking were observed
300Surface was completely covered with
crates of 1~2 µm
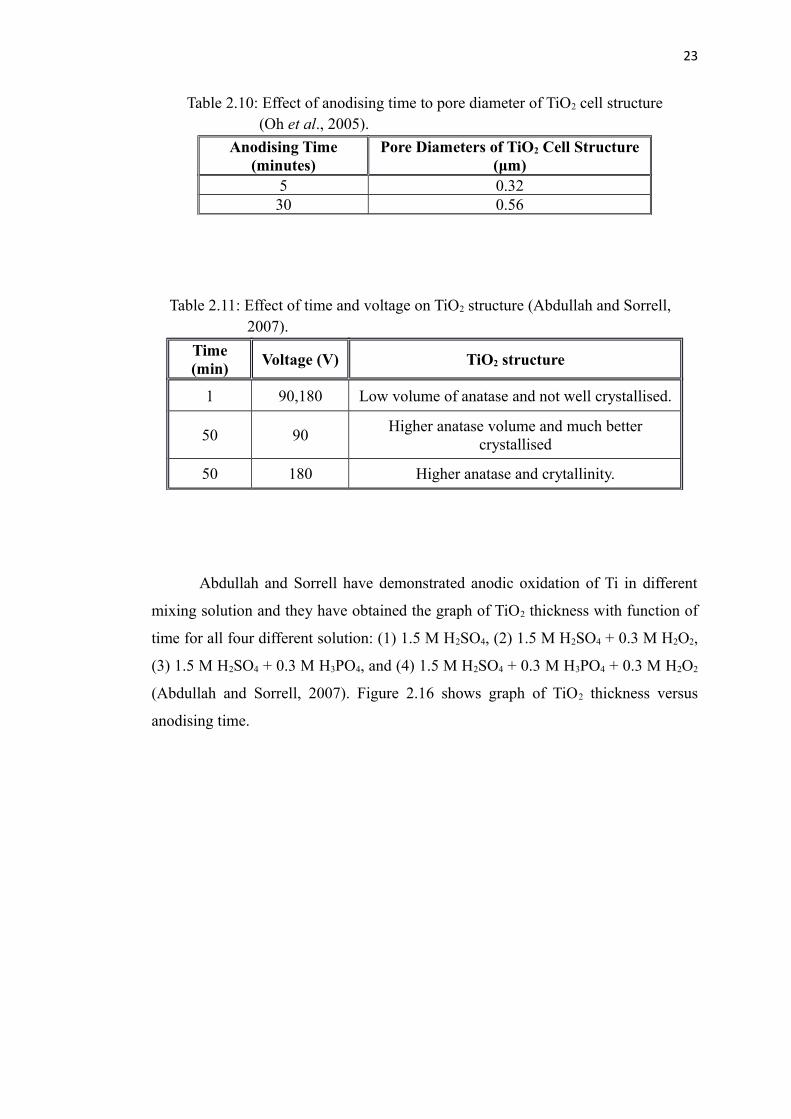
Figure 2.14: SEM micrograph of (A) Ti without any treatment and anodized Ti at (B)90V, (C) 155V and (D) 180V (Yang et al., 2006).
Figure 2.14 shows SEM micrograph of untreated Ti (Fig 1(A)) and porous
surface of anodised Ti with increasing pore size (Fig 1 (B- D)) when applied voltage

21
was increased. Abdullah and Sorrell have specified the effect of voltage on TiO2
microstructure into five stages as per Table 2.9 (Abdullah and Sorrell, 2010).
Table 2.9: Five stages of voltage effecting TiO2 microstructure(Abdullah and Sorrell, 2010).
Voltage Range Type ofMicrostructure
RelevantPhenomenonType Volts
Very Low 5 Incomplete Onset of film growthLow 10 Dense and smooth Monolayer formation
Intermediate 20 - 70 Dense and unevenIncreasing film
growthHigh 100 Variable porosity Onset of arcing
Very High 150 - 350 Consistent porosity Subsurface arcingThe applied voltage is very important parameter because it is the main
parameter effecting TiO2 structure in anodic oxidation. It is also important to design
bone implant based on its original structure. The bone structure consist of two types
(Figure 2.15); cortical bone which is the outer part of long bone isvery dense and stiff
while trabecular bone- the inner part is soft, foamed structure that is also porous and
filled with osseous medulla (Mano et al., 2004). The density of bone decreases from
outer to core and its structure continuously adapt to stress applied on it. So, the
implant material must be compatible and designed nearly as per original living bone
and concern the surrounding of living tissue. The bone like porous structure can be
implemented on implant by applying different voltage during anodisation.
Increasing voltage

22
Figure 2.15: Two types of bone structure; cortical bone (left) and trabecular bone (right) (Ott, 2004).
2.5.4 Time of Oxidation
Time is another important parameter in anodic oxidation process. The electrolyte
might need certain amount of time to completely anodise titanium plate immersed in
the solution. The longer the process, the more the surface area being anodises
(Diamanti and Pedeferri, 2006). Beside, as time increases, the oxide thickness
produced on the surface area becomes thicker (Table 2.10) and well crystallised
(Table 2.11). The growth of pore diameter of TiO2 cell structure with anodic time
increases rapidly in the beginning stage of anodisation and the increment became
linear after 30 minutes.
More porous
23
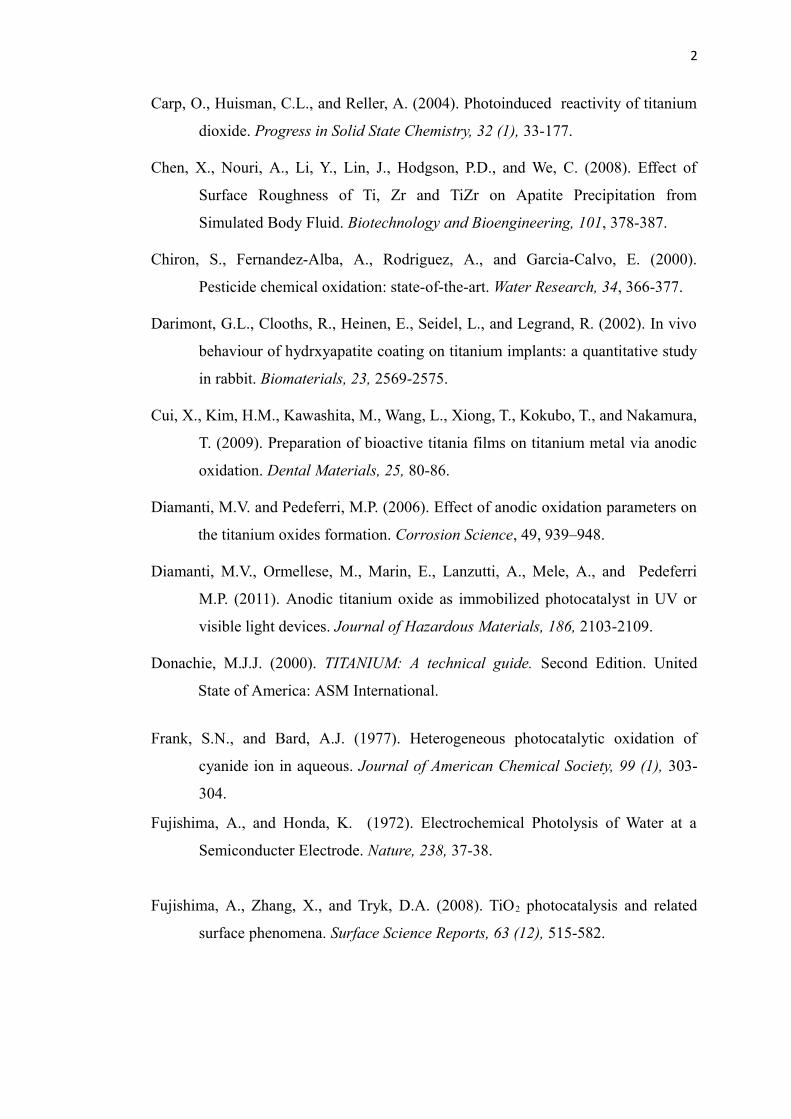
Table 2.10: Effect of anodising time to pore diameter of TiO2 cell structure(Oh et al., 2005).
Anodising Time(minutes)
Pore Diameters of TiO2 Cell Structure(μm)
5 0.3230 0.56
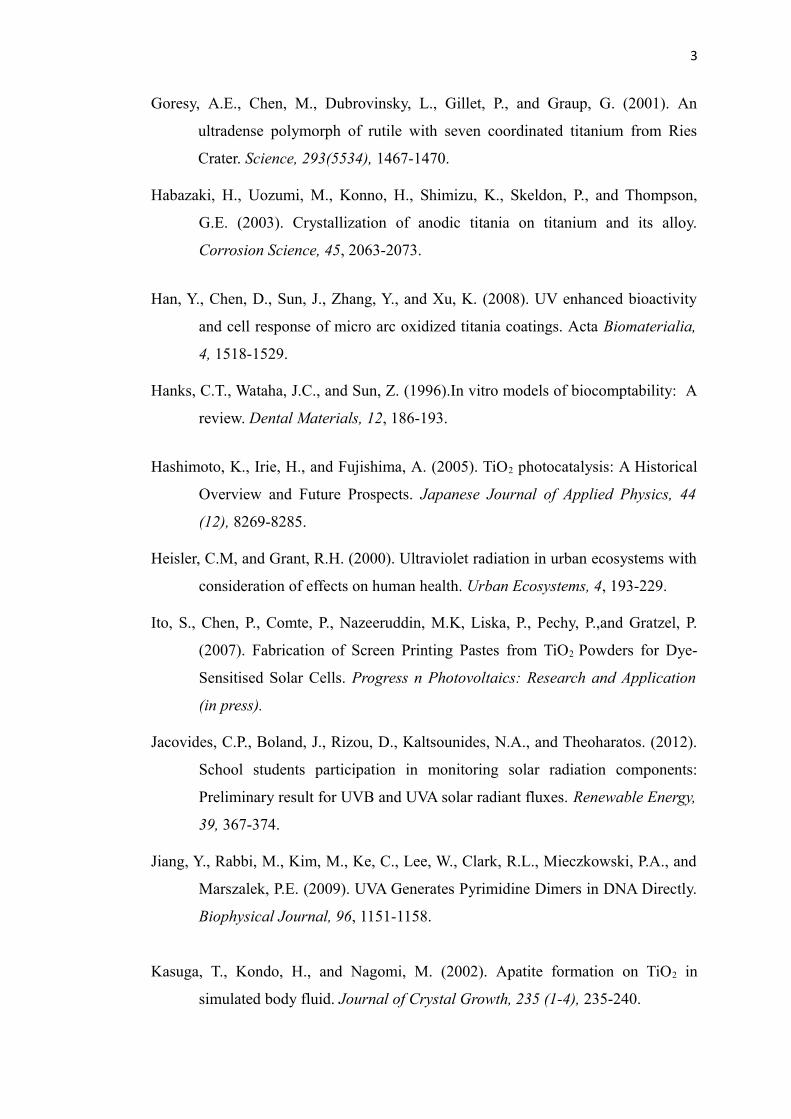
Table 2.11: Effect of time and voltage on TiO2 structure (Abdullah and Sorrell, 2007).
Time(min)
Voltage (V) TiO2 structure
1 90,180 Low volume of anatase and not well crystallised.
50 90Higher anatase volume and much better
crystallised
50 180 Higher anatase and crytallinity.
Abdullah and Sorrell have demonstrated anodic oxidation of Ti in different
mixing solution and they have obtained the graph of TiO2 thickness with function of
time for all four different solution: (1) 1.5 M H2SO4, (2) 1.5 M H2SO4 + 0.3 M H2O2,
(3) 1.5 M H2SO4 + 0.3 M H3PO4, and (4) 1.5 M H2SO4 + 0.3 M H3PO4 + 0.3 M H2O2
(Abdullah and Sorrell, 2007). Figure 2.16 shows graph of TiO2 thickness versus
anodising time.

24
Figure 2.16 :TiO2 thickness variation with anodising time (Abdullah andSorrell, 2007).
The thickness increased as anodising time increased until 30 minutes for all
solution. After 30 minutes, TiO2 thickness anodised in solution 1, 2, and 3 have
stopped rising, but for solution 4 the thickness continued to increase until 50 minutes.
The result was similar with previous work by Oh et al., 2005. However, for solution
4, the effect of type of electrolyte might have taken over influencing the thickness
and was beneficial at this point in obtaining thicker TiO2 coating.
2.5.5 H2SO4 Electrolyte
Another parameter that is most effective in manipulating the oxide characteristics is
the type of electrolyte solution. Water, particularly salted or acidic water where when
ions are added, can be electrolysed. The electrolyte is usually a solution of water or
other solvents in which ions are dissolved. The most frequently used electrolytes in
titanium anodisation are phosphoric (H3PO4) and sulphuric acids (H2SO4),

1
REFERENCES
Abdullah, H.Z., and Sorrell, C.C. (2008). Anodic oxidation of titanium. Materials
Australia, 41(2), 44-46.
Abdullah, H.Z., and Sorrell, C.C. (2012). Gel Oxidation Of Titanium And Effect Of
UV Irradiation On Precipitation Of Hydroxyapatite From Simulated Body
Fluid. Advance Materials Research. 488-489, 1229-1237.
Abdullah, H.Z., and Sorrell, C.C. (2010). Preparation and Characterisation of TiO2
Thick Films Fabricated by Anodic Oxidation in Sulphuric Acid. Proceeding
International Conference on X-Rays & Related Techniques in Research &
Industry.
Abdullah, H.Z., and Sorrell, C.C. (2007). TiO2 Thick Film by Anodic Oxidation.
Materials Science Forum, 561-565, 2159-2162.
Abdullah, H.Z., Taib, H., and Sorrell, C.C. (2007). Coating methods for self-cleaning
thick films of titania. Advance Applied Ceramics. 106 (1-2), 105–112.
Anpo, M., Dohshi, S., Kitano, M., Hu, Y., Takeuchi, M., and Matsuoka, M. (2005).
Preparetion and characterization of highly efficient titanium oxide-based
photofunctional materials. Annual Review of Material Research, 35, 1-27.
Bartlett, L. (2006). An unusual phenomenon observed when anodising CP titanium to
produce coloured surfaces for jewellery and other decorative uses. Optics &
Laser Technology, 38, 440-444.
Brewer, W.D., Bird, R.K., and Wallace, T.A. (1998). Titanium alloys and processing
for high speed aircraft. Material Science and Engineering A, 243, 299-304.
2
Carp, O., Huisman, C.L., and Reller, A. (2004). Photoinduced reactivity of titanium
dioxide. Progress in Solid State Chemistry, 32 (1), 33-177.
Chen, X., Nouri, A., Li, Y., Lin, J., Hodgson, P.D., and We, C. (2008). Effect of
Surface Roughness of Ti, Zr and TiZr on Apatite Precipitation from
Simulated Body Fluid. Biotechnology and Bioengineering, 101, 378-387.
Chiron, S., Fernandez-Alba, A., Rodriguez, A., and Garcia-Calvo, E. (2000).
Pesticide chemical oxidation: state-of-the-art. Water Research, 34, 366-377.
Darimont, G.L., Clooths, R., Heinen, E., Seidel, L., and Legrand, R. (2002). In vivo
behaviour of hydrxyapatite coating on titanium implants: a quantitative study
in rabbit. Biomaterials, 23, 2569-2575.
Cui, X., Kim, H.M., Kawashita, M., Wang, L., Xiong, T., Kokubo, T., and Nakamura,
T. (2009). Preparation of bioactive titania films on titanium metal via anodic
oxidation. Dental Materials, 25, 80-86.
Diamanti, M.V. and Pedeferri, M.P. (2006). Effect of anodic oxidation parameters on
the titanium oxides formation. Corrosion Science, 49, 939–948.
Diamanti, M.V., Ormellese, M., Marin, E., Lanzutti, A., Mele, A., and Pedeferri
M.P. (2011). Anodic titanium oxide as immobilized photocatalyst in UV or
visible light devices. Journal of Hazardous Materials, 186, 2103-2109.
Donachie, M.J.J. (2000). TITANIUM: A technical guide. Second Edition. United
State of America: ASM International.
Frank, S.N., and Bard, A.J. (1977). Heterogeneous photocatalytic oxidation of
cyanide ion in aqueous. Journal of American Chemical Society, 99 (1), 303-
304.
Fujishima, A., and Honda, K. (1972). Electrochemical Photolysis of Water at a
Semiconducter Electrode. Nature, 238, 37-38.
Fujishima, A., Zhang, X., and Tryk, D.A. (2008). TiO2 photocatalysis and related
surface phenomena. Surface Science Reports, 63 (12), 515-582.
3
Goresy, A.E., Chen, M., Dubrovinsky, L., Gillet, P., and Graup, G. (2001). An
ultradense polymorph of rutile with seven coordinated titanium from Ries
Crater. Science, 293(5534), 1467-1470.
Habazaki, H., Uozumi, M., Konno, H., Shimizu, K., Skeldon, P., and Thompson,
G.E. (2003). Crystallization of anodic titania on titanium and its alloy.
Corrosion Science, 45, 2063-2073.
Han, Y., Chen, D., Sun, J., Zhang, Y., and Xu, K. (2008). UV enhanced bioactivity
and cell response of micro arc oxidized titania coatings. Acta Biomaterialia,
4, 1518-1529.
Hanks, C.T., Wataha, J.C., and Sun, Z. (1996).In vitro models of biocomptability: A
review. Dental Materials, 12, 186-193.
Hashimoto, K., Irie, H., and Fujishima, A. (2005). TiO2 photocatalysis: A Historical
Overview and Future Prospects. Japanese Journal of Applied Physics, 44
(12), 8269-8285.
Heisler, C.M, and Grant, R.H. (2000). Ultraviolet radiation in urban ecosystems with
consideration of effects on human health. Urban Ecosystems, 4, 193-229.
Ito, S., Chen, P., Comte, P., Nazeeruddin, M.K, Liska, P., Pechy, P.,and Gratzel, P.
(2007). Fabrication of Screen Printing Pastes from TiO2 Powders for Dye-
Sensitised Solar Cells. Progress n Photovoltaics: Research and Application
(in press).
Jacovides, C.P., Boland, J., Rizou, D., Kaltsounides, N.A., and Theoharatos. (2012).
School students participation in monitoring solar radiation components:
Preliminary result for UVB and UVA solar radiant fluxes. Renewable Energy,
39, 367-374.
Jiang, Y., Rabbi, M., Kim, M., Ke, C., Lee, W., Clark, R.L., Mieczkowski, P.A., and
Marszalek, P.E. (2009). UVA Generates Pyrimidine Dimers in DNA Directly.
Biophysical Journal, 96, 1151-1158.
Kasuga, T., Kondo, H., and Nagomi, M. (2002). Apatite formation on TiO2 in
simulated body fluid. Journal of Crystal Growth, 235 (1-4), 235-240.

4
Kimlin, M.G., Parisi, A.V., Carter, B.D., and Turnbull, D. (2002). Comparison of the
solar spectral ultraviolet irradiance in motor vehicles with windows in an
open and closed position. International Journal of Biometeorology, 46, 150-
156.
Kokubo, T., Kushtani, H., Sakka, S., Kitsugi, T., and Yamamoru, T. (1990). Solution
able to produce in vivo surface-structure changes in bioactive glass ceramic
A-W3. Journal of Biomedical Material Research, 24 (6), 721-734.
Kokubo, T. and Takadama, H., (2006). How useful is SBF in predicting in vivo bone
bioactivity? Biomaterials, 27, 2907-2915.
Kuromoto, N.K., Simão, R.A., and Soares, G.A. (2006). Titanium oxide films
produced on commercially pure titanium by anodic oxidation with different
voltages. Materials Characterization, 58, 114–121.
Li, P., Ohtsuki, C., Kokubo, T., Nakanishi, K., Soga, N., and deGroot, K. (1994). The
role of hydrated silics, titania and alumina in inducing apatite on implants.
Journal of Biomedical Materials Research, 28 (1), 7-15.
Liu, X., Chu, P.K., and Ding, C. (2004). Surface modification of titanium, titanium
alloys, and related materials for biomedical application. Materials Science
and Engineering, 47, 49–121.
Liu, X., Zhao, X., Li, B., Cao, C., Dong, Y., Ding, C., and Chu, P.K. (2008). UV-
irradiation-induced bioactivity nanostructural surface. Acta Biomaterialia, 4,
544-552.
Liu, J.H., Yi, J.I., Li, S.M., Yu, M., and Xu, Y.Z. (2009). Fabrication and
characterization of anodic oxide films on a Ti-10V-2Fe-3Al titanium alloy.
International Journal of Minerals, Metallurgy, and Materials, 16 (1), 96.
Mantzavinos, D., and Psillakis, E. (2004). Enhancement o biodegradability of
industrial wastewater by chemical oxidation pre-treatment. Journal of
Chemical Technology and. Biotechnology, 79 (5), 431-454.

5
Marques, M.R.C., Loebenberg, R., and Almukainzi, M. (2011). Simulated Biology
Fluidss with Possible Application in Dissolution Testing. Dissolution
Technologies, 18-28.
Masahashi, N., Semboshi, S., Ohtsu, N., and Oku, M. (2008). Microstructure and
superhydrophilicity of anodic TiO2 films on pure titanium. Thin Solid Films, 516, 7488-7496.
Mills, A., and Le Hunte, S. (1997). An overview of semiconductor photocatalysis.
Journal of Photochemistry and Photobiology A: Chemistry, 108 (1), 1-35.
Nakano, Y., Okawa, K., Nishijima, W., and Okada, M. (2003). Ozone decomposition
of hazardous chemical substance in organic solvents. Water Research, 37
(11), 2595-2598.
Oh, H.J., Lee, J.H., Jeong, Y., Kim, Y.J., and Chi, C.S. (2005). Microstructural
characterization of biomedical titanium oxide film fabricated by
electrochemical method. Surface & Coatings Technology, 198, 247– 252.
Ou, S.F., Lin, C.S., and Pan, Y.N. (2011). Microstructure and surface characteristics
of hydroxyapatite coating on titanium and Ti-30Nb-1Fe-1-Hf alloy by anodic
oxidation and hydrothermal treatment. Surface & Coating Technology, 205,
2899-2906.
Parisi, A.V., Turnbull, D.J., and Turner, J. (2007). Calculation of cloud modification
factors for the horizontal plane eye damaging ultraviolet radiation.
Atmosphoric Research, 86, 278-285.
Santos, E. Jr., Kuromoto, N.K., and Soares, G. A. (2006). Mechanical properties of
titania films used as biomaterials. Materials Chemistry and Physics.
Schvezov, C.E., Alterach, M.A., Vera, M.I., Rosenberger, M.R., and A., Ares, A.E.
(2010) Characteristics of hemocompatible TiO2 nano-films produced by the

6
sol-gel and anodic oxidation techniques. JOM Journal of the Minerals,
Metals and Materials Society, 62, 84-87.
Setlow, R.B. (1974). The wavelength in sunlight effective in producing skin cancer: a
theoretical analysis. National Academic Science USA, 71 (9), 3363-3366.
Song, H.J., Park, S.H., Jeong, S.H., and Park, Y.J. (2008). Surface characteristics and
bioactivity of oxide films formed by anodic spark oxidation on titanium in
different electrolytes. Journal of Material Processing Technology, 209, 864–
870.
Turnbull, D.J., Parisi, A.V., and Kimlin, A.G. (2005). Vitamin D effective ultraviolet
wavelengths due to scattering in shade. Journal of Steroid Biochemistry and
Molecular Biology, 96, 431-436.
Uchida, M., Kim, H.M., Kokubo, T., Fujibayashi, S., and Nakamura, T. (2002).
Effect of Water Treatment on the Apatite-Forming Ability of NaOH-Treated
Titanium Metal. Journal of Biomedical Materials Research, 63 (5), 522-230.
Ueda, M., Kinoshita, T., Ikeda, M., and Ogawa M. (2009). Photo induced formation
of hydroxyapatite on TiO2 synthesized by a chemical-hydrothermal treatment.
Materials Science and Engineering C, 29, 2246-2249
Uetsuki, K., Kaneda, H., Shirosaki, Y., Hayakawa, S., and Osaka, A. (2010). Effects
of UV-irradiation on in vitro apatite-forming ability of TiO2 layers. Materials
Science and Engineering B, 173, 213-215.
Wang, W., Tao, J., Wang, T., and Wang, L. (2007). Photocatalytic activity of porous
TiO2 films prepared by anodic oxidation. Rare Metals, 26 (2), 136.
WHO. Global Solar UV Index; 2012.
Yang, B., Uchida, M., Kim, H.M., Zhang, X., and Kokubo, T. (2004). Preparation of
bioactive titanium metal via anodic oxidation treatment. Biomaterials, 25,
1003–1010.

7
Yetim, A.F. (2010). Investigation of wear behaviour of titanium oxide films,
produced by anodic oxidation, on commercially pure titanium in vacuum
condition. Surface & Coating Technology, 205, 1757-1763.