a throughput bulletin for texport syndicate, post vsm
TRANSCRIPT

Apparel Internship
At
Texport Syndicate India Limited
Bangalore
Presented By:Mahak Raitani Sourav Kumar
Bachelor In Fashion Technology (2011-2015)
Department of Fashion TechnologyNational Institute of Fashion Technology

Company Profile
• Texport Syndicate has strategic globalrepresentation with its corporate headquarterslocated in Mumbai, India and manufacturingfacilities located in Bangalore, Mumbai andTirupur, India.
• Additionally, Texport syndicate is represented inNorth America by Key Apprel In New York, USA

In-House Production
• Japanese Made Juki, Brother and Singer Machineswith specialized ancillary machines supported withmodern laundry/ finishing embroidery machines.
• Factories are designed to produce Shirts, Blouses,Shorts, Trousers and Outerwear.
• Over 300 administrative and Quality Assurancestaffs manage all factories.
• Over 9000 skilled workers are permanentlyemployed with proper welfare facility, observingHuman Rights Issue requirements.

BUYERS

DEPARTMENTS

MERCHANDISING

MERCHANDISER ACTIVITIES
• Design / sampling/ Sketch/ Construction/ Pattern/ Sizes/ Season
• Fabric/ Quality/ GSM/ EPI/ PPI/ Colour• Trims and Accessories • Testing • Production • Quality check/ Finishing/ Printing / Washing • Documentation • Shipping / forwarding/ Delivery Date / Quantity/
Price • TNA- Time and Action Calendar

SAMPLING
Sampling Department consists of 41 Tailors,4
Pattern Masters, 2 Graders and 4 Marker
Makers. The employees are categorised under:
• GM
• Technical Manager
• Asst. Manager
• In charge of CAD Department)
• Tailors

Stages of Sample Development

EDP
EDP Department is IT department of the factory which takes care of hardware and software. Apart from it, the department does the following work:• Planning of installation of required hardware and software. • Estimation • Budgeting of Software and hardware • Approval from top management • Customisation according to requirement • Purchase • Installation • Implementation • Training of staff about the hardware and software. • Maintenance if required • Accountability of the resources

VGEMS
• VGEMS is a Garment Export Management Systemdeveloped by Optimal InfoTech System Pvt. Ltd.Connection from the Citrix software.
• VGEMS is an ERP (Enterprise Resource planning)for the garment manufacturing industries (withinIndia). This system is being used in Texport units.
• The server is located in the Bombay Texport HO. Thissoftware is being used by all the 7 units in the 4locations: Bangalore, Bombay, Tirupur and Hyderabad.

Production Planning• The PPD is responsible for setting the Targets for the day. This
department plans when and where the production will start, go on and end.
• The planning department is responsible for planning how theproduction will complete within the delivery date set.
• First of all the planning department receives the samplefrom the buyers.This sample is then sent to the GSD department.
• The GSD department analyses all the details and prepare theOperation Bulletin (OB). This OB is then received here.
• Side by side, the PPD also receives the Order Chart and the Fabricand Trims Status Report from the merchandiser. The order chart hasthe delivery date in it.
• These 3 reports are necessary for planning and should be received before.

GSD ( GENERAL SEWING DATA)

IED (INDUSTRIAL ENGINEERING)
• Method Implementation in the batch. • Works on Kaizen activities. • To maintain the methods of the operation performed in the batch as
implemented by • GSD. • Follow-up on low output operators. Finding out reason for low
efficiency and solving the problem to increase performance and productivity.
• Off-standard & On-standard work details calculation • Calculating non-productive time to estimate loss of cost because of
machine failure. • Maintaining Target stickers for each operation. • Preparation of GSD mode to hang on machine to facilitate the work
of operator. • Monitoring hourly production of line.

• To conduct Time study to determine the capacity, efficiency and to work on critical operation to reduce the operation cycle time to reduce WIP.
• Generating Daily production report and style-wise efficiency report.
• Maintaining incentive report • Maintaining Roll Throughput Yield.• Capacity report generation. • Create and update skill matrix of each operator
& submit the same to personnel department. • Assist in Factory planning.

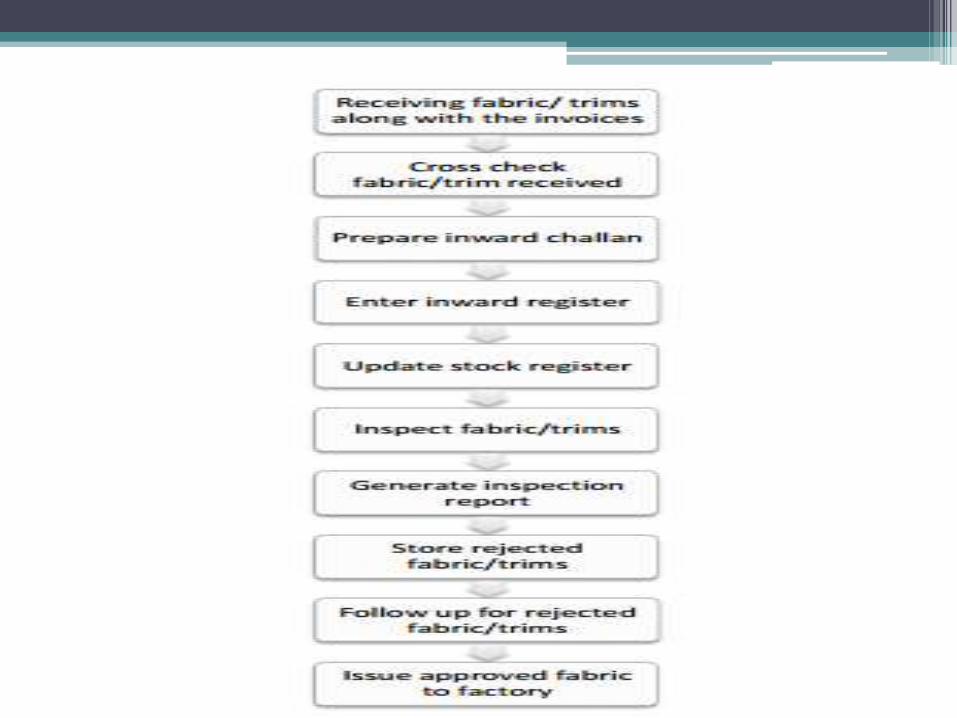
FABRIC AND TRIMS STORE
Texport Syndicate, Bangalore has a centralisedfabric and trims store in TS-IV Unit which receives fabric and trims from the suppliers and issues them to the other unit wherever they are required. This store has been divided into two parts i.e.
• Fabric Store
• Trims and accessories store
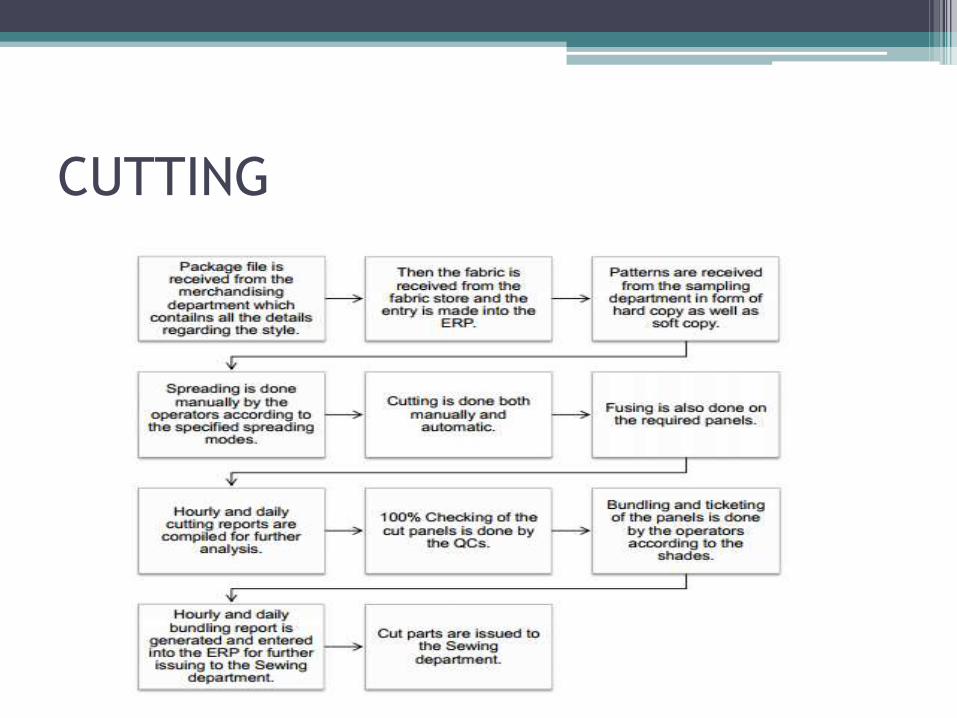
CUTTING

MAINTENANCE
• Maintenance Department receives tech-pack from the Merchandising department.
• They thoroughly go through the construction of garment i.e. Seams and stitches
• Based on the analysis, they prepare a list of machines
• They check the availability of machine, folders, guides and profile. If certain machines and folders are not available, they inform about it to the purchase department and get the purchase order ready and place the order for the machine to the vendor.
• The machines and folders should be in house at least 2 days before the batch setting.
• They impart training to the workers regarding the new machines and folders.
• They work with Industrial Engineering Department and production department in batch setting.

• For quality, they create template, profile and guide on demand of Quality Assurance Department.
• After the production starts, they keep their eye on proper functioning of the machines. During the production if some problem occurs, they repair the machine to avoid the disturbance in production.
• To keep the machine trouble free, they go for preventing maintenance by cleaning and oiling of the machine.

SEWING• PP meeting for production planning • Machine layout Implementation on floor • Batch Setting • Individual machine mocks (SPI, Pressure Foot, Feed Dog, and Needle Size) • Quality procedure to be followed by batch checkers and end line checkers. • Quality procedures to be followed by batch QCs. and floor QCs. • Hourly production targets for each operation • Maintaining hourly production defect analysis and corrective report • Supervision of lines by supervisors to get target production with Quality • Batch efficiency for the day • Deployment of operators in case of absenteeism • Incentive paid to operators • Maintaining Batch DHU Report • Issue garments to the finishing and washing section

WASHING AND FINISHING
• Garments are checked as per quality mentioned in DC
• Garments are stored in washing racks.
• “Buyer approved wash standard” is received from merchandiser.
• First bulk wash of 250 pieces is done.
• Rectification of fault and updating of recipe are done on the basis of first wash.
• Bulk wash ranges are sent to the buyer along with the comments on wash.
• Comments and approval regarding shade ranges and hand feel comes from buyer.
• Bulk washing is done in washing machine.
• Hydro-extracting is done to squeeze water from the garments.
• Garments are fed into Tumble Dry machine to dry the garments.
• Garments are sent to Garment Inspection Room for inspection as per 2.5 AQL.
• Grinding (If mentioned by the buyer) is done hourly. Checking of grinding is done.
• Garments are sent to the finishing department for packaging and dispatching.


TIME STUDY SHEETS
• Sheet 1
• Sheet 2
• Sheet 3
• Sheet 4

A Throughput Process Flow(TPF)
bulletin using VSM
- Enhance Productivity
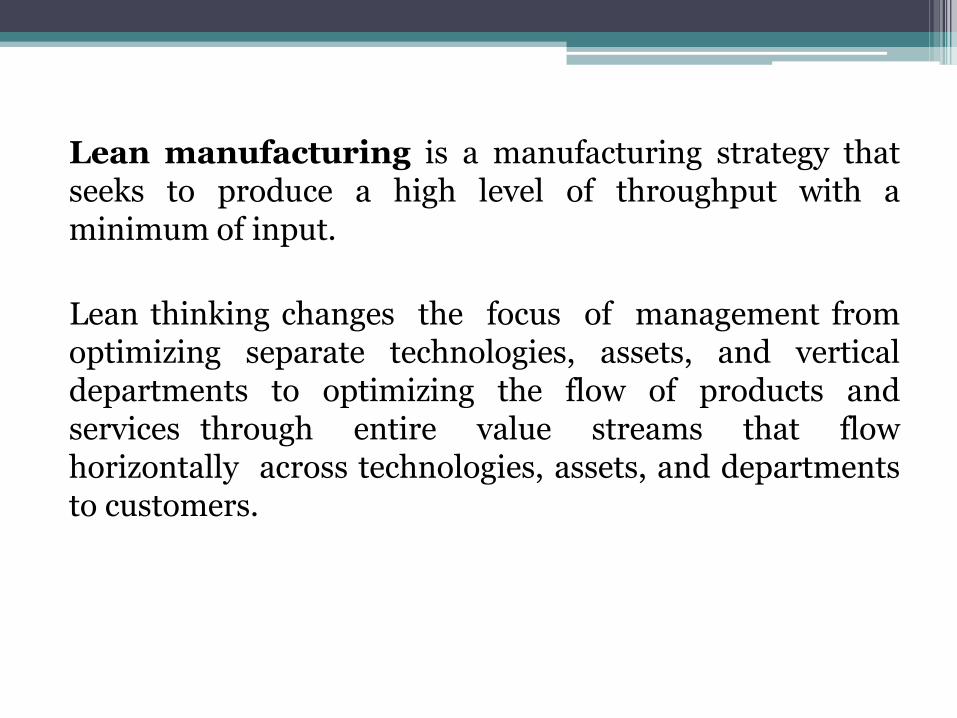
Lean manufacturing is a manufacturing strategy thatseeks to produce a high level of throughput with aminimum of input.
Lean thinking changes the focus of management fromoptimizing separate technologies, assets, and verticaldepartments to optimizing the flow of products andservices through entire value streams that flowhorizontally across technologies, assets, and departmentsto customers.

LEAN TOOLS• 5S
• Andon
• Bottleneck Analysis
• Continuous Flow
• Gemba
• Heijunka
• Hoshin Kanri
• Jidoka
• JIT
• Kaizen
• Kanban
• KPI
• MUDA
• OEE
• PDCA
• Poka-Yoke
• Root Cause Analysis
• SMED
• Six Big Losses
• Smart Goals
• Standarized Work
• TAKT Time
• TPM
• VSM
• Visual Factory

The Goal
To propose a TPF Bulletin for TS4, by using the Value Stream Mapping method to optimize total production cost and identify areas of improvements.

The Approach
Pick and choose a few styles that are representative of most of the production at TS4, using Pareto Analysis
Study the process, from Fabric Stores to Pack & Dispatch as it happens

• Calculate what the throughput will be , using the new set of activities to maximize value addition.
Identify value added and non-value added activities, understand why things are done in a certain way, and suggest alternatives
Time and Motion Study, to understand and evaluate the current methods
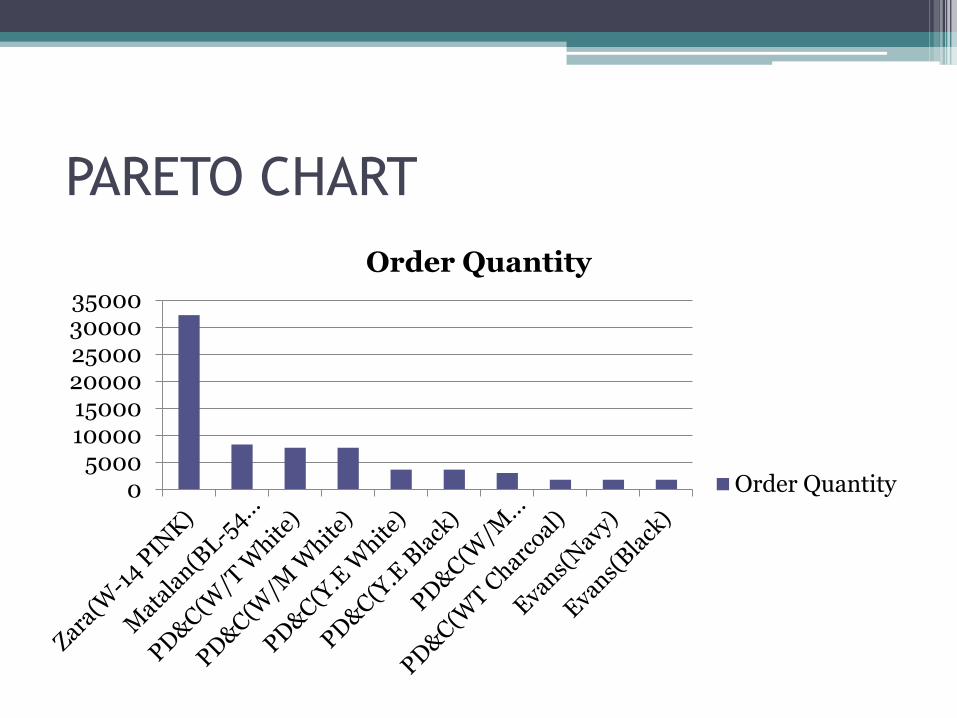
PARETO CHART
05000
100001500020000250003000035000
Order Quantity
Order Quantity

The Plan
Review the existing throughput for a chosen styleOperation flow, and information flow—identify what are the true constraints
Analysis of all operational sections: Stores, Fabric-Inspection, Cutting, Sewing, Washing, Finishing, Packing and Dispatch
Assign value to each of the observed activities, critically analyze the necessity of these activities—the value they add, and the
accompanying costs
Optimize the activities—Simplify, Eliminate, Combine, Redesign / Mechanize--Reduce costs while ensuring efficient usage of
resources

The Subject
Style chosen: Zara w14s23c
Product : Kids wear—Boys plaid shirt with a single welt pocket
Plaid Twill, 20 components (w/ pocket bag
Two, differently-sized buttons on each cuff6 sizes in all
Planned Target: 32,254
Start Date: June 29th,2014Delivery Date: July 25th, 2014
Shipped Quantity : 31,300

Why ?
Throughput metrics exist for Sewing !
But..Cutting ?Washing?Finishing?
To understand the differences in sectional (or sub sectional) capacities, and work towards balancing this throughout the entire production value chain.

Value Stream Mapping
– Special type of flow chart that uses symbols known as "the language of Lean" to depict and improve the flow of inventory and information.
– Value stream mapping & analysis is a tool that allows you to see waste, and plan to eliminate it.

What Is Value?
• A capability provided to a customer
– of the highest quality,
– at the right time,
– at an appropriate price, as defined by the customer.
• "Value" is what the customer is buying or what changes the property of the product

Value Stream Analysis


Current State Future State
PUSH SYSYEM PULL SYSTEMINVENTORY IN THE
FORM OF WIPSUPERMARKETS

Throughput Time
– Throughput time is the amount of time required for a product to pass through a manufacturing process, thereby being converted from raw materials into finished goods.

Processing time
( 3 Hours)
Inspection time
(0.5 Hours)
Move time( 1 Hour)
Queue time(12 Hours)
THROUGHPUT TIME= 16.5 HOURS

PACKAGE TO SHIPMENT
O SHIPMENT
MERCHANDISE
OPERATIONS
ORDER CONFIRMATION TO RECEIVING PACKAGE

The Study
• The processes in each section were analysed with the help of videos.
• The data was compiled in the form of a detailed process flow with chart symbols representing the flow.
• It also includes the time per activity, the distance travelled and the manpower involved.
• Each activity was classified into VA and NVA and therefore, waste elimination methods were suggested, pertaining to their nature.

Data Available
Fabric Stores
Cutting
Sewing
Washing
Finishing

What is Takt Time?

Value Stream Mapping
VSM map as is
Percentage of VA to Total time spent
2.9%
Takt Time


CUTTING MODULE
• The production floor has 8 cutting lines on each floor i.e.16 lines in total.
• If each floor is divided into 7 teams and given one tableeach then the total number of workers employed wouldbe 140 excluding the workers involved in fusing.
• The production per day is around 1000/line.• Taking 14 working lines, the production will be around
14000.• Comparing to current scenario, the production will
increase with this kind of modular system.• Currently, each floor produces a quantity of 6400, which
gives us a total of 12,800 from both the floors.

Suggestions • After Fabric inspection, the fabric may be rolled onto rods, with just the required
tension such that this makes it easier for the spreading team to work with.
• During spreading, the person feeding the fabric onto the table might be replaced with either just a rod, or the roll of loosely rolled fabric. This performs the same function and can result in a 33% decrease in manpower requirements of the spreading team.
• Having accurate patterns, in multiple sets (due to spreading happening on many tables at once) will really help cut down on the wait time (close to 30 mins for each marking cycle) for marking.
• Combination trays may be employed, with a certain placement protocol (for eg, fabric face down always) and each component in its designated space on the tray. This can eliminate the need for numbering altogether.
• Instead of component fusing , entire panels may be fused and then cut with the band knife. This can decrease the manpower required in the fusing team by about 56%.
• Trimming, which is an operation that adds no value to the garment, may be eliminated, by using under bed trimmers, and trimming at source on the sewing line.

Conclusions
The TPF Bulletin highlights the fact that it takes 5.1 days for the first finished garment (fabric to pack).
The percentage of VA was only 2.9%. This leaves us with a huge scope of improvement based on the suggestions.
Evidently, there were certain challenges that this style faced.
The Lean production period provided the buffer space in the packing section for this, which would have been a major issue had it been otherwise.

Flexible layout

ABOUT THE PROJECT
• TS 4 is a unit of Texport Syndicate produces multiproduct styles with varying # of workstations. Theorder quantity also varies from 1000 to 3 lakh.
• This demands flexible layout in order to ensure ontime responses and optimum use of resources.
• This study/project is undertaken to understand thepast patterns of order quantity and relatedproduction to arrive at various layout scenarios onwhich layout models can be evolved.

ABOUT THE PROJECT
• Creating a flexible layout on the sewing andfinishing floor which caters to the production ofmultiple products based on different SAM valuesand related workstations.
• To optimize/maximize the capacity based onspace availability.

Analysis of Operation Breakdown Sheets forall the styles produced in the last six month
WORKSHEET 1 (Comparison Worksheet):
Obtained name of the buyer, style, description, no. ofworkstations, SAM, no. of critical operations & no. ofmachines used for the critical operations, for all the 43styles.
WORKSHEET 2 (Product Wise Segregation):
All the styles were segregated as per their product type.

To determine Complexity of the Styles
Based on the style description given in theOperation
Breakdown Sheets:WORKSHEET 3 (Attribute Wise Segregation):Various Attributes/Elements of all the styles were defined.WORKSHEET 4 (Elemental Details):Elements/Components of the styles were defined in amore detailed way, to figure out the common/majority ofelements among all the styles respective of their producttypes.WORKSHEET 5 (Process Breakdown):Operations for all the styles were put together, todetermine the no. of common operations (Helpers,Ironers & Checkers).

WORKSHEET 6 (Divisional Analysis):
The no. of styles falling in an interval of no. of workstationsand critical operations for a particular range of SAM wasdetermined.
WORKSHEET 7 (Frequency of styles [Graph]):
The average number of workstations and critical operations
falling under a particular range of SAM was determined.

WORKSHEET 8 (PARETO Analysis [Graph]):
PARETO Graphs for different sets of parameters were
generated.
WORKSHEET 9 (Segregation of ironers, checkers andhelpers):
The operations/processes done by the Helpers, Ironers and
Checkers for main product types were determined.

TAKT Time Calculator:
Determines the no. of lines required to produce the order
quantity in given no. of days (as per shipment details).
WORKSHEET 0 (Basic):
The TAKT Time was calculated and wash/non-washproperty was determined, for all the styles.

RESULT
WORKSHEET 10 (Proposed Layout Scenarios for
Sewing Section):
Various Scenarios for the layout of Sewing Section were
developed, depending on the no. of Workstations and
balancing the Critical Operations.


Sewing Section Layout - Before
• 8 lines with 80 no. of workstations per line.

Sewing Section Layout - After
• As 40 is the lowest no. ofworkstations with the highestorder quantity, all the 8 linesare divided into halvesproviding a gangway in themiddle.

• The study and analysis has given an insight on how to work on the flexibility and present the various scenarios of workstations to layout configuration. The snapshot of the finding and model is:
1. Assumption -
Sewing area has a 80 workstation space -side to side configuration
Based on the layout multiple sorting (feeding) stations and output stations needs to be provided which are on wheels or easily movable like the sewing machines
There is a direct correlation between SAM and # of workstations and can be arrived at based on the formula/equation (Equation 1).
2. Layouts have to be made for ten workstation configurations from minimum 20 to maximum 110 in steps of 10.

3. The top five configurations are based on cumulative quantity of >100000:
4. 4 different layout scenarios have been worked out based on the workstation and critical operations. This can be the base model for implementation at the Gemba.
# of workstations Frequency Cumulative Order Qty
31-40 8 394585
61-70 9 332274
51-60 4 251182
71-80 6 238586
41-50 6 116210

BIBLIOGRAPH
• http://en.wikipedia.org/wiki/Flexible_manufacturing_system
• http://www.theseus.fi/bitstream/handle/10024/34405/Paneru_Naresh.pdf
• http://www.engr.uconn.edu/msl/paper/tomastik/ApparelScheduling96.pdf
• http://deepblue.lib.umich.edu/bitstream/handle/2027.42/5690/ban1329.0001.001.pdf?sequence=5
• http://www.nwlean.net/takt_v_cycle.HTM
• http://www.leanproduction.com/top-25-lean-tools.html

THANK YOU