a visual interface for emotion based music navigation
TRANSCRIPT

Copyright © 2016 Japan Society of Kansei Engineering. All Rights Reserved.205J-STAGE Advance Published Date: 2016.06.24
International Journal of Affective Engineering Vol.15 No.2 (Special Issue) pp.205-211 (2016)doi: 10.5057/ijae.IJAE-D-15-00039
1. INTRODUCTION
Currently we are experiencing a major shift in the music
industry away from physical media formats and towards
online services. The increasing popularity gained by
mobile and ubiquitous computing has made this shift
further promising. Today’s smart phones are bringing the
users a greater experience through the developments
including built in Wi-Fi, enabling 4G and high quality
music/video players, leading to an increased usage of
smart phones. Intelligent/ambient environments are also
among the new and emerging trends. As a result of the
above progressions, the fan base of digital music libraries
is rapidly growing. Similarly, with the advent of new
technologies in the field of music production, the rising
opportunities for the younger generation to release new
musical products and the enormous capabilities the digital
libraries have provided them in socializing their products,
the digital music collections are expanding day by day.
This has created an increasing demand for new algorithms
in personalized music recommendation as well as for
novel approaches that can assist the listeners in easier
navigation.
Pandora1 and Last.fm2 are among the best examples
of commercial applications for music discovery and
recommendation which have come to the fore in today’s
digital music industry. Based on the acoustics of music
and the huge amount of metadata including the data
generated through social tagging, these applications
have proceeded a long way providing their listeners
with various music services.
Among the various attempts made in developing music
recommendation systems, majority of the applications
tries to ‘make accurate predictions about what a user
could listen to, or buy next, independently of how useful to
the user could be the provided recommendations. Quite
often these algorithms tend to recommend popular or
well known to the user-music decreasing the effectiveness
of the recommendations’ [1]. In organizing the music
libraries, most of these applications are heavily focusing
on the genre, artist or the album. Beyond such widely
adopted arrangements, the study focuses on organizing a
music library based on emotion, considering the enormous
psychological benefits that can be gained through music.
On the other hand, it will help discover the creative
musical content having a huge potential in emotional
arousal which are still hidden in the long tail of the
popularity distribution. Music directors as well as the
amateur musicians who are looking for creating emotional
musical content are among the other beneficiaries. Due to
the above reasons the Music Information Retrieval (MIR)
research community is now paying attention in mining
music data in the emotional aspect including perceived
emotion and felt emotion.
Received: 2015.06.01 / Accepted: 2016.05.25
Special Issue on ISASE 2015
ORIGINAL ARTICLE
A Visual Interface for Emotion based Music Navigation using Subjective and Objective Measures of Emotion Perception
Sugeeswari LEKAMGE, Ashu MARASINGHE, Pradeep KALANSOORIYA and Shusaku NOMURA
Nagaoka University of Technology, 1603-1, Kamitomioka-machi, Nagaoka, Niigata 940-2188, Japan
Abstract: Beyond the conventional playlists organized based on genre, artist, or album, the study attempts to visualize a music library on a 2D plane enabling the users for emotion based navigation. A dataset constructed for this research purpose, comprising of music stimuli which associate Sri Lankan folk melodies has been utilized in the study. Using the method miremotion defined in MATLAB MIRToolbox, the objective predictions for the discrete emotions/emotion dimensions have been obtained. Subjective emotion ratings were collected through a listening experiment. By running a Principal Component Analysis on the data matrix combining subjective and objective measures, music library is mapped on to a 2D plane while identifying the correlations among each measures. Several directions have been identified for extending the research whereas the cultural specificity in emotional expression in music and the subjectivity in emotion perception have made the emotion based music recommendation a challenging task.
Keywords: Music navigation, Emotion perception, Visual interfaces
1 https://www.pandora.com/about/mgp2 http://www.last.fm/

206
International Journal of Affective Engineering Vol.15 No.2 (Special Issue)
2. BACKGROUND AND MOTIVATION
The study focuses on emotion perception which can
be regarded as ‘all instances where a listener perceives
or recognizes expressed emotions in music (e.g., a sad
expression), without necessarily feeling an emotion’ [2].
In this respect Sri Lankan folk melodies have been utilized
in the study considering their great potential in emotional
expression. The above melodies which either associate
with a profession, or correspond to an important aspect
of life are a rich source for exploring the emotional
expressivity in music since they have emerged as a means
of expressing the true and innate feelings of the community.
Even though these melodies are successfully utilized
in today’s Sri Lankan applied music, exploring their
potential in emotional expression, based on a computa-
tional analysis still remains unattended. Therefore, it is
believed that the study will also serve as a promising
initiating step in addressing the above research gap while
contributing to the conservation and promotion of the
above melodies.
Emotional expression in music is carried out through
different ensembles of musical features including pitch,
intensity, timbre, orchestration, rhythm, melody and
harmony. In identifying the correlations between music
and emotion, the acoustic features pertaining to above
musical features need to be thoroughly analyzed whereas
Eerola et al. [3] using a multiple linear regression, have
obtained the best five acoustic factors contributing to each
of the emotion classes (happiness, sadness, tenderness,
anger, and fear) and emotion dimensions (activity, valence,
and tension). Further, the method miremotion has been
defined in MATLAB MIRToolbox enabling to obtain the
predicted scores for the above emotion classes/dimensions.
Aligning with the developers’ objective to test the applica-
bility of miremotion which is trained using English film
soundtracks, on alternative datasets3, the study utilizes
miremotion for Sri Lankan folk music stimuli. Even
though the universality versus cultural specificity in music
is an area that requires to be addressed specifically, the
study provides the basic ground required in proceeding in
that direction.
In order to identify the correlations between the
objective predictions by miremotion and the subjective
descriptions of emotion perception, a listening experiment
was conducted in the study. How a listener will perceive
a particular music is viewed to be dependent on his or her
Kansei which is defined by Nagamachi as ‘an outcome
through cognition and the five senses: sight, hearing,
taste, smell, and touch’ [4]. Cognition which is concerned
with memory, judgment, interpretation and thinking
is regarded as the sixth sense [4]. Kansei is also viewed as
‘an inner sense organ that unconsciously and instantly
operates information processes such as receiving,
assimilating, and outputting information that cannot be
recognized by the normal operation of the five senses’ [5].
With regard to the emotion perception in music,
one’s knowledge in music, his emotional intelligence
and contextual understanding are some of the factors
that affect the cognition function whereas individual
differences need to be carefully handled in personalizing
music libraries based on emotion.
‘Basic emotion theory posits that all emotions can be
derived from a limited set of universal and innate basic
emotions, which typically include fear, anger, disgust,
sadness and happiness (Ekman, 1992; Panksepp, 1998)’
[6]. ‘Instead of an independent neural system for every
basic emotion, the two-dimensional circumplex model
(Russell, 1980; Posner, Russell, & Peterson, 2005)
proposes that all affective states arise from two indepen-
dent neurophysiological systems: one related to valence
(a pleasure-displeasure continuum) and the other to
arousal (activation-deactivation). In contrast, Thayer
(1989) suggested that the two underlying dimensions of
affect were two separate arousal dimensions: energetic
arousal and tense arousal’ [7]. Even though the above
mentioned general emotion models are used in music-
emotion research, it is still unclear ‘whether a few
primary basic emotions – or the two dimensions of
valence and arousal – are adequate to describe the
richness of emotional experiences induced by music
(Zentner, Grandjean, & Scherer, 2008)’ [8]. The nine-
factor Geneva Emotion Music Scale4 (GEMS) can be
regarded as one of the key instruments addressing
the above issue which has been specifically devised
to measure musically evoked emotions. It consists of
wonder, transcendence, tenderness, nostalgia, peaceful-
ness, power, joyful activation, tension, and sadness.
45 labels (GEMS-45) which can be grouped into the
above nine categories are also introduced describing
musically evoked emotive states across a relatively wide
range of music and listener samples.
3 http://jp.mathworks.com/matlabcentral/fileexchange/24583-mirtoolbox/content/MIRtoolbox1.3.4_matlabcentral/MIRToolbox/@miremotion/miremotion.m
4 http://www.zentnerlab.com/psychological-tests/geneva-emotional-music-scales

A Visual Interface for Emotion based Music Navigation using Subjective and Objective Measures of Emotion Perception
207
International Journal of Affective Engineering Vol.15 No.2 (Special Issue)
Existing literature provides evidence for many research
which explore the emotional aspect of music. In [9],
emotional responses to North Indian classical music
have been tested, further taking into consideration their
consistency across listeners with different demographics.
Through running a multiple regression analysis, they
have also developed linear models to predict the emotion
in music. In [10] a content based music search system
has been developed which accepts a point query in the
emotion (Valence-Arousal) space, introducing Acoustic
Emotion Gaussian model for automatic music emotion
annotation and emotion based music retrieval. Addressing
the semantic gap in existing recommendation systems, [11]
has focused on improving the recommendation perfor-
mance by introducing ontologies for mood and situation
reasoning.
While most of these efforts are concentrated around
Western/Indian classical music or Western popular music,
our study focuses on Sri Lankan folk melodies, initiating
to computationally analyze this abundant source of
emotional expression. As opposed to developing own
models for predicting emotions in Sri Lankan folk
melodies, the authors test the generalizability of linear
models developed by Eerola et al. [3] which has used a
similar method as in [9], further enabling to get important
insights on the universality of emotional expression in
music. Incorporating efforts as discussed in [11] are
undoubtedly important in achieving a higher recommen-
dation performance whereas our study at its initial stage
mainly focuses on providing the users with an enhanced
music navigation experience.
Beyond the conventional list view of music libraries
which is widely adopted by existing applications, the
authors attempt to organize and visualize the music library
on a 2D plane allowing the users to click and play the
music that are organized based on emotion.
3. OBJECTIVES OF THE STUDY
The main objective of the study is to develop a visual
interface for emotion based music navigation.
The sub objectives are;
• To identify two emotion dimensions that can better
represent emotions related to music
•To test the applicability of miremotion in identifying the
emotions expressed in Sri Lankan folk music
•To identify the correlations between objective predic-
tions and subjective descriptions of emotion perception
in music
4. MUSIC DATA MINING
4.1 Construction of the Sri Lankan folk music database for emotion research
A data set comprising of 76 music stimuli purposely
composed in expressing the emotions Happy, Sad, and
Fear was utilized in the research. Music stimuli were
of vocal and instrumental content whereas lyrics were
intentionally avoided considering the possible biases.
Each music stimulus was of 30s duration on average.
They were all 44100Hz; Stereo; 32-bit; in .wav PCM
format and amplitudes were normalized to -1db.
The emotions Happy, Sad, and Fear were considered
initially, taking into account their easily distinguishable
nature whereas the dataset is to be expanded in the future
introducing music stimuli representative of other
emotions.
4.2 Feature extraction using miremotion788 acoustic features pertaining to dynamics, fluctuation,
rhythm, spectral, timbre and tonal were extracted using
the MATLAB MIRToolbox. In order to utilize a more
refined set of the above acoustic features which are
directly contributing in emotion expression in music, the
method miremotion was used. Predicted scores for the
three emotion dimensions; activity, valence, tension and
the five emotion classes; happy, sad, tender, anger, and
fear were obtained using the above method.
4.3 Listening experiment30 music stimuli were selected for the listening
experiment including the top 10 stimuli suggested by
miremotion for each of the emotions Happy, Sad, and Fear.
15 subjects (Graduate students from non-music disciplines,
Sri Lankan, age: 30-35 years) were asked to rate the above
music stimuli for the same emotion classes defined in
miremotion using a 7-point Semantic Differential (SD)
scale. Value 1 would correspond to a very low value, and
value 7 to a very high value. A 7-point SD scale was used
since miremotion is based on listener’s emotional ratings
that were collected exactly the same way [3].
4.4 Data analysis using PCAA PCA (PCA I) was conducted to identify the effective-
ness of an unrevised set of general acoustic features in
visualizing the music stimuli based on their acoustic
similarity. 788 acoustic features of the 76 music stimuli
were used as the data matrix. In order to identify the
potential of miremotion in visualizing the music stimuli
on a two-dimensional map, a second PCA (PCA II) was

208
International Journal of Affective Engineering Vol.15 No.2 (Special Issue)
conducted on the data matrix containing the 8 predicted
scores by miremotion for the same 76 music stimuli.
For the top 30 music stimuli suggested by miremotion,
PCA III and IV were conducted respectively on the data
matrix containing the 8 predicted scores by miremotion,
and the data matrix containing the human ratings collected
through the listening experiment. Finally, PCA V was
conducted on the data matrix which combines the above
objective predictions and the subjective descriptions.
4.5 Results and discussionThe two Principal Components (PCs) derived from the
788 general acoustic features accounted only for a smaller
percentage (17.01%) of the variance. In providing the
users with a meaningful visualization, this cannot be
regarded as a satisfactory level even though it can be seen
that the music clips are clustered into three as a result of
the PCA as shown in Figure 1.
The data set contains many redundant and irrelevant
features which heavily reduce the computational efficiency
as well as the interpretability of the model. Since it is
required to identify the features which are important in
prediction as well as how they are related with each other,
it is important to select a sub set from the above 788
acoustic features. Instead of developing own models
by refining the above feature set, the study has tried to
test the generalizability of miremotion which has been
introduced as an outcome of excessive research. Being
opposed to many of the studies which propose new
algorithms for independently selected datasets which are
most of the time a repetition of effort, the study tries to
test the applicability of an already developed model on a
new and alternative data set. The PCA result shows that
the percentage of variance accounted for by the two PCs
has increased up to 74.69%, forming three distinguishable
clusters as shown in Figure 2.
Figure 3 shows the PCA result for the data matrix
containing predicted scores by miremotion for the top
30 music stimuli. This provides a 2D representation
which accounts for 80.80% of the initial variance of the
dataset that can be considered as an acceptable level in
visualizing the music library.
The two PCs derived from the PCA for the data matrix
containing the mean ratings by human listeners accounted
for an extremely high percentage of variance (94.72%)
which surpasses the capability of miremotion. (Figure 4)
Figure 1: Observations of PCA I (axes D1 and D2: 17.01%) after Varimax rotation
(Colours assigned to each music stimulus denote the emotion targeted to be conveyed by each stimulus whereas the targeted emotion of each stimulus was decided upon the agreement of a panel of professional musicologists)
Figure 2: Biplot of PCA II (axes D1 and D2: 74.69%) after Varimax rotation
Figure 3: Biplot of PCA III (axes D1 and D2: 80.80%) after Varimax rotation
Figure 4: Biplot of PCA IV (axes D1 and D2: 94.72%) after Varimax rotation
A Visual Interface for Emotion based Music Navigation using Subjective and Objective Measures of Emotion Perception
209
International Journal of Affective Engineering Vol.15 No.2 (Special Issue)
But some clips can be seen overlapped with each other
due to the similarities in the mean ratings given by the
subjects.
Even though the result of the PCA performed on
the combined data matrix (Figure 5) accounted for a
lower percentage (76.29%) of variance compared to the
two individual cases, it allows the users to easily navigate
through the entire music library. Further this result
incorporates the features that can be captured using
audio analysis which cannot be captured through human
perception and vice versa.
According to the correlation matrix, the objective
rating (hereinafter referred to as ‘o’) for Happy and the
subjective rating (hereinafter referred to as ‘s’) for Happy
are having a considerably high correlation (r = 0.723).
Happy (o) is also highly correlated (r = 0.943) with
Valence (o). The correlation between Sad (o) and Sad(s)
is only 0.410. Tender (o) and Tender(s) are having a
correlation of 0.632. Tender (o) is negatively correlated
with Tension (o) (r = -0.725), Anger (o) (r = -0.827),
Fear (o) (r = -0.745), Anger(s) (r = -0.764) and Fear(s)
(r = -0.719). Anger (o) is positively correlated with Fear
(o) (r = 0.642), Anger(s) (r = 0.589) and Fear(s) (r = 0.576).
Fear (o) and Fear(s) have a correlation of 0.712. Fear (o)
is also highly negatively correlated with Valence (o) and
Happy (o) with a correlation coefficient of -0.889 and -0.817 respectively.
PCA V yielded 13 PCs. The Eigen values of the first
five PCs are given in Table 1. The first component (with
Eigenvalue 6.94) accounted for 53.41% of the variance
whereas the second component (with Eigenvalue 2.97)
accounted for 22.88%.
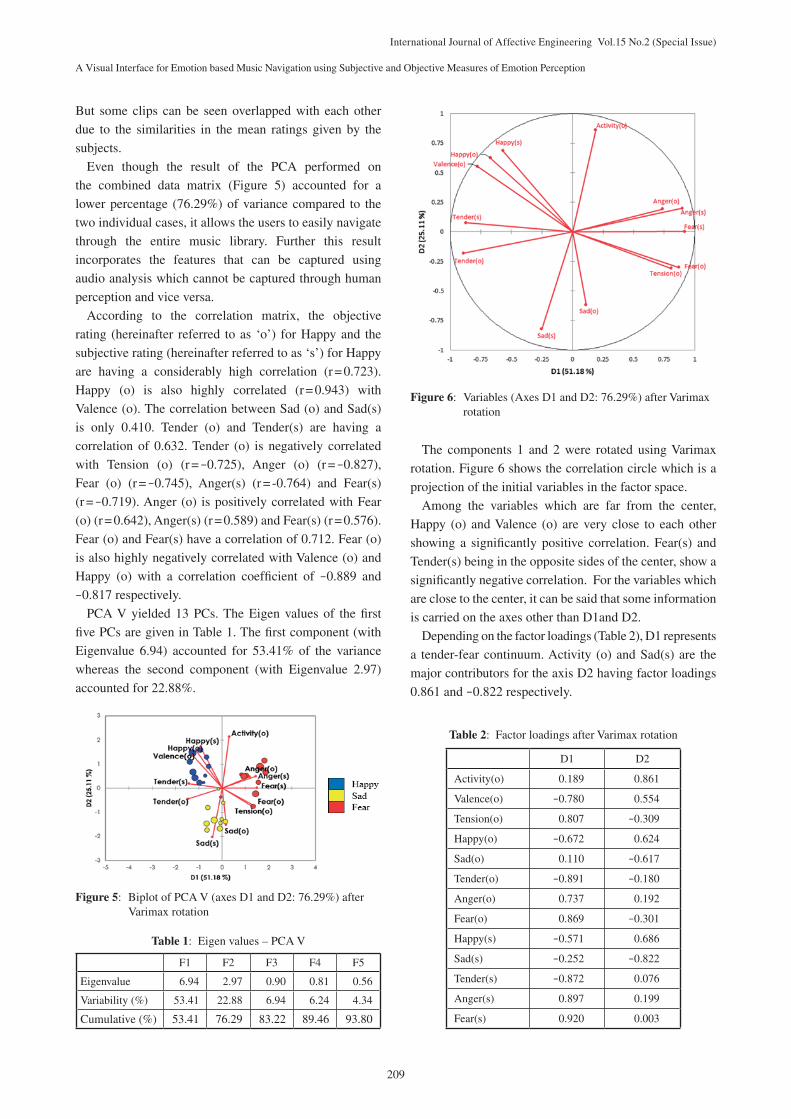
The components 1 and 2 were rotated using Varimax
rotation. Figure 6 shows the correlation circle which is a
projection of the initial variables in the factor space.
Among the variables which are far from the center,
Happy (o) and Valence (o) are very close to each other
showing a significantly positive correlation. Fear(s) and
Tender(s) being in the opposite sides of the center, show a
significantly negative correlation. For the variables which
are close to the center, it can be said that some information
is carried on the axes other than D1and D2.
Depending on the factor loadings (Table 2), D1 represents
a tender-fear continuum. Activity (o) and Sad(s) are the
major contributors for the axis D2 having factor loadings
0.861 and -0.822 respectively.
Figure 5: Biplot of PCA V (axes D1 and D2: 76.29%) after Varimax rotation
Table 1: Eigen values – PCA V
F1 F2 F3 F4 F5
Eigenvalue 6.94 2.97 0.90 0.81 0.56
Variability (%) 53.41 22.88 6.94 6.24 4.34
Cumulative (%) 53.41 76.29 83.22 89.46 93.80
Figure 6: Variables (Axes D1 and D2: 76.29%) after Varimax rotation
Table 2: Factor loadings after Varimax rotation
D1 D2
Activity(o) 0.189 0.861
Valence(o) -0.780 0.554
Tension(o) 0.807 -0.309
Happy(o) -0.672 0.624
Sad(o) 0.110 -0.617
Tender(o) -0.891 -0.180
Anger(o) 0.737 0.192
Fear(o) 0.869 -0.301
Happy(s) -0.571 0.686
Sad(s) -0.252 -0.822
Tender(s) -0.872 0.076
Anger(s) 0.897 0.199
Fear(s) 0.920 0.003

210
International Journal of Affective Engineering Vol.15 No.2 (Special Issue)
5. VISUAL INTERFACE FOR EMOTION BASED MUSIC NAVIGATION
An interface was developed which allows the listeners
to click and play the music by easily navigating through
the music library which is organized on a 2D plane.
The coordinates of each observation (music stimulus)
correspond to the factor scores obtained from PCA V.
The horizontal axis represents a tender-fear continuum
whereas the positive side of the vertical axis corresponds
to activity and the negative side to sadness.
6. CONCLUSION
Incorporating the objective predictions obtained using
miremotion with the subjective ratings of emotion
perception, the study has visualized the music library on
a 2D plane. miremotion which is trained in a different
context has been applied for the Sri Lankan folk music
database. The emotions Happy and Fear expressed in
Sri Lankan folk music were successfully recognized by
miremotion whereas it has been capable in producing a
meaningful visualization of the music library based on
emotions. The results reveal that while there are rules
pertaining to music and emotion which are unique for
each context or origin, rules do exist in music that are
shared universally. The study has taken into account
only few basic emotions which can be regarded as easily
distinguishable, whereas in the full emotion spectrum a
number of emotions lie in between the above discrete
categories. In deriving a promising set of two uncorrelated
PCs, the scale needs to be expanded introducing more
emotion categories representing the full emotion spectrum.
In-depth analysis of music specific emotion models as well
as the emotion models discussed in Sri Lankan traditional
arts is believed to constructively contribute in this regard.
REFERENCES1. O. C. Herrada; Music Recommendation and Discovery
in the Long Tail, PhD. Thesis, Pompeu Fabra University,
Spain, 2008.
2. P. N. Juslin and D. Vastfjall; Emotional Responses
to Music: The Need to Consider Underlying
Mechanisms, Behavioral and Brain Sciences, 31(5),
pp.559-621, 2008.
3. T. Eerola, O. Lartillot, and P. Toiviaine; Prediction of
Multidimensional Emotional Ratings in Music from
Audio using Multivariate Regression Models, In;
Proc. 10th International Society for Music Information
Retrieval Conference, Kobe, Japan, pp.621-626, 2009.
4. M. Nagamachi; Kansei/Affective Engineering, CRC
Press, Florida, p.3, 2011.
5. Y. Shiki; Collective Views of the Workings and
Significance of Experiences in the “Zone” from the
Standpoint of Kansei, AAAI Technical Report;
SS-12-05, Self-Tracking and Collective Intelligence
for Personal Wellness, pp.48-53, 2012.
6. P. N. Juslin and J. Sloboda; Handbook of Music and
Emotion: Theory, Research, Applications, OUP,
Oxford, 2011.
7. T. Eerola and J. K. Vuoskoski; A Comparison of the
Discrete and Dimensional Models of Emotion in
Music, Psychology of Music, 39(1), pp.18-49, 2011.
8. J. K. Vuoskoski and T. Eerola; Measuring Music-
induced Emotion: A Comparison of Emotion Models,
Personality Biases, and Intensity of Experiences,
Musicae Scientiae, 15(2), pp.159-173, 2011.
9. P. Chordia and A. Rae; Understanding Emotion in
Raag: An Empirical Study of Listener Responses,
Computer Music Modeling and Retrieval, Sense of
Sounds, Springer-Verlag Berlin, Heidelberg, pp.110-
124, 2008.
10. J.-C. Wang, Y.-H. Yang, H.-M. Wang, and S.-K. Jeng;
The Acoustic Emotion Gaussians Model for Emotion-
based Music Annotation and Retrieval, In; Proc. 20th
ACM International Conference on Multimedia, Nara,
Japan, pp.89-98, 2012.
11. S. Song, M. Kim, S. Rho, and E. Hwang; Music
Ontology for Mood and Situation Reasoning to
Support Music Retrieval and Recommendation. In;
Proc. Third International Conference on Digital Society,
Cancun, Mexico, pp.304-309, 2009.
Figure 7: Interface for emotion based music navigation

A Visual Interface for Emotion based Music Navigation using Subjective and Objective Measures of Emotion Perception
211
International Journal of Affective Engineering Vol.15 No.2 (Special Issue)
Sugeeswari LEKAMGE (Non-member)Sugeeswari Lekamge is a Doctoral student in the
Department of Information and Management
Systems Engineering, Nagaoka University of
Technology, Japan. She obtained her B.Sc. Degree
in Computation and Management from University
of Peradeniya, Sri Lanka and Master of Engineering
in Management and Information Systems Engineering from Nagaoka
University of Technology, Japan in 2010 and 2014 respectively.
Her research interests include Kansei Engineering, Music Data Mining,
Ambient Biomedical Engineering, and Biological Information
Processing.
Ashu MARASINGHE (Non-member)Ashu Marasinghe is an Associate Professor in the
Department of Information and Management
Systems Engineering, Nagaoka University of
Technology, Japan. He obtained his B.Sc. Degree
in Physics and Mathematics from University of
Colombo, Sri Lanka, M.Sc. in Computer Science
and Engineering from University of Aizu, Japan and Ph.D. in Computer
Science and Engineering from University of Aizu, Japan in 1997, 2001,
and 2004 respectively. His research interests are: Kansei Engineering,
Social Informatics, Public Health Informatics, Internet Governance, and
Artificial Life.
Pradeep KALANSOORIYA (Non-member)Pradeep Kalansooriya is a Doctoral student in
Information Science and Control Engineering in
the Department of Information and Management
Systems Engineering, Nagaoka University of
Technology, Japan. He obtained his B.Sc. Degree
in Computer Science, Physics, and Chemistry from
University of Peradeniya, Sri Lanka, and Master in Information
Technology from University of Colombo, Sri Lanka in 2008 and 2012
respectively. His research interests are Biomedical Engineering, Virtual
Environments, Hologram Technology, Pepper’s Ghost Technology,
Technology enhanced Learning, Computer and Society, Kansei Engineer-
ing, Bio-informatics, Remote Sensing and Database Management.
Shusaku NOMURA (Member)Shusaku Nomura is an Associate Professor at
Nagaoka University of Technology, Japan. He was
an Assistant Professor at Shimane University, Japan
in 2003 to 2008. He was a Research Associate at
RIKEN, Japan and Muroran Institute of Technology,
Japan in 2000 to 2003. He received his Bachelor’s
Degree in Physics from the Faculty of Science, Kobe University,
Master of Science in Non-linear Science and Ph.D. in Science from the
Graduate School of Science and Technology, Kobe University in 1996,
1998, and 2001 respectively. His research interests include Ambient
Biomedical Engineering, Biological Information Processing, Psycho-
physiology and Kansei physiology.