a wind-tunnel investigation of jet-wake effect of a high-bypass … · 2013-08-31 · a wind-tunnel...
TRANSCRIPT

N A S A
z c
TECHNICAL NOTE NASA e. /
TN 7 D-4693 -
LOAN COPY: RETURN TO
KIRTLANO AFB, N MEX AFWL (WW-2)
A WIND-TUNNEL INVESTIGATION OF JET-WAKE EFFECT OF A HIGH-BYPASS ENGINE O N WING-NACELLE INTERFERENCE DRAG OF A SUBSONIC TRANSPORT
i
-
by Jumes C. Putterson, Jr.
LdngZey Reseurch Center Lungley Stution, Humpton, Vu.
-
N A T I O N A L AERONAUTICS A N D SPACE A D M I N I S T R A T I O N W A S H I N G T O N , D. C. AUGUST 1968
&l
https://ntrs.nasa.gov/search.jsp?R=19680021123 2020-04-24T08:54:32+00:00Z

TECH LIBRARY KAFB, NM
lllllllllllllllll Hlllll~llll~lllllllllllll
A WIND-TUNNEL INVESTIGATION O F JET-WAKE E F F E C T OF
A HIGH-BYPASS ENGINE ON WING-NACELLE I N T E R F E R E N C E
DRAG OF A SUBSONIC TRANSPORT
By James C. P a t t e r s o n , Jr.
Langley R e s e a r c h C e n t e r
Langley Stat ion, Hampton, Va.
N A T I O N A L AERONAUTICS AND SPACE ADMINISTRATION
For sale by the Clearinghouse for Federal Scientific and Technical Information Springfield, Virginia 22151 - CFSTI price $3.00
A WIND-TUNNEL INVESTIGATION O F JET-WAKE EFFECT O F
A HIGH-BYPASS ENGINE ON WING-NACELLE INTERFERENCE
DRAG O F A SUBSONIC TRANSPORT
By James C. Patterson, Jr. Langley Research Center
SUMMARY
An experimental wind-tunnel investigation has been conducted recently by the National Aeronautics and Space Administration to determine the aerodynamic interfer- ence associated with underwing fan-jet engine-pylon installations including the effect of a jet wake from a powered high-bypass fan-jet engine. Tests were made on a semispan model of a typical transport airplane configuration. These tests were conducted over a Mach number range of 0.70 to 0.84, at angles of attack from 0' t o 4O, and over a Reynolds number range of 6.67 X lo6 to 7.38 X 10⁶ based on the mean geometric chord of 58.30 centimeters.
The data indicate that the interference drag for the type of underwing engine-pylon installation investigated may be favorable as a result of a reduction in induced drag asso- ciated with an inboard end-plate effect of the nacelle-pylon. The addition of engine power has a strong influence on aerodynamic interference. The longitudinal and vertical posi- tion of the engine relative to the wing also has a pronounced effect on interference drag. The greatest favorable interference was obtained during this investigation with the engine in the most forward longitudinal and lowest vertical test position. An increase in Mach number above the design speed has an adverse influence on the aerodynamic interference.
INTRODUCTION
The relatively large size of the high-bypass fan-jet engines to be used on the next generation of subsonic transport aircraft has raised the question as to whether such engines will result in severe adverse wing-nacelle interference. Exploratory tests made with flow-through nacelles, which simulated the engine geometric effect but not the fan- jet wake effects, have indicated no special wing-nacelle interference problems associated with the use of such engines. However, the jet wake may have strong influence on the interference phenomena.
To provide a preliminary indication of the jet-wake effect on wing-nacelle inter- ference for high-bypass engines, an exploratory wind-tunnel investigation of the problem

has been performed in the Langley 8-foot transonic pressure tunnel. In this investiga- tion, the jet wake has been simulated ,by a model jet engine capable of producing the same relative mass flow and pressure ratios as a representative full-scale high-bypass engine. The investigation was made on a semispan model of a representative transport airplane configuration with the model engine located at various longitudinal and vertical positions relative to the wing at one spanwise wing station. These tes t s were performed at Mach numbers ranging from 0.70 to 0.84 and over an angle-of-attack range of 00 to 40.
A
CD
ACD
‘F,n
CL
CP
ACP
C
- C
Cf
Dr
DS
Fg ,f
Fg,P
Fn
2 .
SYMBOLS
cross-sectional area, meters2
drag coefficient, Drag/qS
interference-drag coefficient
net-thrust coefficient, Fn/qS
lift coefficient, Lift/qS
PL -PIX pressure coefficient, q
differential pressure coefficient
chord at wing-pylon juncture, 60.07 centimeters
mean geometric chord, 58.30 centimeters
local skin -f r ict ion coefficient
ram drag, newtons
scrubbing drag, newtons
fan gross thrust, measured at fan exit, newtons
primary gross thrust, measured at turbine exit, newtons
net thrust, newtons

i W
Km ,i
M
lil
P
pt
q
R
r
S
T
V
X
wing angle oi incidence, degrees
inlet mass-flow correction
free-stream Mach number
mass -flow rate, kilogr ams/second
static pressure, newtons/meterl
total pressure, newtons/metera
free -stream dynamic pressure, newtons/meter2
gas constant Rair = 0.287 joule/OK-mole; Rnitrogen = 0.298 joule/OK-mole)
radius, centimeters
wing reference a rea , 0.776 meter’
(
temperature, degrees Kelvin
velocjty, meters/second
longitudinal wing ordinate measured in axial direction (positive downstream), centimeters
spanwise station, centimeters
angle of attack, degrees
specific-heat ratio yair = 1.4; Ynitrogen = 1.41)
circumferential position, measured clockwise from vertical, degrees
(
density, kilograms/meter3

Subscripts:
av average
e exit
i inlet
z local
P primary
S static
t total
wet wetted area
co free s t ream
APPARATUS AND EXPERIMENTAL METHODS
Test Facility
The investigation was conducted in the Langley 8-foot transonic pressure tunnel, which is capable of continuous operation through the subsonic, transonic, and low super- sonic speed ranges. The test section of the wind tunnel has a slotted floor and ceiling with solid side walls as shown in figure 1. The slots reduce the wall interference; this reduction allows tes t s of relatively large models at the subsonic speeds. (See ref. 1.) The model used in the present investigation has a wing semispan equal to 65 percent of the tunnel width and a frontal area equal to 3.4 percent of the tunnel test-section area.
Model Configuration
A drawing of the semispan model used during this investigation is shown in figure 2. A photograph of the model installed in the wind tunnel is shown in figure 3. The choice of a semispan configuration for this investigation has allowed the use of a much larger scale model than normally tested in the Langley 8-foot transonic pressure tunnel at subsonic speeds. Using the semispan model results in a larger , more practical model-engine size and a more satisfactory feed of the engine-drive fluid. Furthermore, since only one-half

the number of model engines are required, the problems associated with engine installa- tion, engine control, and instrumentation are reduced.
Wing.- The wing, shown in figure 2, has a quarter-chord sweep of 35O, a taper ratio of 0.45, and an aspect ratio of 5. This wing, having a semispan of 139.47 centimeters, simulates the inboard portion of a higher aspect-ratio wing which had a semispan of 190.88 centimeters. It is believed that the removal of the outboard portion of the wing t o allow the test to be performed in this test facility did not significantly affect the wing- nacelle interference phenomena since the nacelle was in a relatively inboard location in the present investigation. The chord line of the wing root was inclined at an incidence angle of 4.5O with a linear variation of twist distribution from the root t o the 76.38-centimeter span station where the angle of incidence is approximately 2.5O. The twist varies linearly f rom this point to the 190.88-centimeter span station of the extended wing where the tip incidence is -1.75O. The model wing was constructed of aluminum by using the airfoil coordinates presented in table I(a).
Fuselage.- The fuselage has an elliptical nose, a cylindrical midsection, and a boat- tail afterbody. Coordin.ates of the fuselage are given in table I(b). The nose and after- body of the fuselage were constructed of wood and the midsection was constructed of sheet aluminum.
Engine-pylon.- A cross-sectional view of the power fan-jet engine used in this investigation is shown in figure 4. The two-stage model fan is connected directly t o a three-stage turbine which is driven by compressed gas. The model engine simulates the output of an actual engine with a bypass ratio of 8 and a fan-exit total-pressure ratio of 1.47 at the model-engine design maximum rotational speed of approximately 44 000 rpm.
Tests were conducted with the engine located in each of the five longitudinal and vertical positions shown in figure 5. Coordinates for the typical pylon are given in table I(c). The pylons were built in three sections: a removable aluminum leading-edge fairing, a steel core, and a removable aluminum trailing-edge fairing.
The powered model fan-jet engine, installed on an elongated pylon designed specially for obtaining engine-alone data, is shown in figure 6.
Driving-Gas System
The temperature of the model-engine driving fluid is reduced through expansion in the turbine to approximately 1720 K. This fluid, therefore, must be virtually free of moisture t o prevent formation of ice in the turbine and pr imary exit. A source of clean, very dry, high-pressure air was not available; therefore, nitrogen, a convenient, economi- cal substitute for dry air, was used. Liquid nitrogen was gasified and piped through the wing and pylon to the engine. The gaseous nitrogen was preheated to approximately
5
293O K before entering the model to reduce any thermal stress in the balance which might result f rom the close proximity of the nitrogen path to the balance.
The introduction of nitrogen into the wind-tunnel flow is considered to have little or no effect on the s t ream characteristics because of the similarity in the physical charac- terist ics of nitrogen and air. The nitrogen control system consisted of an electrically operated dome regulator used as an engine speed control, a quick shutoff valve down- s t ream of the regulator, and a pop-off valve installed as a final safety precaution to pre- vent the engine from exceeding its design rotational speed.
Instrumentation
Force balance.- Measurements of forces and moments were obtained from an internally mounted, wall-supported, five-component, electrical strain-gage balance. The model was designed so that the wing attached to the balance, but not to the fuselage, and protruded through a clearance opening in the fuselage. The fuselage, even though grounded to the tunnel wall, was attached to the balance wall-support system which allowed the fuselage to t raverse through the angle-of-attack range.
Since par t of the fuselage was submerged in the tunnel boundary layer, fuselage force measurements would be of no value. The effect of the fuselage flow field on the wing, pylon, and engine-nacelle forces, however, was present. Since the fuselage is cylindri- cal in the longitudinal region of these components, the effect these components would have on the forces of the fuselage should be relatively small.
Surface pressure measurements. - Wing chordwise pressure measurements were made on the upper surface near the wing-pylon juncture and on the lower surface approxi- mately 4 centimeters to either side of the pylon. Longitudinal rows of pressure orifices on the surface of the engine were located at the 30°, 90°, 180°, 270°, and 330° circumfer- ential positions on the fan cowl; at the 30°, 60°, 90°, 180°, 270°, 300°, and 330' circumfer- ential positions on the turbine cowl; and at the 90' and 270' circumferential positions on the turbine plug. Longitudinal locations of the pressure orifices a re presented in table 11.
Engine internal pressure measurements.- Stagnation and static pressures in the fan inlet and exit and at the turbine inlet and exit were measured for use in computing engine thrust. The fan-inlet stagnation pressure was measured by two total-pressure rakes con- sisting of six pressure probes each. Both rakes were located just forward of the first- stage fan rotor - one rake at the 2 2 O circumferential position and the other at the 1800 position. (See fig. 4.) The space between rake probes was decreased in the vicinity of the fan-inlet wall to measure any change in the boundary layer resulting from the various flow conditions. The height of the rakes from the inlet wall to the fan hub was limited by
6

I rake vibration resulting from the close proximity of the rake to the first-stage fan blades. The individual rake-probe pressure measurements were area weighted before being used in the thrust computations.
Two static-pressure orifices were employed at the 14O and 188O positions in the plane of the fan-inlet rakes to measure the static pressure in the vicinity of the total- pressure rakes. An 80 spacing between the static-pressure orifice and the total-pressure rake was used to reduce interference in the static pressure resulting from the presence of the rake.
The fan-exit instrumentation consisted of seven total-pressure rakes located cir- cumferentially approximately every 51°. Each total-pressure rake had five probes spaced radially in such a manner that each probe was centered in one of the five concentric c i r - cular equal-area segments into which the exit area had been divided. These a reas were then equally divided circumferentially among the seven rakes to provide an equal weighing factor for each probe. The total-pressure rake at the Oo position also supported six thermocouple probes. One thermocouple was located between each pressure probe and between the pressure probes at the extreme ends of the rake and the engine surface.
the fan exit at the 300, 60°, 90°, 180°, 270°, 300°, and 330' positions. Seven static-pressure orifices were located on the turbine cowl surface just inside
The flow condition at the turbine exit was measured by two total-pressure rakes located at the 60° and 300' positions and with two static-pressure orifices located on the turbine-plug surface just inside the turbine exit at the 90° and 270° positions.
All wing-pressure measurements, as well as the engine internal- and external- pressure measurements, were made by six pressure-scanning valves mounted inside the fuselage. Each valve was capable of measuring 47 pressures by an internal strain-gage transducer plus a reference pressure.
Calibration of model engine.- Because of the inadequacy of the flow-survey instru- mentation used in the fan inlet and exit, a fan-flow calibration was required. The ASME flow nozzle shown in figure 7 was used for this calibration. The actual engine mass flow could be determined from the static-pressure measurements in the constant-area portion of the ASME flow nozzle, the ambient stagnation pressure and temperature, and the nozzle flow coefficient of 0.995. This measured mass-flow value was then divided by the mass flow calculated from the measurements made in the fan inlet. The resulting flow coeffi- cient was used to correct the inlet mass-flow measurements made during the investigation.
Test Conditions
Investigations were made of the complete wing-fuselage-pylon-engine configuration, of the wing-fuselage-pylon configuration, of the wing-fuselage configuration, and of the
7

engine-alone configuration. The engine -alone configuration was mounted on the elongated pylon which was attached directly to the wall-mounted force balance. Data for this con- figuration were obtained at an angle of attack of Oo only.
The tunnel total pressure was reduced to 0.87 atmosphere (88.2 kN/m2) throughout the entire investigation because of the operating limits of the model engine and the nitrogen-supply valving system. The tunnel stagnation temperature was reduced from the tunnel normal operating temperature of 322O K to 311' K to match as closely as pos- sible the temperature of the incoming nitrogen. A further reduction in tunnel tempera- ture resulted in unacceptable icing conditions on the rear portion of the turbine cowl and turbine plug. The tunnel dewpoint temperature of approximately 250° K was maintained throughout the investigation in an attempt to reduce engine icing as much as possible.
Tests were conducted at Mach numbers of 0.70, 0.78, 0.81, and 0.84 and over an angle-of-attack range of 00 to 4O (engine-alone configuration tested only at (Y = Oo) , which resulted in a range of lift coefficient above and below that required for cruise flight for this type of airplane. The Reynolds number range based on the wing mean geometric chord C of 58.30 centimeters was from 6.67 X lo6 to 7.38 X lo6.
The engine was operated at fan-exit total-pressure ratios of 1.00 and 1.47. The fan-exit total-pressure ratio of 1.00 was obtained with the engine operating just fast enough (approximately 23 000 rpm) to overcome the internal losses of the engine, and zero fan thrust was produced. A fan-exit total-pressure ratia of 1.47 was obtained with the engine operating at the maximum design speed (44 000 rpm), and maximum thrust was produced.
For all tes ts , boundary-layer transition s t r ips , 0.32 centimeter wide and consisting of No. 120 carborundum grains, were installed on the upper and low wing surfaces and on the pylons at the 10-percent-local-chord location. Transition s t r ips were also fixed on the fan cowl at a streamwise location 1.27 centimeters from the inlet leading edge both on the inside and outside of the inlet.
INTERFERENCEDRAG
To obtain the value of only the interference drag resulting from t..e effect of the pylon-engine combination in the presence of the wing including the effect of the power engine wake, the total drag measured by the force balance is reduced by the computed thrust and by the drag of the three individual components of the model: wing, engine, and pylon. This procedure is shown by the following equation:
8

where
(‘~1 complete = (‘D)ba1 + CF,n model
total measured wing-pylon-engine drag coefficient, based on reference wing area of 0.776 metera, obtained from wall- mounted strain-gage force balance
(CD)bal
F,n engine net-thrust coefficient computed as shown in appendix
wing drag coefficient, obtained from wall-mounted strain-gage force bal- ance during tes t s made with engine and pylon removed
(CD)wing
measured drag coefficient obtained from engine alone mounted on elongated pylon, at Oo angle of attack only
(‘D) bal
‘F,n engine -alone net-thrust coefficient computed as shown in appendix
drag coefficient of elongated pylon alone (CD)PYlon
skin-friction drag coefficient of pylon used with wing-engine-fuselage combinat ion
VALIDITY O F RESULTS
The absolute force measurements made during this investigation a re of little value for the following reasons: The fuselage of the test model w a s not attached t o the balance, only the inner portion of the original wing was used, and there was a gap drag associated with the wing protruding through the clearance opening in the fuselage. Furthermore, because of the limitations of the instrumentation, the computed thrust values are not con- sidered reliable as absolute values. Therefore, most of the absolute results of the inves- tigation a re not presented herein. The drag results for the basic wing-alone configuration are presented in figure 8 to indicate the compressibility drag r ise characteristics of this test configuration.
9

The analysis presented is based on the differential values of the data obtained as described in the preceding section entitled "Interference Drag." The validity of these increments is considerably greater than that of the absolute results. Any systematic inaccuracies in drag measured by force balance tend to cancel when the drag of the com- plete configuration is reduced by the measured drag of the wing-alone configuration. Also, the systematic e r r o r s in computing thrust tend to cancel since the thrust of the complete configuration is added to the total balance-drag value whereas the thrust for the engine-alone configuration is subtracted. However, even these incremental results are subject to the following qualifications:
The data for the engine-alone configuration were obtained through the Mach number range of 0.70 to 0.84 at an angle of attack of Oo only. These data when applied to the inter- ference drag computation at angles of attack other than Oo introduce a slight e r ror . Unpublished data obtained for a similar engine-alone configuration indicate that this e r r o r is negligible through the cruise angle-of-attack range up to approximately 2 O and increased appreciably with a further increase in angle of attack. The interference-drag results pre- sented herein for an angle of attack of 4O a r e therefore questionable but are conservative inasmuch as the e r r o r involved tends to make the interference drag ACD slightly more positive.
0 An additional e r r o r is introduced by the upward inclination of the thrust vector at
angles of attack greater than Oo. Such an inclination increases the lift and reduces the thrust measured by the balance. An analysis of the effect of such changes suggests that at angles of attack near that for cruise, this upward inclination results in a decrease of approximately 0.0001 in the interference-drag coefficients presented herein. At the high- est test angle of attack of 4O, an increase of approximately 0.0002 in the interference-drag coefficients occurs.
The results presented a re also subject to random e r r o r s that possibly exist in the force-balance measurements and computed thrust.
In spite of the foregoing qualifications, however, the results presented a r e consid- ered sufficiently reliable to be indicative of the general interference phenomenon that exists for the engine-pylon-wing combination. This conclusion is supported by the fact that unpublished results of a similar investigation with more refined instrumentation indicate trends similar to those presented herein.
RESULTS AND DISCUSSION
Cruise Condition
Pylon end-plate effect.- . . The interference-drag coefficient (ACD) resulting from changing the engine positions is presented in figure 9 as a function of Mach number at
10

the cruise lift coefficient of 0.4. Favorable aerodynamic interference (-ACD) is obtained for each engine position investigated at and below the cruise Mach number of 0.78. An increase in favorable interference occurs in this Mach number range as a result of the addition of power for all configurations except the pylon 1 configuration. The greatest favorable interference is obtained with pylon 4 where the engine is in its most forward and vertically lowest position, approximating the engine location used in the design of the latest cargo aircraft.
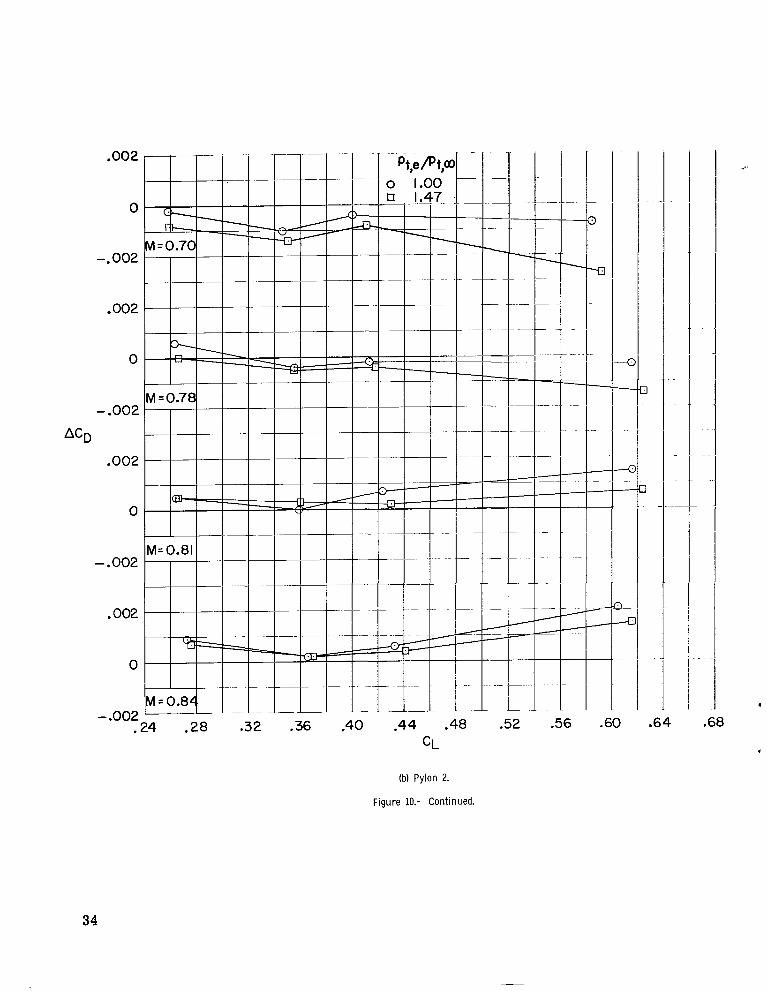
The variation of the aerodynamic-drag coefficient with lift coefficient at each tes t Mach number for the five pylon configurations is presented in figure 10. The interference-drag data obtained for pylon 4 (see fig. 10(d)) show that at M = 0.78 there is no favorable interference obtained at the lowest test l i f t coefficient but there is an increase in favorable interference associated with an increase in lift coefficients for the maximum thrust case, the maximum favorable interference occurring at the highest test lift coefficient shown. This variation suggests that the measured favorable interference might result from a reduction of induced drag caused by an end-plate effect of the pylon and nacelle. Such a reduction of induced drag by an underwing inboard end-plate effect has been predicted theoretically (ref. 2).
To provide th is reduction in induced drag, the pylon-nacelle combination must reduce the outward, spanwise flow under the wing. Associated with such &n effect, there must be an outward side force on the pylon-nacelle combination. Pressure distributions similar to those presented in figure 11 a re used to obtain the differential pressure coef- ficients shown plotted in figure 12 against longitudinal distance from the wing leading edge for M = 0.78. The differences in the pressures measured on the engine just outboard and inboard of the pylon a r e indicative of the force that exists on the pylon near the engine. The differential pressures presented in figure 13, obtained from wing lower-surface pres- sures measured on either side of the pylon (see fig. l l ) , also indicate the probable pylon forces in this region. Both figures 12 and 13 show an increase in outward side force on the pylon with an increase in angle of attack. This force results from an inclination of the pylon-nacelle with respect to local flow under the wing.
This pylon-nacelle outward side force, when resolved with respect to the local flow, has a forward inclination relative to the flight path rather than the usual rearward or drag direction. This action is the primary factor resulting in the favorable-interference-drag decrement measured by the force balance.
Power effect.- The effect of power can be seen from the differential pressure coef- ficients at the engine-pylon juncture by comparing the results obtained for a fan-exit total- pressure ratio of 1.00 with that obtained for a fan-exit total-pressure ratio of 1.47 at the cruise Mach number. (See fig. 12.) Considerably greater side force is produced by the pylon at the maximum-thrust conditions than with the engine operating at a pressure ratio
11

of 1.00. The pylon section force coefficient, obtained by an integration of pressures of figure 12 indicates that this force, in the side-force direction, is approximately doubled as a result of the addition of power. A possible explanation for this effect of power on pylon lift is that with the engine operating at the zero-thrust condition there is a tendency for the higher pressure on the inboard side of the pylon to propagate upstream through the subsonic fan flow and around the internal leading edge of the pylon. This pressure leakage raises the lower pressure associated with the high-velocity flow on the outboard surface of the pylon. This reduction of pylon differential pressure results in a reduced favorable aerodynamic interference. When the engine is producing maximum thrust, the fan exit is choked and this pressure leakage can no longer occur; hence, more effective end-plate action can be derived from the engine.
From the differential pressure coefficients obtained at the wing-pylon juncture (fig. 13), it may be seen that there is essentially no effect of power in the region of the wing-pylon juncture. This fact would indicate that any improvement resulting from the addition of power will be realized only locally.
Off -Design Conditions
Effect of engine position.- Although there is a decrease in the interference associ- ated with an increase in lift coefficient for almost all engine positions investigated (see fig. lo) , there is a shift in the level of the variation of aerodynamic interference with lift for the various engine positions. For example, a marked increase in the level of inter- ference is associated with the rearward and the vertically upward movement of the engine from the most favorable design position (pylon 4) to the least favorable position investi- gated (pylon 3). This increase is the result of a loss in pylon side force associated with the engine position change. A possible reason for the lift reduction is suggested by the variation in the pressure coefficients on the inboard surface of these two pylons at the wing-pylon juncture and at the engine-pylon juncture. These data (see fig. 14) indicate an increase in velocity on the inboard side of the pylon under the forward part of the wing associated with the change in engine position. This change probably results from an increase in the aerodynamic blockage between the engine, the pylon, the wing, and the fuselage associated with the upward and rearward movement of the engine -pylon configuration.
Effect of Mach number.- The adverse effect on aerodynamic interference resulting from an increase in Mach number above the cruise Mach number of 0.78, previously shown in figures 9 and 10, is possibly caused by shock formations and associated separation resulting from higher local Mach number; however, such changes a re not indicated by the pressure distribution on the engine o r on the wing near the pylon. Even the pressure dis- tribution for the most suspect region inboard of the pylon (see fig. 15) indicates no such problem.
12

CONCLUSIONS
The results of the present experimental investigation to determine the effect of engine installation on the aerodynamic interference of a semispan model of a transport airplane configuration, including the effect of the fan-jet wake, indicate the following con- clusions :
1. The interference drag, that is, the difference between the drag for the complete configuration and the sum of the drags of the components, may be favorable for an under- wing engine-pylon installation on the type of aircraft simulated during this investigation at the design cruise lift coefficient and Mach number.
'
2. Pressure measurements obtained from the engine and wing surfaces in the vicin- ity of the pylon suggest that the favorable interference obtained during this investigation may be due to a reduction in induced drag associated with an inboard end-plate effect of the pylon and nacelle.
3. The addition of engine power has a strong influence on the aerodynamic inter- ference. w a s double that for the power-off case.
For the design engine position, the favorable interference for maximum power
4. The longitudinal and vertical position of the engine has a pronounced effect on interference drag. gation with the engine in the most forward longitudinal and lowest vertical test position.
The greatest favorable interference w a s obtained during this investi-
5. An increase in Mach number above the design cruise speed has an adverse influ- ence on the aerodynamic interference.
Langley Research Center, National Aeronautics and Space Administration,
Langley Station, Hampton, Va., February 29, 1968, 126-13-01-32-23.
13

APPENDIX
COMPUTATIONS
Forces
The forces, measured by the force balance, have been reduced to lift and drag coef- ficients by using the semispan wing area of 0.776 meter2.
Thrust
The net thrust of the model engine has been defined as the momentum change through the fan, the additional momentum of the nitrogen exhausted from the primary exit, less the scrubbing drag resulting from the fan- and primary-exit flows:
Fan gross thrust.- The fan gross thrust has been computed as the product of the fan mass flow and the average fan-exit velocity, plus the fan-exit pressure force:
In computing the fan gross thrust , the mass flow determined at the fan inlet has been used rather than the mass flow measured at the exit because of the smaller variation in mass- flow correction K,,i with the various test conditions. It is probable that this procedure gives more reliable results. The mass flow is computed in the following manner:
The density is computed from the thermal equation of state as follows:
The average inlet static pressure was obtained from the fan-inlet measurements. The local static temperature was determined from the measured s t ream total temperature and the average inlet Mach number as follows:
14

APPENDIX
I The inlet Mach number was computed in the conventional manner from the weighted aver- age inlet total-pressure and static-pressure measurements.
The average fan-inlet velocity is computed as follows:
The required fan-exit velocity is determined in a similar manner to that used for the inlet velocity based on the total-pressure and static-pressure measurements made at the fan exit; that is,
The exit Mach number is computed from the average total-pressure measurements made at the fan exit and the average exit static pressures measured on the turbine cowl, located just inside of the fan exit. The average exit static pressure was adjusted by a calibration constant established from a fan-exit static-pressure survey made during an initial engine calibration to give a mean static pressure across the fan exit. The fan-exit static tem- perature is computed from the average total temperature measured in the fan exit by using the preceding static-temperature equation (eq. (A5)).
The exit velocity determined by these calculations must be corrected by a factor similar to that needed for mass flow. Just as for the exit mass-flow factor, this correc- tion varies with test conditions; thus, it cannot be determined from a static calibration. An analysis of the factors influencing this correction indicates that possible e r r o r s in the static pressures have little effect on the exit velocity and that the greatest effect is due to the incompleteness of the'total-pressure measurements, in particular to the lack of total- pressure measurements in the boundary layer at the exit. With the assumption that the e r r o r s are due primarily to exit total-pressure measurements, then the e r r o r s in the exit velocity are similar to the e r r o r s in mass flow, and the correction factor to be applied to the velocity is equal to the ratio of mass flow in the inlet to the apparent mass flow at the exit. Although such a correction is undoubtedly not exact, it has been used here in an attempt to obtain a first-order correction of the fan-exit velocity. The exit mass flow used in the ratio was determined in the same manner as the inlet mass flow based on exit measurements.
Ram drag.- The r am drag is the initial momentum of the air entering the fan inlet and is the product of the mass flow determined from inlet measurements and the stream velocity:
Dr = hiV,

'I
APPENDIX \ y
Primary thrust.- The pr imary gross thrust is obtained in a s imilar manner to that used to determine fan gross thrust:
No measurements of the turbine inlet mass flow were made; therefore, the measured turbine-exit mass flow was used in computing the primary thrust. Consequently, a cor- rection must be applied to the primary thrust to account for the inadequacy in the deter- mination of the exit mass flow and velocity. A constant correction of 0.953, which is a mean of the correction values applied to the fan thrust, is applied to the primary-thrust calculation. The primary-exit static pressure was also adjusted to give a mean pressure, as in the case of the fan, by a constant obtained from the initial engine calibration.
Scrubbing drag.- The thrust computations of the present test are reduced by the scrubbing drag. This skin-friction drag is obtained from the following equation:
The scrubbing drag is computed from equation (A10) by using the dynamic pressure and Reynolds number based on average local conditions on the fan cowl, fan-exit conditions on the turbine cowl, and primary-exit conditions on the turbine plug. The friction coefficient was obtained from the Sommer and Short T' method (ref. 3).
Thrust coefficient.- The thrust is reduced to coefficient form by using the stream dynamic pressure and the wing reference a rea in the following manner:
Fn 'F,n = gS
The thrust coefficient for the complete airplane configuration and that for the engine-alone configuration are used in the determination of the interference drag.
16

REFERENCES
1. Wright, Ray H.; Ritchie, Virgil S.; and Pearson, Albin 0.: Characteristics of the Langley &Foot Transonic Tunnel With Slotted Test Section. NACA Rep. 1389, 1958. (Supersedes NACA RM L51H10 by Wright and Ritchie and RM L51K14 by Ritchie and Pearson.)
2. Mangler, W. (G. de Montalvo, trans.): Lift Distribution on Wings With Lateral Plates. DAC Rep. No. 33497, Douglas Aircraft Div., Dec. 2, 1966.
E
3. Sommer, Simon C.; and Short, Barbara J.: Boundary-Layer Skin Friction in the Presence of Severe Aerodynamic Heating at Mach Numbers From 2.8 to 7.0. NACA TN 3391, 1955.
Free-Flight Measurements of Turbulent-
17

TABLE I.- WING, FUSELAGE, AND PYLON COORDINATES
(a) Wing airfoil ordinates
bations and ordinates in percent wing mean geometric chord
Station F 0 .1 .1 .3 .7 1.0 1.6 3.3 6.6 9.9 13.2 16.4 19.7 23.0 26.3 32.9 39.5 52.6 65.8 76.3 79.0 92.1 105.3 118.4 131.6
0 0 .1 .2 .5 .7 1.2 2.3 4.6 6.9 9.2 11.4 13.7 16.0 18.3 22.9 27.5 36.6 45.8 53.1 55.0 64.1 73.3 82.4 91.6
8.1 9.8 13.0 16.3 18.9 19.6 22.9 26.1 29.4 32.1
Ordinate ~ I
1 Upper surface
wing root; iw = 4.5'
y = 76.38 cm; i, = 2.5'
4.0 4.3 4.4 4.7 5.0 5.2 5.6 6.4 7.4 8.1 8.5 8.8 9.0 9.2 9.3 9.3 9.2 8.9 8.2 7.4 7.2 5.7 3.9 2.0 0
y = 190.88 cm; i, = -1.75'
-1.0 -.9 - .8 -.7 -.6 -.5 -.4 -.l .3 .6 .8 1.0 1.1 1.2 1.3 1.5 1.6 1.7 1.7 1.6 1.6 1.3 .9
0*4
Lower surface
10.3 9.9 9.8 9.5 9.2 9.0 8.6 7.7 6.4 5.3 4.3 3.4 2.6 1.8 1.2 0 -.9 -2.1 -2.1 -2.7 -2.7 -2.3 -1.6 -.8 0
-.7 -.7 -.6 -.4 -.2 0
-1.0 -1.1 -1.1 -1.2 -1.3 -1.3 -1.4 -1.5 -1.6 -1.7 -1.7 -1.8 -1.8 -1.8 -1.8 -1.8 -1.7 -1.5 -1.3 -1.0 -1.0 -.7 -.5 -.3 0
18

TABLE 1.- WING, FUSELAGE, AND PYLON COORDINATES - Continued
(b) Fuselage coordinates
[Stations and ordinates in percent fuselage lengtq
Station
0 .4 .8 1.2 1.6 2 .o 2.4 2.8 3.2 6.3 7.9 9.5 11.1 12.7 14.3 65.9 68.3 70.2 72.2 74.2 76.2 78.2 80.2 82.1 84.2 88.1 100.0 1
Ordinate
0 1.4 2.0 2.4 2.8 3.1 3.4 3.6 3.9 5.1 5.5 5.8 6.0 6.1 6.2 6.2 6.1 6.1 6.0 5.8 5.6 5.3 5.0 4.7 4.3 3.4 .5
111 I
19
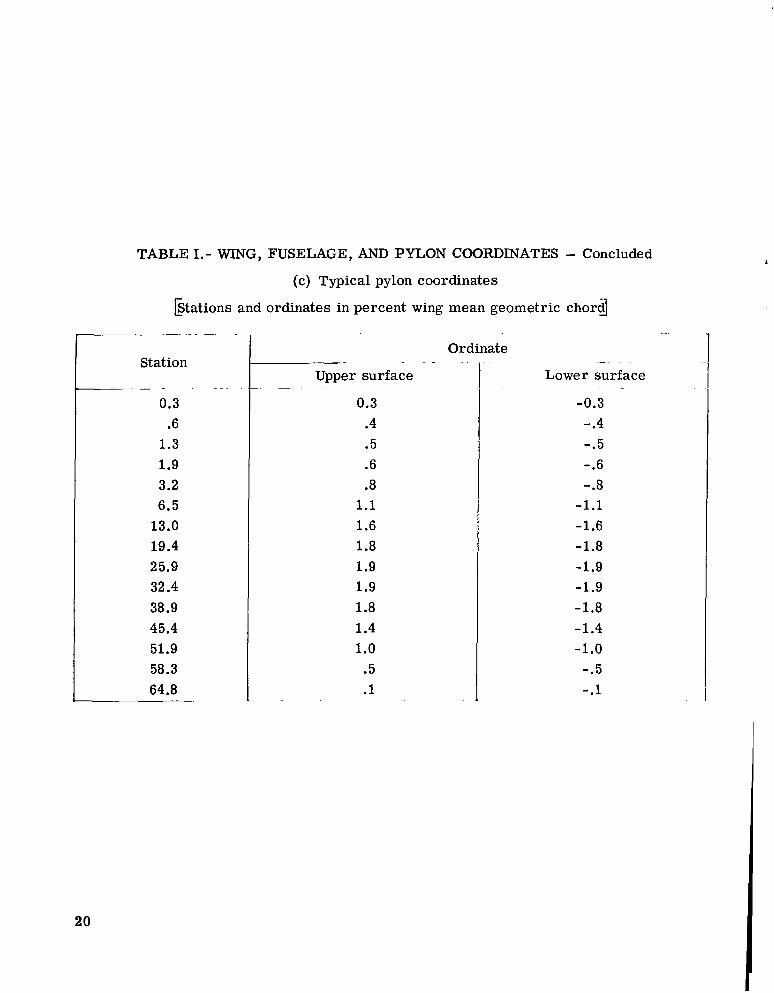
TABLE 1.- WING, FUSELAGE, AND PYLON COORDINATES - Concluded
(c) Typical pylon coordinates
btations and ordinates in percent wing mean geometric chord
Station ~ - .
~
0.3 .6
1.3 1.9 3.2 6.5 13.0 19.4 25.9 32.4 38.9 45.4 51.9 58.3 64.8
Upper surface
0.3 .4 .5 .6 .8
1.1 1.6 1.8 1.9 1.9 1.8 1.4 1.0 .5 .1
t- -
Ordinate
Lower surface - 1 - I -0.3
- .4 -.5 -.6 -.8
-1.1 -1.6 -1.8 -1.9 -1.9 -1.8 -1.4
I -1.0 -.5 1 -.l
I
20

L
TABLE 11.- PRESSURE-ORIFICE LOCATIONS
(a) Wing pressure orifices
rstations in percent of local wing chord1
Upper surface y = 52.45 cm
(Local chord is 60.07 cm)
1 2 4 7 10 15 20 30 40 50 60 70 80 90
100
Station on - Lower surface y = 51.05 cm
(Local chord is 61.09 cm)
1 2 4 7
10 15 20 25 30 35 40 45 50 60
Lower surface y = 58.67 cm
(Local chord is 58.78 cm)
1 2 4 7 10 20 25 30 35 40 50
21
I

TABLE II.- PRESSURE-ORIFTCE LOCATIONS - Concluded
(b) Engine pressure orifice, pylon 4 configuration
[Station in percent chord at wing-pylon juncturd
Fan cowl
-61.2 -61.1 -60.8 -59.7 -58.5 -56.6 -54.7 -51.6 -45.6 -37.4 -30.4 -27.0 -22.6
Station* on - Turbine cowl
-22.6 -19.7 -14.8 -11.1 -7.8 -4.6 -1.9 0.7 3.7 6.6 8.9 10.2
~~ ~
Plug
10.2 11.9 14.3 16.0 18.1 20.4
*Measured from leading edge at wing-pylon juncture to the engine pressure orifices; c = 60.07 cm.
22

217.72 at slof origin
Adjustable flop in each slot opening 7
2 17. I9 5 a1 slot origin
k
.. . Slot origin .
c -~ Slot region * 624.84 J
Figure 1.- Details of test section and location of model in the Langley 8-foot transonic pressure tunnel. A l l dimensions are in centimeters.

-105.66
1- 166.85-
. 320.04
(a) Details of test model.
Figure 2.- Drawing of the semispan transport model. All dimensions are in centimeters.

-- 49.02 c
3
Cowl Turbine Plug
9.78- c-
-ma-
(b) Details of model engine.
Figure 2.- Concluded.
N ul

N Q,
Figure 3.- Photograph of the semispan model mounted on the wall of the Langley 8-foot transonic pressure tunnel.
L
L-65-4222

L A Sta t i c -p ressu re o r i f i c e 7
'1,
O" / Thermocouple-total-pressure-rake
/'- combinat ion
0'
I 180"
Sect ion A-A Sect ion B-B
Figure 4.- Cross-sectional view of the powered model fan-jet engine.
Sec t i on C-C

N 03
Pylon i
Pylon 2
Pylon 4
Pylon 5
~-
Typical pylon section
Pylon 3
Figure 5.- Details of engine positions. All dimensions are in centimeters.

Figure 6.- Photograph of the model engine and elongated pylon wall mounted i n the Langley 8-foot transonic pressure tunnel. L-65-4643

w 0
Location of static_ pressure orifices
Rod diam.=0.64
..
Figure 7.- Cross-sectional view of the ASME flow nozzle. A l l dimensions are i n centimeters.
..

.O 7
.O 6
.O 5
.O 4
cD
.O 3
.02
.o I
O1 .2
= o
.03
.02
$ CD .o I
.68 0
Y
'0' .2
I A-
.70
I
1 = 0.7(
I/ 'I
I-, 4
I 8.1 .2 .2
78
/ /
P 0
/ /
Y'
. 3 .4
.81
1
i- P 1-
1' /I ' I
I .5 .6 .7
CL (a) Variation of drag coefficient with l i f t coefficient for various Mach numbers.
I .86
(b) Variation of drag coefficient with Mach number for a l i f t coefficient of 0.4.
Figure 8.- Drag characteristics of the wing in presence of the fuselage.
i
31

32
M .8 8 .92
Figure 9.- Variation of the aerodynamic interference-drag coefficient wi th Mach number at a l i f t coefficient of 0.4 for the five engine positions.
-

1.
.002
0
- .002
.002
0
- .002
ACD
.ow
0
- .002
.002
0
I b- IC
1l=0.7( I- ]< I
vl = 0.7t
%
Vl= 0.8
1 = 0.84 I - .002
V
.32 .36 .40
0 1
.44 CL
(a) Pylon 1.
-52 .56 .60 .64 .68
Figure 10.- Variation of the aerodynamic interference-drag coefficient with l i f t coefficient at each test Mach number for the five engine positions.
33
,002
0
-. 002
.002
0
- .002
*CD
.002
0
- .002
.002
0
- .002 24 .28 .32 .36 .40 .44 .48 .52 5 6 .60
CL
(b) Pylon 2.
Figure 10.- Continued.
3
1
.64
.c
. .68
34

,002
0
- .002
.002
0
- .002 ACD
.ow
0
- .002
.002
0
<
- .ooz . L
a
I I
I I I I
-FP I I
Ul=0.70(
I 1 I - 1 I 1
I I I I l l I & I 1 I I
vl=O.781
I+ A= 0.81 I
1 = 0.84
.28
I 1 I I
.52 .f E .64 .68
Figure 10.- Continued.
35

,002
0
- .002
.002
0
.32 .36 CL
(d) Pylon 4.
Figure 10.- Continued.
I
.68
36

b=0.74
-.OO21 I I
=0.78
--.0021 I
= 0.89 - .002 .24 .28
-=I+&- I I I I rrr
I l l
-i- l l
TIT I I I I -I- I l l I1
.32 .36 .40 .44 .48 CL .
(e) Pylon 5.
Figure 10.- Concluded.
37

I I Ill II I1 I I III~111111l11111l11111l1l
3 1.47
Wing
-1.2
-1.0
-. 8
3 1.00 k
Upper surface
1.. Lower surface
. 2
-. 4 CP
-.2
0
0
ie surface
e= 30'
8 = 60'
8.90"
i i I I
9.180 0 O k
.2 - -.4 -.3 -.2 -.I .5 .7 .8 .9 1.0 0 ,I .2 .3 .4
X/C
(a) Outboard surfaces.
Figure 11.- Pressure distribution plots for wing and engine (fan cowl, turbine, and plug) surfaces for two fan-exit total-pressure ratios. Pylon 4 configuration; M = 0.78; a = 1.58O.
38

igine
I 330
300
,270'
180'
x/c
surf
-...
7
-1.;
-I.(
-.I
-. t
- 1
-. L
(
.2
CP
.4
.6
0
0
0
0
doper surface
Lower surfaci
e
?
I
r P c .9 . 2 -.4 -.: 0 .I .2 3 -.2 - . I .6 .7 .8
(b) Inboard surfaces,
Figure 11.- Concluded.
39

-1.0
-. 8
-. 6
Figure 12.- Difference i n pressure coefficients of the outboard surface of the engine and the inboard surface of the engine at the engine-pylon juncture (ACp = CP,0=3o0 - Cp,e=33@) plotted against longitudinal distance from the wing leading edge. M = 0.78.

-. 4
- 0 2
0
.2
.4 0 . 3 0 .I .2
x/c .3 0 .I .2 e 3
Figure 13.- Differential pressure coefficient of the wing lower surface AC ( p = (‘P)outboard of pylon - (‘Phnboard of pylon) from the wing leading edge. M = 0.78.
plotted against longitudinal distance

-. 6
-. 4
-. 2
0
.2
.4
.6
CP
.8
-. 4
-.2
0
Pylon 0 3 0 4
\ - Wing lower sur face \ '.
Engine surface
.2 .3 .4 x/c
.6 .8 .9 I .o .~ -.3 -.2 -.I 0 .I .7 .5
Figure 14.- Effect of engine position on the pressure coefficients for the wing lower surface inboard of the pylon (span station, 51.05 cm) and for the engine surface inboard of the pylon (0 = 3300). M = 0.78; a = 1.58O; pt,e/pt,a= 1.47.
42

Figure 15.- Effect of Mach number on the pressure coefficients for the wing lower surface inboard of the pylon (span station, 51.05 cm) and for the engine surface inboard of the pylon (0 = 330% Pylon 4; a = 1.580; h,e/pt,m = 1.47.
NASA-Langley, 1968 - 1 L-5815 43

NATIONAL AERONAUTICS AND SPACE ADMINISTRATION WASHINGTON, D. C. 20546
OFFICIAL BUSINESS FIRST CLASS MAIL
POSTAGE AND FEES PAID NATIONAL AERONAUTICS AND
SPACE ADMINISTRATION
POSTMASTER: If Undeliverable (Section 158 Postal Manual) Do Not Return
._ .
“The aeronauticnl and space activities of the United States shall be condacted JO us t o contribute . . . t o the expansion of human knowl- edge of phenomena in the atniospheye and space. T h e Administration sbnll provide for the w ide f t prncticable and appropriate dissenzi?zution of information concerning its activities and the results thereof.”
-NATIONAL AERONAUTICS AND SPACE ACT OF 1958
NASA SCIENTIFIC AND TECHNICAL PUBLICATIONS
TECHNICAL REPORTS: Scientific and technical information considered important, complete, and a lasting contribution to existing knowledge.
TECHNICAL TRANSLATIONS: Information published in a foreign language considered to merit NASA distribution in English.
SPECIAL PUBLICATIONS: Information TECHNICAL NOTES: Information less broad in scope but nevertheless of importance as a contribution to existing knowledge.
TECHNICAL MEMORANDUMS : Information receiving limited distribution because of preliminary data, security classifica- tion, or other reasons.
CONTRACTOR REPORTS: Scientific and technical information generated under a NASA contract or grant and considered an important contribution to existing knowledge.
derived from or of value to NASA activities. Publications include conference proceedings, monographs, data compilations, handbooks, sourcebooks, and special bibliographies.
TECHNOLOGY UTILIZATION PUBLICATIONS: Information on technology used by NASA that may be of particular interest in commercial and other non-aerospace applications. Publications include Tech Briefs, Technology Utilization Reports and Notes, and Technology Surveys.
Details on the availability of these publications may be obtained from:
SCIENTIFIC AND TECHNICAL INFORMATION DIVISION
NATIONAL AERONAUTICS AND SPACE ADMINISTRATION Washington, D.C. 90546