a1ao05a.pdf
TRANSCRIPT
Prentice Hall Algebra 1 • Teaching ResourcesCopyright © by Pearson Education, Inc., or its affiliates. All Rights Reserved.
97
A N S W E R S
Page 1
Page 3
Page 2
Page 4g
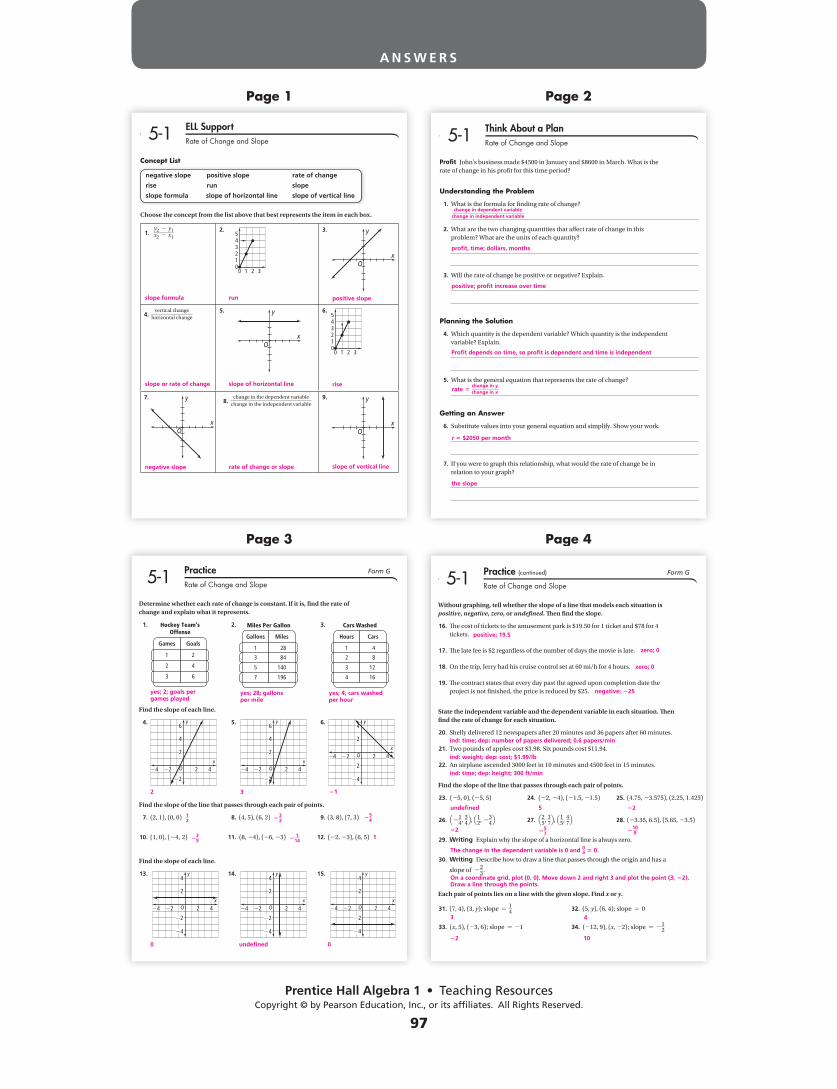
5-1 Practice (continued) Form G
Rate of Change and Slope
Without graphing, tell whether the slope of a line that models each situation is positive, negative, zero, or undefi ned. Th en fi nd the slope.
16. Th e cost of tickets to the amusement park is $19.50 for 1 ticket and $78 for 4 tickets.
17. Th e late fee is $2 regardless of the number of days the movie is late.
18. On the trip, Jerry had his cruise control set at 60 mi/h for 4 hours.
19. Th e contract states that every day past the agreed upon completion date the project is not fi nished, the price is reduced by $25.
State the independent variable and the dependent variable in each situation. Th en fi nd the rate of change for each situation.
20. Shelly delivered 12 newspapers after 20 minutes and 36 papers after 60 minutes.
21. Two pounds of apples cost $3.98. Six pounds cost $11.94.
22. An airplane ascended 3000 feet in 10 minutes and 4500 feet in 15 minutes.
Find the slope of the line that passes through each pair of points.
23. (25, 0), (25, 5) 24. (22, 24), (21.5, 21.5) 25. (4.75, 23.575), (2.25, 1.425)
26. Q2 14, 34R, Q
12, 2
34R 27. Q2
5, 37R, Q15, 47R 28. (23.35, 6.5), (5.65, 23.5)
29. Writing Explain why the slope of a horizontal line is always zero.
30. Writing Describe how to draw a line that passes through the origin and has a
slope of 2 23.
Each pair of points lies on a line with the given slope. Find x or y.
31. (7, 4), (3, y); slope 514 32. (5, y), (6, 4); slope 5 0
33. (x, 5), (23, 6); slope 5 21 34. (212, 9), (x, 22); slope 5 2 12
positive; 19.5
zero; 0
zero; 0
negative; 225
ind: time; dep: number of papers delivered; 0.6 papers/min
ind: weight; dep: cost; $1.99/lb
ind: time; dep: height; 300 ft/min
undefi ned
The change in the dependent variable is 0 and 0a 5 0.
3
On a coordinate grid, plot (0, 0). Move down 2 and right 3 and plot the point (3, 22). Draw a line through the points.
5
4
1022
210925
7
22
22
g
5-1 Practice Form G
Rate of Change and Slope
Determine whether each rate of change is constant. If it is, fi nd the rate of change and explain what it represents.
1. 2. 3.
Find the slope of each line.
4. 5. 6.
Find the slope of the line that passes through each pair of points.
7. (2, 1), (0, 0) 8. (4, 5), (6, 2) 9. (3, 8), (7, 3)
10. (1, 0), (24, 2) 11. (8, 24), (26, 23) 12. (22, 23), (6, 5)
Find the slope of each line.
13. 14. 15.
GoalsGames
Hockey Team’sOffense
1
2
3
2
4
6
MilesGallons
Miles Per Gallon
1
3
5
7
28
84
140
196
CarsHours
Cars Washed
1
2
3
4
4
8
12
16
xO
y6
2
4
2
2
4 2 4x
O
y6
2
4
2
2
4 42
xO
y4
2
2
4
2
4 42
xO
y4
2
4
2
4 422x
O
y4
2
2
4
2
4 42 2x
O
y4
2
2
4
2
4 4
yes; 2; goals per games played
2
12
225
0
yes; 28; gallons per mile
3
2 32
2 114
undefi ned
yes; 4; cars washed per hour
21
254
1
0
g
5-1 Think About a PlanRate of Change and Slope
Profi t John’s business made $4500 in January and $8600 in March. What is the rate of change in his profi t for this time period?
Understanding the Problem
1. What is the formula for fi nding rate of change?
2. What are the two changing quantities that aff ect rate of change in this problem? What are the units of each quantity?
3. Will the rate of change be positive or negative? Explain.
Planning the Solution
4. Which quantity is the dependent variable? Which quantity is the independent variable? Explain.
5. What is the general equation that represents the rate of change?
Getting an Answer
6. Substitute values into your general equation and simplify. Show your work.
7. If you were to graph this relationship, what would the rate of change be in relation to your graph?
change in dependent variablechange in independent variable
profi t, time; dollars, months
positive; profi t increase over time
Profi t depends on time, so profi t is dependent and time is independent
r 5 $2050 per month
the slope
rate 5change in ychange in x
g
Concept List
negative slope positive slope rate of change
rise run slope
slope formula slope of horizontal line slope of vertical line
Choose the concept from the list above that best represents the item in each box.
1. y2 2 y1x2 2 x1
2. 3.
4. vertical change
horizontal change 5. 6.
7. 8.
change in the dependent variablechange in the independent variable
9.
5-1 ELL SupportRate of Change and Slope
y
xO
y
xO
3210
543210
y
xO
y
xO
3210
543210
slope formula
slope or rate of change
negative slope rate of change or slope slope of vertical line
slope of horizontal line rise
run positive slope
Prentice Hall Algebra 1 • Teaching ResourcesCopyright © by Pearson Education, Inc., or its affiliates. All Rights Reserved.
98
A N S W E R S
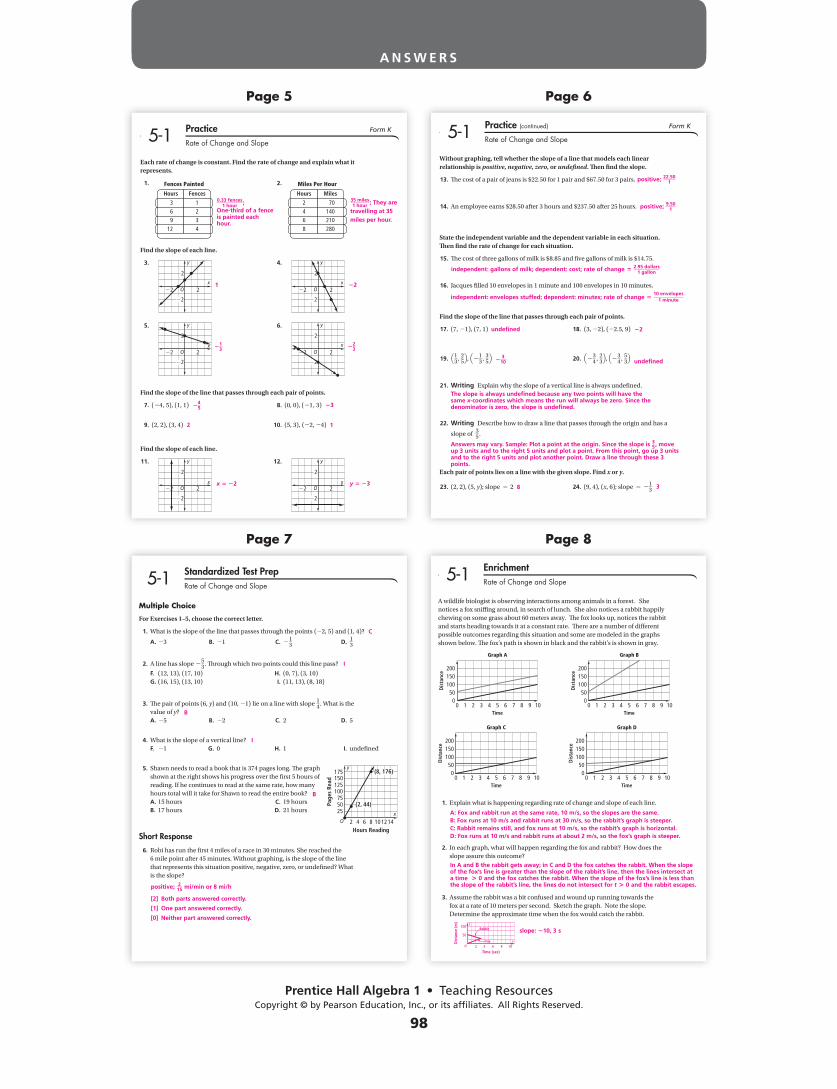
5-1 EnrichmentRate of Change and Slope
A wildlife biologist is observing interactions among animals in a forest. She notices a fox sniffi ng around, in search of lunch. She also notices a rabbit happily chewing on some grass about 60 meters away. Th e fox looks up, notices the rabbit and starts heading towards it at a constant rate. Th ere are a number of diff erent possible outcomes regarding this situation and some are modeled in the graphs shown below. Th e fox’s path is shown in black and the rabbit’s is shown in gray.
1. Explain what is happening regarding rate of change and slope of each line.
2. In each graph, what will happen regarding the fox and rabbit? How does the slope assure this outcome?
3. Assume the rabbit was a bit confused and wound up running towards the fox at a rate of 10 meters per second. Sketch the graph. Note the slope. Determine the approximate time when the fox would catch the rabbit.
0 21 3 4 5 6 7 8 9 10
200150
50100
0
Time
Graph A
Dis
tanc
e
0 21 3 4 5 6 7 8 9 10
200150
50100
0
Time
Graph B
Dis
tanc
e
0 21 3 4 5 6 7 8 9 10
200150
50100
0
Time
Graph C
Dis
tanc
e
0 21 3 4 5 6 7 8 9 10
200150
50100
0
Time
Graph D
Dis
tanc
e
A: Fox and rabbit run at the same rate, 10 m/s, so the slopes are the same.B: Fox runs at 10 m/s and rabbit runs at 30 m/s, so the rabbit’s graph is steeper.C: Rabbit remains still, and fox runs at 10 m/s, so the rabbit’s graph is horizontal.D: Fox runs at 10 m/s and rabbit runs at about 2 m/s, so the fox’s graph is steeper.
In A and B the rabbit gets away; in C and D the fox catches the rabbit. When the slope of the fox’s line is greater than the slope of the rabbit’s line, then the lines intersect at a time S 0 and the fox catches the rabbit. When the slope of the fox’s line is less than the slope of the rabbit’s line, the lines do not intersect for t S 0 and the rabbit escapes.
x
y
2
50
100
4 6 8 10O
Time (sec)
Dis
tanc
e (m
)
Rabbit
Fox
slope: 210, 3 s
5-1 Standardized Test PrepRate of Change and Slope
Multiple Choice
For Exercises 1–5, choose the correct letter.
1. What is the slope of the line that passes through the points (22, 5) and (1, 4)?
A. 23 B. 21 C. 2 13 D. 1
3
2. A line has slope 2 53. Th rough which two points could this line pass?
F. (12, 13), (17, 10) H. (0, 7), (3, 10) G. (16, 15), (13, 10) I. (11, 13), (8, 18)
3. Th e pair of points (6, y) and (10, 21) lie on a line with slope 14. What is the value of y?
A. 25 B. 22 C. 2 D. 5
4. What is the slope of a vertical line? F. 21 G. 0 H. 1 I. undefi ned
5. Shawn needs to read a book that is 374 pages long. Th e graph shown at the right shows his progress over the fi rst 5 hours of reading. If he continues to read at the same rate, how many hours total will it take for Shawn to read the entire book?
A. 15 hours C. 19 hours B. 17 hours D. 21 hours
Short Response
6. Robi has run the fi rst 4 miles of a race in 30 minutes. She reached the 6 mile point after 45 minutes. Without graphing, is the slope of the line that represents this situation positive, negative, zero, or undefi ned? What is the slope?
xO
y175
125
75100
150
2550 (2, 44)
(8, 176)
2 4 6 8 10 12 14Hours Reading
Page
s Re
ad
C
I
B
I
B
positive; 215 mi/min or 8 mi/h
[2] Both parts answered correctly.
[1] One part answered correctly.
[0] Neither part answered correctly.
5-1 Practice (continued) Form K
Rate of Change and Slope
Without graphing, tell whether the slope of a line that models each linear relationship is positive, negative, zero, or undefi ned. Th en fi nd the slope.
13. Th e cost of a pair of jeans is $22.50 for 1 pair and $67.50 for 3 pairs.
14. An employee earns $28.50 after 3 hours and $237.50 after 25 hours.
State the independent variable and the dependent variable in each situation. Th en fi nd the rate of change for each situation.
15. Th e cost of three gallons of milk is $8.85 and fi ve gallons of milk is $14.75.
16. Jacques fi lled 10 envelopes in 1 minute and 100 envelopes in 10 minutes.
Find the slope of the line that passes through each pair of points.
17. (7, 21), (7, 1) 18. (3, 22), (22.5, 9)
19. Q13 ,
25R, Q2
13 , 35R 20. Q2
34 , 23R, Q2
34 , 53R
21. Writing Explain why the slope of a vertical line is always undefi ned.
22. Writing Describe how to draw a line that passes through the origin and has a
slope of 35.
Each pair of points lies on a line with the given slope. Find x or y.
23. (2, 2), (5, y); slope 5 2 24. (9, 4), (x, 6); slope 5 2 138 3
undefi ned 22
2 310 undefi ned
positive; 22.501
positive; 9.501
independent: gallons of milk; dependent: cost; rate of change 5 2.95 dollars1 gallon
independent: envelopes stuffed; dependent: minutes; rate of change 510 envelopes
1 minute
The slope is always undefi ned because any two points will have the same x-coordinates which means the run will always be zero. Since the denominator is zero, the slope is undefi ned.
Answers may vary. Sample: Plot a point at the origin. Since the slope is 35, move up 3 units and to the right 5 units and plot a point. From this point, go up 3 units and to the right 5 units and plot another point. Draw a line through these 3 points.
5-1 Practice Form K
Rate of Change and Slope
Each rate of change is constant. Find the rate of change and explain what it represents.
1. 2.
Find the slope of each line.
3. 4.
5. 6.
Find the slope of the line that passes through each pair of points.
7. (24, 5), (1, 1) 8. (0, 0), (21, 3)
9. (2, 2), (3, 4) 10. (5, 3), (22, 24)
Find the slope of each line.
11. 12.
Fences Painted
Hours Fences
63
912
1234
x
y
O2
2
2
2
x
y
O2
2
2
2
x
y
O2
2
2
2
Miles Per Hour
Hours Miles
42
68
70140210280
x
y
O2
2
2
2
x
y
O2
2
2
2
x
y
O2
2
2
2
1
245 23
2 1
x 5 22 y 5 23
22
213 22
3
0.33 fences1 hour ;
One-third of a fence is painted each hour.
35 miles1 hour ; They are
travelling at 35 miles per hour.
Page 5
Page 7
Page 6
Page 8

Prentice Hall Algebra 1 • Teaching ResourcesCopyright © by Pearson Education, Inc., or its affiliates. All Rights Reserved.
99
A N S W E R S
Page 9
Page 11
Page 10
Page 12g
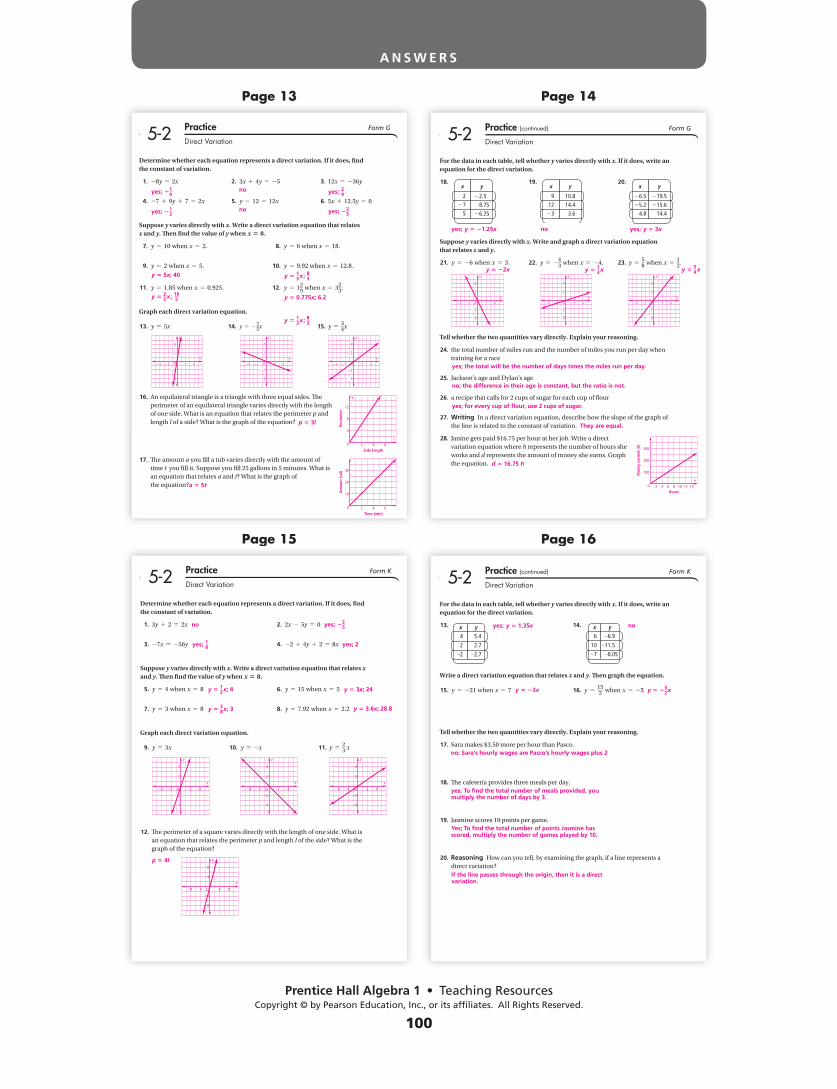
5-2 Think About a PlanDirect Variation
Electricity Ohm’s Law V 5 I 3 R relates the voltage, current, and resistance of a circuit. V is the voltage measured in volts. I is the current measured in amperes. R is the resistance measured in ohms. a. Find the voltage of a circuit with a current of 24 amperes and a resistance of
2 ohms. b. Find the resistance of a circuit with a current of 24 amperes and a voltage of
18 volts.
Understanding the Problem
1. Does Ohm’s Law represent a direct variation? Explain.
2. If the formula is rearranged to solve for R or I, is it still a direct variation? Explain.
Planning the Solution
3. For part (a), does Ohm’s Law need to be rearranged to answer the question? Explain. If it does, how should the formula be rearranged?
4. For part (b), does Ohm’s Law need to be rearranged to answer the question? Explain. If it does, how should the formula be rearranged?
Getting an Answer
5. For part (a), substitute the given values into the formula and simplify.
6. For part (b), substitute the given values into the formula and simplify.
yes; the ratio of V to R is constant, and the ratio of V to I is constant.
R and I would be in direct variation with V but not with each other.
no; you want to fi nd V
yes; you want to fi nd R; R 5 VI
48 volts
0.75 ohms
g
Th ere are two sets of note cards below that show how Latoya fi nds a direct variation equation relating x and y. Suppose y varies directly with x, and y 5 36 when x 5 9. She also wants to fi nd the value of y when x 5 7. Th e set on the left explains her thinking. Th e set on the right shows the steps. Write the thinking and the steps in the correct order.
Think Cards Write Cards
Think Write
Start with the function form of a direct variation.direct variation.
Divide each side by 9 to solve for k.
5-2 ELL SupportDirect Variation
y 5 4x
36 5 k(9)
y 5 4(7) 5 28
y 5 kx
W it
4 5 k
for k.
Find the value of y when x 5 7.
Step 1
Step 2
Step 3
Step 4
Step 5
y
Substitute 9 for x and 36 for y.
Think
y
Write an equation. Substitute 4 for k in y 5 kx.
y 5 kx
y 5 4(7) or 28
4 5 k
y 5 4x
36 5 k(9)
Start with the function form of a direct variation.
Substitute 9 for x and 36 for y.
Divide each side by 9 to solve for k.
Write an equation. Substitute 4 for k in y = kx.
Find the value of y when x = 7.
g
5-1 Reteaching (continued)
Rate of Change and Slope
Exercises
Find the slope of each line.
1. 2. 3.
Suppose one point on a line has the coordinates (x1, y1) and another point on the same line has the coordinates (x2, y2). You can use the following formula to fi nd the slope of the line.
slope 5riserun 5
y2 2 y1x2 2 x1
, where x2 2 x1 2 0
Problem
What is the slope of the line through R(2, 5) and S(21, 7)?
slope 5y2 2 y1x2 2 x1
57 2 5
21 2 2 Let y2 5 7 and y1 5 5.
Let x2 5 21 and x1 5 2.
52
23 5 2 23
Exercises
Find the slope of the line that passes through each pair of points.
4. (0, 0), (4, 5) 5. (2, 4), (7, 8) 6. (22, 0), (23, 2)
7. (22, 23), (1, 1) 8. (1, 4), (2,23) 9. (3, 2), (25, 3)
xO
y4
42
2
4
2
2 6
(1, 0)
(5, 21) xO
y6
42
4
2
2
2 6
(1, 2)
(6, 5)
xO
y6
42
4
2
2
2 6
(1, 4) (5, 4)
214
35
0
54
43
45
27
22
218
g
5-1 ReteachingRate of Change and Slope
Th e rate of the vertical change to the horizontal change between two points on a line is called the slope of the line.
slope 5vertical change
horizontal change 5riserun
Th ere are two special cases for slopes.
• A horizontal line has a slope of 0.
• A vertical line has an undefi ned slope.
Problem
What is the slope of the line?
slope 5vertical change
horizontal change 5riserun
513
Th e slope of the line is 13.
In general, a line that slants upward from left to right has a positive slope.
Problem
What is the slope of the line?
slope 5vertical change
horizontal change 5riserun
5221
5 22
Th e slope of the line is 22.
In general, a line that slants downward from left to right has a negative slope.
xO
y4
42
2
4
2
2 6
(1, 1)(4, 2)
rise 5 1run 5 3
xO
y4
2
4
2
4 4
(1, 1)
(0, 3)
2run 5 1
rise 5 22
Prentice Hall Algebra 1 • Teaching ResourcesCopyright © by Pearson Education, Inc., or its affiliates. All Rights Reserved.
100
A N S W E R S
Page 13
Page 15
Page 14
Page 16g
5-2 Practice (continued) Form K
Direct Variation
For the data in each table, tell whether y varies directly with x. If it does, write an equation for the direct variation.
13. 14.
Write a direct variation equation that relates x and y. Th en graph the equation.
15. y 5 221 when x 5 7 16. y 5152 when x 5 25
Tell whether the two quantities vary directly. Explain your reasoning.
17. Sara makes $3.50 more per hour than Pasco.
18. Th e cafeteria provides three meals per day.
19. Jasmine scores 10 points per game.
20. Reasoning How can you tell, by examining the graph, if a line represents a direct variation?
4
2
2
5.4
2.7
2.7
x y6
10
7
6.9
11.5
8.05
x y
no; Sara’s hourly wages are Pasco’s hourly wages plus 2
yes; To fi nd the total number of meals provided, you multiply the number of days by 3.
Yes; To fi nd the total number of points Jasmine has scored, multiply the number of games played by 10.
If the line passes through the origin, then it is a direct variation.
yes; y 5 1.35x no
y 5 23x y 5 232 x
g
5-2 Practice Form K
Direct Variation
Determine whether each equation represents a direct variation. If it does, fi nd the constant of variation.
1. 3y 1 2 5 2x 2. 2x 2 5y 5 0
3. 27x 5 256y 4. 22 1 4y 1 2 5 8x
Suppose y varies directly with x. Write a direct variation equation that relates x and y. Th en fi nd the value of y when x 5 8.
5. y 5 4 when x 5 8 6. y 5 15 when x 5 5
7. y 5 3 when x 5 8 8. y 5 7.92 when x 5 2.2
Graph each direct variation equation.
9. y 5 3x 10. y 5 2x 11. y 523 x
12. Th e perimeter of a square varies directly with the length of one side. What is an equation that relates the perimeter p and length l of the side? What is the graph of the equation?
p 5 4l
no yes; 225
yes; 18 yes; 2
y 5 12 x; 4 y 5 3x; 24
y 5 38 x; 3 y 5 3.6x; 28.8
4 2 2 4
2
4
2
4
x
y
O 4 2 2 4
2
4
2
4
x
y
O 4 2 2 4
2
4
2
4
x
y
O
8 4 4 8
4
8
4
8
x
y
O
g
5-2 Practice (continued) Form G
Direct Variation
For the data in each table, tell whether y varies directly with x. If it does, write an equation for the direct variation.
18. 19. 20.
Suppose y varies directly with x. Write and graph a direct variation equation that relates x and y.
21. y 5 26 when x 5 3. 22. y 5 243 when x 5 24. 23. y 5
58 when x 5
12.
Tell whether the two quantities vary directly. Explain your reasoning.
24. the total number of miles run and the number of miles you run per day when training for a race
25. Jackson’s age and Dylan’s age
26. a recipe that calls for 2 cups of sugar for each cup of fl our
27. Writing In a direct variation equation, describe how the slope of the graph of the line is related to the constant of variation.
28. Janine gets paid $16.75 per hour at her job. Write a direct variation equation where h represents the number of hours she works and d represents the amount of money she earns. Graph the equation.
x y
227
5
22.5
26.25
8.75
x y
912
23
10.8
3.6
14.4
x y
25.226.5
4.8
219.5215.6
14.4
yes; y 5 21.25x no yes; y 5 3x
y 5 22x
yes; the total will be the number of days times the miles run per day.
no; the difference in their age is constant, but the ratio is not.
yes; for every cup of fl our, use 2 cups of sugar.
They are equal.
y 5 54 xy 5 1
3 x
x
y
2 424
4
2
4
2
O
x
y
2 424
4
2
4
2
Ox
y
2 424
4
2
4
2
O
d 5 16.75 h
2
100
200
300
4 6 8 10 12 14O
h
Hours
Mon
ey e
arne
d ($
)
g
5-2 Practice Form G
Direct Variation
Determine whether each equation represents a direct variation. If it does, fi nd the constant of variation.
1. 28y 5 2x 2. 3x 1 4y 5 25 3. 12x 5 236y
4. 27 1 9y 1 7 5 2x 5. y 2 12 5 12x 6. 5x 1 12.5y 5 0
Suppose y varies directly with x. Write a direct variation equation that relates x and y. Th en fi nd the value of y when x 5 8.
7. y 5 10 when x 5 2. 8. y 5 6 when x 5 18.
9. y 5 2 when x 5 5. 10. y 5 9.92 when x 5 12.8.
11. y 5 1.85 when x 5 0.925. 12. y 5 129 when x 5 32
3.
Graph each direct variation equation.
13. y 5 5x 14. y 5 2 25x 15. y 5
34x
16. An equilateral triangle is a triangle with three equal sides. Th e perimeter of an equilateral triangle varies directly with the length of one side. What is an equation that relates the perimeter p and length l of a side? What is the graph of the equation?
17. Th e amount a you fi ll a tub varies directly with the amount of time t you fi ll it. Suppose you fi ll 25 gallons in 5 minutes. What is an equation that relates a and t? What is the graph of the equation?
no
y 5 5x; 40
y 5 0.775x; 6.2y 5 25 x ; 16
5
y 5 13 x ; 83
y 5 13 x ; 83
yes; 213
yes; 214
yes; 225
yes; 29no
x
y
2 424
4
2
4
2
Ox
y
2 424
4
2
4
2
Ox
y
2 424
4
2
4
2
O
4
8
12
2 4 6O
p
Side length
Peri
met
er
p 5 3l
a 5 5t10
20
30
2 4 6O
Time (min)
Am
ount
(sal
)

Prentice Hall Algebra 1 • Teaching ResourcesCopyright © by Pearson Education, Inc., or its affiliates. All Rights Reserved.
101
A N S W E R S
Page 20
Page 17
Page 19
Page 18
g
5-2 Reteaching (continued)
Direct Variation
To write an equation for direct variation, fi nd the constant of variation k using an ordered pair. Th en use the value of k to write an equation.
Problem
Suppose y varies directly with x, and y 5 24 when x 5 8. What direct variation equation relates x and y? What is the value of y when x 5 10?
You are given that x and y vary directly. Th is means that the relationship between x and y can be written in the form y 5 kx , where k is a constant.
y 5 kx Start with the direct variation equation.
24 5 k(8) Substitute the given values: 8 for x and 24 for y.
3 5 k Divide each side by 8 to solve for k.
y 5 3x Write the direct variation equation that relates x and y by substituting 3 for k in y 5 kx .
Th e equation y 5 3x relates x and y. When x 5 10, y 5 3(10)or 30.
Exercises
Suppose y varies directly with x. Write a direct variation equation that relates x and y. Th en fi nd the value of y when x 5 6.
7. y 5 14 when x 5 2. 8. y 5 3 when x 5 9.
9. y 5 12 whenx 5 224. 10. y 5 281 when x 5 9.
11. y 5 216 when x 5 24. 12. y 5 5 when x 5 20.
13. Consider the direct variation y 5 3x . a. List three ordered pairs that satisfy the equation.
b. Plot your three ordered pairs from part (a) on a coordinate grid.
c. Complete the graph of y 5 3x on the grid.
y 5 7x; 42
y 5 29x; 254
y 5 4x; 24
Answers may vary. Sample: (0,0), (1, 3), (2. 6)
Sample:
Sample:
y 5 13 x; 2
y 5 2 12 x; 23
y 5 14 x; 32
2
4
6
2 4 6Ox
y
(0, 0)
(1, 3)
(2, 6)
g
5-2 ReteachingDirect Variation
A direct variation is a relationship that can be represented by a function in the form y 5 kx where k 2 0. Th e constant of variation for a direct variation k is the
coeffi cient of x. Th e equation y 5 kx can also be written as yx 5 k.
Problem
Does the equation 6x 1 3y 5 9 represent a direct variation? If so, fi nd the constant of variation.
If the equation represents a direct variation, the equation can be rewritten in the form y 5 kx . So, solve the equation for y to determine whether the equation can be written in this form.
6x 1 3y 5 9
3y 5 9 2 6x Subtract 6x from each side.
y 5 3 2 2x Divide each side by 3.
You cannot write the equation in the form y 5 kx . So 6x 1 3y 5 9 does not represent a direct variation.
Problem
Does the equation 5y 5 3x represent a direct variation? If so, fi nd the constant of variation.
Again, if the equation represents a direct variation, the equation can be rewritten in the form y 5 kx . So, solve the equation for y to determine whether the equation can be written in this form.
5y 5 3x
y 535 x Divide each side by 5.
Th e equation has the form y 5 kx , so the equation represents a direct variation.
Th e coeffi cient of x is 35, so the constant of variation is 35.
Exercises
Determine whether each equation represents a direct variation. If it does, fi nd the constant of variation.
1. 2y 5 x 2. 3x 1 2y 5 1 3. 24y 5 8x
4. 2x 5 y 2 5 5. 4x 2 3y 5 0 6. 5x 5 2y
yes; 12
yes; 43 yes; 52
no
no
yes; 22
g
5-2 EnrichmentDirect Variation
A rubber ball is dropped out a window. Th e height that the ball bounces varies directly with the height of that window. Th is relation is modeled by the equation y 5 0.4x , in which x represents the height from which the ball is dropped in meters and y represents the height the ball bounces in meters.
1. Th e ball is dropped from a height of 25 m above the ground. How high does it bounce?
2. Th e ball bounces 13.5 cm in the air. From what height was it dropped?
3. List at least three factors other than starting height that could aff ect the fi nal height of the ball.
4. How might each of these factors change the equation? Would the new equation be a direct variation? If so, come up with a new constant of variation that makes sense given the factor(s) you have identifi ed, and answer Exercises 1 and 2 for your new direct variation.
5. Draw the graph of the original ball. Graph at least one of your new functions on the same set of axes.
6. What can you say regarding the largest possible value for the constant of variation given the situation described? Why does this limit exist? (What would happen if the limit didn’t exist?)
7. Th e original rubber ball is dropped from the same distance, but hits the roof of a building 20 ft off the ground. Is the resulting function still a direct variation? Explain.
10 m
33.75 cm
Answers may vary. Sample: type of ball; whether you drop the ball or throw the ball down; wind resistance
Answers may vary. Sample: Suppose a ball bounced to 70% of its starting height. y 5 0.7x , 17. 5 m, 19.3 cm
Answers may vary. Sample:
The maximum constant for variation is 1; if it were more than 1, the ball would have bounced higher.
It will rebound y 5 0.4(x 2 20) feet above that roof, or y 5 0.4(x 2 20) 1 20 feet above the ground. This equation, y 5 0.4x 1 12, is not direct variation.
20
40
60
20 40 60Ox
y
Start Height
Boun
ce H
eigh
t
Original
Bouncer ball
g
5-2 Standardized Test PrepDirect Variation
Gridded Response
Solve each exercise and enter your answer on the grid provided.
1. Suppose y varies directly with x and y 5 14 when x 5 24. What is the value of y when x 5 26?
2. Suppose y varies directly with x and y 5 25 when x 5 140. What is the value of x when y 5 36?
3. Th e point (12, 9) is included in a direct variation. What is the constant of variation?
4. Th e equation of the line on the graph at the right is a direct variation equation. What is the constant of variation?
5. Th e distance d a train travels varies directly with the amount of time t that has elapsed since departure. If the train travels 475 miles in 9.5 hours, how many miles did the train travel after 4 hours?
1. 2. 3. 4. 5.
xO
y4
2
2
4
2
4 42
21
201.6
200
14
34
9876543
10
12
987654
210
9876543210
987
543210
987654321
9876543210
2
3
6
0
2
9876543
10
6.102
987654
210
9876543210
987
543210
987654321
9876543210
2
3
6
0
2
9876543
10
4/3
987654
210
9876543210
987
543210
987654321
9876543210
2
3
6
0
2
9876543
10
987654
210
9876543210
987
543210
987654321
9876543210
2
3
6
0
2
4/1
9876543
10
002
987654
210
9876543210
987
543210
987654321
9876543210
2
3
6
0
2

Prentice Hall Algebra 1 • Teaching ResourcesCopyright © by Pearson Education, Inc., or its affiliates. All Rights Reserved.
102
A N S W E R S
Page 21
Page 23
Page 22
Page 24g
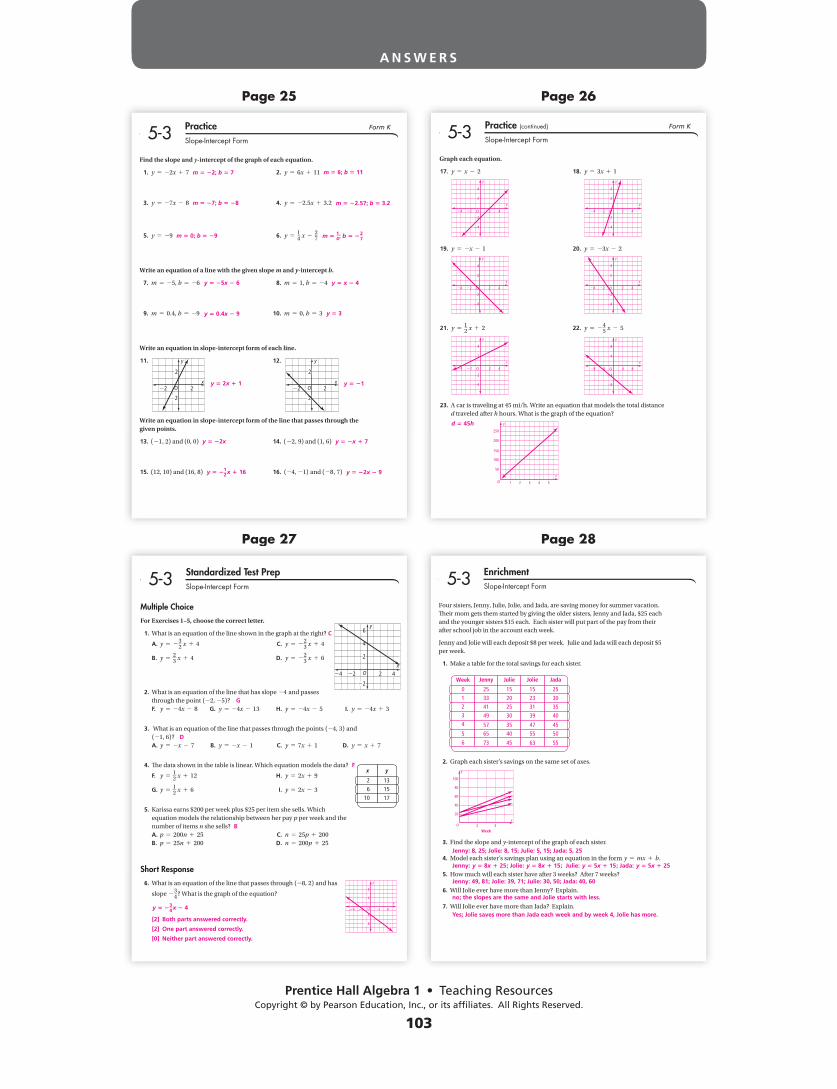
5-3 Practice (continued) Form G
Slope-Intercept Form
Graph each equation.
28. y 5 x 1 3 29. y 5 4x 2 1 30. y 5 2x 1 6
31. y 5 3x 2 2 32. y 5 25x 1 1 33. y 5 27x 2 4
34. Hudson is already 40 miles away from home on his drive back to college. He is driving 65 mi/h. Write an equation that models the total distance d travelled after h hours. What is the graph of the equation?
35. When Phil started his new job, he owed the company $65 for his uniforms. He is earning $13 per hour. Th e cost of his uniforms is withheld from his earnings. Write an equation that models the total money he has m after h hours of work. What is the graph of the equation?
Find the slope and the y-intercept of the graph of each equation.
36. y 1 4 5 26x 37. y 112 x 5 24 38. 3y 2 12x 1 6 5 0
39. y 2 5 513(x 2 9) 40. y 2
25 x 5 0 41. 2y 1 6a 2 4x 5 0
x
y
2 424
4
2
4
2
Ox
y
2 424
4
2
4
2
Ox
y
4 848
8
4
8
4
O
x
y
4 848
8
4
8
4
O
x
y
2 424
4
2
4
2
O
x
y
2 424
4
2
4
2
O
m 5 26; b 5 24 m 5 4; b 5 22
m 5 2; b 5 23a
m 5 212; b 5 24
m 5 13; b 5 2
d 5 65h 1 40
m 5 13h 2 65
m 5 25; b 5 0
200
400
600
2 4 6Oh
d
n
m
4 848
80
40
80
40
O
g
5-3 Practice Form G
Slope-Intercept Form
Find the slope and y-intercept of the graph of each equation.
1. y 5 3x 2 5 2. y 5 25x 1 13 3. y 5 2x 2 1
4. y 5 211x 1 6 5. y 5 25 6. y 512 x 1 6
7. y 5 26.75x 1 8.54 8. y 5 2 23 x 2
19 9. y 5 2.25
Write an equation of a line with the given slope m and y-intercept b.
10. m 5 21, b 5 3 11. m 5 4, b 5 22 12. m 5 25, b 5 28
13. m 5 0.25, b 5 6 14. m 5 0, b 5 211 15. m 5 1, b 538
Write an equation in slope-intercept form of each line.
16. 17. 18.
Write an equation in slope-intercept form of the line that passes through the given points.
19. (3, 5) and (0, 4) 20. (2, 6) and (24, 22) 21. (21, 3) and (23, 1)
22. (27, 5) and (3, 0) 23. (10, 2) and (22, 22) 24. (0, 21) and (5, 6)
25. (3, 2) and (21, 6) 26. (24, 23) and (3, 4) 27. (2, 8) and (23, 6)
y6
4
2
2
xO 24 42
xO
y4
2
2
4
2
4 42
xO
y2
2
6
4
2
4 42
3; 25
211; 6
26.75; 8.54 0; 2.25
y 5 2x 1 3
y 5 0.25x 1 6 y 5 211
y 5 2x 1 1 y 5 25 y 5 212 x 1 4
y 5 x 1 38
y 5 25x 2 8y 5 4x 2 2
223; 21
9
25; 13
0; 25
21; 21
12; 6
y 5 13 x 1 4 y 5 4
3 x 1 103
y 5 25 x 1 36
5
y 5 212 x 1 3
2
y 5 2x 1 5 y 5 x 1 1
y 5 13 x 2 4
3 y 5 75 x 2 1
y 5 x 1 4
g
5-3 Think About a PlanSlope-Intercept Form
Hobbies Suppose you are doing a 5000-piece puzzle. You have already placed 175 pieces. Every minute you place 10 more pieces. a. Write an equation in slope-intercept form to model the number of pieces
placed. Graph the equation. b. After 50 more minutes, how many pieces will you have placed?
Understanding the Problem
1. Is this relationship linear? How do you know?
Planning the Solution
2. How many pieces have you already placed? What does this represent in the slope-intercept form?
3. What two quantities are used to fi nd the rate of change or slope? What is the slope of this relationship?
Getting an Answer
4. Use your answers in Steps 2 and 3 to write an equation in slope-intercept form to model the number of pieces placed.
5. Graph the equation on a coordinate grid.
6. How many pieces will you have placed after 50 more minutes?
yes; the rate of change (10 pieces/min) is constant
175; the y-intercept
number of pieces placed and change in time; 10
y 5 175 1 10x
675 pieces200
400
600
20 40Time (min)
60Ox
y
g
Complete the vocabulary chart by fi lling in the missing information.
Word or Word Phrase
Defi nition Picture or Example
linear equation An equation that models a linear function
y 5 2x
linear parent function
y 5 x or f (x) 5 x
parent function y 5 x ofy 5 x, y 5 2x,and y 5 3x
slope-intercept form
An equation of the form y 5 mx 1 b, where m is the slope and b is the y-intercept
y-intercept y 5 2x 1 1
5-3 ELL SupportSlope - Intercept Form
1.
2.
3.
4.
y-intercept
A family of functions is a group of functions with common characteristics. A parent function is the simplest function with these characteristics.
y-coordinate of a point where the graph crosses the y-axis
y 5 mx 1 by 5 3x 1 4
y
xO24 22
22
2
4
24
2 4
Prentice Hall Algebra 1 • Teaching ResourcesCopyright © by Pearson Education, Inc., or its affiliates. All Rights Reserved.
103
A N S W E R S
Page 25
Page 27
Page 26
Page 28g
5-3 EnrichmentSlope-Intercept Form
Four sisters, Jenny, Julie, Jolie, and Jada, are saving money for summer vacation. Th eir mom gets them started by giving the older sisters, Jenny and Jada, $25 each and the younger sisters $15 each. Each sister will put part of the pay from their after school job in the account each week.
Jenny and Jolie will each deposit $8 per week. Julie and Jada will each deposit $5 per week.
1. Make a table for the total savings for each sister.
2. Graph each sister’s savings on the same set of axes.
3. Find the slope and y-intercept of the graph of each sister.
4. Model each sister’s savings plan using an equation in the form y 5 mx 1 b.
5. How much will each sister have after 3 weeks? After 7 weeks?
6. Will Jolie ever have more than Jenny? Explain.
7. Will Jolie ever have more than Jada? Explain.
Week Jenny Julie Jolie Jada
25
33
41
49
57
65
73
15
23
31
39
47
55
63
25
30
35
40
45
50
55
15
20
25
30
35
40
45
0
1
32
4
5
6
x
y
4
20
40
60
80
100
2O
Week
Jenny: 8, 25; Jolie: 8, 15; Julie: 5, 15; Jada: 5, 25
Jenny: y 5 8x 1 25; Jolie: y 5 8x 1 15; Julie: y 5 5x 1 15; Jada: y 5 5x 1 25
Jenny: 49, 81; Jolie: 39, 71; Julie: 30, 50; Jada: 40, 60
no; the slopes are the same and Jolie starts with less.
Yes; Jolie saves more than Jada each week and by week 4, Jolie has more.
g
5-3 Standardized Test PrepSlope-Intercept Form
Multiple Choice
For Exercises 1–5, choose the correct letter.
1. What is an equation of the line shown in the graph at the right?
A. y 5 2 32 x 1 4 C. y 5 2
23 x 1 4
B. y 523 x 1 4 D. y 5 2
23 x 1 6
2. What is an equation of the line that has slope 24 and passes through the point (22, 25)?
F. y 5 24x 2 8 G. y 5 24x 2 13 H. y 5 24x 2 5 I. y 5 24x 1 3
3. What is an equation of the line that passes through the points (24, 3) and (21, 6)?
A. y 5 2x 2 7 B. y 5 2x 2 1 C. y 5 7x 1 1 D. y 5 x 1 7
4. Th e data shown in the table is linear. Which equation models the data?
F. y 512 x 1 12 H. y 5 2x 1 9
G. y 512 x 1 6 I. y 5 2x 2 3
5. Karissa earns $200 per week plus $25 per item she sells. Which equation models the relationship between her pay p per week and the number of items n she sells?
A. p 5 200n 1 25 C. n 5 25p 1 200 B. p 5 25n 1 200 D. n 5 200p 1 25
Short Response
6. What is an equation of the line that passes through (28, 2) and has
slope 2 34? What is the graph of the equation?
y6
4
2
2
xO 24 42
x y
26
10
13
17
15
C
G
D
F
B
y 5 234 x 2 4
[2] Both parts answered correctly.
[2] One part answered correctly.
[0] Neither part answered correctly.
x
y
4 848
8
4
8
4
O
g
5-3 Practice (continued) Form K
Slope-Intercept Form
Graph each equation.
17. y 5 x 2 2 18. y 5 3x 1 1
19. y 5 2x 2 1 20. y 5 23x 2 2
21. y 512 x 1 2 22. y 5 2
45 x 2 5
23. A car is traveling at 45 mi/h. Write an equation that models the total distance d traveled after h hours. What is the graph of the equation?
d 5 45h
4 2 2 4
2
4
2
4
x
y
O 4 2 2 4
2
4
2
4
x
y
O
4 2 2 4
2
4
2
4
x
y
O 4 2 2 4
2
4
2
4
x
y
O
4 2 2 4
2
4
2
4
x
y
O 8 4 4 8
4
8
4
8
x
y
O
1 2 43 5
100
150
50
200
250
x
y
O
g
5-3 Practice Form K
Slope-Intercept Form
Find the slope and y-intercept of the graph of each equation.
1. y 5 22x 1 7 2. y 5 6x 1 11
3. y 5 27x 2 8 4. y 5 22.5x 1 3.2
5. y 5 29 6. y 514 x 2
27
Write an equation of a line with the given slope m and y-intercept b.
7. m 5 25, b 5 26 8. m 5 1, b 5 24
9. m 5 0.4, b 5 29 10. m 5 0, b 5 3
Write an equation in slope-intercept form of each line.
11. 12.
Write an equation in slope-intercept form of the line that passes through the given points.
13. (21, 2) and (0, 0) 14. (22, 9) and (1, 6)
15. (12, 10) and (16, 8) 16. (24, 21) and (28, 7)
x
y
O2
2
2
2
x
y
O2
2
2
2
m 5 22; b 5 7 m 5 6; b 5 11
m 5 27; b 5 28 m 5 22.57; b 5 3.2
m 5 0; b 5 29 m 5 14; b 5 2
27
y 5 25x 2 6 y 5 x 2 4
y 5 0.4x 2 9 y 5 3
y 5 2x 1 1 y 5 21
y 5 22x y 5 2x 1 7
y 5 212 x 1 16 y 5 22x 2 9
Prentice Hall Algebra 1 • Teaching ResourcesCopyright © by Pearson Education, Inc., or its affiliates. All Rights Reserved.
104
A N S W E R S
Page 32
Page 29
Page 31
Page 30
g
5-4 Think About a PlanPoint-Slope Form
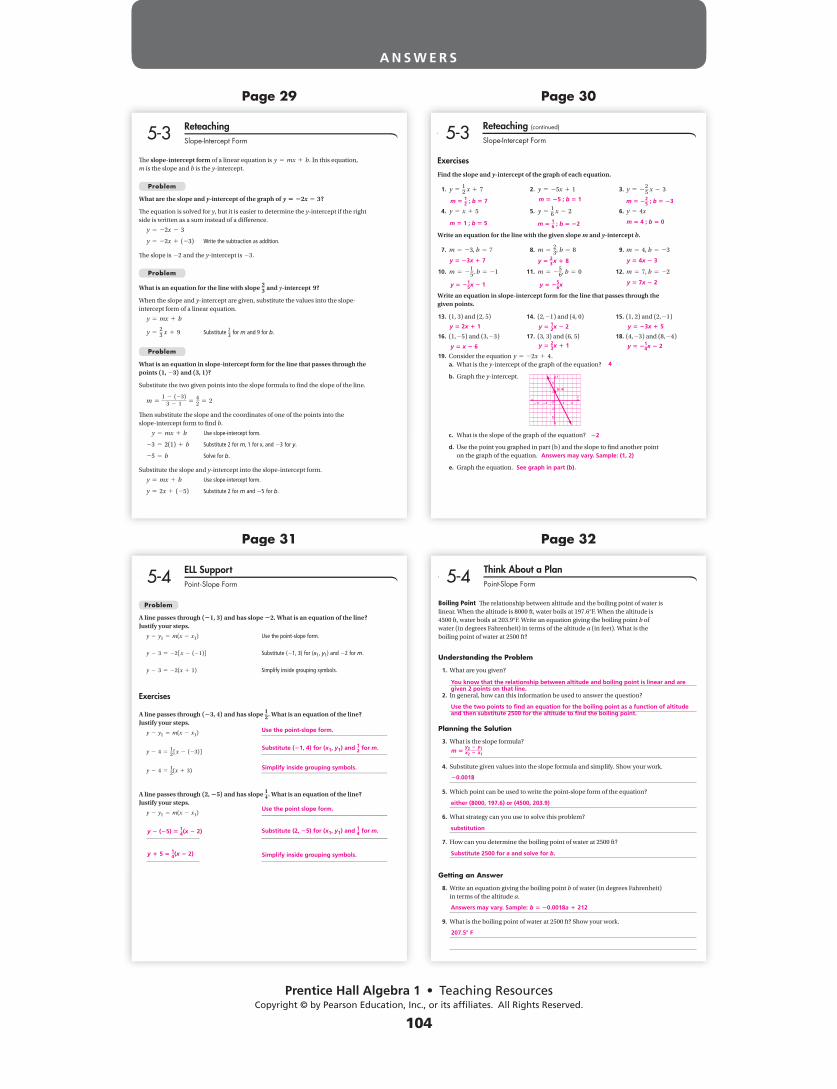
Boiling Point Th e relationship between altitude and the boiling point of water is linear. When the altitude is 8000 ft, water boils at 197.6°F. When the altitude is 4500 ft, water boils at 203.9°F. Write an equation giving the boiling point b of water (in degrees Fahrenheit) in terms of the altitude a (in feet). What is the boiling point of water at 2500 ft?
Understanding the Problem
1. What are you given?
2. In general, how can this information be used to answer the question?
Planning the Solution
3. What is the slope formula?
4. Substitute given values into the slope formula and simplify. Show your work.
5. Which point can be used to write the point-slope form of the equation?
6. What strategy can you use to solve this problem?
7. How can you determine the boiling point of water at 2500 ft?
Getting an Answer
8. Write an equation giving the boiling point b of water (in degrees Fahrenheit) in terms of the altitude a.
9. What is the boiling point of water at 2500 ft? Show your work.
You know that the relationship between altitude and boiling point is linear and are given 2 points on that line.
Use the two points to fi nd an equation for the boiling point as a function of altitude and then substitute 2500 for the altitude to fi nd the boiling point.
m 5y2 2 y1x2 2 x1
20.0018
either (8000, 197.6) or (4500, 203.9)
substitution
Substitute 2500 for a and solve for b.
Answers may vary. Sample: b 5 20.0018a 1 212
207.58 F
g
Problem
A line passes through (21, 3) and has slope 22. What is an equation of the line? Justify your steps.
y 2 y1 5 m(x 2 x1) Use the point-slope form.
y 2 3 5 22fx 2 (21)g Substitute (21, 3) for (x1, y1) and 22 for m.
y 2 3 5 22(x 1 1) Simplify inside grouping symbols.
Exercises
A line passes through (23, 4) and has slope 12. What is an equation of the line? Justify your steps.
y 2 y1 5 m(x 2 x1) __________________________________________
y 2 4 512 fx 2 (23)g __________________________________________
y 2 4 512(x 1 3) __________________________________________
A line passes through (2, 25) and has slope 14. What is an equation of the line? Justify your steps.
y 2 y1 5 m(x 2 x1) __________________________________________
__________________________________________
__________________________________________
5-4 ELL SupportPoint - Slope Form
Use the point-slope form.
Substitute (21, 4) for (x1, y1) and 12 for m.
Simplify inside grouping symbols.
Use the point slope form.
y 2 (25) 5 14(x 2 2)
y 1 5 5 14(x 2 2)
Substitute (2, 25) for (x1, y1) and 14 for m.
Simplify inside grouping symbols.
g
5-3 Reteaching (continued)
Slope-Intercept Form
Exercises
Find the slope and y-intercept of the graph of each equation.
1. y 512 x 1 7 2. y 5 25x 1 1 3. y 5 2
25 x 2 3
4. y 5 x 1 5 5. y 516 x 2 2 6. y 5 4x
Write an equation for the line with the given slope m and y-intercept b.
7. m 5 23, b 5 7 8. m 523, b 5 8 9. m 5 4, b 5 23
10. m 5 2 15, b 5 21 11. m 5 2
56, b 5 0 12. m 5 7, b 5 22
Write an equation in slope-intercept form for the line that passes through the given points.
13. (1, 3) and (2, 5) 14. (2,21) and (4, 0) 15. (1, 2) and (2,21)
16. (1,25) and (3,23) 17. (3, 3) and (6, 5) 18. (4,23) and (8,24)
19. Consider the equation y 5 22x 1 4. a. What is the y-intercept of the graph of the equation?
b. Graph the y-intercept.
c. What is the slope of the graph of the equation?
d. Use the point you graphed in part (b) and the slope to fi nd another point on the graph of the equation.
e. Graph the equation.
m 5 12 ; b 5 7
m 5 16 ; b 5 22
y 5 23 x 1 8
y 5 215x 2 1 y 5 25
6x
m 5 225 ; b 5 23m 5 25 ; b 5 1
y 5 23x 1 7
y 5 2x 1 1
4
22
Answers may vary. Sample: (1, 2)
See graph in part (b).
y 5 23x 1 5
y 5 x 2 6
y 5 12x 2 2
y 5 23x 1 1 y 5 21
4x 2 2
y 5 4x 2 3
y 5 7x 2 2
m 5 4 ; b 5 0m 5 1 ; b 5 5
x
y
4
(0, 4)
848
8
4
8
4
O
g
5-3 ReteachingSlope-Intercept Form
Th e slope-intercept form of a linear equation is y 5 mx 1 b. In this equation, m is the slope and b is the y-intercept.
Problem
What are the slope and y-intercept of the graph of y 5 22x 2 3?
Th e equation is solved for y, but it is easier to determine the y-intercept if the right side is written as a sum instead of a diff erence.
y 5 22x 2 3
y 5 22x 1 (23) Write the subtraction as addition.
Th e slope is 22 and the y-intercept is 23.
Problem
What is an equation for the line with slope 23 and y-intercept 9?
When the slope and y-intercept are given, substitute the values into the slope-intercept form of a linear equation.
y 5 mx 1 b
y 523 x 1 9 Substitute 2
3 for m and 9 for b.
Problem
What is an equation in slope-intercept form for the line that passes through the points (1, 23) and (3, 1)?
Substitute the two given points into the slope formula to fi nd the slope of the line.
m 51 2 (23)
3 2 1 542 5 2
Th en substitute the slope and the coordinates of one of the points into the slope-intercept form to fi nd b.
y 5 mx 1 b Use slope-intercept form.
23 5 2(1) 1 b Substitute 2 for m, 1 for x, and 23 for y.
25 5 b Solve for b.
Substitute the slope and y-intercept into the slope-intercept form.
y 5 mx 1 b Use slope-intercept form.
y 5 2x 1 (25) Substitute 2 for m and 25 for b.

Prentice Hall Algebra 1 • Teaching ResourcesCopyright © by Pearson Education, Inc., or its affiliates. All Rights Reserved.
105
A N S W E R S
Page 35
Page 33 Page 34
Page 36g
5-4 Practice (continued) Form K
Point-Slope Form
Model the data in each table with a linear equation in slope-intercept form. What do the slope and y-intercept represent?
12. 13.
Write an equation in point-slope form of each line.
14. 15.
Write an equation in point-slope form of the line that passes through the given points. Th en write the equation in slope-intercept form.
16. (5, 1), (0, 2) 17. (22, 23), (4, 3)
18. (23, 22), (2, 3) 19. (2, 5), (8, 27)
20. Writing Describe how you would use the point-slope form to write the equation of a line that passes through the points (2, 3) and (21, 6) in slope-intercept form.
21. A restaurant’s goal is to serve 600 customers in 8 hours and 900 customers in 12 hours. Write an equation in point-slope form that represents the number of customers served per hour. What is the graph of the equation?
HoursWorked
MoneyEarned ($)
6
4
11
15
49
73.50
134.75
183.75
x
y
O2
2
2
2
TimeRunning (min)
Distance(mi)
40
20
60
100
2
4
6
10
x
y
O2
2
2
2
y 5 10x ; The slope represents the number of miles you run per hour. The y-intercept represents the number of miles you run at the time you start.
y 5 12.25x ; The slope represents how much money you are paid per hour and the y-intercept represents how much money you were paid for zero hours.
y 2 2 5 12 (x 2 2) y 1 2 5 21
3 (x 2 1)
y 2 2 5 215 (x 2 0); y 5 21
5 x 1 2
y 2 3 5 1(x 2 2); y 5 x 1 1
y 2 3 5 1(x 2 4); y 5 x 2 1
y 2 5 5 22(x 2 2); y 5 22x 1 9
First, use the slope formula to fi nd the slope: m 5 6 2 3
21 2 2 5323 5 21. Then, select one of the points to write the point-slope form
of the equation: y 2 6 5 21(x 1 1). Simplify the parentheses by multiplying 21.y 2 6 5 2x 2 1 Add 6 to each side. y 5 2x 1 5
x
y
2
200
400
600
800
4 6 8 10Hours
Cust
omer
Ser
ved
Oy 2 600 5 75(x 2 8)
g
5-4 Practice Form K
Point-Slope Form
Write an equation in point-slope form of the line that passes through the given point and has the given slope.
1. (1, 3); m 5 5 2. (22, 21); m 5 23 3. (4, 27); m 5 2 14
Graph each equation.
4. y 1 1 5 3(x 2 2) 5. y 2 4 5 21(x 1 2) 6. y 2 3 5 22(x 1 4)
Graph the line that passes through the given point and has the given slope m.
7. (21, 23); m 5 2 8. (23, 22); m 5 24 9. (22, 6); m 5 2 12
10. Open-Ended Write an equation in each of the following forms that has a
slope of 2 23.
a. point-slope form b. slope-intercept form
11. Writing Describe what you know about the graph of a line represented by the equation y 1 4 5 25(x 2 1).
y 2 3 5 5(x 2 1) y 1 1 5 23(x 1 2) y 1 7 5 214 (x 2 4)
4 2 4
2
4
2
4
x
y
O 2 4 2 4
2
4
2
4
x
y
O 2 4 2 4
2
4
2
4
x
y
O 2
4 2 4
2
4
2
4
x
y
O 2 16 8 16
8
16
8
16
x
y
O 8 8 4 8
4
8
4
8
x
y
O 4
Answers may vary. Sample:
y 2 1 5 223 (x 1 2) y 5 22
3 x
The line passes through the point (1, 24) and has a slope of 25.
g
P ti H ll G ld Al b 1 T hi R
5-4 Practice (continued) Form G
Point-Slope Form
Model the data in each table with a linear equation in slope-intercept form. What do the slope and y-intercept represent?
15. 16.
Graph the line that passes through the given point and has the given slope m.
17. (23, 24); m 5 6 18. (22, 1), m 5 23 19. (24, 22); m 512
20. Writing Describe what you know about the graph of a line represented by the
equation y 2 3 5 2 23(x 1 4).
21. Writing Describe how you would use the point-slope form to write the equation of a line that passes through the points (21, 4) and (23, 25) in slope-intercept form.
22. Writing Describe how linear data given in a table can help you write an equation of a line in slope-intercept form.
23. A sign says that 3 tickets cost $22.50 and that 7 tickets cost $52.50. Write an equation in point-slope form that represents the cost of tickets. What is the graph of the equation?
Time Flying(hr)
Distance fromAirport (mi)
2
4
6
8
3600
2700
1800
900
Time Washing(hr)
Cars washed
3
5
6
8
18
30
36
48
y 5 6x ; cars washed per hour, cars washed at start
y 5 2450x 1 4500; speed in mi/h, distance from airport at start
x
y
8 16816
16
8
16
8
Ox
y
4 848
8
4
8
4
O
x
y
2 424
4
2
4
2
O
The slope is 2 23 and it passes through the point (24, 3).
First fi nd the slope: 25 2 423 1 1 5
92 . Then use one point in the point-slope form of the
equation and simplify: y 5 92x 1 17
2
Find the slope using m 5y2 2 y1x2 2 x2
for any pair of rows in the table. Then substitute a
point (a, b) from any row into y 2 b 5 m(x 2 a) and simplify.
y 2 22.5 5 7.5(x 2 3)1020
30
50
40
60
70
21 3 54 6 7Ox
y
Tickets
Cost
($)
g
5-4 Practice Form G
Point-Slope Form
Write an equation of the line in slope-intercept form through the given point and with the given slope m.
1. (2, 1); m 5 3 2. (23, 25); m 5 22
3. (24, 11); m 534 4. (0, 23); m 5 2
23
Graph each equation.
5. y 2 2 5 2(x 1 3) 6. y 1 3 5 22(x 1 1) 7. y 1 1 5 235(x 1 5)
Write an equation in point-slope form for each line.
8. 9. 10.
Write an equation in point-slope form of the line through the given points. Th en write the equation in slope-intercept form.
11. (4, 0), (22, 1) 12. (23, 22), (5, 3) 13. (25, 1), (3, 4)
14. Open-Ended Write an equation of a line that has a slope of 2 12 in each form.
a. point-slope form b. slope-intercept form
xO
y4
2
2
4
2
4 2 4
(21, 23)
(24, 3)
y12
8
4
4
xO 48 84
(6, 4)(24, 9)
xO
y4
2
2
4
2
4 2 4
(3, 3)
(1, 23)
y 5 3x 2 5
y 5 34x 1 14
y 5 22x 2 11
y 5 223x 2 3
x
y
4 848
8
4
8
4
Ox
y
2 424
4
2
4
2
Ox
y
4 848
8
4
8
4
O
y 1 3 5 22(x 1 1) or y 2 3 5 22(x 1 4)
y 1 3 5 3(x 2 1) or y 2 3 5 3(x 2 3)
y 2 4 5 2 12(x 2 6) or
y 2 9 5 2 12(x 1 4)
Answers may vary.
Sample: y 2 1 5 2 12(x 1 5)
Answers may vary.
Sample: y 5 2 12x 2 3
2
y 2 0 5 2 16(x 2 4);
y 5 2 16x 1 2
3
y 2 1 5 38(x 1 5);
y 5 38x 1 27
8
y 1 2 5 58(x 1 3);
y 5 58x 2 1
8
Prentice Hall Algebra 1 • Teaching ResourcesCopyright © by Pearson Education, Inc., or its affiliates. All Rights Reserved.
106
A N S W E R S
Page 39
Page 37 Page 38
Page 40g
5-4 Reteaching (continued)
Point-Slope Form
You can use the point-slope form of an equation to help graph the equation. Th e point given by the point-slope form provides a place to start on the graph. Plot a point there. Th en use the slope from the point-slope form to locate another point in either direction. Th en draw a line through the points you have plotted.
Problem
What is the graph of the equation y 2 2 5 13(x 2 1)?
Th e equation is in point-slope form, so the line passes through (1, 2) and has a
slope of 13.
Plot the point (1, 2).
Use the slope, 13. From (1, 2), go up 1 unit
and then right 3 units. Draw a point.
Draw a line through the two points.
Because 13 52123, you can start at (1, 2) and go down 1 unit and to the left 3 units to
locate a third point on the line.
Exercises
Graph each equation.
7. y 2 3 5 2(x 1 1) 8. y 1 2 523(x 2 2) 9. y 2 4 5 2
12(x 1 1)
xO
y4
42
2
4
2
2 6
(1, 2)(4, 3)
rise 5 1run 5 3
x
y
4 848
8
4
8
4
Ox
y
4 848
8
4
8
4
Ox
y
4 848
8
4
8
4
O
g
5-4 ReteachingPoint-Slope Form
Th e point-slope form of a nonvertical linear equation is y 2 y1 5 m(x 2 x1). In this equation, m is the slope and (x1, y1) is a point on the graph of the equation.
Problem
A line passes through (5, 22) and has a slope 23. What is an equation for this line in point-slope form?
y 2 y1 5 m(x 2 x1) Use point-slope form.
y 2 (22) 5 23(x 2 5) Substitute (5, 22) for (x1, y1) and 23 for m.
y 1 2 5 23(x 2 5) Simplify.
Problem
A line passes through (1, 4) and (2, 9). What is an equation for this line in point-slope form? What is an equation for this line in slope-intercept form?First use the two given points to fi nd the slope.
m 59 2 42 2 1 5
51 5 5
Use the slope and one point to write an equation in point-slope form.
y 2 y1 5 m(x 2 x1) Use point-slope form
y 2 4 5 5(x 2 1) Substitute (1, 4) for (x1, y1) and 5 for m.
y 2 4 5 5x 2 5 Distributive Property
y 5 5x 2 1 Add 4 to each side.An equation in point-slope form is y 2 4 5 5(x 2 1). An equation in slope-intercept form is y 5 5x 2 1.
Exercises
Write an equation for the line through the given point and with the given slope m.
1. (21, 3); m 5 214 2. (7, 25); m 5 4 3. (22, 25); m 5
23
Write an equation in point-slope form of the line through the given points. Th en write the equation in slope-intercept form.
4. (1, 4) and (2, 7) 5. (2, 0) and (3, 22) 6. (4, 25) and (22, 22)
y 2 3 5 2 14 (x 1 1) y 1 5 5 4(x 2 7) y 1 5 5 2
3 (x 1 2)
y 2 4 5 3(x 2 1) or y 2 7 5 3(x 2 2);y 5 3x 1 1
y 5 22(x 2 2) or y 1 2 5 22(x 2 3); y 5 22x 1 4
y 1 5 5 2 12 (x 2 4) or
y 1 2 5 2 12 (x 1 2);
y 5 2 12 x 2 3
g
5-4 EnrichmentPoint-Slope Form
Point-slope form can be used to quickly write the equation of a line when given one point on the line and the slope of the line. If two points are given, there is an additional step of determining the slope between those two points.
Th ere are special cases for which the equation of a line can be written quickly.
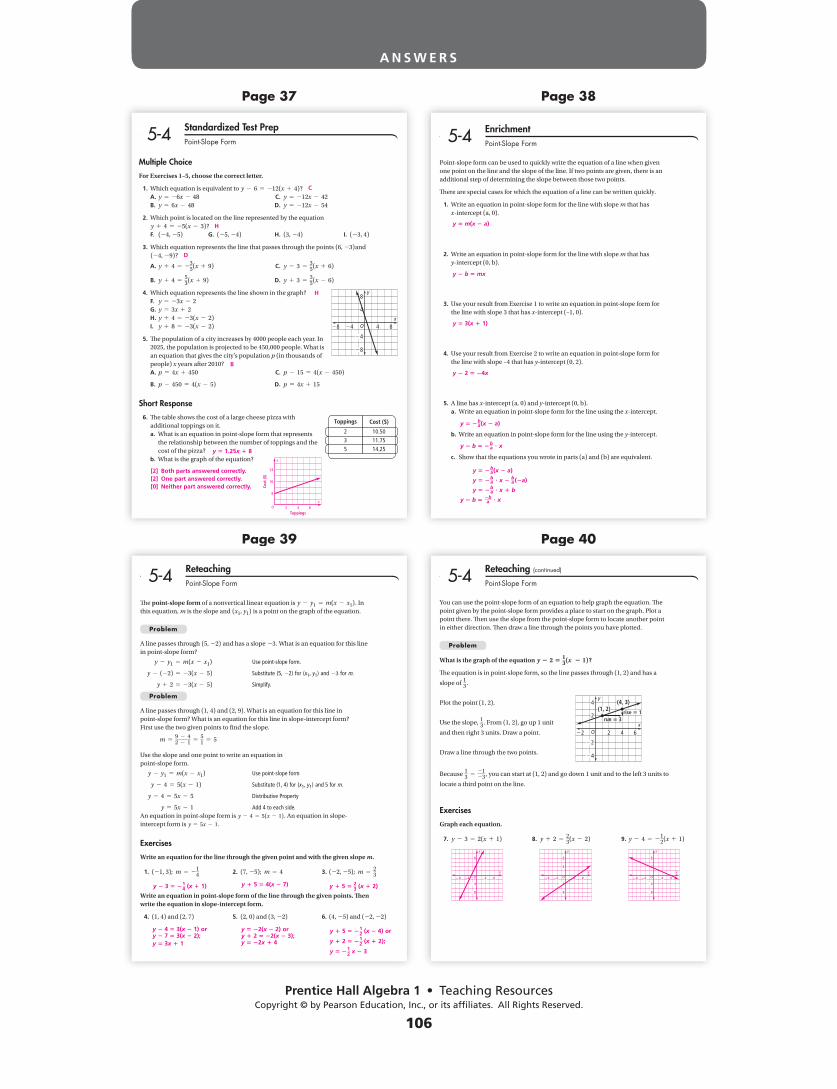
1. Write an equation in point-slope form for the line with slope m that has x-intercept (a, 0).
2. Write an equation in point-slope form for the line with slope m that has y-intercept (0, b).
3. Use your result from Exercise 1 to write an equation in point-slope form for the line with slope 3 that has x-intercept (–1, 0).
4. Use your result from Exercise 2 to write an equation in point-slope form for the line with slope –4 that has y-intercept (0, 2).
5. A line has x-intercept (a, 0) and y-intercept (0, b). a. Write an equation in point-slope form for the line using the x-intercept.
b. Write an equation in point-slope form for the line using the y-intercept.
c. Show that the equations you wrote in parts (a) and (b) are equivalent.
y 5 m(x 2 a)
y 5 3(x 1 1)
y 2 2 5 24x
y 5 2 ba(x 2 a)
y 2 b 5 2 ba ? x
y 5 2 ba(x 2 a)
y 5 2 ba ? x 2 b
a (2a)
y 5 2 ba ? x 1 b
y 2 b 5 2ba ? x
y 2 b 5 mx
g
5-4 Standardized Test PrepPoint-Slope Form
Multiple Choice
For Exercises 1–5, choose the correct letter.
1. Which equation is equivalent to y 2 6 5 212(x 1 4)? A. y 5 26x 2 48 C. y 5 212x 2 42 B. y 5 6x 2 48 D. y 5 212x 2 54
2. Which point is located on the line represented by the equation y 1 4 5 25(x 2 3)?
F. (24, 25) G. (25, 24) H. (3, 24) I. (23, 4)
3. Which equation represents the line that passes through the points (6, 23)and (24, 29)?
A. y 1 4 5 235(x 1 9) C. y 2 3 5
35(x 1 6)
B. y 1 4 553(x 1 9) D. y 1 3 5
35(x 2 6)
4. Which equation represents the line shown in the graph? F. y 5 23x 2 2 G. y 5 3x 1 2 H. y 1 4 5 23(x 2 2) I. y 1 8 5 23(x 2 2)
5. Th e population of a city increases by 4000 people each year. In 2025, the population is projected to be 450,000 people. What is an equation that gives the city’s population p (in thousands of people) x years after 2010?
A. p 5 4x 1 450 C. p 2 15 5 4(x 2 450)
B. p 2 450 5 4(x 2 5) D. p 5 4x 1 15
Short Response
6. Th e table shows the cost of a large cheese pizza with additional toppings on it.
a. What is an equation in point-slope form that represents the relationship between the number of toppings and the cost of the pizza?
b. What is the graph of the equation?
Cost ($)Toppings
235
10.5011.7514.25
xO
y8
4
4
8
4
8 4 8
C
H
D
H
B
[2] Both parts answered correctly.[2] One part answered correctly.[0] Neither part answered correctly.
y 5 1.25x 1 8
8
16
24
2 4 6Ox
y
Toppings
Cost
($)
Prentice Hall Algebra 1 • Teaching ResourcesCopyright © by Pearson Education, Inc., or its affiliates. All Rights Reserved.
107
A N S W E R S
Page 43
Page 41 Page 42
Page 44g
Write each equation in standard form using integers.
21. y 5 x 2 4 22. y 2 4 5 5(x 2 8)
23. y 1 6 5 23(x 1 1) 24. y 5 235 x 1 2
25. y 512 x 2 10 26. y 2 3 5 2
79 (x 1 4)
27. You have only nickels and dimes in your piggy bank. When you ran the coins through a change counter, it indicated you have 595 cents. Write and graph an equation that represents this situation. What are three combinations of nickels and dimes you could have?
For each graph, fi nd the x- and y-intercepts. Th en write an equation in standard form using integers.
28. 29.
Find the x- and y-intercepts of the line that passes through the given points.
30. (4, 22), (5, 24) 31. (1, 1), (25, 7) 32. (23, 2), (24, 10)
5-5 Practice (continued) Form G
Standard Form
x 2 y 5 4
3x 1 y 5 29
x 2 2y 5 20
5n 1 10d 5 595
Answers may vary. Sample: 11 nickels and 54 dimes; 21 nickels and 49 dimes; 45 nickels and 37 dimes
5x 2 y 5 36
3x 1 5y 5 10
7x 1 9y 5 21
40
80
120
20 40 60Od
n
Dimes
Nic
kels
xO
y4
2
2
4
2
4 2 4x
O
y4
2
2
4
2
4 2 4
3; 22; 2x 2 3y 5 6 2; 1;x 1 2y 5 2
3; 6 2; 2 2 114 ; 222
g
Find the x- and y-intercepts of the graph of each equation.
1. x 1 y 5 7 2. x 2 3y 5 9
3. 2x 1 3y 5 26 4. 24x 2 2y 5 28
5. 5x 2 4y 5 212 6. 22x 1 7y 5 11
Draw a line with the given intercepts.
7. x-intercept: 4 8. x-intercept: 23 9. x-intercept: 26 y-intercept: 5 y-intercept: 1 y-intercept: 28
Graph each equation using x- and y-intercepts.
10. 25x 1 y 5 210 11. 23x 2 6y 5 12 12. 4x 2 12y 5 224
For each equation, tell whether its graph is a horizontal or a vertical line.
13. y 5 22 14. x 5 0 15. y 5 20.25 16. x 5 235
Graph each equation.
17. y 5 6 18. x 5 22 19. y 5 27 20. x 5 3
5-5 Practice Form G
Standard Form
7; 7
23; 22
2 125 ; 3
9; 23
2; 4
2112 ;
117
x
y
2 424
4
2
4
2
O
x
y
4 848
8
4
8
4
O
x
y
2 424
4
2
4
2
Ox
y
4 848
8
4
8
4
O
x
y
4 848
8
4
8
4
Ox
y
4 848
8
4
8
4
O
x
y
4 848
8
4
8
4
Ox
y
2 424
4
2
4
2
Ox
y
4 848
8
4
8
4
Ox
y
2 424
4
2
4
2
O
horizontal vertical horizontal vertical
g
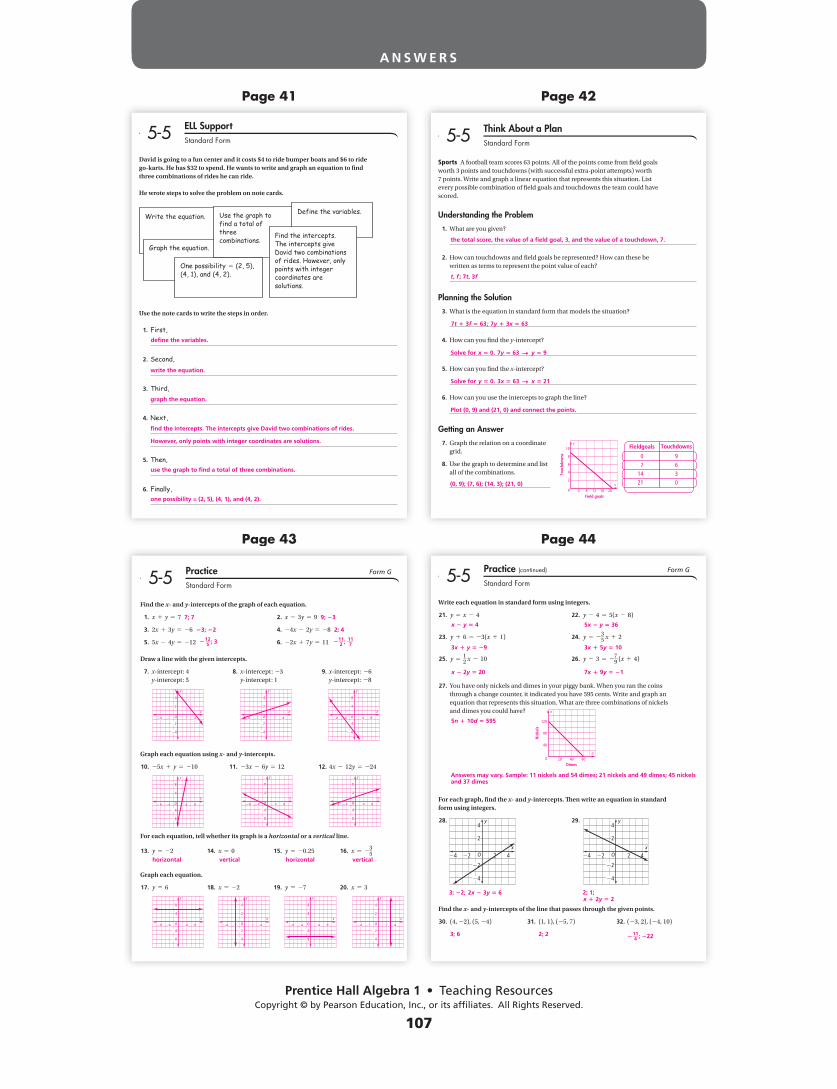
Sports A football team scores 63 points. All of the points come from fi eld goals worth 3 points and touchdowns (with successful extra-point attempts) worth 7 points. Write and graph a linear equation that represents this situation. List every possible combination of fi eld goals and touchdowns the team could have scored.
Understanding the Problem
1. What are you given?
2. How can touchdowns and fi eld goals be represented? How can these be written as terms to represent the point value of each?
Planning the Solution
3. What is the equation in standard form that models the situation?
4. How can you fi nd the y-intercept?
5. How can you fi nd the x-intercept?
6. How can you use the intercepts to graph the line?
Getting an Answer
7. Graph the relation on a coordinate grid.
8. Use the graph to determine and list all of the combinations.
5-5 Think About a PlanStandard Form
the total score, the value of a fi eld goal, 3, and the value of a touchdown, 7.
t, f ; 7t, 3f
7t 1 3f 5 63; 7y 1 3x 5 63
(0, 9); (7, 6); (14, 3); (21, 0)
Solve for x 5 0. 7y 5 63 m y 5 9
Solve for y 5 0. 3x 5 63 m x 5 21
Plot (0, 9) and (21, 0) and connect the points.
2
4
6
8
10
4 8 1612 20Ox
y
Field goals
Touc
hdow
ns
Fieldgoals Touchdowns
9
6
3
0
0
7
21
14
g
David is going to a fun center and it costs $4 to ride bumper boats and $6 to ride go-karts. He has $32 to spend. He wants to write and graph an equation to fi nd three combinations of rides he can ride.
He wrote steps to solve the problem on note cards.
Write the equation.
Graph the equation.
One possibility 5 (2, 5), (4, 1), and (4, 2).
Use the graph to find a total of three combinations.
Define the variables.
Find the intercepts. The intercepts give David two combinations of rides. However, only points with integer coordinates are solutions.
Use the note cards to write the steps in order.
1. First,
2. Second,
3. Third,
4. Next,
5. Then,
6. Finally,
5-5 ELL SupportStandard Form
defi ne the variables.
write the equation.
graph the equation.
fi nd the intercepts. The intercepts give David two combinations of rides.
However, only points with integer coordinates are solutions.
use the graph to fi nd a total of three combinations.
one possibility = (2, 5), (4, 1), and (4, 2).

Prentice Hall Algebra 1 • Teaching ResourcesCopyright © by Pearson Education, Inc., or its affiliates. All Rights Reserved.
108
A N S W E R S
Page 45
Page 47
Page 46
Page 48
g
5-5 Practice (continued) Form K
Standard Form
17. Writing Explain how y 2 2 5 2(x 1 6) can be rewritten into standard form. Th en show your work in transforming the equation to standard form.
Write each equation in standard form using integers.
18. y 5 x 1 6 19. y 1 5 5 2(x 1 3)
20. y 2 1 5 2 12 (x 2 4) 21. y 5 2
23 x 1 6
22. You work two jobs. At the fi rst job, you earn $10 per hour. At the second job, you earn $12 per hour. You earned $440 last week. Write and graph an equation that represents this situation. What are three combinations of hours you could have worked at each job?
23. Mike was the kicker for the football team. He scored 56 points during the season kicking fi eld goals (3 points) and extra points (1 point). Write and graph an equation that represents this situation. What are three combinations of fi eld goals x and extra points y he could have made?
For each graph, fi nd the x- and y-intercepts. Th en write an equation in standard form using integers.
24. 25.
Find the x- and y-intercepts of the line that passes through the given points.
26. (2, 22), (6, 24) 27. (21, 23), (4, 2)
x
y
O2
2
2
2
x
y
O4
4
4
4
x-intercept: 22; y-intercept: 3; 23x 1 2y 5 6
x-intercept: 2; y-intercept: 4; 2x 1 y 5 4
x-intercept: 22; y-intercept: 21 x-intercept: 2; y-intercept: 22
10x 1 12y 5 440
3x 1 y 5 56
2x 1 y 5 6 x 1 y 5 28
x 1 2y 5 6 2x 1 3y 5 18
x
y
10
10
20
30
40
20 30 40First Job ($10/hr)
Seco
nd J
ob ($
12/h
r)
O
x
y
10
20
40
60
20 30Extra point (1-pt)
Fiel
d G
oal (
1-pt
)
O
Simplify the parentheses and move x and y to the right side of the equation and the constants to the right side so that it is in the form Ax 1 By 5 C .
g
Each of the following equations is in standard form. Solve for y in terms of x and use the resulting equation to determine the slope of the graph of the equation.
1. 6y 2 4x 5 24 2. 3x 2 2y 5 8
3. 3y 1 x 5 26 4. 23y 1 5x 5 24
5. 29x 2 4y 5 12 6. 5y 2 x 5 20
Next, explore the relationship between the standard form of the equation and the concept of slope.
7. Solve the equation Ax 1 By 5 C for y.
8. What is the slope of the graph of the equation in terms of A and B?
9. Use the answer to Exercise 8 to fi nd the values for A and B and the slope of the graph of the equation 3x 1 4y 5 10.
Use the general standard form, Ax 1 By 5 C , to answer the following questions.
10. For what values of A, B, and C is the slope positive? negative?
11. For what values of A, B, and C is the absolute value of the slope greater than, less than, or equal to 1?
12. What is the general expression for the y-intercept?
5-5 EnrichmentStandard Form
y 5 23 x 1 4 ; 23 y 5 3
2 x 2 4 ; 32
y 5 2 13 x 2 2 ; 2
13
y 5 2 94 x 2 3 ; 2
94
y 5 2 AB x 1 C
B
2 AB
A 5 3, B 5 4, slope 5 2 34
The slope is positive if A is positive and B is negative, or if A is negative and B is positive. If both have the same sign, the slope is negative. C has no effect.
If uA u S uB u , then um u S 1. If uA u R uB u , then um u R 1. If uA u 5 uB u , then um u 5 1. C has no effect.
CB
y 5 15 x 1 4 ; 15
y 5 53 x 1
43 ; 53
g
Multiple Choice
For Exercises 1–4, choose the correct letter.
1. What is y 5 253 x 2 6 written in standard form using integers?
A. 53 x 1 y 5 26 B. 5x 1 3y 5 26 C. 5x 1 3y 5 218 D. 25x 1 3y 5 6
2. Which of the following is an equation of a vertical line? F. 4x 1 5y 5 0 G. 24 5 16x H. 3y 5 29 I. 4x 1 5y 5 21
3. What are the x- and y-intercepts of the graph of 27x 1 4y 5 214 A. x-intercept: 27 C. x-intercept: 22 y-intercept: 4 y-intercept: 3.5
B. x-intercept: 7 D. x-intercept: 2 y-intercept: 24 y-intercept: 23.5
4. Cheryl is planning to spend $75 on a Christmas gift for her father. He needs new socks and ties. A store has socks s and ties t on sale for $4 and $11, respectively. Which equation models this situation?
F. 4s 1 11t 5 75 H. s 5 15t 1 75
G. 11s 1 4t 5 75 I. t 5 4s 2 11
Extended Response
5. Th e grocery store is selling eggs for $2 per dozen and bacon for $5 per pound. You plan to spend $50 in food for the benefi t breakfast. Write and graph an equation that represents this situation. What are three combinations of dozens of eggs and pounds of bacon you can purchase?
5-5 Standardized Test PrepStandard Form
C
G
D
F
2e 1 5b 5 50;
Answers may vary. Sample: 5 dozen eggs and 8 lb bacon; 10 dozen eggs and 6 lb bacon; 15 dozen eggs and 4 lb bacon;
[2] All parts answered correctly.[1] One or two parts answered correctly.[0] No parts answered correctly.
10
20
30
10 20 30Oe
b
Eggs
Baco
n
g
5-5 Practice Form K
Standard Form
Find the x- and y-intercepts of the graph of each equation.
1. x 1 y 5 23 2. 2x 2 4y 5 28
3. x 1 5y 5 210 4. 23x 1 2y 5 12
Draw a line with the given intercepts.
5. x-intercept: 2 6. x-intercept: 24 y-intercept: 23 y-intercept: 22
Graph each equation using x- and y-intercepts.
7. 3x 1 y 5 22 8. 22x 1 y 5 1 9. x 2 y 5 4
10. 26x 1 y 5 24 11. 2x 2 3y 5 26 12. 6x 1 8y 5 24
For each equation, tell whether its graph is a horizontal or a vertical line.
13. x 5 21 14. y 5 5
Graph each equation.
15. x 5 25 16. y 5 6
x-intercept: 23; y-intercept: 23
x-intercept: 24; y-intercept: 2
x-intercept: 210; y-intercept: 22
x-intercept: 24; y-intercept: 6
4 2 4
2
4
2
4
x
y
O 2 4 2 4
2
4
2
4
x
y
O 2
4 2 4
2
4
2
4
x
y
O 2 4 2 4
2
4
2
4
x
y
O 2 8 4 8
4
8
4
8
x
y
O 4
8 4 8
4
8
4
8
x
y
O 4 4 2 4
2
4
2
4
x
y
O 2 4 2 4
2
4
2
4
x
y
O 2
vertical horizontal
8 4 8
4
8
4
8
x
y
O 4 8 4 8
4
8
4
8
x
y
O 4

Prentice Hall Algebra 1 • Teaching ResourcesCopyright © by Pearson Education, Inc., or its affiliates. All Rights Reserved.
109
A N S W E R S
Page 52
Page 49
Page 51
Page 50
g
Agriculture Two farmers use combines to harvest corn from their fi elds. One farmer has 600 acres of corn, and the other has 1000 acres of corn. Each farmer’s combine can harvest 100 acres per day. Write two equations for the number of acres y of corn not harvested after x days. Are the graphs of the equations parallel, perpendicular, or neither? How do you know?
Understanding the Problem
1. What is the diff erence between the two farms? What is the same?
2. How can you determine if the graphs of two equations are parallel, perpendicular, or neither?
Planning the Solution
3. What is an algebraic expression that represents the amount of corn each farmer can harvest per day?
4. Write an equation representing the number of acres y of corn not harvested after x days on the farm with 600 acres.
5. Write an equation representing the number of acres y of corn not harvested after x days on the farm with 1000 acres.
Getting an Answer
6. Write the equations in Steps 4 and 5 in slope-intercept form.
7. What are the slopes of the equations?
8. Are the graphs of the equations parallel, perpendicular, or neither? Explain.
5-6 Think About a PlanParallel and Perpendicular Lines
y 5 1000 2 100x
y 5 2100x 1 600; y 5 2100x 1 1000
both are 2100
parallel, because they have the same slope
The number of acres of corn are different; the number of acres a combine can harvest each day is the same.
They are parallel if they have the same slope, perpendicular if the slopes are opposite inverses.
100x
y 5 600 2 100x
g
Use the list below to complete the Venn diagram.
A vertical line and a horizontal line
Equation can be written in slope-intercept form
Lines in the same plane that never intersect
Lines that intersect to form right angles
Nonvertical lines that have the same slope and diff erent y-intercepts
Slopes are opposite reciprocals.
Two nonvertical lines that have a product of 21 for their slopes
You can determine the relationship between two lines by comparing their slopes and y-intercepts.
Vertical lines that have diff erent x-intercepts
5-6 ELL SupportParallel and Perpendicular Lines
Parallel Lines Perpendicular Lines
Lines in the same plane
that never intersect;
Nonvertical lines that have
the same slope and
different y-intercepts;
Vertical lines that have
different x-intercepts
You
can determine
the relationship
between two lines
by comparing their
slopes and
y-intercepts.
Equation can be
written in slope-
intercept
form
Lines that intersect to form
right angles;
Two nonvertical lines that
have a product of 21 for
their slopes;
A vertical line and a
horizontal line;
Slopes are opposite
reciprocals.
g
You can graph linear equations in standard form by plotting the x- and y-intercepts.
Problem
What is the graph of 2x 2 y 5 4?
Find the intercepts.
2x 2 y 5 4
2x 2 (0) 5 4
2x 5 4
x 5 2
2x 2 y 5 4
2(0) 2 y 5 4
2y 5 4
y 5 24
Th e x-intercept is 2, and the y-intercept is 24. Plot the x- and y-intercepts and draw a line through the points.
Exercises
Graph each equation using x- and y-intercepts.
11. x 1 y 5 3 12. 2x 2 3y 5 6 13. x 1 2y 5 24
14. 23x 1 4y 5 12 15. 5x 2 3y 5 15 16. 5x 1 2y 5 210
5-5 Reteaching (continued)
Standard Form
xO
y4
2
2
4
2
4 2 4
(0, 24)
(2, 0)
x
y
2 424
4
2
4
2
O
x
y
2 424
4
2
4
2
O
x
y
2 424
4
2
4
2
Ox
y
2 424
4
2
4
2
O
x
y
2 424
4
2
4
2
Ox
y
2 424
4
2
4
2
O
g
Th e standard form of a linear equation is Ax 1 By 5 C , where A, B, and C are real numbers, and A and B are not both zero. You can easily determine the x- and y-intercepts of the graph from this form of the equation.
Each intercept occurs when one coordinate is 0. When substituting 0 for either of x or y, one of the terms on the left side of the standard form equation disappears. Th is leaves a linear equation in one variable, with a variable term on the left and a constant on the right. Determining the other coordinate of the intercept requires only multiplication or division.
Problem
What are the x- and y-intercepts of the graph of 6x 2 9y 5 18?
First fi nd the x-intercept.
6x 2 9y 5 18
6x 2 9(0) 5 18 Substitute 0 for y.
6x 5 18 Simplify.
x 5 3 Divide each side by 6.
Th en fi nd the y-intercept.
6x 2 9y 5 18
6(0) 2 9y 5 18 Substitute 0 for x.
29y 5 18 Simplify.
y 5 22 Divide each side by 29.
Th e x-intercept is 3 and the y-intercept is 22.
Exercises
Find the x- and y-intercepts of the graph of each equation.
1. x 2 y 5 12 2. 3x 1 2y 5 12 3. 27x 1 3y 5 42
4. 8x 2 6y 5 24 5. 5x 2 4y 5 240 6. 24x 1 y 5 28
7. 6x 1 3y 5 230 8. 7x 2 2y 5 28 9. 8x 1 2y 5 232
10. Write an equation in standard form with an x-intercept of 5 and a y-intercept of 24.
5-5 ReteachingStandard Form
12; 212
3; 24
25; 210
4x 2 5y 5 20
4; 6
28; 10
4; 214
26; 14
27, 28
24; 216
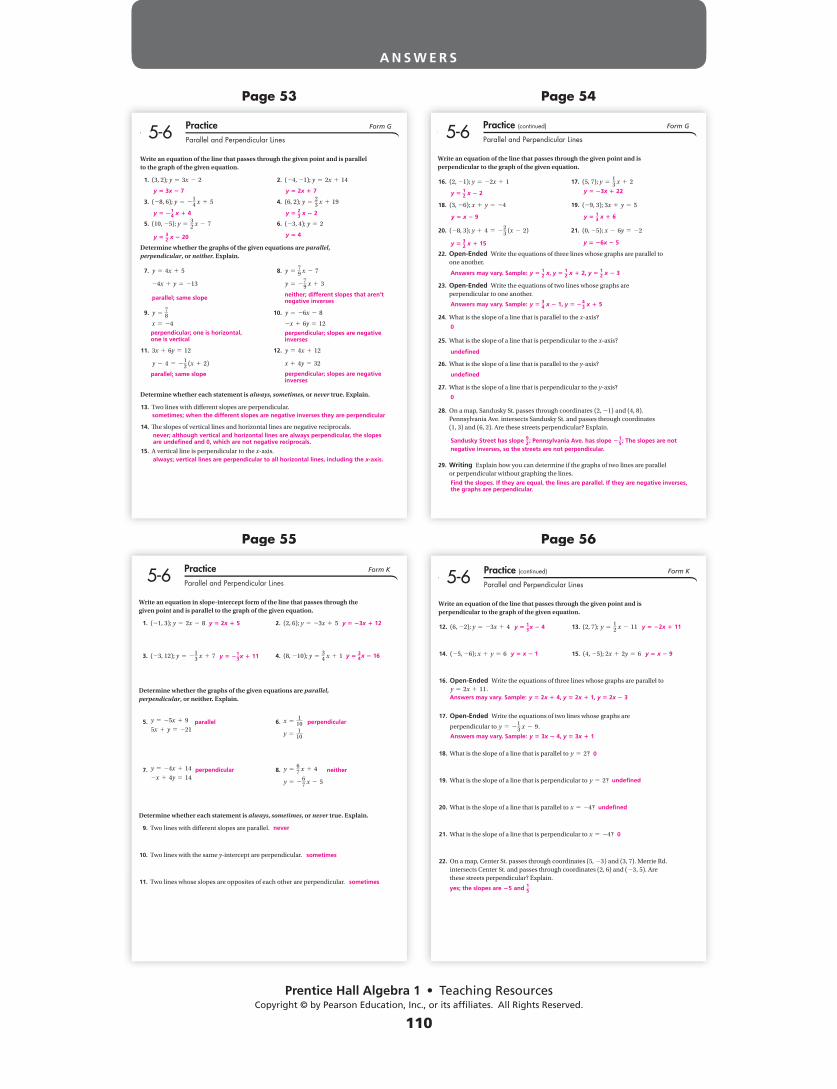
Prentice Hall Algebra 1 • Teaching ResourcesCopyright © by Pearson Education, Inc., or its affiliates. All Rights Reserved.
110
A N S W E R S
Page 53
Page 55
Page 54
Page 56g
5-6 Practice (continued) Form K
Parallel and Perpendicular Lines
Write an equation of the line that passes through the given point and is perpendicular to the graph of the given equation.
12. (6, 22); y 5 23x 1 4 13. (2, 7); y 512 x 2 11
14. (25, 26); x 1 y 5 6 15. (4, 25); 2x 1 2y 5 6
16. Open-Ended Write the equations of three lines whose graphs are parallel to y 5 2x 1 11.
17. Open-Ended Write the equations of two lines whose graphs are
perpendicular to y 5 2 13 x 2 9.
18. What is the slope of a line that is parallel to y 5 2?
19. What is the slope of a line that is perpendicular to y 5 2?
20. What is the slope of a line that is parallel to x 5 24?
21. What is the slope of a line that is perpendicular to x 5 24?
22. On a map, Center St. passes through coordinates (5, 23) and (3, 7). Merrie Rd. intersects Center St. and passes through coordinates (2, 6) and (23, 5). Are these streets perpendicular? Explain.
Answers may vary. Sample: y 5 2x 1 4, y 5 2x 1 1, y 5 2x 2 3
Answers may vary. Sample: y 5 3x 2 4, y 5 3x 1 1
yes; the slopes are 25 and 15
y 5 13 x 2 4 y 5 22x 1 11
y 5 x 2 1
0
undefi ned
undefi ned
0
y 5 x 2 9
g
5-6 Practice Form K
Parallel and Perpendicular Lines
Write an equation in slope-intercept form of the line that passes through the given point and is parallel to the graph of the given equation.
1. (21, 3); y 5 2x 2 8 2. (2, 6); y 5 23x 1 5
3. (23, 12); y 5 2 13 x 1 7 4. (8, 210); y 5
34 x 1 1
Determine whether the graphs of the given equations are parallel, perpendicular, or neither. Explain.
5. y 5 25x 1 9
5x 1 y 5 221 6. x 5
110
y 51
10
7. y 5 24x 1 14
2x 1 4y 5 14 8. y 5
67 x 1 4
y 5 2 67 x 2 5
Determine whether each statement is always, sometimes, or never true. Explain.
9. Two lines with diff erent slopes are parallel.
10. Two lines with the same y-intercept are perpendicular.
11. Two lines whose slopes are opposites of each other are perpendicular.
y 5 2x 1 5 y 5 23x 1 12
y 5 213 x 1 11
parallel perpendicular
perpendicular neither
never
sometimes
sometimes
y 5 34 x 2 16
g
Write an equation of the line that passes through the given point and is perpendicular to the graph of the given equation.
16. (2, 21); y 5 22x 1 1 17. (5, 7); y 513 x 1 2
18. (3, 26); x 1 y 5 24 19. (29, 3); 3x 1 y 5 5
20. (28, 3); y 1 4 5 2 23 (x 2 2) 21. (0, 25); x 2 6y 5 22
22. Open-Ended Write the equations of three lines whose graphs are parallel to one another.
23. Open-Ended Write the equations of two lines whose graphs are perpendicular to one another.
24. What is the slope of a line that is parallel to the x-axis?
25. What is the slope of a line that is perpendicular to the x-axis?
26. What is the slope of a line that is parallel to the y-axis?
27. What is the slope of a line that is perpendicular to the y-axis?
28. On a map, Sandusky St. passes through coordinates (2, 21) and (4, 8). Pennsylvania Ave. intersects Sandusky St. and passes through coordinates (1, 3) and (6, 2). Are these streets perpendicular? Explain.
29. Writing Explain how you can determine if the graphs of two lines are parallel or perpendicular without graphing the lines.
5-6 Practice (continued) Form G
Parallel and Perpendicular Lines
y 5 12 x 2 2
y 5 13 x 1 6
y 5 32 x 1 15
y 5 23x 1 22
y 5 x 2 9
Answers may vary. Sample: y 5 12 x, y 5 1
2 x 1 2, y 5 12 x 2 3
Answers may vary. Sample: y 5 34 x 2 1, y 5 2
43 x 1 5
0
0
Sandusky Street has slope 92; Pennsylvania Ave. has slope 2 15; The slopes are not
negative inverses, so the streets are not perpendicular.
Find the slopes. If they are equal, the lines are parallel. If they are negative inverses, the graphs are perpendicular.
undefi ned
undefi ned
y 5 26x 2 5
g
Write an equation of the line that passes through the given point and is parallel to the graph of the given equation.
1. (3, 2); y 5 3x 2 2 2. (24, 21); y 5 2x 1 14
3. (28, 6); y 5 2 14 x 1 5 4. (6, 2); y 5
23 x 1 19
5. (10, 25); y 532 x 2 7 6. (23, 4); y 5 2
Determine whether the graphs of the given equations are parallel, perpendicular, or neither. Explain.
7. y 5 4x 1 5 8. y 579 x 2 7
24x 1 y 5 213 y 5 2 79 x 1 3
9. y 578 10. y 5 26x 2 8
x 5 24 2x 1 6y 5 12
11. 3x 1 6y 5 12 12. y 5 4x 1 12
y 2 4 5 2 12 (x 1 2) x 1 4y 5 32
Determine whether each statement is always, sometimes, or never true. Explain.
13. Two lines with diff erent slopes are perpendicular.
14. Th e slopes of vertical lines and horizontal lines are negative reciprocals.
15. A vertical line is perpendicular to the x-axis.
5-6 Practice Form G
Parallel and Perpendicular Lines
y 5 3x 2 7
y 5 2 14 x 1 4
y 5 32 x 2 20
y 5 2x 1 7
y 5 4
parallel; same slope
perpendicular; one is horizontal, one is vertical
parallel; same slope
sometimes; when the different slopes are negative inverses they are perpendicular
never; although vertical and horizontal lines are always perpendicular, the slopes are undefi ned and 0, which are not negative reciprocals.
always; vertical lines are perpendicular to all horizontal lines, including the x-axis.
neither; different slopes that aren’t negative inverses
perpendicular; slopes are negative inverses
perpendicular; slopes are negative inverses
y 5 23 x 2 2
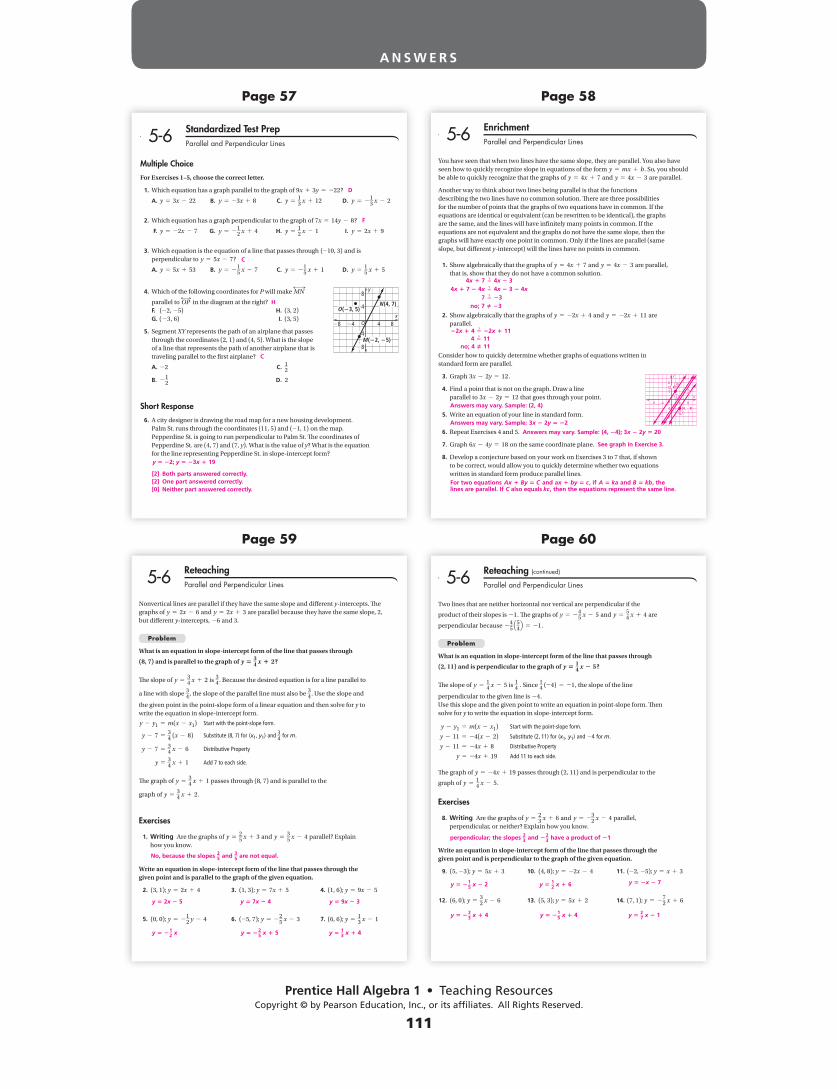
Prentice Hall Algebra 1 • Teaching ResourcesCopyright © by Pearson Education, Inc., or its affiliates. All Rights Reserved.
111
A N S W E R S
Page 57
Page 59
Page 58
Page 60g
Two lines that are neither horizontal nor vertical are perpendicular if the
product of their slopes is 21. Th e graphs of y 5 2 45 x 2 5 and y 5
54 x 1 4 are
perpendicular because 2 45 Q
54R 5 21.
Problem
What is an equation in slope-intercept form of the line that passes through
(2, 11) and is perpendicular to the graph of y 5 14 x 2 5?
Th e slope of y 514 x 2 5 is 14 . Since 14 (24) 5 21, the slope of the line
perpendicular to the given line is 24.Use this slope and the given point to write an equation in point-slope form. Th en solve for y to write the equation in slope-intercept form.
y 2 y1 5 m(x 2 x1) Start with the point-slope form.
y 2 11 5 24(x 2 2) Substitute (2, 11) for (x1, y1) and 24 for m.
y 2 11 5 24x 1 8 Distributive Property
y 5 24x 1 19 Add 11 to each side.
Th e graph of y 5 24x 1 19 passes through (2, 11) and is perpendicular to the
graph of y 514 x 2 5.
Exercises
8. Writing Are the graphs of y 523 x 1 6 and y 5 2
32 x 2 4 parallel,
perpendicular, or neither? Explain how you know.
Write an equation in slope-intercept form of the line that passes through the given point and is perpendicular to the graph of the given equation.
9. (5, 23); y 5 5x 1 3 10. (4, 8); y 5 22x 2 4 11. (22, 25); y 5 x 1 3
12. (6, 0); y 532 x 2 6 13. (5, 3); y 5 5x 1 2 14. (7, 1); y 5 2
72 x 1 6
5-6 Reteaching (continued)
Parallel and Perpendicular Lines
perpendicular; the slopes 23 and 2 23 have a product of 21
y 5 2 15 x 2 2
y 5 2 23 x 1 4 y 5 2
15 x 1 4 y 5 2
7 x 2 1
y 5 2x 2 7y 5 12 x 1 6
g
Nonvertical lines are parallel if they have the same slope and diff erent y-intercepts. Th e graphs of y 5 2x 2 6 and y 5 2x 1 3 are parallel because they have the same slope, 2, but diff erent y-intercepts, 26 and 3.
Problem
What is an equation in slope-intercept form of the line that passes through
(8, 7) and is parallel to the graph of y 5 34 x 1 2?
Th e slope of y 534 x 1 2 is 34. Because the desired equation is for a line parallel to
a line with slope 34, the slope of the parallel line must also be 34. Use the slope and
the given point in the point-slope form of a linear equation and then solve for y to write the equation in slope-intercept form.
y 2 y1 5 m(x 2 x1) Start with the point-slope form.
y 2 7 534 (x 2 8) Substitute (8, 7) for (x1, y1) and 34 for m.
y 2 7 534 x 2 6 Distributive Property
y 534 x 1 1 Add 7 to each side.
Th e graph of y 534 x 1 1 passes through (8, 7) and is parallel to the
graph of y 534 x 1 2.
Exercises
1. Writing Are the graphs of y 525 x 1 3 and y 5
35 x 2 4 parallel? Explain
how you know.
Write an equation in slope-intercept form of the line that passes through the given point and is parallel to the graph of the given equation.
2. (3, 1); y 5 2x 1 4 3. (1, 3); y 5 7x 1 5 4. (1, 6); y 5 9x 2 5
5. (0, 0); y 5 2 12 y 2 4 6. (25, 7); y 5 2
25 x 2 3 7. (6, 6); y 5
13 x 2 1
5-6 ReteachingParallel and Perpendicular Lines
No, because the slopes 25 and 35 are not equal.
y 5 7x 2 4 y 5 9x 2 3y 5 2x 2 5
y 5 2 12 x y 5 2
25 x 1 5 y 5 1
3 x 1 4
g
You have seen that when two lines have the same slope, they are parallel. You also have seen how to quickly recognize slope in equations of the form y 5 mx 1 b. So, you should be able to quickly recognize that the graphs of y 5 4x 1 7 and y 5 4x 2 3 are parallel.
Another way to think about two lines being parallel is that the functions describing the two lines have no common solution. Th ere are three possibilities for the number of points that the graphs of two equations have in common. If the equations are identical or equivalent (can be rewritten to be identical), the graphs are the same, and the lines will have infi nitely many points in common. If the equations are not equivalent and the graphs do not have the same slope, then the graphs will have exactly one point in common. Only if the lines are parallel (same slope, but diff erent y-intercept) will the lines have no points in common.
1. Show algebraically that the graphs of y 5 4x 1 7 and y 5 4x 2 3 are parallel, that is, show that they do not have a common solution.
2. Show algebraically that the graphs of y 5 22x 1 4 and y 5 22x 1 11 are parallel.
Consider how to quickly determine whether graphs of equations written in standard form are parallel.
3. Graph 3x 2 2y 5 12.
4. Find a point that is not on the graph. Draw a line parallel to 3x 2 2y 5 12 that goes through your point.
5. Write an equation of your line in standard form.
6. Repeat Exercises 4 and 5.
7. Graph 6x 2 4y 5 18 on the same coordinate plane.
8. Develop a conjecture based on your work on Exercises 3 to 7 that, if shown to be correct, would allow you to quickly determine whether two equations written in standard form produce parallel lines.
5-6 EnrichmentParallel and Perpendicular Lines
4x 1 7 0 4x 2 34x 1 7 2 4x 0 4x 2 3 2 4x 7 0 23 no; 7 u 23
22x 1 4 0 22x 1 11 4 0 11 no; 4 u 11
x
y
4 848
8
4
8
4
O
(2, 4)
(4, 24)6
3
4
7
Answers may vary. Sample: (2, 4)
Answers may vary. Sample: 3x 2 2y 5 22
Answers may vary. Sample: (4, 24); 3x 2 2y 5 20
See graph in Exercise 3.
For two equations Ax 1 By 5 C and ax 1 by 5 c , if A 5 ka and B 5 kb, the lines are parallel. If C also equals kc , then the equations represent the same line.
g
Multiple Choice
For Exercises 1–5, choose the correct letter.
1. Which equation has a graph parallel to the graph of 9x 1 3y 5 222?
A. y 5 3x 2 22 B. y 5 23x 1 8 C. y 513 x 1 12 D. y 5 2
13 x 2 2
2. Which equation has a graph perpendicular to the graph of 7x 5 14y 2 8?
F. y 5 22x 2 7 G. y 5 2 12 x 1 4 H. y 5
12 x 2 1 I. y 5 2x 1 9
3. Which equation is the equation of a line that passes through (210, 3) and is perpendicular to y 5 5x 2 7?
A. y 5 5x 1 53 B. y 5 2 15 x 2 7 C. y 5 2
15 x 1 1 D. y 5
15 x 1 5
4. Which of the following coordinates for P will make *MN)
parallel to *OP) in the diagram at the right?
F. (22, 25) H. (3, 2) G. (23, 6) I. (3, 5)
5. Segment XY represents the path of an airplane that passes through the coordinates (2, 1) and (4, 5). What is the slope of a line that represents the path of another airplane that is traveling parallel to the fi rst airplane?
A. 22 C. 12
B. 2 12 D. 2
Short Response
6. A city designer is drawing the road map for a new housing development. Palm St. runs through the coordinates (11, 5) and (21, 1) on the map. Pepperdine St. is going to run perpendicular to Palm St. Th e coordinates of Pepperdine St. are (4, 7) and (7, y). What is the value of y? What is the equation for the line representing Pepperdine St. in slope-intercept form?
5-6 Standardized Test PrepParallel and Perpendicular Lines
xO
y8
4
4
8
4
8 4 8
N(4, 7)
M(22, 25)
O(23, 5)
D
F
C
H
C
y 5 22; y 5 23x 1 19
[2] Both parts answered correctly.[2] One part answered correctly.[0] Neither part answered correctly.

Prentice Hall Algebra 1 • Teaching ResourcesCopyright © by Pearson Education, Inc., or its affiliates. All Rights Reserved.
112
A N S W E R S
Page 61
Page 63
Page 62
Page 64age 6
5-7 Practice (continued) Form G
Scatter Plots and Trend Lines
Use the table below and a graphing calculator for Exercises 7 through 10.
7. Make a scatter plot of the data pairs (years since 1999, revenue).
8. Draw the line of best fi t for the data.
9. Write an equation for the line of best fi t.
10. According to the data, what will the estimated gross revenue be in 2015?
In each situation, tell whether a correlation is likely. If it is, tell whether the correlation refl ects a causal relationship. Explain your reasoning.
11. the number of practice free throws you take and the number of free throws you make in a game
12. the height of a mountain and the average elevation of the state it is in
13. the number of hours worked and an employee’s wages
14. a drop in the price of a barrel of oil and the amount of gasoline sold
15. Open-Ended Describe a real world situation that would show a strong negative correlation. Explain your reasoning.
16. Writing Describe the diff erence between interpolation and extrapolation. Explain how both could be useful.
17. Writing Describe how the slope of a line relates to a trend line. What does the y-intercept represent?
Year
Gross Revenue(in million $)
1999 2000 2001 2002 2003 2004 2005 2006 2007
7500 7750 8370 9320 9300 9450 8960 9300 9680
Total Box Office Gross
SOURCE: WWW.mediabynumbers.com
yes; yes; practice should improve your game
yes; yes; when calculating average elevation of a state, the mountanin’s elevation is taken into account.
yes; yes; when gasoline is cheaper, people will buy more.
yes; yes; wages often depend on hours worked
Answers may vary. Sample: As the price of a product increases, sales of the product decrease.
Interpolation estimates values between two known values; extrapolation estimates values smaller or larger than all known values. Both help you estimate unknown values.
See points in graph
5000
10000
15000
20000
25000
4 8 12O
See graph in Exercise 7.
y 5 244.6x 1 7869
about $11,782,600,000
The slope of a trend line is the average rate of change for the data. The y-intercept is the estimated value for x 5 0.
age 63
5-7 Practice Form G
Scatter Plots and Trend Lines
For each table, make a scatter plot of the data. Describe the type of correlation the scatter plot shows.
1. 2.
Use the table below and a graphing calculator for Exercises 3 through 6.
3. Make a scatter plot of the data pairs (years since 1980, population).
4. Draw the line of best fi t for the data.
5. Write an equation for the trend line.
6. According to the data, what will the estimated resident population in Florida be in 2020?
Adult Tickets
Tickets Sold
Children Tickets
10 20 30 40 50
30 55 80 112 137
Test Score
Test Scores
Study Time (min)
76 85 83 97 92
33 52 49 101 65
Year
Population(in thousands)
1980 1990 1995 2000 2002 2003 2004 2005 2006
9746 12,938 14,538 15,983 16,682 16,982 17,367 17,768 18,090
Florida Resident Population
SOURCE: U.S. Census Bureau.
70
80
90
100
25 50 75O
Study Time (min)
Test
sco
re
5000
10000
15000
20000
25000
10 20 30O
40
60
100
140
20
80
120
10 40 5020 30 60 70O
Adult Tickets
Child
Tic
kets
See points in graph below.
See graph in Exercise 3.
Positive Positive
y 5 318x 1 9735
22,455 thousands, or 22,455,000 people
age 6
5-7 Think About a PlanScatter Plots and Trend Lines
U.S. Population Use the data below.
a. Make a scatter plot of the data pairs (male population, female population). b. Draw a trend line and write its equation. c. Use your equation to predict the U.S. female population if the U.S. male
population increases to 150,000,000. d. Reasoning Consider a scatter plot of the data pairs (year, male
population). Would it be reasonable to use this scatter plot to predict the U.S. male population in 2035? Explain your reasoning.
1. Make a scatter plot of the data pairs using the male population for the x-coordinates and the female population for the y-coordinates for each year.
2. Draw the trend line onto the scatter plot.
3. How do you determine the equation of a trend line? What is the equation of this trend line? Show your work.
4. Substitute 150,000,000 for x to predict the female population.
5. Make a scatter plot of the data pairs (year, male population).
6. Would it be reasonable to use this scatter plot to predict the U.S. male population in 2035? Explain your reasoning.
Year 2000 2001 2002 2003 2004 2005 2006
138,482 140,079 141,592 142,937 144,467 145,973 147,512
143,734 145,147 146,533 147,858 149,170 150,533 151,886
Male
Female
Estimated Population of the United States (thousands)
SOURCE: U.S. Census Bureau.
See points at right for scatter plot.
See graph in Exercise 1.
Choose 2 points on the line. Find the slope and use point-slope form; y 5 0.9x 1 19
154,000,000 females
142
144
146
150
148
152
138140142144 148146O
Males (Millions)
Fem
ales
(Mill
ions
)
The data go from x 5 0 to x 5 6; projecting to x 5 35 is a very
large extrapolation.
138
140
142
146
144
148
2 4 6O
Years after 2000
Mal
es (m
illio
ns)
age 6
Concept List
causal relationship correlation coeffi cient extrapolation
interpolation line of best fi t negative correlation
no correlation positive correlation trend line
Choose the concept from the list above that best represents the item in each box.
1. LinReg (ax 1 b) 2. 3.
4. 5. 6.
7.
Estimate the value for y when x 5 3.5.
8.
Estimate the value for y when x 5 1.5.
9.
5-7 ELL SupportScatter Plots and Trend Lines
0 x
y PracticeTime (hours)
Grade inBand Class
10 C
B20
40 A
0 x
y
StrongNegative
Correlation
StrongPositive
Correlation
NoCorrelation
r 5 21 r 5 0 r 5 1
0 x
y
3 4210
543210
3 4210
543210
0 x
y
line of best fi t
trend line
extrapolation interpolation negative correlation
correlation coeffi cient no correlation
positive correlation causal relationship
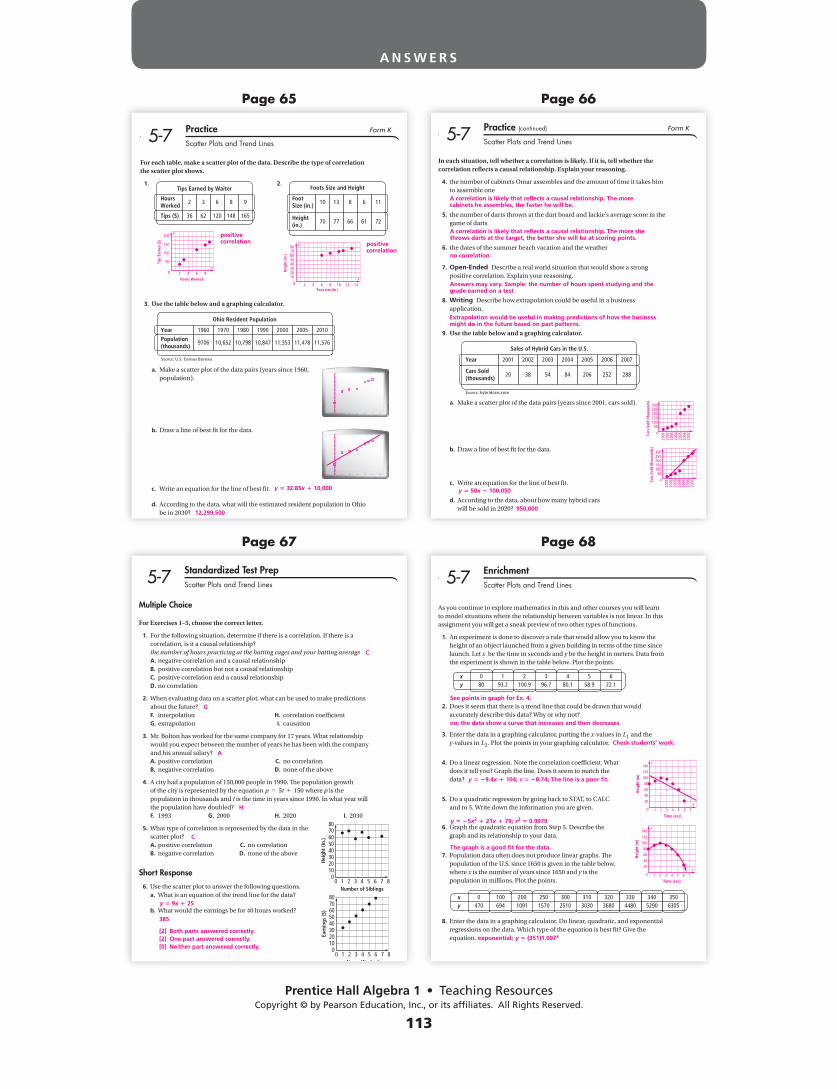
Prentice Hall Algebra 1 • Teaching ResourcesCopyright © by Pearson Education, Inc., or its affiliates. All Rights Reserved.
113
A N S W E R S
Page 65
Page 67
Page 66
Page 68age 68
As you continue to explore mathematics in this and other courses you will learn to model situations where the relationship between variables is not linear. In this assignment you will get a sneak preview of two other types of functions.
1. An experiment is done to discover a rule that would allow you to know the height of an object launched from a given building in terms of the time since launch. Let x be the time in seconds and y be the height in meters. Data from the experiment is shown in the table below. Plot the points.
2. Does it seem that there is a trend line that could be drawn that would accurately describe this data? Why or why not?
3. Enter the data in a graphing calculator, putting the x-values in L1 and the y-values in L2. Plot the points in your graphing calculator.
4. Do a linear regression. Note the correlation coeffi cient. What does it tell you? Graph the line. Does it seem to match the data?
5. Do a quadratic regression by going back to STAT, to CALC and to 5. Write down the information you are given.
6. Graph the quadratic equation from Step 5. Describe the graph and its relationship to your data.
7. Population data often does not produce linear graphs. Th e population of the U.S. since 1650 is given in the table below, where x is the number of years since 1650 and y is the population in millions. Plot the points.
8. Enter the data in a graphing calculator. Do linear, quadratic, and exponential regressions on the data. Which type of the equation is best fi t? Give the equation.
xy
0 1 2 3 4 5 680 93.2 100.9 96.7 80.1 58.9 22.1
xy
0 100 200 250 300 310 320470 694 1091 1570 2510 3030 3680
3304480
3405290
3506305
5-7 EnrichmentScatter Plots and Trend Lines
40
60
100
140
20
80
120
1 4 52 3 6 7Ox
y
Time (sec)
Hei
ght
(m)
40
60
100
140
20
80
120
1 4 52 3 6 7Ox
y
Time (sec)
Hei
ght
(m)
no; the data show a curve that increases and then decreases
See points in graph for Ex. 4.
Check students’ work.
y 5 29.4x 1 104; r 5 20.74; The line is a poor fi t.
y 5 25x2 1 21x 1 79; r2 5 0.9979
The graph is a good fi t for the data.
exponential; y 5 (351)1.007x
age 6
5-7 Standardized Test PrepScatter Plots and Trend Lines
Multiple Choice
For Exercises 1–5, choose the correct letter.
1. For the following situation, determine if there is a correlation. If there is a correlation, is it a causal relationship?the number of hours practicing at the batting cages and your batting average
A. negative correlation and a causal relationship B. positive correlation but not a causal relationship C. positive correlation and a causal relationship D. no correlation
2. When evaluating data on a scatter plot, what can be used to make predictions about the future?
F. interpolation H. correlation coeffi cient G. extrapolation I. causation
3. Mr. Bolton has worked for the same company for 17 years. What relationship would you expect between the number of years he has been with the company and his annual salary?
A. positive correlation C. no correlation B. negative correlation D. none of the above
4. A city had a population of 150,000 people in 1990. Th e population growth of the city is represented by the equation p 5 5t 1 150 where p is the population in thousands and t is the time in years since 1990. In what year will the population have doubled?
F. 1993 G. 2000 H. 2020 I. 2030
5. What type of correlation is represented by the data in the scatter plot?
A. positive correlation C. no correlation B. negative correlation D. none of the above
Short Response
6. Use the scatter plot to answer the following questions. a. What is an equation of the trend line for the data?
b. What would the earnings be for 40 hours worked?
20 1 3 5 70
1020304050607080
4 6 8Hours Worked
Earn
ings
($)
2 3 5 7100
1020304050607080
4 6 8Number of Siblings
Hei
ght
(in.)
C
G
A
H
C
y 5 9x 1 25
385
[2] Both parts answered correctly.[2] One part answered correctly.[0] Neither part answered correctly.
age 66
5-7 Practice (continued) Form K
Scatter Plots and Trend Lines
In each situation, tell whether a correlation is likely. If it is, tell whether the correlation refl ects a causal relationship. Explain your reasoning.
4. the number of cabinets Omar assembles and the amount of time it takes him to assemble one
5. the number of darts thrown at the dart board and Jackie’s average score in the game of darts
6. the dates of the summer beach vacation and the weather
7. Open-Ended Describe a real world situation that would show a strong positive correlation. Explain your reasoning.
8. Writing Describe how extrapolation could be useful in a business application.
9. Use the table below and a graphing calculator.
a. Make a scatter plot of the data pairs (years since 2001, cars sold).
b. Draw a line of best fi t for the data.
c. Write an equation for the line of best fi t.
d. According to the data, about how many hybrid cars will be sold in 2020?
Sales of Hybrid Cars in the U.S.
Cars Sold(thousands)
SOURCE: hybridcars.com
Year 2001 2002 2003 2004 2007
20 38 54 84
2005
206
2006
252 288
A correlation is likely that refl ects a causal relationship. The more cabinets he assembles, the faster he will be.
A correlation is likely that refl ects a causal relationship. The more she throws darts at the target, the better she will be at scoring points.
no correlation
Answers may vary. Sample: the number of hours spent studying and the grade earned on a test
Extrapolation would be useful in making predictions of how the business might do in the future based on past patterns.
2001
2002
2003
2004
2005
2006
2007
50100150200250300
Cars
Sol
d (t
hous
ands
)
O
2001
2002
2003
2004
2005
2006
2007
50100150200250300
Cars
Sol
d (t
hous
ands
)
O
y 5 50x 2 100,050
950,000
age 65
5-7 Practice Form K
Scatter Plots and Trend Lines
For each table, make a scatter plot of the data. Describe the type of correlation the scatter plot shows.
1. 2.
3. Use the table below and a graphing calculator.
a. Make a scatter plot of the data pairs (years since 1960, population).
b. Draw a line of best fi t for the data.
c. Write an equation for the line of best fi t.
d. According to the data, what will the estimated resident population in Ohio be in 2030?
Tips Earned by Waiter
HoursWorked
Tips ($)
2 3 6 8 9
36 62 120 148 165
Foots Size and Height
FootSize (in.)
Height(in.)
10 13 8 6 11
70 77 66 61 72
Ohio Resident Population
Population(thousands)
SOURCE: U.S. Census Bureau
Year 1960 1970 1980 1990 2010
9706 10,652 10,798 10,847
2000
11,353
2005
11,478 11,576
y 5 32.85x 1 10,000
12,299,500
positive correlation positive
correlation
x
y
2
50
100
150
200
4 6 8Hours Worked
Tips
Ear
nes
($)
O
x
y
2
20
40
60
80
10
30
50
70
4 6 8 10 12 14Foot size (in.)
Hei
ght
(in.)
O

Prentice Hall Algebra 1 • Teaching ResourcesCopyright © by Pearson Education, Inc., or its affiliates. All Rights Reserved.
114
A N S W E R S
Page 69
Page 71
Page 70
Page 72age
What point(s) do the graphs of y 5 2|x| 1 7 and y 5 |x 2 3| have in common?
Understanding the Problem
1. What is the parent function of both equations?
2. What shape is the graph of the parent function of both equations?
3. What transformations occur in y 5 2|x| 1 7?
4. What translations occur in y 5 |x 2 3||?
Planning the Solution
5. Could a table help you answer the question? Explain.
6. Could a graph help you answer the question? Explain.
7. Which method is better? Why?
Getting an Answer
8. Graph both equations on the same coordinate grid.
9. What point(s) do the graphs have in common?
5-8 Think About a PlanGraphing Absolute Value Functions
y 5 u x u
the shape of a V
refl ection over the x-axis, and vertical translation up 7
horizontal translation right 3
yes; make a table of y for u x u and the translated equation and fi gure out the change
in y-values
yes; Draw a graph and fi nd the points of intersection.
graphing; the points of intersection may not be in the table.
xO
y
4
4
8
4
4
8
88(22, 5) and (5, 2)
age
Use the chart below to review vocabulary. Th ese vocabulary words will help you complete this page.
Related Words Explanation Example
Translation trans LAY shun
Every point in a fi gure is moved the same distance in the same direction
Th e line was a translation of the original line.
Conversion kun VUR zhun
To change in form Th e fi gure was multiplied by a conversion factor of 3.
Paraphrase PA ruh frayz
To reword He paraphrased the teacher’s directions to the new student.
Version VUR zhun
An interpretation of a matter from a particular point of view
Th e homework had several versions of similar types of problems.
Use the vocabulary from above to fi ll in the blanks. Th e fi rst one is done for you.
To paraphrase means to reword what was said. Alex’s notes from class paraphrased what the teacher said.
1. Each _____________ had the same questions, but in diff erent order.
2. To convert from decimals to percents, you multiply by the ___________ factor of one hundred.
3. Jenna moved her game piece by a _______________ of 2 units back.
For Exercises 4–10, match each translation for y 5 »x… in Column A with its corresponding equation in Column B.
Column A Column B
4. 5 units up y 5 u x u 1 8
5. 5 units left y 5 u x 2 8 u
6. 8 units down y 5 u x 1 8 u
7. 8 units left y 5 u x u 2 8
8. 8 units up y 5 u x 1 5 u
9. 8 units right y 5 u x u 1 5
10. 5 units down y 5 u x u 2 5
5-8 ELL SupportGraphing Absolute Value Functions
version
conversion
translation
age 0
5-7 Reteaching (continued)
Scatter Plots and Trend Lines
Problem
Draw a trend line for the scatter plot in the previous problem. What is the equation for your trend line? What would you estimate to be the average height of a girl who is 12 years old?Draw a line that seems to fi t the data. Th e line drawn for this data goes through (4, 40) and (8, 50). Use these points to write an equation.
m 550 2 40
8 2 4 5 2.5
Use the point-slope form of the line.
y 2 y1 5 m(x 2 x1)
y 2 40 5 2.5(x 2 4)
y 2 40 5 2.5x 2 10
y 5 2.5x 1 30
Use this equation to estimate the average height of 12-year old girls.
y 5 2.5(12) 1 30
y 5 60
Exercises
Ryan practices throwing darts. From each distance listed below, he throws 10 darts and records how many times he hits the center.
1. Use the space at the right to make a scatter plot of the data.
2. Describe the type of correlation that is shown in the scatter plot.
3. Draw a trend line.
4. What equation represents your trend line?
5. How many hits do you estimate Ryan would make from 6 feet?
Distance (in feet)
Number of Center Hits
2 5 7 8 10 12 15
10 9 8 6 5 1 2
0 42 6 8 10 12 14
40
50
60
30
10
20
0
Age in years
Girl’s Growth chart
negative correlation; as the distance from the target increases, the number of center hits out of 10 decreases
See points on graph in Ex. 3.
4
8
12
4 8 12Ox
y
y 5 234x 1 12
about 7 hits
age 6
5-7 ReteachingScatter Plots and Trend Lines
A scatter plot is a graph that relates two diff erent sets of data by displaying them as ordered pairs. A scatter plot can show a trend or correlation, which may be either positive or negative. Or the scatter plot may show no trend or correlation. It is often easier to determine whether there is a correlation by looking at a scatter plot than it is to determine by looking at the numerical data.
If the points on a scatter plot generally slope up to the right, the two sets of data have a positive correlation. If the points on a scatter plot generally slope down to the right, the two sets of data have a negative correlation. If the points on a scatter plot do not seem to generally rise or fall in the same direction, the two sets of data have no correlation.
Problem
Th e table below compares the average height of girls at diff erent ages. Make a scatter plot of the data. What type of correlation does the scatter plot indicate?
Treat the data as ordered pairs. Th e average height of a 2-year old girl is 34 inches, so one ordered pair is (2, 34). Plot this point. Th en plot (3, 37), (4, 40), (5, 42), (6, 45), (7, 48), (8, 50), (9, 52), and (10, 54).
Notice that the height increases as the age increases. Th ere is a positive correlation for this data.
A trend line is a line on a scatter plot that is drawn near the points. You can use a trend line to estimate other values.
Age in years
Height in Inches
2
34
3
37
4
40
5
42
6
45
7
48
8
50
9
52
10
54
0 42 6 8 10 12 14
40
50
60
30
10
20
0
Age in years
Girl’s Growth chart
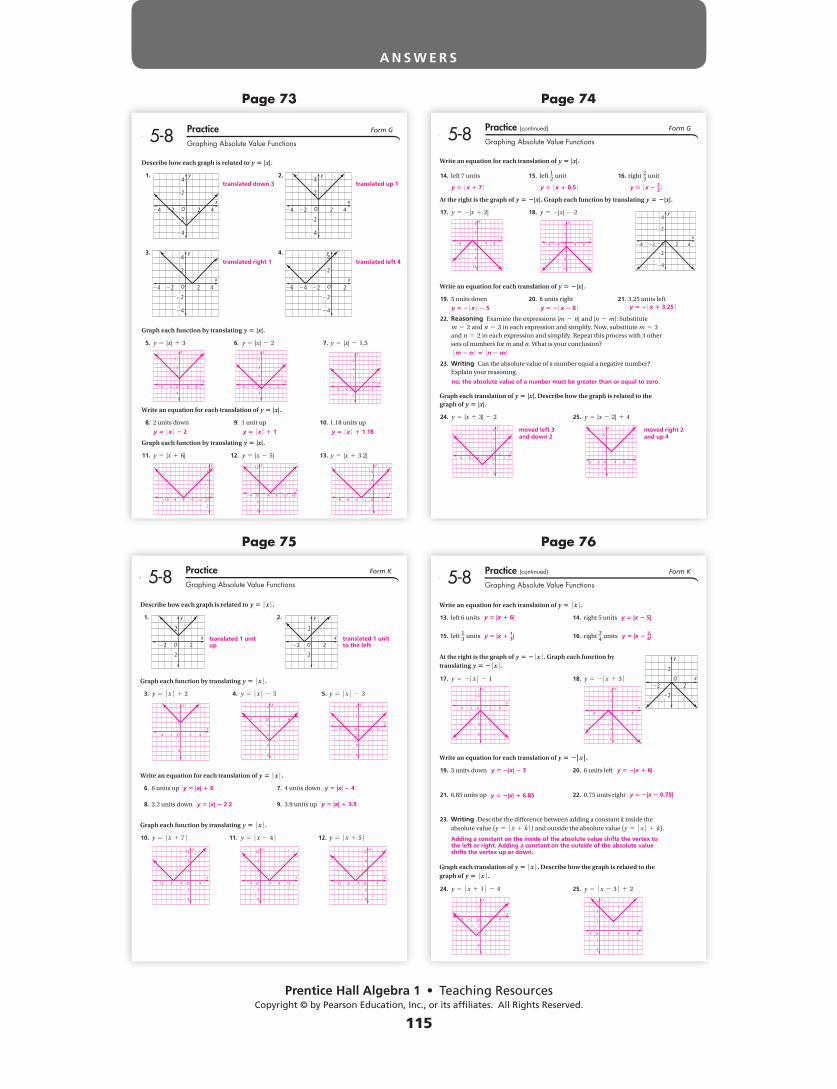
Prentice Hall Algebra 1 • Teaching ResourcesCopyright © by Pearson Education, Inc., or its affiliates. All Rights Reserved.
115
A N S W E R S
Page 73
Page 75
Page 74
Page 76age 6
5-8 Practice (continued) Form K
Graphing Absolute Value Functions
Write an equation for each translation of y 5 u x u .
13. left 6 units 14. right 5 units
15. left 13 units 16. right 34 units
At the right is the graph of y 5 2 u x u . Graph each function by translating y 5 2 u x u .
17. y 5 2u x u 2 1 18. y 5 2u x 1 3 u
Write an equation for each translation of y 5 2»x….
19. 3 units down 20. 6 units left
21. 6.85 units up 22. 0.75 units right
23. Writing Describe the diff erence between adding a constant k inside the absolute value (y 5 u x 1 k u) and outside the absolute value (y 5 u x u 1 k).
Graph each translation of y 5 u x u . Describe how the graph is related to the graph of y 5 u x u .
24. y 5 u x 1 1 u 2 4 25. y 5 u x 2 3 u 1 2
x
y
O2
2
2
2
y 5 2|x| 2 3 y 5 2|x 1 6|
y 5 2|x| 1 6.85 y 5 2|x 2 0.75|
Adding a constant on the inside of the absolute value shifts the vertex to the left or right. Adding a constant on the outside of the absolute value shifts the vertex up or down.
y 5 |x 1 6| y 5 |x 2 5|
y 5 |x 1 13| y 5 |x 2 3
4|
4 2 4
2
4
6
2
x
y
O 24 2
2
4
6
2
4
x
y
O 2 4
4 2 4
2
4
6
2
x
y
O 2
4
2
4
2
4
6
x
y
O 2 4 6 8
age 5
5-8 Practice Form K
Graphing Absolute Value Functions
Describe how each graph is related to y 5 u x u .
1. 2.
Graph each function by translating y 5 u x u .
3. y 5 u x u 1 2 4. y 5 u x u 2 5 5. y 5 u x u 2 3
Write an equation for each translation of y 5 u x u .
6. 6 units up 7. 4 units down
8. 2.2 units down 9. 3.9 units up
Graph each function by translating y 5 u x u .
10. y 5 u x 1 7 u 11. y 5 u x 2 4 u 12. y 5 u x 1 5 u
x
y
O2
2
2
2
x
y
O2
2
2
2
y 5 |x| 1 6 y 5 |x| 2 4
y 5 |x| 2 2.2 y 5 |x| 1 3.9
translated 1 unit up
translated 1 unit to the left
4 2 4
2
4
2
4
x
y
O 2
4 2 4
2
4
6
8
2
x
y
O 2
4 2 4
2
4
6
2
4
x
y
O 2
812 4
4
8
4
8
12
x
y
O 4 4
4
8
4
8
12
x
y
O 4 8 12 812 4
4
8
4
8
12
x
y
O 4
age
Write an equation for each translation of y 5 |x|.
14. left 7 units 15. left 12 unit 16. right 23 unit
At the right is the graph of y 5 2|x|. Graph each function by translating y 5 2|x|.
17. y 5 2|x 1 2| 18. y 5 2|x| 2 2
Write an equation for each translation of y 5 2|x|.
19. 5 units down 20. 8 units right 21. 3.25 units left
22. Reasoning Examine the expressions |m 2 n| and |n 2 m|. Substitute m 5 2 and n 5 3 in each expression and simplify. Now, substitute m 5 3 and n 5 2 in each expression and simplify. Repeat this process with 3 other sets of numbers for m and n. What is your conclusion?
23. Writing Can the absolute value of a number equal a negative number? Explain your reasoning.
Graph each translation of y 5 |x|. Describe how the graph is related to the graph of y 5 |x|.
24. y 5 |x 1 3| 2 2 25. y 5 |x 2 2| 1 4
5-8 Practice (continued) Form G
Graphing Absolute Value Functions
xO
y4
2
2
4
2
4 42
y 5 u x 1 0.5 uy 5 u x 1 7 u y 5 u x 2 23 u
y 5 2 u x u 2 5 y 5 2 u x 1 3.25 uy 5 2 u x 2 8 u
um 2 n u 5 un 2 m u
no; the absolute value of a number must be greater than or equal to zero.
moved left 3 and down 2
moved right 2 and up 4
xO
y
4
4
8
12
4
4
8
88x
O
y
4
4
8
12
4
4
8
88
xO
y
2 2
2
4
2
4
6
468 xO
y
4
4
4
4
8
12
88
age 3
Describe how each graph is related to y 5 |x|.
1. 2.
3. 4.
Graph each function by translating y 5 |x|.
5. y 5 |x| 1 3 6. y 5 |x| 2 2 7. y 5 |x| 2 1.5
Write an equation for each translation of y 5 |x|.
8. 2 units down 9. 1 unit up 10. 1.18 units up
Graph each function by translating y 5 |x|.
11. y 5 |x 1 6| 12. y 5 |x 2 5| 13. y 5 |x 1 3.2|
5-8 Practice Form G
Graphing Absolute Value Functions
xO
y4
2
2
4
2
4 42x
O
y4
2
2
4
2
4 42
xO
y4
2
2
4
2
4 42x
O
4
2
4
2
6 24 2
y
translated down 3
translated right 1
translated up 1
translated left 4
y 5 u x u 2 2 y 5 u x u 1 1 y 5 u x u 1 1.18
xO
y
4
4
4
4
8
12
88x
O
y
2
2
2
2
4
8
44
xO
y
4
4
4
4
8
12
88
xO
y
2
2
2
4
6
46810
xO
y
4
4
8
4
4 8 12 16
8
12
xO
y
2 2
2
2
4
6
468
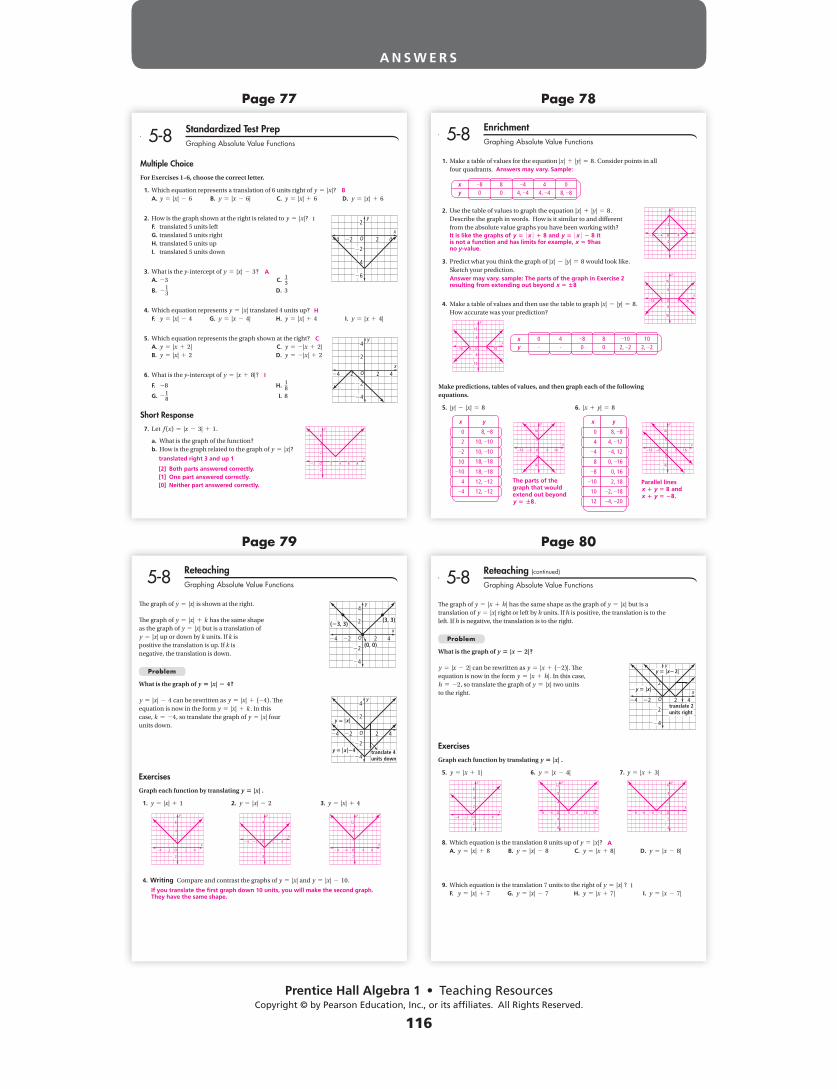
Prentice Hall Algebra 1 • Teaching ResourcesCopyright © by Pearson Education, Inc., or its affiliates. All Rights Reserved.
116
A N S W E R S
Page 77
Page 79
Page 78
Page 80age 80
Th e graph of y 5 |x 1 h| has the same shape as the graph of y 5 |x| but is a translation of y 5 |x| right or left by h units. If h is positive, the translation is to the left. If h is negative, the translation is to the right.
Problem
What is the graph of y 5 |x 2 2|?
y 5 |x 2 2| can be rewritten as y 5 |x 1 (22)|. Th e equation is now in the form y 5 |x 1 h|. In this case, h 5 22, so translate the graph of y 5 |x| two units to the right.
Exercises
Graph each function by translating y 5 |x| .
5. y 5 |x 1 1| 6. y 5 |x 2 4| 7. y 5 |x 1 3|
8. Which equation is the translation 8 units up of y 5 |x|? A. y 5 |x| 1 8 B. y 5 |x| 2 8 C. y 5 |x 1 8| D. y 5 |x 2 8|
9. Which equation is the translation 7 units to the right of y 5 |x| ? F. y 5 |x| 1 7 G. y 5 |x| 2 7 H. y 5 |x 1 7| I. y 5 |x 2 7|
5-8 Reteaching (continued)
Graphing Absolute Value Functions
xO
y
2
2
4
2
4 42translate 2units right
y 5 zx22z
y 5 zx z
xO
y
2
2
2
2
4
6
44
xO
y
48 4 8 12 16
4
8
4
8
12
xO
y
2 2
2
4
2
4
6
468
A
I
age
Th e graph of y 5 |x| is shown at the right.
Th e graph of y 5 |x| 1 k has the same shape as the graph of y 5 |x| but is a translation of y 5 |x| up or down by k units. If k is positive the translation is up. If k is negative, the translation is down.
Problem
What is the graph of y 5 |x| 2 4?
y 5 |x| 2 4 can be rewritten as y 5 |x| 1 (24). Th e equation is now in the form y 5 |x| 1 k. In this case, k 5 24, so translate the graph of y 5 |x| four units down.
Exercises
Graph each function by translating y 5 |x| .
1. y 5 |x| 1 1 2. y 5 |x| 2 2 3. y 5 |x| 1 4
4. Writing Compare and contrast the graphs of y 5 |x| and y 5 |x| 2 10.
5-8 ReteachingGraphing Absolute Value Functions
xO
y4
2
2
4
2
4 42
(3, 3)
(0, 0)
(23, 3)
xO
y4
2
2
4
2
4 42
translate 4units down
y 5 zx z
y 5 zx z24
xO
y
2
2
2
2
4
6
44
xO
y
2
2
4
2
2
4
44x
O
y
4
2
4
4
8
12
88
If you translate the fi rst graph down 10 units, you will make the second graph. They have the same shape.
age 8
1. Make a table of values for the equation |x| 1 |y| 5 8. Consider points in all four quadrants.
2. Use the table of values to graph the equation |x| 1 |y| 5 8. Describe the graph in words. How is it similar to and diff erent from the absolute value graphs you have been working with?
3. Predict what you think the graph of |x| 2 |y| 5 8 would look like. Sketch your prediction.
4. Make a table of values and then use the table to graph |x| 2 |y| 5 8. How accurate was your prediction?
Make predictions, tables of values, and then graph each of the following equations.
5. |y| 2 |x| 5 8 6. |x 1 y| 5 8
5-8 EnrichmentGraphing Absolute Value Functions
Answers may vary. Sample:
It is like the graphs of y 5 u x u 1 8 and y 5 u x u 2 8 it is not a function and has limits for example, x 5 9has no y-value.
Answer may vary. sample: The parts of the graph in Exercise 2 resulting from extending out beyond x 5 w8
xO
y
4
4
8
4
4
8
88
xO
y
8
8
16
8
8
16
1616
xO
y
8
8
16
8
8
16
1616
The parts of the graph that would extend out beyond y 5 w8.
Parallel lines x 1 y 5 8 and x 1 y 5 28.
0
2
2
10
10
4
4
x
12, 12
12, 12
10, 10
10, 10
18, 18
18, 18
8, 8
y
0
4
4
8
8
10
10
x
2, 18
12 4, 20
2, 18
0, 16
0, 16
4, 12
4, 12
8, 8
y
xO
y
8
8
16
8
8
16
1616x
O
y
8
8
16
8
8
16
1616
xy
8 8 4 4 00 0 4, 4 4, 4 8, 8
xy
0 4 8 8 10 10- - 0 0 2, 2 2, 2
age
Multiple Choice
For Exercises 1–6, choose the correct letter.
1. Which equation represents a translation of 6 units right of y 5 |x|? A. y 5 |x| 2 6 B. y 5 |x 2 6| C. y 5 |x| 1 6 D. y 5 |x| 1 6
2. How is the graph shown at the right is related to y 5 |x|? F. translated 5 units left G. translated 5 units right H. translated 5 units up I. translated 5 units down
3. What is the y-intercept of y 5 |x| 2 3? A. 23 C. 1
3 B. 2
13 D. 3
4. Which equation represents y 5 |x| translated 4 units up? F. y 5 |x| 2 4 G. y 5 |x 2 4| H. y 5 |x| 1 4 I. y 5 |x 1 4|
5. Which equation represents the graph shown at the right? A. y 5 |x 1 2| C. y 5 2|x 1 2| B. y 5 |x| 1 2 D. y 5 2|x| 1 2
6. What is the y-intercept of y 5 |x 1 8|?
F. 28 H. 18
G. 2 18 I. 8
Short Response
7. Let f (x) 5 |x 2 3| 1 1.
a. What is the graph of the function? b. How is the graph related to the graph of y 5 |x|?
5-8 Standardized Test PrepGraphing Absolute Value Functions
xO
y2
2
6
4
2
4 42
xO
y4
2
2
4
2
4 42
B
A
H
I
C
I
translated right 3 and up 1
[2] Both parts answered correctly.[1] One part answered correctly.[0] Neither part answered correctly.
xO
y
2 2 4 6 8
2
2
4
6
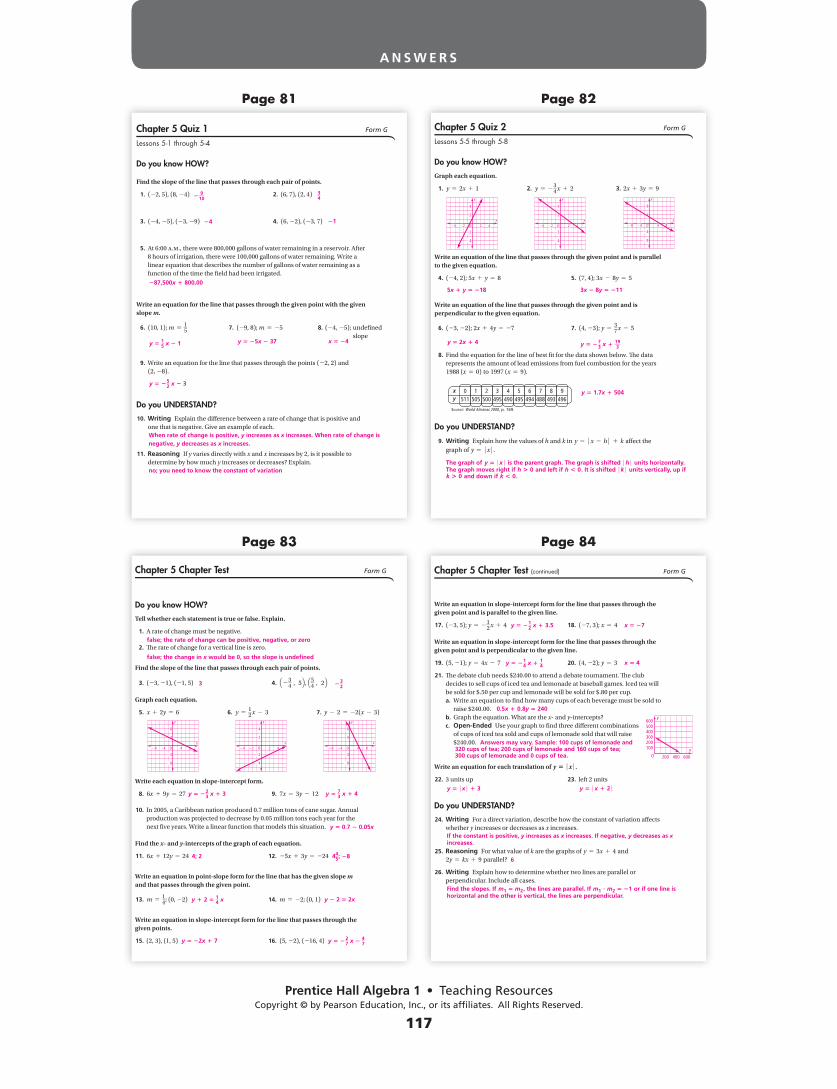
Prentice Hall Algebra 1 • Teaching ResourcesCopyright © by Pearson Education, Inc., or its affiliates. All Rights Reserved.
117
A N S W E R S
Page 81
Page 83
Page 82
Page 84age 8
Chapter 5 Chapter Test (continued) Form G
Write an equation in slope-intercept form for the line that passes through the given point and is parallel to the given line.
17. (23, 5); y 5 2 12 x 1 4 18. (27, 3); x 5 4
Write an equation in slope-intercept form for the line that passes through the given point and is perpendicular to the given line.
19. (5, 21); y 5 4x 2 7 20. (4, 22); y 5 3
21. Th e debate club needs $240.00 to attend a debate tournament. Th e club decides to sell cups of iced tea and lemonade at baseball games. Iced tea will be sold for $.50 per cup and lemonade will be sold for $.80 per cup.
a. Write an equation to fi nd how many cups of each beverage must be sold to raise $240.00.
b. Graph the equation. What are the x- and y-intercepts? c. Open-Ended Use your graph to fi nd three diff erent combinations
of cups of iced tea sold and cups of lemonade sold that will raise $240.00.
Write an equation for each translation of y 5 u x u .
22. 3 units up 23. left 2 units
Do you UNDERSTAND?
24. Writing For a direct variation, describe how the constant of variation aff ects whether y increases or decreases as x increases.
25. Reasoning For what value of k are the graphs of y 5 3x 1 4 and 2y 5 kx 1 9 parallel?
26. Writing Explain how to determine whether two lines are parallel or perpendicular. Include all cases.
x 5 27
x 5 4
Answers may vary. Sample: 100 cups of lemonade and 320 cups of tea; 200 cups of lemonade and 160 cups of tea; 300 cups of lemonade and 0 cups of tea.
y 5 u x u 1 3 y 5 u x 1 2 u
y 5 2 14 x 1 1
4
0.5x 1 0.8y 5 240
y 5 2 12 x 1 3.5
x
y
200
100200300400500600
400 600O
If the constant is positive, y increases as x increases. If negative, y decreases as x increases.
Find the slopes. If m1 5 m2, the lines are parallel. If m1 ? m2 5 21 or if one line is horizontal and the other is vertical, the lines are perpendicular.
6
age 83
Chapter 5 Chapter Test Form G
Do you know HOW?
Tell whether each statement is true or false. Explain.
1. A rate of change must be negative.
2. Th e rate of change for a vertical line is zero.
Find the slope of the line that passes through each pair of points.
3. (23, 21), (21, 5) 4. Q2 34 , 5R, Q5
4 , 2R
Graph each equation.
5. x 1 2y 5 6 6. y 512 x 2 3 7. y 2 2 5 22(x 2 3)
Write each equation in slope-intercept form.
8. 6x 1 9y 5 27 9. 7x 5 3y 2 12
10. In 2005, a Caribbean nation produced 0.7 million tons of cane sugar. Annual production was projected to decrease by 0.05 million tons each year for the next fi ve years. Write a linear function that models this situation.
Find the x- and y-intercepts of the graph of each equation.
11. 6x 1 12y 5 24 12. 25x 1 3y 5 224
Write an equation in point-slope form for the line that has the given slope m and that passes through the given point.
13. m 514; (0, 22) 14. m 5 22; (0, 1)
Write an equation in slope-intercept form for the line that passes through the given points.
15. (2, 3), (1, 5) 16. (5, 22), (216, 4)
false; the rate of change can be positive, negative, or zero
false; the change in x would be 0, so the slope is undefi ned
3 2 32
y 5 2 23 x 1 3 y 5 7
3 x 1 4
xO
y
4
4
8
4
4
8
88x
O
y
2
2
4
2
2
4
44x
O
y
4
4
8
4
4
8
88
y 5 0.7 2 0.05x
y 1 2 5 14 x
y 5 2 27 x 2 4
7y 5 22x 1 7
y 2 2 5 2x
4; 2 445; 28
age 8
Chapter 5 Quiz 2 Form G
Lessons 5-5 through 5-8
Do you know HOW?
Graph each equation.
1. y 5 2x 1 1 2. y 5 2 34 x 1 2 3. 2x 1 3y 5 9
Write an equation of the line that passes through the given point and is parallel to the given equation.
4. (24, 2); 5x 1 y 5 8 5. (7, 4); 3x 2 8y 5 5
Write an equation of the line that passes through the given point and is perpendicular to the given equation.
6. (23, 22); 2x 1 4y 5 27 7. (4, 23); y 537 x 2 5
8. Find the equation for the line of best fi t for the data shown below. Th e data represents the amount of lead emissions from fuel combustion for the years 1988 (x 5 0) to 1997 (x 5 9).
Do you UNDERSTAND?
9. Writing Explain how the values of h and k in y 5 u x 2 h u 1 k aff ect the graph of y 5 u x u .
xy
0511
1505
2500
3495
4490
5495
6494
7488
8493
9496
SOURCE: World Almanac 2000, p. 169.
5x 1 y 5 218
y 5 2x 1 4
y 5 1.7x 1 504
3x 2 8y 5 211
y 5 2 73 x 1 19
3
xO
y
2
2
4
2
2
4
44x
O
y
4
4
8
4
4
8
88x
O
y
2
2
4
2
2
4
44
The graph of y 5 u x u is the parent graph. The graph is shifted uh u units horizontally. The graph moves right if h S 0 and left if h R 0. It is shifted u k u units vertically, up if k S 0 and down if k R 0.
age 8
Chapter 5 Quiz 1 Form G
Lessons 5-1 through 5-4
Do you know HOW?
Find the slope of the line that passes through each pair of points.
1. (22, 5), (8, 24) 2. (6, 7), (2, 4)
3. (24, 25), (23, 29) 4. (6, 22), (23, 7)
5. At 6:00 a.m., there were 800,000 gallons of water remaining in a reservoir. After 8 hours of irrigation, there were 100,000 gallons of water remaining. Write a linear equation that describes the number of gallons of water remaining as a function of the time the fi eld had been irrigated.
Write an equation for the line that passes through the given point with the given slope m.
6. (10, 1); m 515 7. (29, 8); m 5 25 8. (24, 25); undefi ned
slope
9. Write an equation for the line that passes through the points (22, 2) and (2, 28).
Do you UNDERSTAND?
10. Writing Explain the diff erence between a rate of change that is positive and one that is negative. Give an example of each.
11. Reasoning If y varies directly with x and x increases by 2, is it possible to determine by how much y increases or decreases? Explain.
2 9
10
24
287,500x 1 800,00
y 5 15 x 2 1
y 5 2 52 x 2 3
When rate of change is positive, y increases as x increases. When rate of change is negative, y decreases as x increases.
no; you need to know the constant of variation
y 5 25x 2 37 x 5 24
34
21

Prentice Hall Algebra 1 • Teaching ResourcesCopyright © by Pearson Education, Inc., or its affiliates. All Rights Reserved.
118
A N S W E R S
Page 85
Page 87
Page 86
Page 88age 88
Chapter 5 Part B Test (contined) Form K
Lessons 5-5 through 5-7
Find the x-and y-intercepts of the line that passes through the given points.
11. (7, 5), (4, 1) 12. (21, 21), (23, 9)
Write an equation in slope-intercept form of the line that passes through the given point and is parallel to the graph of the given equation.
13. (22, 26); y 5 5 14. (210, 21); y 535 x 2 11
Write an equation in slope-intercept form of the line that passes through the given point and is perpendicular to the graph of the given equation.
15. (28, 27); y 5 28x 2 9 16. (23, 22); y 5 2 13 x 1 1
Do You UNDERSTAND?
17. Writing Describe how you can determine from their equations if two lines are parallel or perpendicular without graphing the lines.
18. Open-Ended Write one equation of a line that is parallel to and one equation of a line that is perpendicular to the graph of the line 11x 2 6y 5 21.
19. Reasoning For what value of k are the graphs of y 5 2 12 x 1 6 and
4y 2 kx 5 228 perpendicular?
y 5 26 y 5 35 x 1 5
y 5 18 x 2 6 y 5 3x 1 7
k 5 8
Write the equations in slope-intercept form and examine the slopes of both equations. If the slopes are the same, the lines are parallel. If the slopes are negative reciprocals of each other, the lines are perpendicular.
Answers may vary. For example, parallel: y 5 116
x 1 10; perpendicular: y 5 2 6
11 x 2 8
x-intercept 2134
y-intercept 2133
x-intercept 265
y-intercept 26
age 8
Chapter 5 Part B Test Form K
Lessons 5-5 through 5-7
Do You Know HOW?
Find the x-and y-intercepts of the graph of each equation.
1. 3x 1 5y 5 10 2. x 1 y 5 27
Graph each equation.
3. 3x 1 y 5 6 4. 2x 2 3y 5 9
5. x 5 5 6. y 5 22
Use the table below.
7. Make a scatter plot of the data pairs (years since 1980, milk consumption).
8. Draw a line of best fi t for the data.
9. Write an equation for the line of best fi t.
10. According to the data, estimate the milk consumption per capita in the year 2015.
YearMilk Consumption (gal)
Per Capita Milk Consumption in the U.S.
198027.6
199025.7
199523.9
200022.5
200221.9
200321.6
200421.3
200521.0
200621.0
y 5 2; x 5 3 13
y 5 20.25x 1 27.5
18.75 gal
y 5 27; x 5 27
xO
y
4
8
4
4
8
88
4
xO
y
4
8
4
4
8
88
4
xO
y
4
8
4
4
8
88
4
xO
y
2
4
2
2
4
44
2
Milk
Con
sum
ptio
n
x
y
10
20
30
5
0 10 20 30
15
25
Years since 1980
O
age 86
Chapter 5 Part A Test (continued) Form K
Lessons 5-1 through 5-4
Find the slope and y-intercept of the graph of each equation.
14. y 5 22x 2 7 15. y 512 x 1 3
Graph each equation.
16. y 5 22x 2 4 17. y 5 23x
Suppose y varies directly with x. Write a direct variation equation that relates x and y. Th en fi nd the value of y when x 5 3.
18. y 5 2 when x 5 8 19. y 5 10 when x 5 5
Do You UNDERSTAND?
20. a. Open-Ended Write an equation of a line that passes through (21, 1).
b. Reasoning Is there only one line that passes through this point? Explain.
21. Writing Explain how to write the equation of a line when given two points through which the line passes.
Answers may vary. For example, y 5 23x 2 2.
Slope: 22, y-intercept 27.
y 5 14x; 34
Slope: 12, y-intercept 3.
y 5 2x; 6
No, there are an infi nite number of lines that could pass through this point.
First use the slope formula to determine the slope of the line through the two points. Then use either of the given points and the slope in the point-slope form of the equation of a line to write the equation of the line through the two points.
xO
y
4
8
4
4
8
88
4
xO
y
4
8
4
4
8
88
4
age 85
Chapter 5 Part A Test Form K
Lessons 5-1 through 5-4
Do you know HOW?
Find the slope of the line that passes through each pair of points.
1. (27, 5), (1, 1) 2. (0, 6), (23, 9) 3. (2, 21)(1, 3)
4. (8, 22), (4, 23) 5. (21, 23), (6, 4) 6. (5, 2), (25, 3)
7. Shelly has a gift card for her favorite restaurant for $15. She wants to treat a group of her friends to sandwiches at the restaurant. Sandwiches cost $4.50 each. Write an equation that models the total money Shelly owes if she buys x sandwiches after using the gift card. Graph the equation.
Write an equation of the line that passes through the given point and has the given slope.
8. (4, 25); m 5 2 14 9. (2, 3); m 5 3 10. (26, 7); m 5 0
11. Write an equation in slope-intercept form of the line that passes through the points (4, 6) and (24, 2).
12. What is an equation of the line that passes through the point (4, 21) and has slope 25?
13. Jeremy’s pay started at $500 per week. Every year his pay will increase by $25 per week. Write an equation that models his weekly pay after x years.
y 5 214 x 2 4 y 5 3x 2 3 y 5 7
y 5 12 x 1 4
y 1 1 5 25(x 2 4)
y 5 25x 1 500
212 21 24
14 1
y 5 4.5x 2 15
2 110
x
y
2
5101520
4 6 8 10O

Prentice Hall Algebra 1 • Teaching ResourcesCopyright © by Pearson Education, Inc., or its affiliates. All Rights Reserved.
119
A N S W E R S
Page 89
Page 91
Page 90
Page 92age
Cumulative Review (continued)
Chapters 1-5
11. What is an equation of the graph at the right? A. y 5 25x 1 4 C y 5 22x 1 8 B. y 5 27x 1 1 D. y 5 x 1 4
12. Evaluate each expression.
a. x2 for x 5 25 b. 2x2 for x 5 25
13. Find x. a. 20% of 150 is x. b. 50% of x is 150.
14. What are the coordinates of the vertex of the graph of y 5 u x 1 2 u 2 4?
15. Find the y-intercept of the graph of each equation. a. 7y 2 3x 5 4 b. 2x 1 4y 5 3
16. Find the slope of each line. a. Th e line containing points (3, 26) and (4, 25) b. Th e line described by the equation 12x 1 5y 5 9
17. Find the slope of each line. a. Th e line that is perpendicular to the graph 2x 1 3y 5 6 b. Th e line that is parallel to the graph 22x 2 6y 5 8
Find each answer.
18. A long-distance company charges $26.95 per month plus $.14 per minute for all in-state long distance calls. Calculate the cost in dollars to make 225 minutes of in-state long distance calls over one month.
19. Th e ratio of black walnut to red oak trees at a tree farm is 4 : 5. Th e tree farm has 1200 black walnut trees. How many black walnut and red oak trees does the tree farm have altogether?
20. A train moving at a constant speed travels 325 mi in 8 hr. At this rate, how many miles does the train travel in 12 hr?
21. You invest $175.00 in advertising yourself as a math tutor. You charge $25/hr. How many hours do you have to tutor before you break even?
22. Line A passes through points (6, 8) and (1, 27). Line B is perpendicular to Line A. Line C is perpendicular to Line B. What is the slope of Line C?
23. Open-Ended Make up a problem that could be solved using a rate of change.
24. What is the y-intercept of the graph of the equation 17x 1 2y 5 42?
xO
y4
2
2
4
2
4 42
A
25
1
$58.45
2700 trees
487.5 mi
7 h
3
21
Answers may vary. Sample: A water tank contains 60 gallons of water. You use 8 gallons per week to water the garden during a dry spell. How much water remains in the water tank after 4 weeks?
2 125
30
(22, 24)
47
34
32
2 13
300
225
age
Cumulative ReviewChapters 1-5
Multiple Choice
For Exercises 1–11, choose the correct letter.
1. What is true about the graphs of y 5 24x 1 6 and y 214x 1 6?
A. Th ey are parallel. C. Th ey are perpendicular. B. Th ey have the same slope. D. Th ey do not intersect.
2. A mail order company sells boxes of fi shing lures for $26.95 per box. A charge of $8.95 is added to orders, regardless of the order size. Which of the following equations models the relationship between the number of boxes ordered and the total cost of the order?
F. c 5 26.95w; w $ 1 H. c 5 (26.95 1 8.95)w; w $ 1 G. 8.95c 5 26.95w; w $ 1 I. c 5 26.95w 1 8.95; w $ 1
3. Which of the following is the correct simplication of the expression
62 1 15 4 3 1 4 3 3? A. 63 B. 53 C. 29 D. 21
4. Which is not a solution of 3x 2 5 , 17? F. 24 G. 5 H. 7 I. 12
5. Which of the following statements is not true for the graph of the equation 5x 1 3y 5 12?
A. Th e y-intercept is 4. C. Th e x-intercept is 2.4
B. Th e line has a positive slope. D. Th e line contains the point Q2, 23R. 6. What is the constant of variation for 3y 5 6x?
F. 12 G. 2 H. 3 I. 6
7. What is f (24) when f (x) 5 2x2 2 2x? A. 24 B. 8 C. 28 D. 224
8. Th e Girl Scouts hoped to raise $1000 selling cookies. Instead, they raised $1050. What percent of their goal did they achieve?
F. 115% G. 105% H. 100% I. 95%
9. Which of the following is the solution of 3(5x 2 6) 5 263? A. 23 B. 5 C. 3 D. 15
10. What is 8x 1 3y2
4y 2 3x when x 5 2 and y 5 3?
F. 222 G. 28 H. 7.5 I. 436
C
I
B
I
B
G
C
G
A
I
age 0
Performance Tasks (continued)
Chapter 5
TASK 3
You and your friend are having trouble using the diff erent methods for fi nding the equation of a line. With the help of the graph at the right, provide a detailed step-by-step procedure that demonstrates how each method works. a. Using slope and y-intercept
b. Using slope and a point
c. Using two points
d. Using x- and y-intercepts
e. Write the equation of the line at right in the form Ax 1 By 5 C.
f. Th ink of a real-world situation that can be modeled using the equation you wrote in part (e).
xO
y4
2
2
4
2
4 42
y 5 32 x 1 3; 2y 5 3x 1 6; 23x 1 2y 5 6
Check students’ work.
Given y-intercept 5 3 and x-intercept 5 22Multiply the intercepts: 3(22) 5 26Write the equation in standard form: 3x 2 2y 5 26
Given: slope 5 32 and y-intercept 5 3
Use slope-intercept form: y 5 32 x 1 3
Given: slope 5 32 and (22, 0) is on the line
Use point-slope form: y 2 0 5 32 (x 2 (22))
Simply to get y 5 32 x 1 3
Given: (22, 0) and (0, 3) are on the line.
Find the slope: m 5 2
y2 2 y1x2 2 x1
5 3 2 00 2 (22)
Use point-slope form: y 2 0 5 32 (x 2 (22))
Simplify to get y 5 32 x 1 3
[4] Student shows understanding of the task, completes all portions of the task appropriately with no errors in computation.
[3] Student shows understanding of the task, completes all portions of the task appropriately, with one error in computation.
[2] Student shows understanding of the task, but makes errors resulting in incorrect answers.
[1] Student shows minimal understanding of the task.[0] Student shows no understanding of the task.
age 8
Performance TasksChapter 5
TASK 1
Suppose you are the diving offi cer on board a submarine conducting diving operations. As you conduct your operations, you realize that you can relate the submarine’s changes in depth over time to the slope of a line. a. For each situation below, graph the relationship between depth and time. positive slope negative slope slope equal to zero undefi ned slope
b. For each situation in part (a), calculate the slope on the basis of your graph. Show your work.
c. What would the graph representing a submarine descending from the surface at a rate of 10.5 ft/s look like?
d. Use a graphing calculator to fi nd the equation of the line of best fi t for the data at right.
TASK 2
Computer repair companies use a fi xed cost equation to determine how much to charge for an in-house repair. For example, a technician charges $85 for a house call and $45 per hour. Th e fi xed cost equation is y 5 85 1 45x. a. How are the slope and y-intercept of the graph related to the equation?
b. What is the rate of change in the equation? How is the rate of change related to the slope of the line represented by the equation? Explain.
Time(seconds)
0
30
60
90
120
150
245
200
155
100
51
0
Depth(feet) Answers may vary. Sample:
5 m/min; 210 m/min; 0 m/min; undefi ned
d 5 21.64t 1 249
slope 5 hourly rate, $45/h; y-intercept 5 fi xed cost for a house call, $85.
45; they are equal. The slope is the rate of change.
x
d
21 3
102030
Ox
d
2 31
102030
Ox
d
21 3
102030
Ox
d
2 31
102030
O
x
d
2time (sec)
dept
h (ft
)
102030405060
4 6O
[4] Student shows understanding of the task, completes all portions of the task appropriately with no errors in computation, and fully supports work with appropriate graphs.
[3] Student shows understanding of the task, completes all portions of the task appropriately, with one error in computation, and supports work with appropriate graphs.
[2] Student shows understanding of the task, but makes errors resulting in incorrect answers.[1] Student shows minimal understanding of the task.[0] Student shows no understanding of the task.
[4] Student shows understanding of the task, completes all portions of the task appropriately with no errors in computation.
[3] Student shows understanding of the task, completes all portions of the task appropriately, with one error in computation.
[2] Student shows understanding of the task, but makes errors resulting in incorrect answers.[1] Student shows minimal understanding of the task.[0] Student shows no understanding of the task.
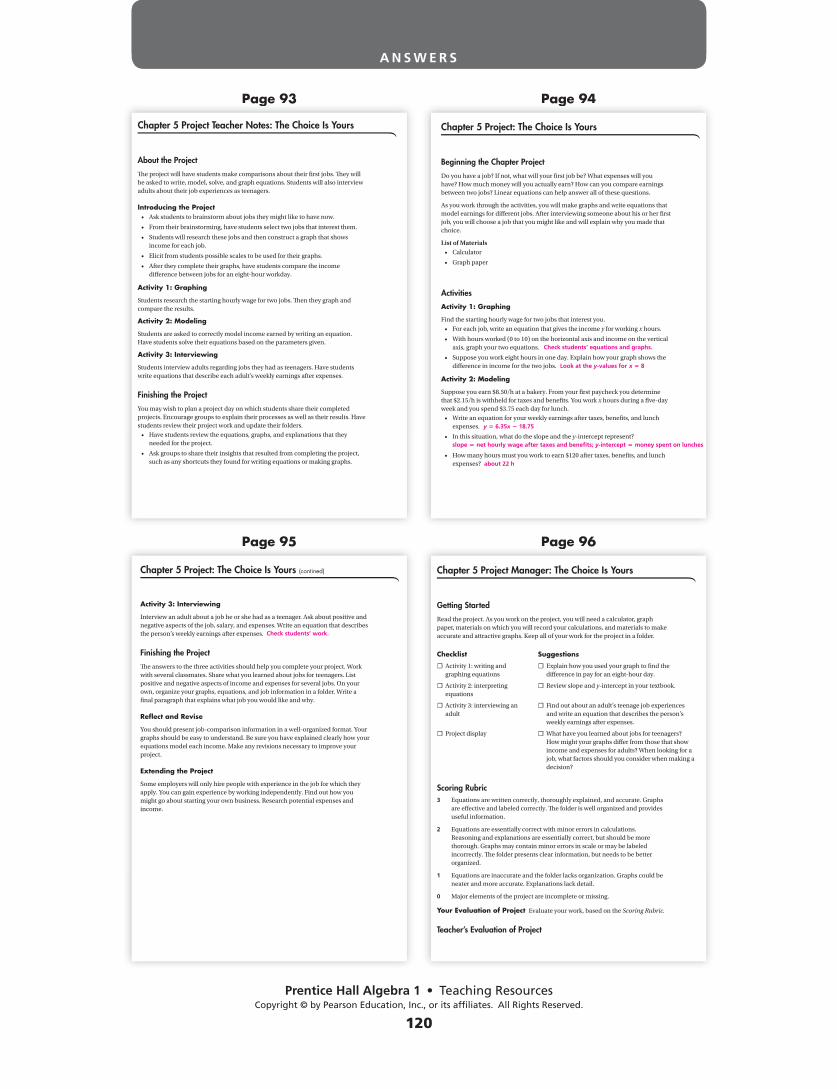
Prentice Hall Algebra 1 • Teaching ResourcesCopyright © by Pearson Education, Inc., or its affiliates. All Rights Reserved.
120
A N S W E R S
Page 93
Page 95
Page 94
Page 96age 6
Chapter 5 Project Manager: The Choice Is Yours
Getting Started
Read the project. As you work on the project, you will need a calculator, graph paper, materials on which you will record your calculations, and materials to make accurate and attractive graphs. Keep all of your work for the project in a folder.
Checklist Suggestions
☐ Activity 1: writing and graphing equations
☐ Explain how you used your graph to fi nd the diff erence in pay for an eight-hour day.
☐ Activity 2: interpreting equations
☐ Review slope and y-intercept in your textbook.
☐ Activity 3: interviewing an adult
☐ Find out about an adult’s teenage job experiences and write an equation that describes the person’s weekly earnings after expenses.
☐ Project display ☐ What have you learned about jobs for teenagers? How might your graphs diff er from those that show income and expenses for adults? When looking for a job, what factors should you consider when making a decision?
Scoring Rubric3 Equations are written correctly, thoroughly explained, and accurate. Graphs
are eff ective and labeled correctly. Th e folder is well organized and provides useful information.
2 Equations are essentially correct with minor errors in calculations. Reasoning and explanations are essentially correct, but should be more thorough. Graphs may contain minor errors in scale or may be labeled incorrectly. Th e folder presents clear information, but needs to be better organized.
1 Equations are inaccurate and the folder lacks organization. Graphs could be neater and more accurate. Explanations lack detail.
0 Major elements of the project are incomplete or missing.
Your Evaluation of Project Evaluate your work, based on the Scoring Rubric.
Teacher’s Evaluation of Project
age 5
Chapter 5 Project: The Choice Is Yours (contined)
Activity 3: Interviewing
Interview an adult about a job he or she had as a teenager. Ask about positive and negative aspects of the job, salary, and expenses. Write an equation that describes the person’s weekly earnings after expenses.
Finishing the Project
Th e answers to the three activities should help you complete your project. Work with several classmates. Share what you learned about jobs for teenagers. List positive and negative aspects of income and expenses for several jobs. On your own, organize your graphs, equations, and job information in a folder. Write a fi nal paragraph that explains what job you would like and why.
Refl ect and Revise
You should present job-comparison information in a well-organized format. Your graphs should be easy to understand. Be sure you have explained clearly how your equations model each income. Make any revisions necessary to improve your project.
Extending the Project
Some employers will only hire people with experience in the job for which they apply. You can gain experience by working independently. Find out how you might go about starting your own business. Research potential expenses and income.
Check students’ work.
age
Chapter 5 Project: The Choice Is Yours
Beginning the Chapter Project
Do you have a job? If not, what will your fi rst job be? What expenses will you have? How much money will you actually earn? How can you compare earnings between two jobs? Linear equations can help answer all of these questions.
As you work through the activities, you will make graphs and write equations that model earnings for diff erent jobs. After interviewing someone about his or her fi rst job, you will choose a job that you might like and will explain why you made that choice.
List of Materials• Calculator
• Graph paper
Activities
Activity 1: Graphing
Find the starting hourly wage for two jobs that interest you.
• For each job, write an equation that gives the income y for working x hours.
• With hours worked (0 to 10) on the horizontal axis and income on the vertical axis, graph your two equations.
• Suppose you work eight hours in one day. Explain how your graph shows the diff erence in income for the two jobs.
Activity 2: Modeling
Suppose you earn $8.50/h at a bakery. From your fi rst paycheck you determine that $2.15/h is withheld for taxes and benefi ts. You work x hours during a fi ve-day week and you spend $3.75 each day for lunch.
• Write an equation for your weekly earnings after taxes, benefi ts, and lunch expenses.
• In this situation, what do the slope and the y-intercept represent?
• How many hours must you work to earn $120 after taxes, benefi ts, and lunch expenses?
Check students’ equations and graphs.
Look at the y-values for x 5 8
y 5 6.35x 2 18.75
about 22 h
slope 5 net hourly wage after taxes and benefi ts; y-intercept 5 money spent on lunches
age 3
Chapter 5 Project Teacher Notes: The Choice Is Yours
About the Project
Th e project will have students make comparisons about their fi rst jobs. Th ey will be asked to write, model, solve, and graph equations. Students will also interview adults about their job experiences as teenagers.
Introducing the Project• Ask students to brainstorm about jobs they might like to have now.
• From their brainstorming, have students select two jobs that interest them.
• Students will research these jobs and then construct a graph that shows income for each job.
• Elicit from students possible scales to be used for their graphs.
• After they complete their graphs, have students compare the income diff erence between jobs for an eight-hour workday.
Activity 1: Graphing
Students research the starting hourly wage for two jobs. Th en they graph and compare the results.
Activity 2: Modeling
Students are asked to correctly model income earned by writing an equation. Have students solve their equations based on the parameters given.
Activity 3: Interviewing
Students interview adults regarding jobs they had as teenagers. Have students write equations that describe each adult’s weekly earnings after expenses.
Finishing the Project
You may wish to plan a project day on which students share their completed projects. Encourage groups to explain their processes as well as their results. Have students review their project work and update their folders.
• Have students review the equations, graphs, and explanations that they needed for the project.
• Ask groups to share their insights that resulted from completing the project, such as any shortcuts they found for writing equations or making graphs.