a2-1: december 15, 2011: excelchem laboratories review of ... · ... discuss why epa method 6020a...
TRANSCRIPT

A2-1: December 15, 2011: Excelchem Laboratories review of Peer review comments

A2-2: December 22, 2011: Addendum to December 15, 2011 Excelchem review

A2-3: December 29, 2011: Water Board Investigative Order No. R6V-2011-0105, Requiring PG&E to provide Information on Laboratory Quality Control Data
A2-4: January 20, 2012: PG&E’s Response to Investigative Order No. R6V-2011-0105. Includes responses to Dr. Nagourney’s peer review comments in attachment A.
Pacific Gas and Electric Company Kevin M. Sullivan
Hinkley Remediation Project Manager Shared Services Dept
3401 Crow Canyon Rd San Ramon, CA 94583 (925) 818-9069 (cell) [email protected]
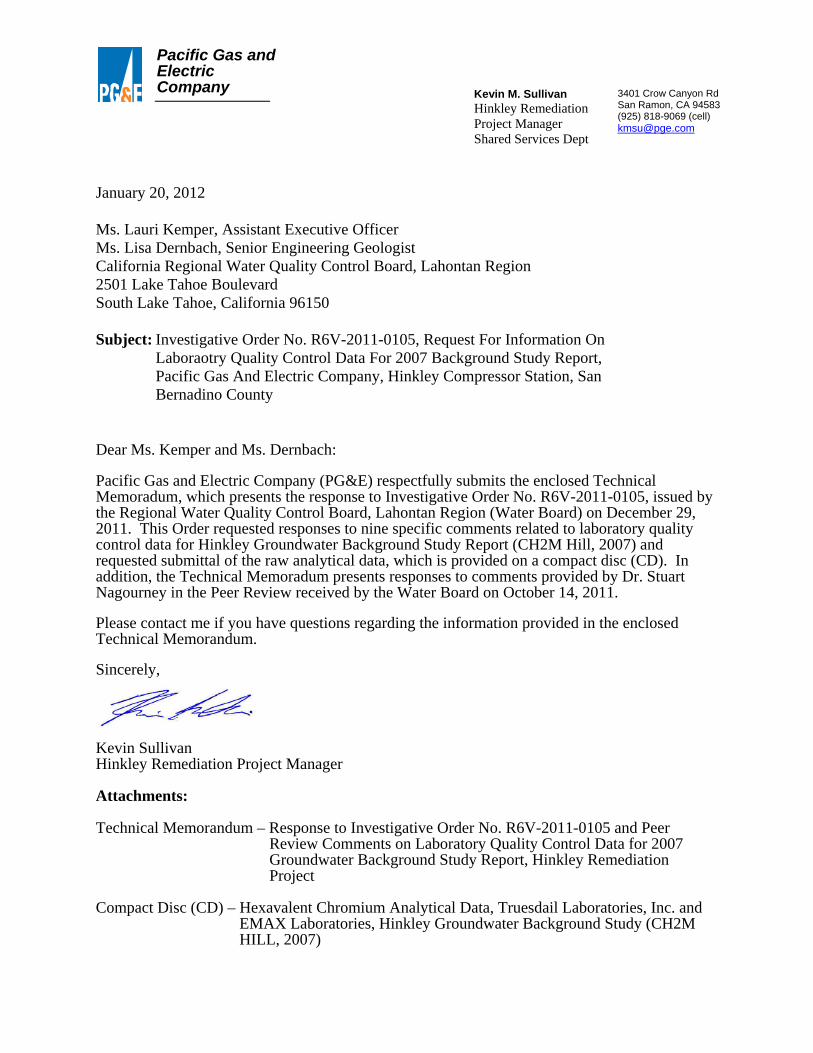
January 20, 2012 Ms. Lauri Kemper, Assistant Executive Officer Ms. Lisa Dernbach, Senior Engineering Geologist California Regional Water Quality Control Board, Lahontan Region 2501 Lake Tahoe Boulevard South Lake Tahoe, California 96150 Subject: Investigative Order No. R6V-2011-0105, Request For Information On
Laboraotry Quality Control Data For 2007 Background Study Report, Pacific Gas And Electric Company, Hinkley Compressor Station, San Bernadino County
Dear Ms. Kemper and Ms. Dernbach:
Pacific Gas and Electric Company (PG&E) respectfully submits the enclosed Technical Memoradum, which presents the response to Investigative Order No. R6V-2011-0105, issued by the Regional Water Quality Control Board, Lahontan Region (Water Board) on December 29, 2011. This Order requested responses to nine specific comments related to laboratory quality control data for Hinkley Groundwater Background Study Report (CH2M Hill, 2007) and requested submittal of the raw analytical data, which is provided on a compact disc (CD). In addition, the Technical Memoradum presents responses to comments provided by Dr. Stuart Nagourney in the Peer Review received by the Water Board on October 14, 2011.
Please contact me if you have questions regarding the information provided in the enclosed Technical Memorandum.
Sincerely,
Kevin Sullivan Hinkley Remediation Project Manager Attachments: Technical Memorandum – Response to Investigative Order No. R6V-2011-0105 and Peer
Review Comments on Laboratory Quality Control Data for 2007 Groundwater Background Study Report, Hinkley Remediation Project
Compact Disc (CD) – Hexavalent Chromium Analytical Data, Truesdail Laboratories, Inc. and
EMAX Laboratories, Hinkley Groundwater Background Study (CH2M HILL, 2007)

1 | P A G E
T E C H N I C A L M E M O R A N D U M
Response to Investigative Order No. R6V-2011-0105 and Peer Review Comments on Laboratory Quality Control Data for 2007 Groundwater Background Study Report, Hinkley Remediation Project
Pacific Gas and Electric Company
Eliana Makhlouf Shawn Duffy
PREPARED BY: CH2M HILL
DATE: January 19, 2012
PROJECT NUMBER: 432629
This technical memorandum presents the response to Investigative Order No. R6V-2011-0105 issued by the California Regional Water Quality Control Board, Lahontan Region (Water Board) (Water Board, 2011), which requested information on laboratory quality control data for the Groundwater Background Study Report (CH2M HILL, 2007), prepared on behalf of Pacific Gas and Electric Company (PG&E) for the Hinkley Remediation Project. In addition, this memorandum presents responses to comments provided by Dr. Nagourney in the Peer Review received by the Water Board on October 14, 2011.
The responses to questions one through nine in Investigative Order R6V-2011-0105 are provided below.
1) Comment: For the continuing calibration verification (CCV) failures for EPA Method SW 7199,
discuss what percentage out of range were the CCV recoveries. Response: During the first Groundwater Background Study sampling event, (January/February 2006) all Method SW 7199 sample analyses were performed by Truesdail Laboratories, Inc. (TLI) and the CCV recoveries for all analyses were within the method criteria of 90 – 110% recovery. For the three subsequent sampling events, all Method SW7199 sample analyses were performed by EMAX Laboratory (EMAX). Of the 129 sample analyses performed by EMAX, 31 (26 samples and 5 field duplicates) or 24 percent had one or more of the bracketing CCVs with recoveries that were outside the method criteria. CCV recoveries for the out of control sample analyses ranged from a low of 72 percent to a high of 123 percent with 19 results biased low and 12 biased high. In accordance with the PG&E program Quality Assurance Project Plan (QAPP) (CH2M HILL, 2008) that cites USEPA National Functional Guidelines for Inorganic Data Review (2002), the range of the out of control CCV recoveries was not significant enough to warrant data rejection, but did require data qualification by applying “J/UJ” flags to out of control results. Therefore, the results were determined to be of sufficient quality to be used for purposes of the Groundwater Background Study.
2) Comment: Provide raw data, calibration curves, CCVs, and quality control (QC) samples, from hexavalent chromium analysis. Response: All analytical data for hexavalent chromium are provided on the enclosed CD. The data are organized by sample delivery groups (SDGs) provided to CH2M HILL by the laboratories. There are 17 SDGs from EMAX and four SDGs from TLI. The table below identifies each SDG number associated with hexavalent chromium analysis associated with the Groundwater Background Study.
PREPARED FOR:
COPY TO:

RESPONSE TO INVESTIGATIVE ORDER NO. R6V-2011-0105 AND PEER REVIEW COMMENTS ON LABORATORY QUALITY CONTROL DATA FOR 2007 GROUNDWATER BACKGROUND STUDY REPORT, HINKLEY REMEDIATION PROJECT
2 | P A G E
EMAX SDG Numbers TLI SDG Numbers
06D180, 06D191, 06D205, 06D215, 06G152, 06G165, 06G182, 06G200, 06I248, 06I262, 06I280, 06J236, 06J257, 06J279, 06K142, 06K156, 06K180
951265, 951327, 951368, 951421
3) Comment: Provide information on matrix spike amounts and recoveries for hexavalent chromium. Response: The spike concentration at TLI for hexavalent chromium was 1.0 microgram per liter (µg/L). There were four SDGs of data with three different site specific matrix spike samples in three of the four SDGs. The SDG without the site specific matrix spike has a matrix spike completed on a non-site sample. The recoveries were all in control with 98, 94, and 106 percent recovery. The acceptance limits used by the laboratory were 90 – 110 percent. The concentration of the matrix spike was five times the reporting level and applicable to the majority of sample concentrations determined over the study. The spike concentration at EMAX Laboratory for hexavalent chromium was 1.0 µg/L. There were 17 SDGs of data with 18 different site specific matrix spike samples in 15 of the 17 SDGs. The SDG without the site specific matrix spike has a matrix spike completed on a non-site sample. The recoveries were predominantly in control ranging from 76 to 115 percent recovery. The acceptance limits used by the laboratory were 85 – 115 percent. Two of the 18 matrix spikes were out of control with a low bias but still provide data that met project data quality objectives for evaluating background hexavalent chromium concentrations. The concentration of the matrix spike was five times the reporting level and applicable to the majority of sample concentrations determined over the study.
4) Comment: A description of how samples were chosen for matrix spiking. Response: The matrix spikes were randomly selected by the laboratory as part of the analytical batch control requirements.
5) Comment: Provide evidence that Mid-Range Calibration Check Standards (MRCCSs) were prepared from a second source standard. Provide National Institute of Standards Traceability (NIST) documentation for MRCCSs. Response: MRCCSs were prepared from a different lot number source from the initial calibration stock at TLI as well as at EMAX Laboratory as shown in files provided on the attached CD. This same standards traceability documentation is also available in each of the SDGs provided in response to Question Number 2.
6) Comment: Verify which calibration curve was used for EPA Method 6010B (was the standard or low level calibration curve used?). Provide documentation showing calibration curve. Response: Method 6010B was not used by either lab for the Hinkley Groundwater Background Study rather Method 6020 was used for total chromium analysis as explained in the response to Question Number 9.
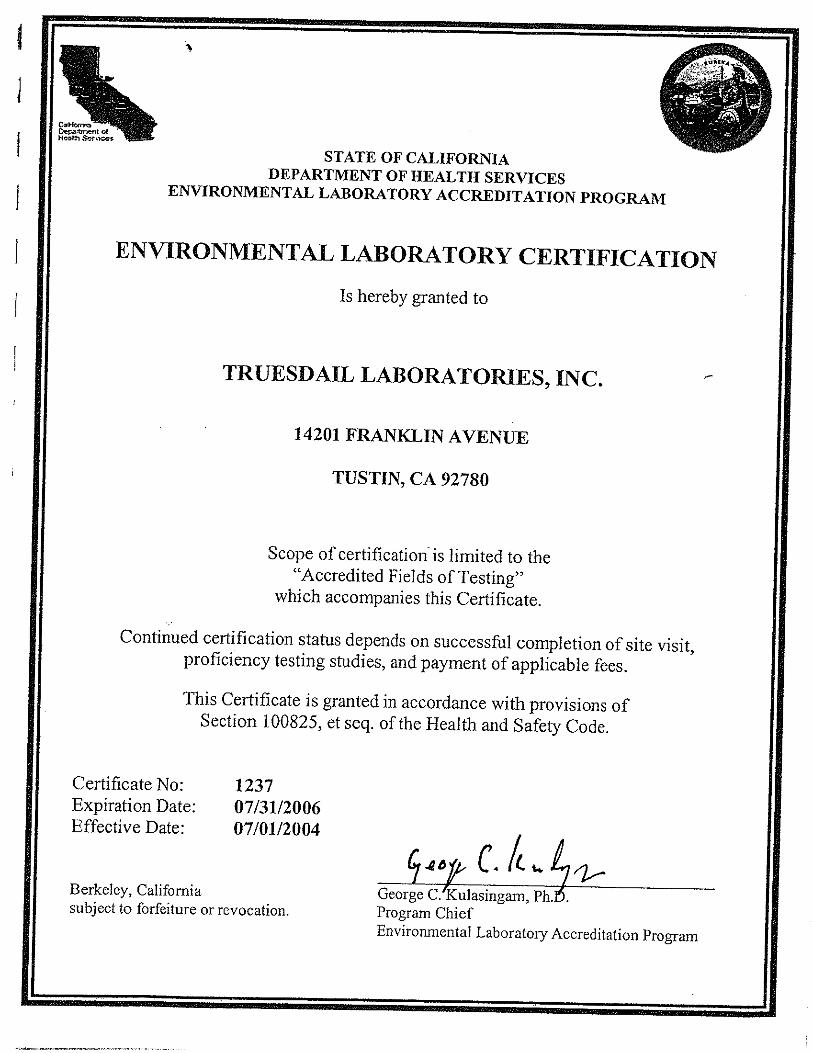
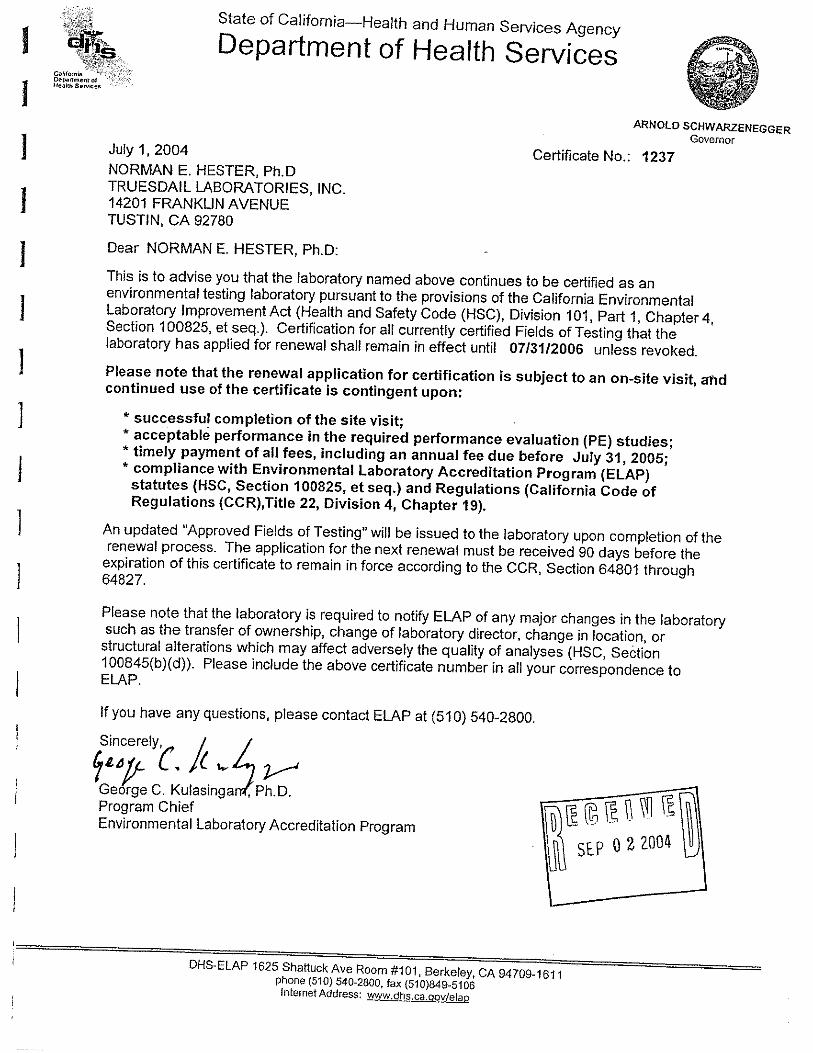
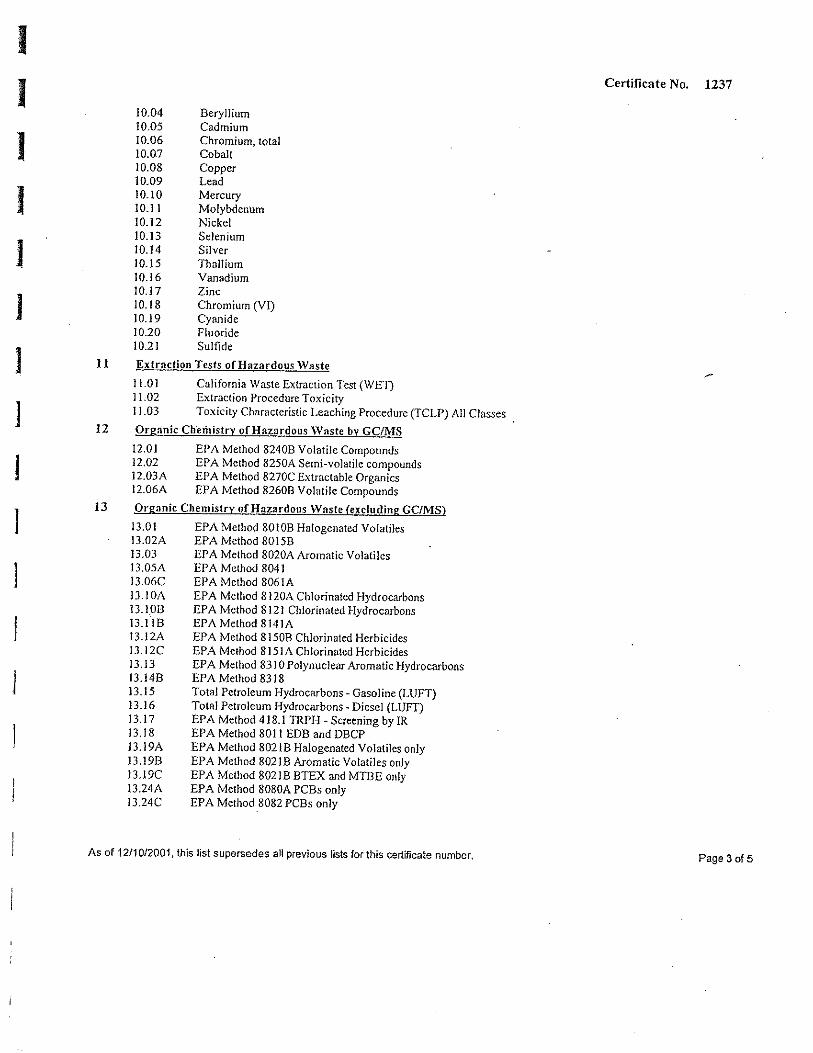
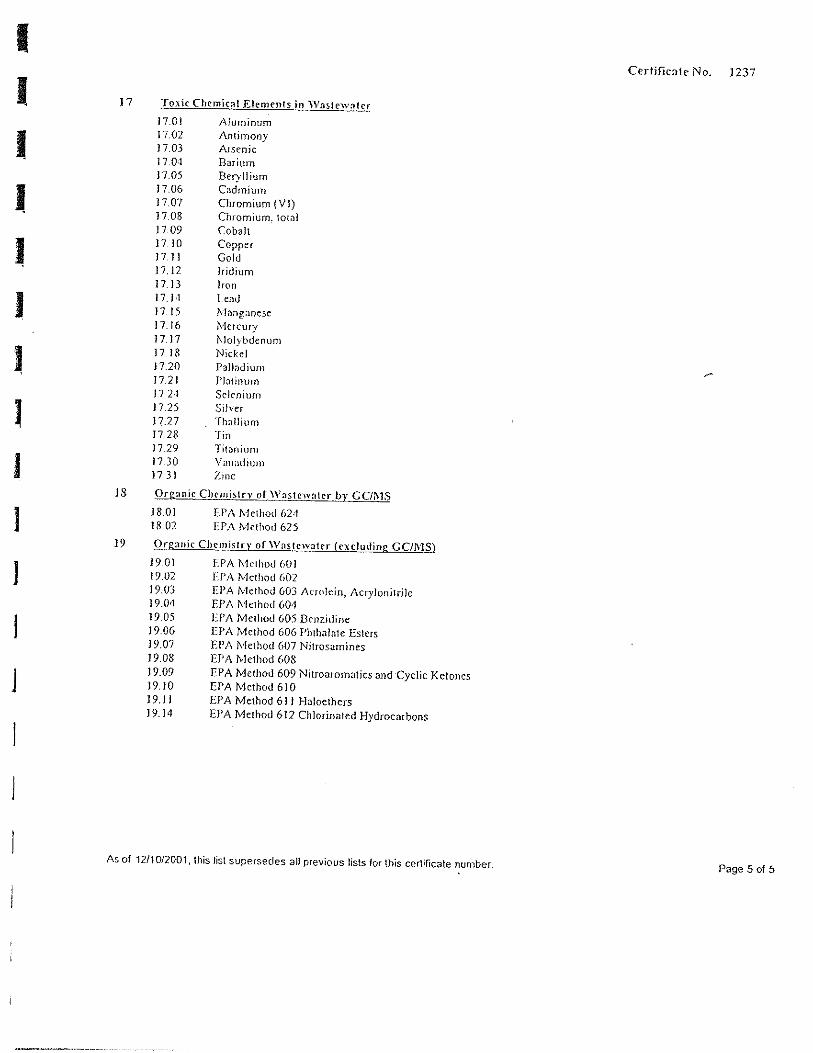
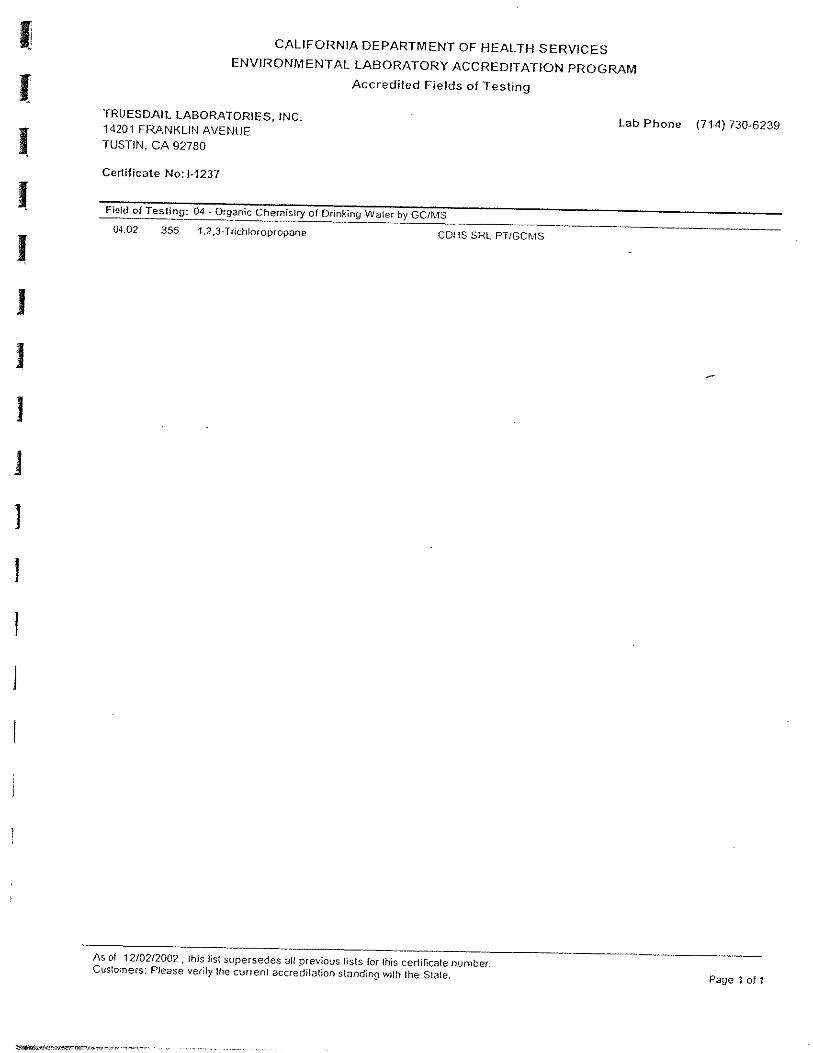
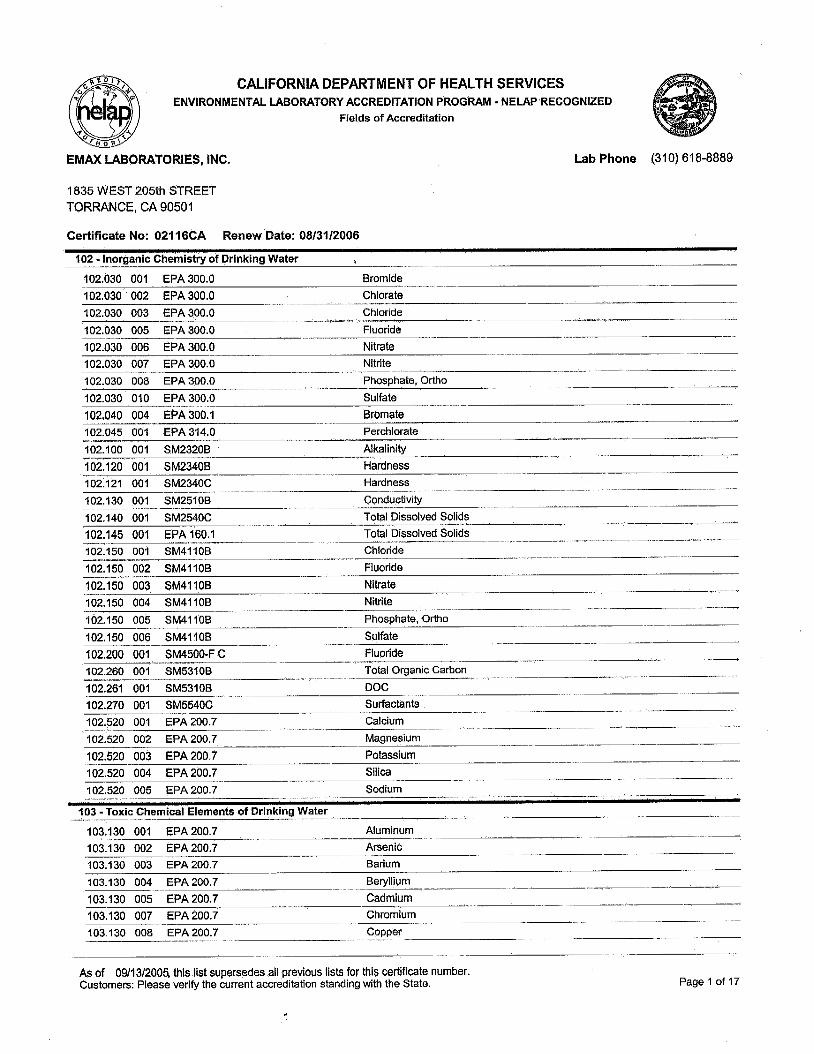
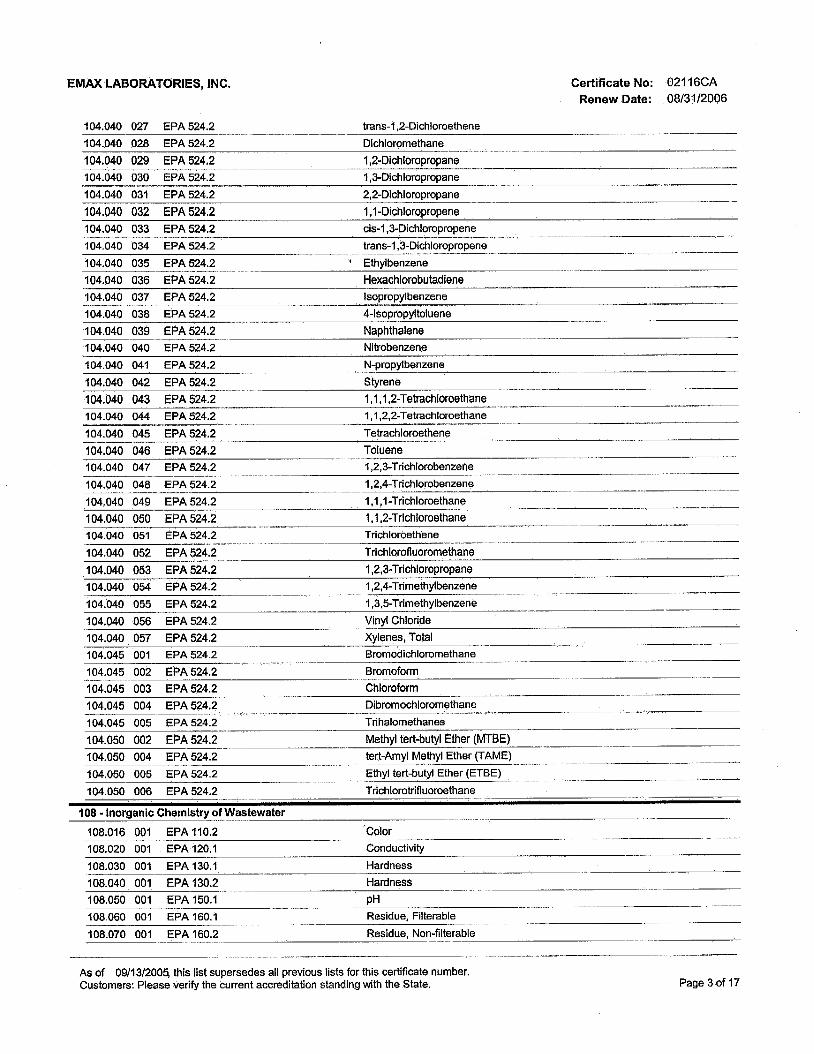
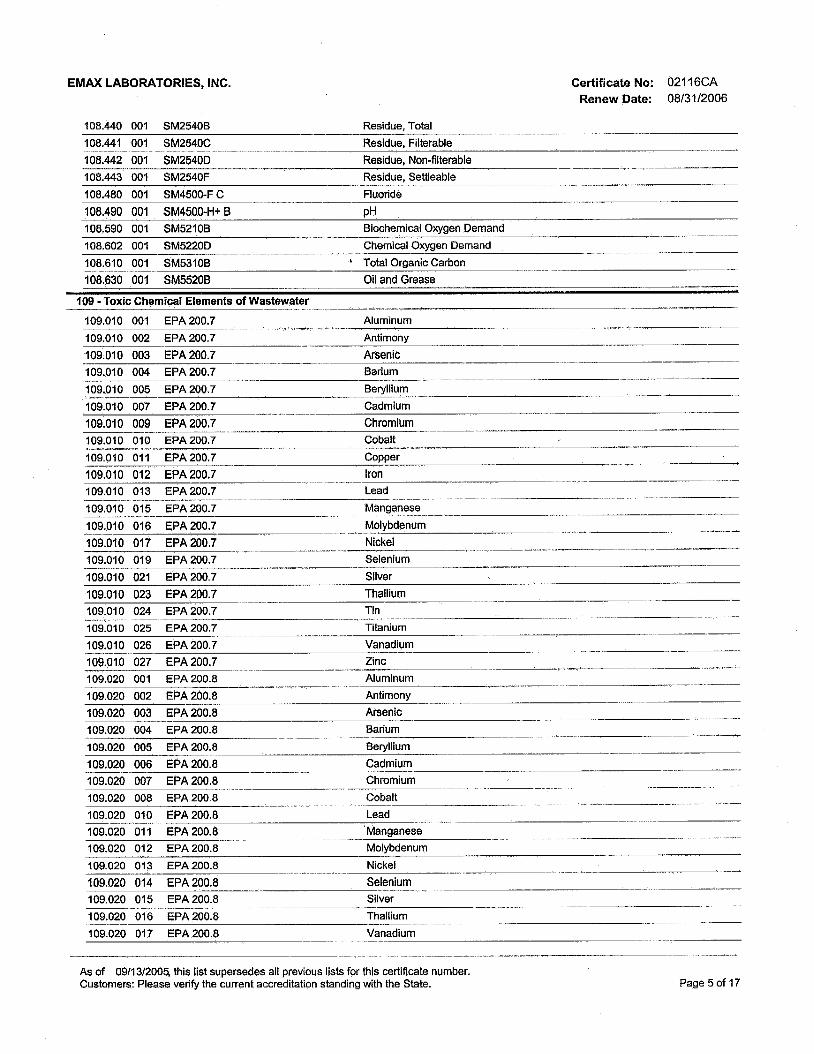
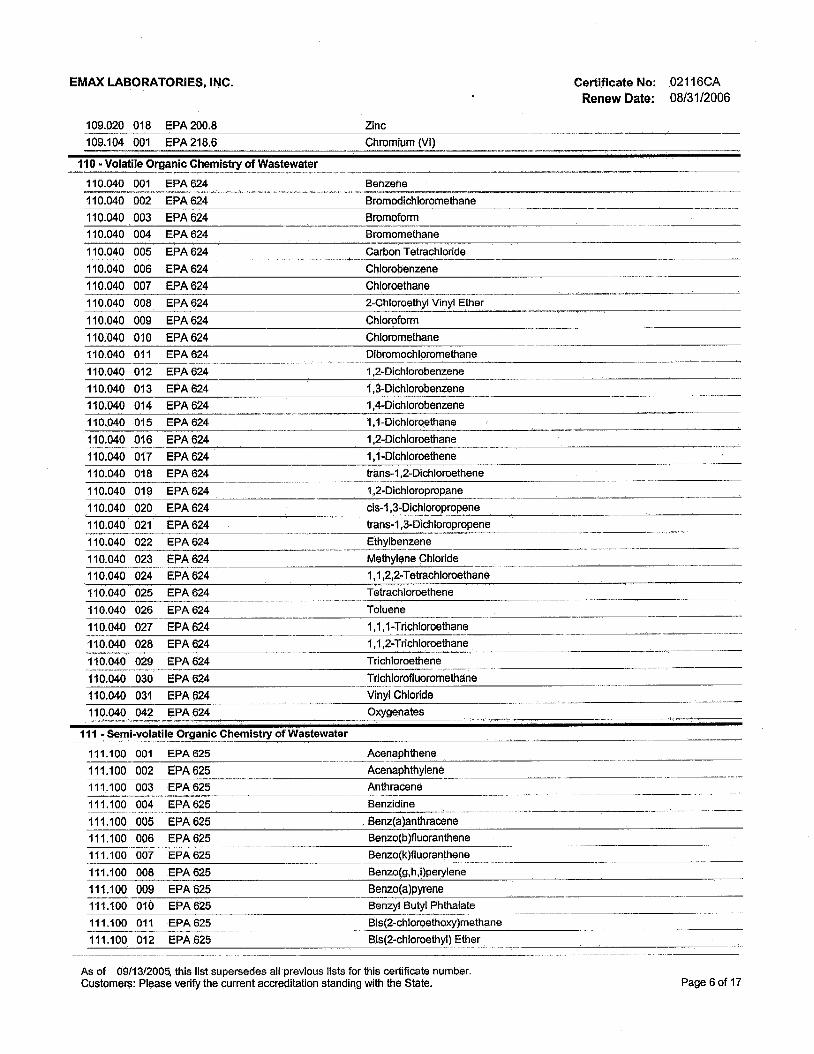
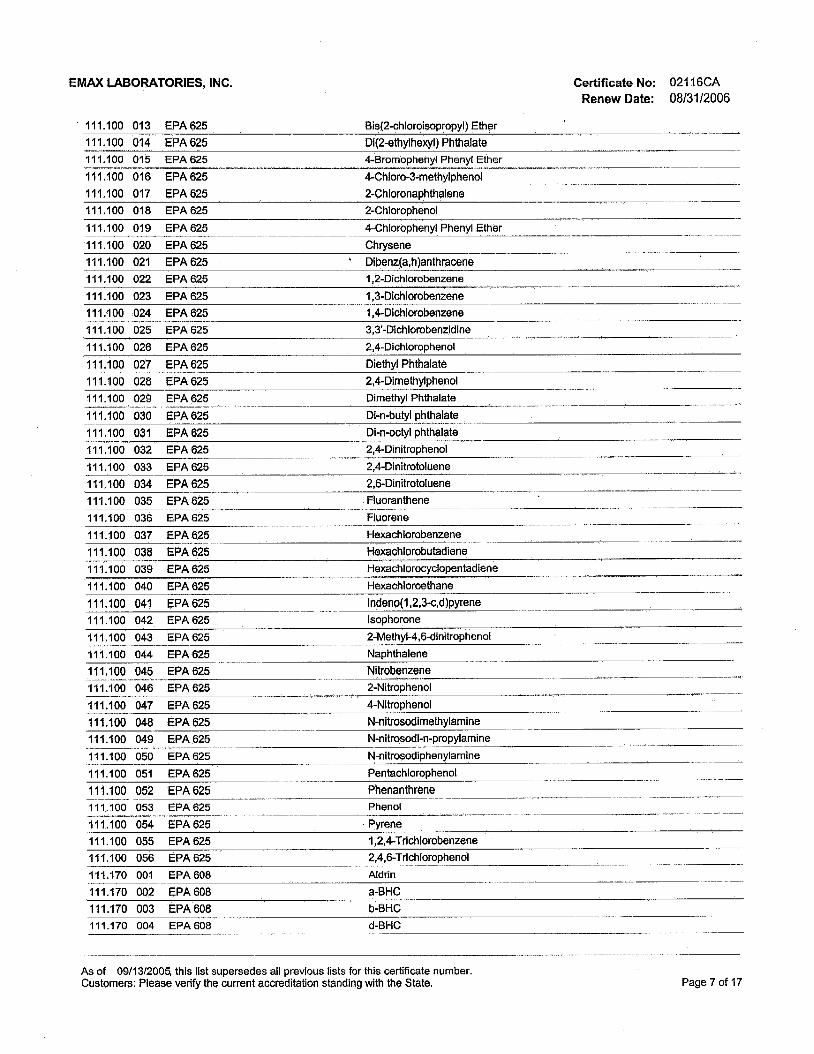
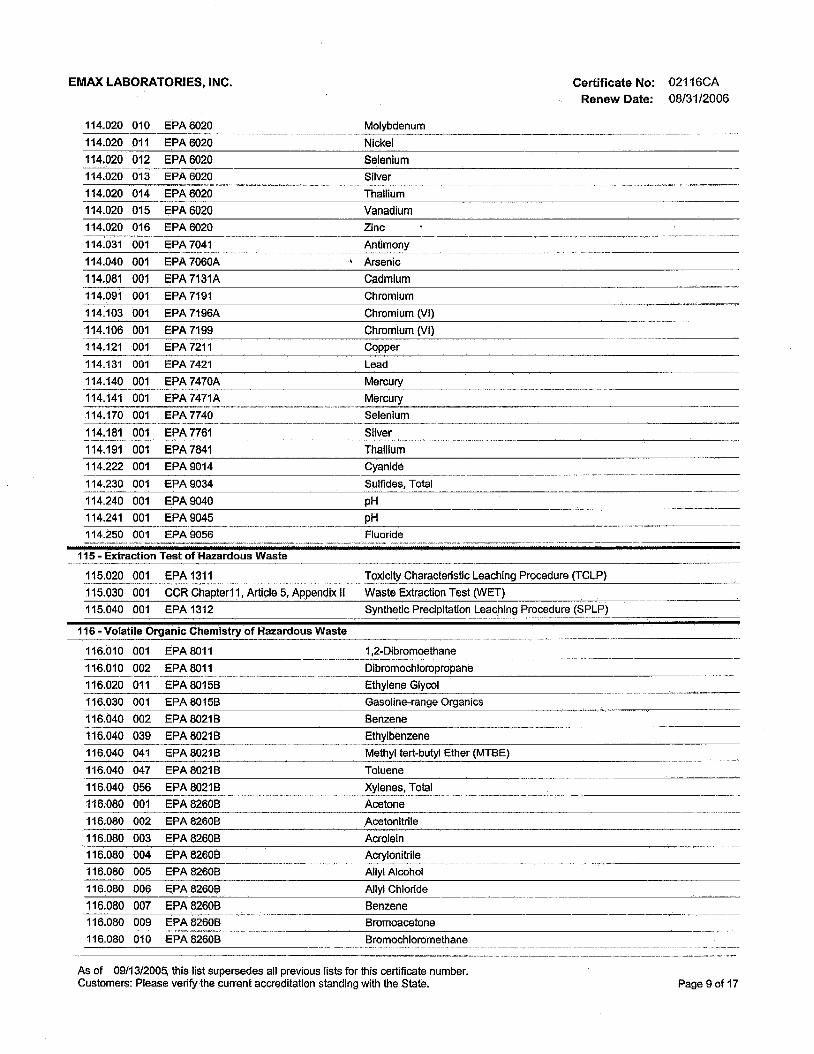
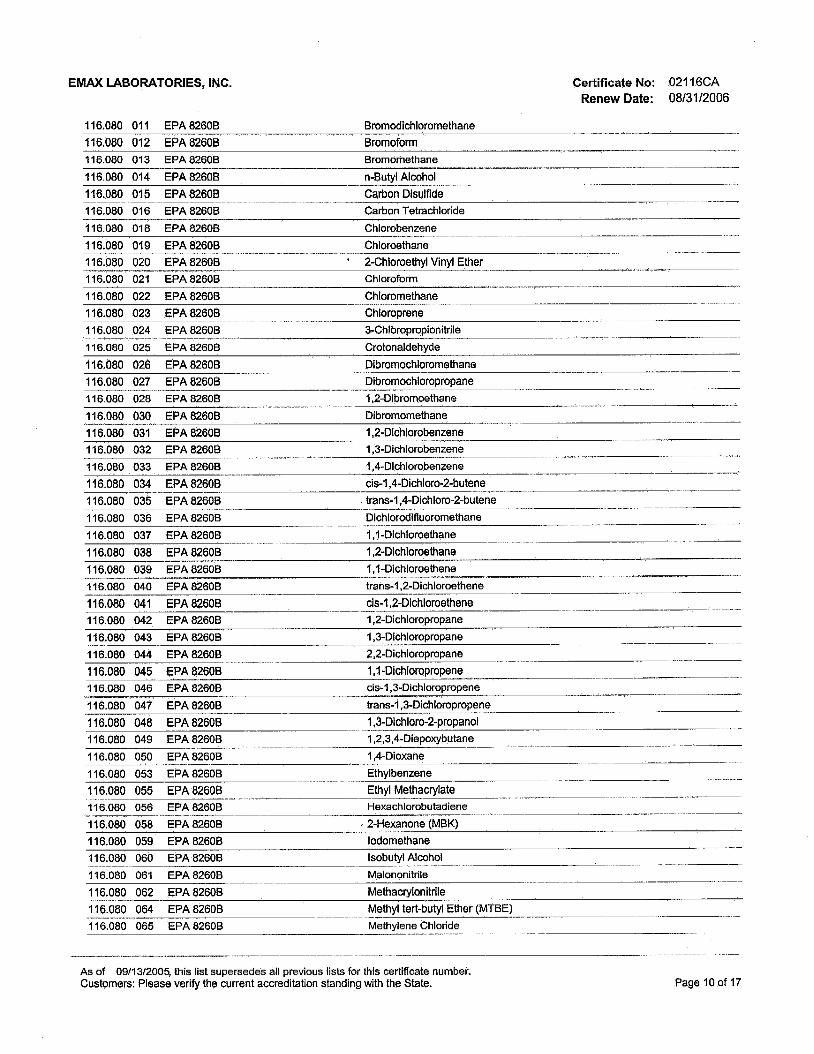
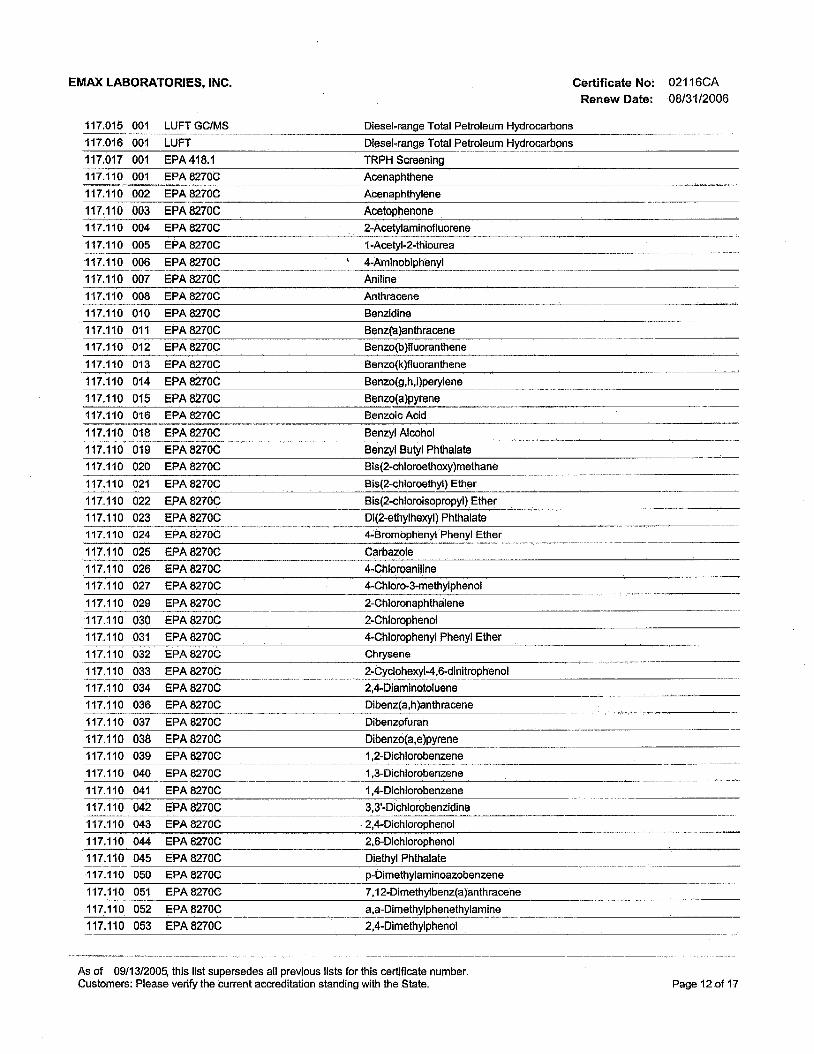
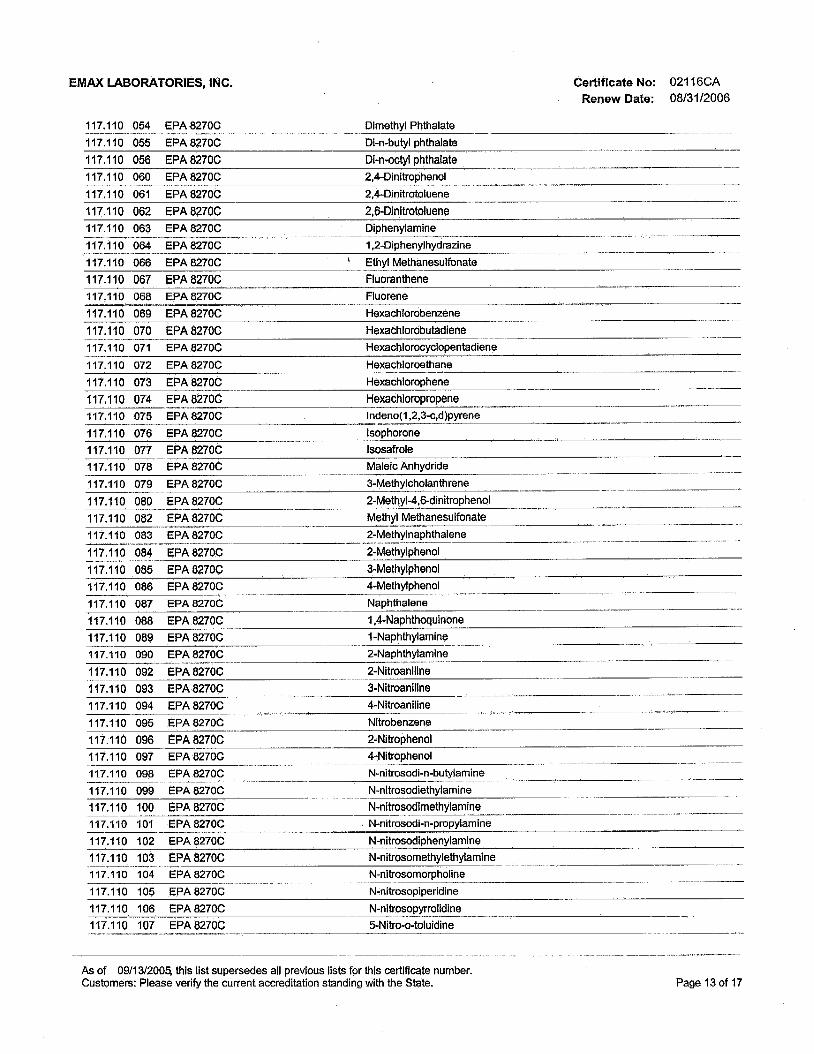
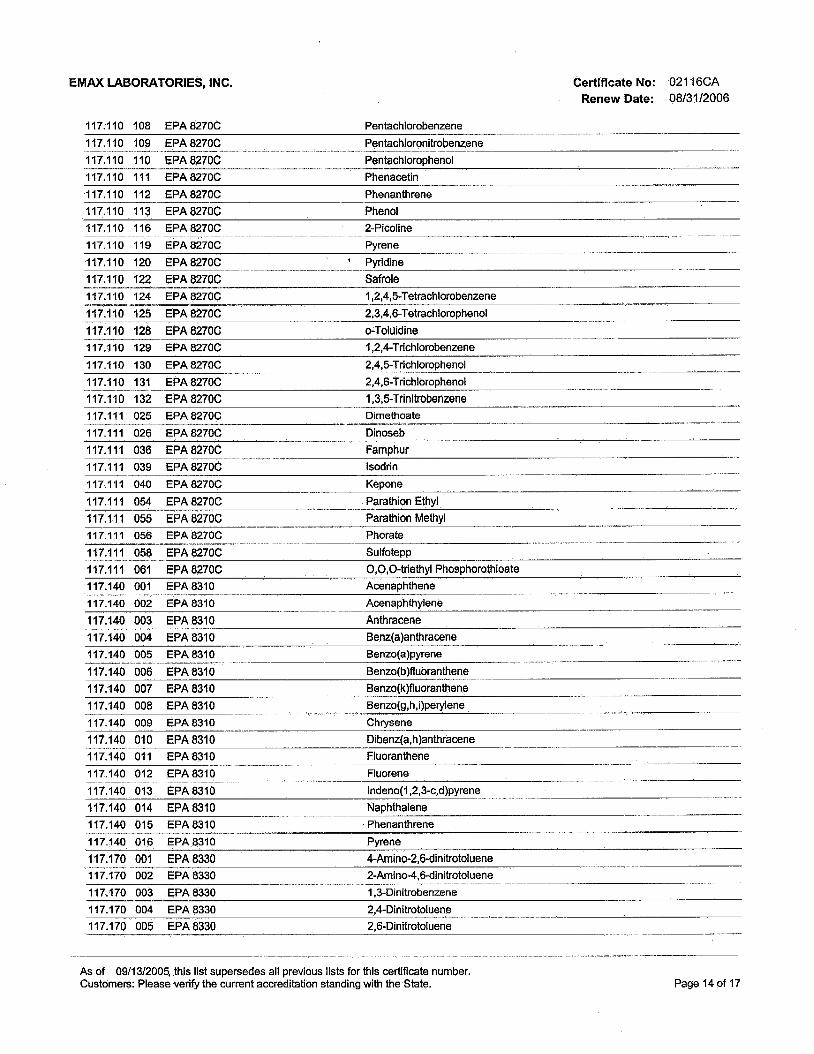
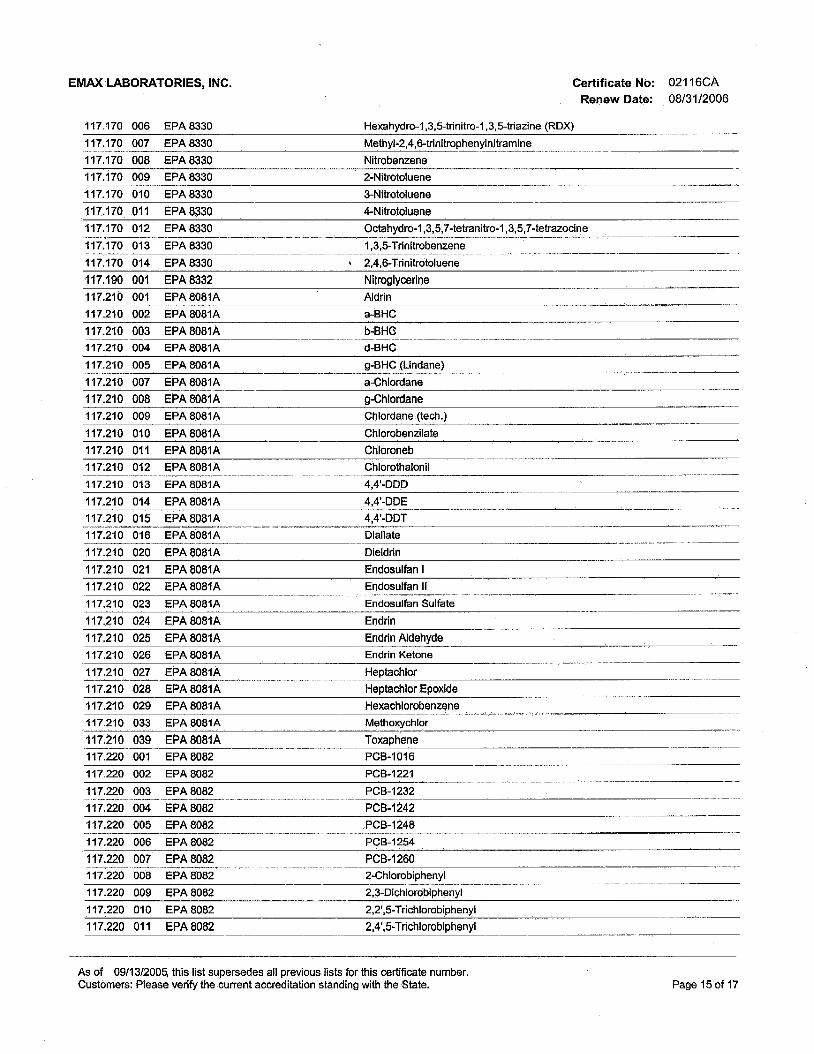
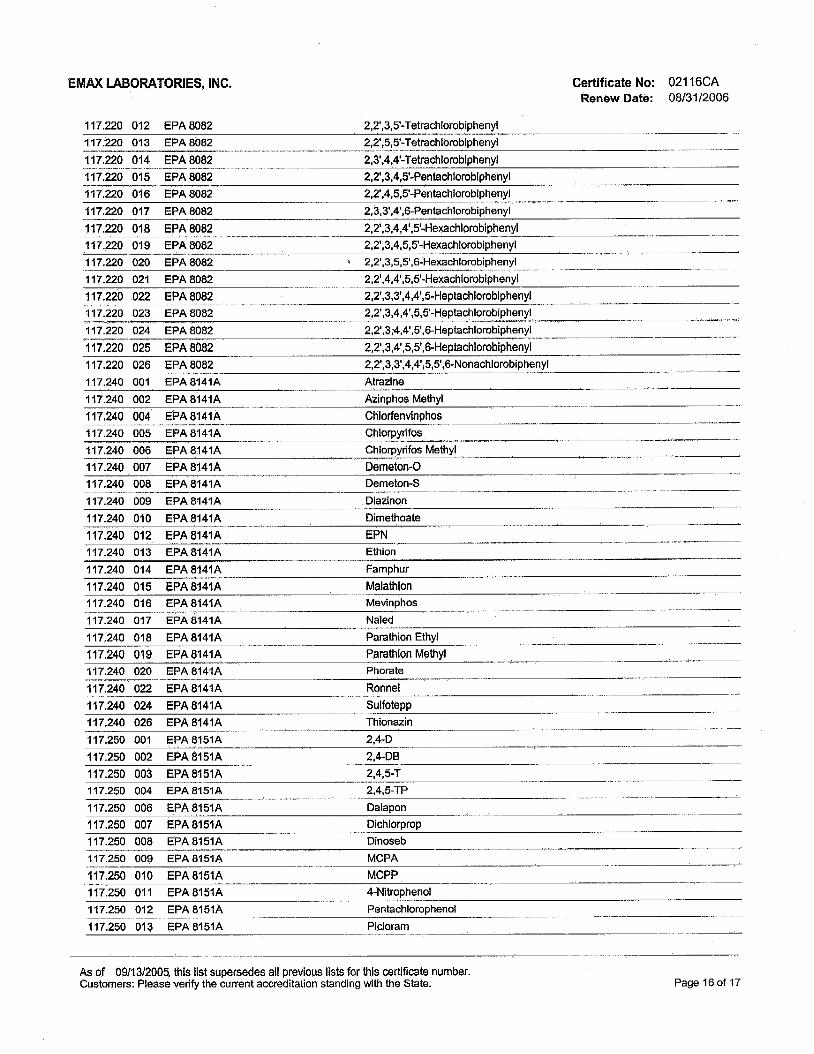
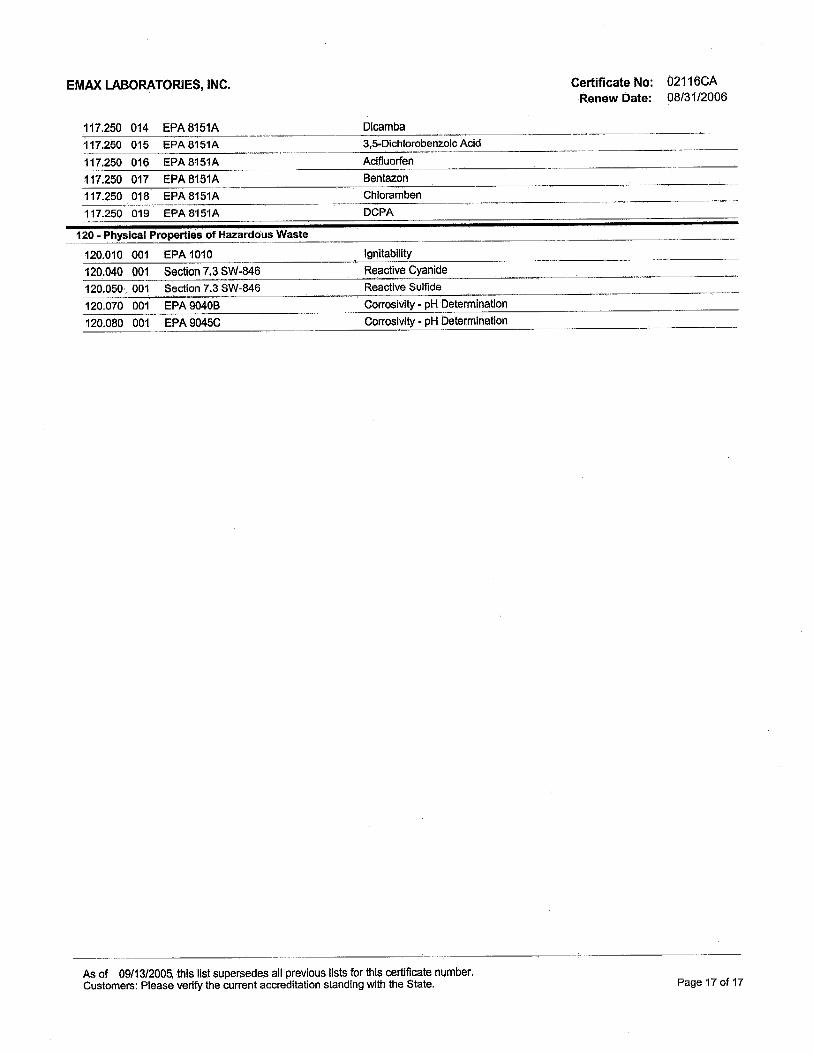
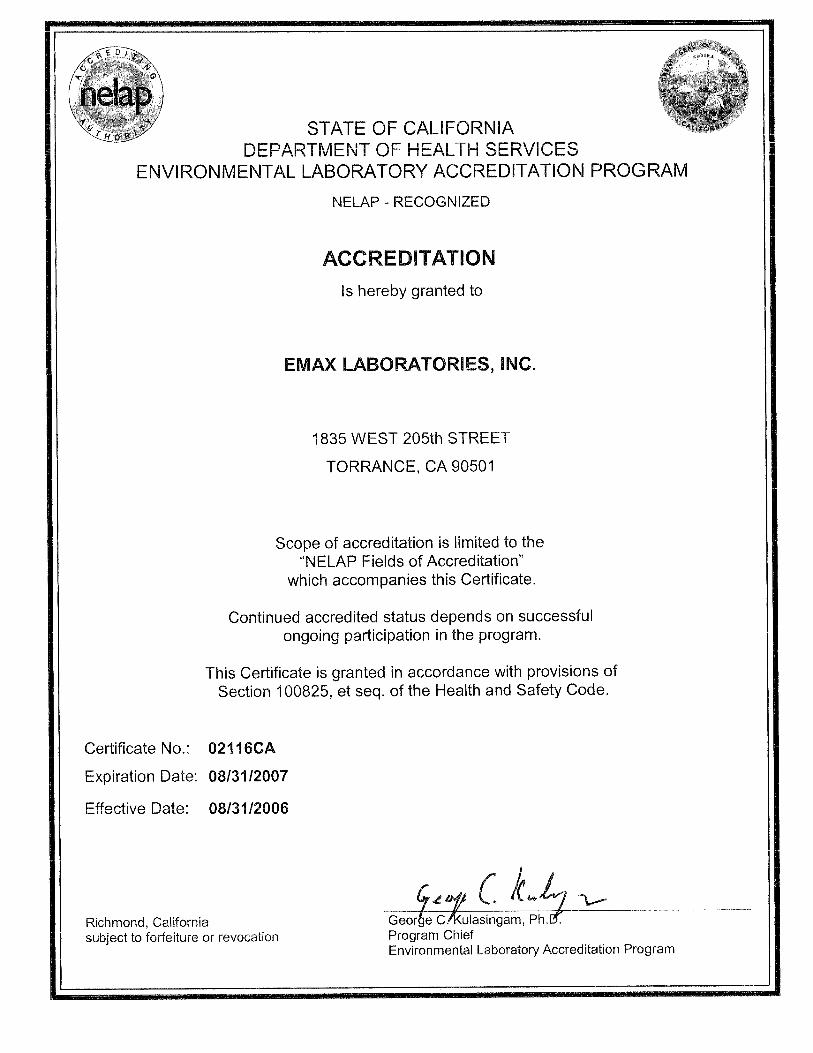
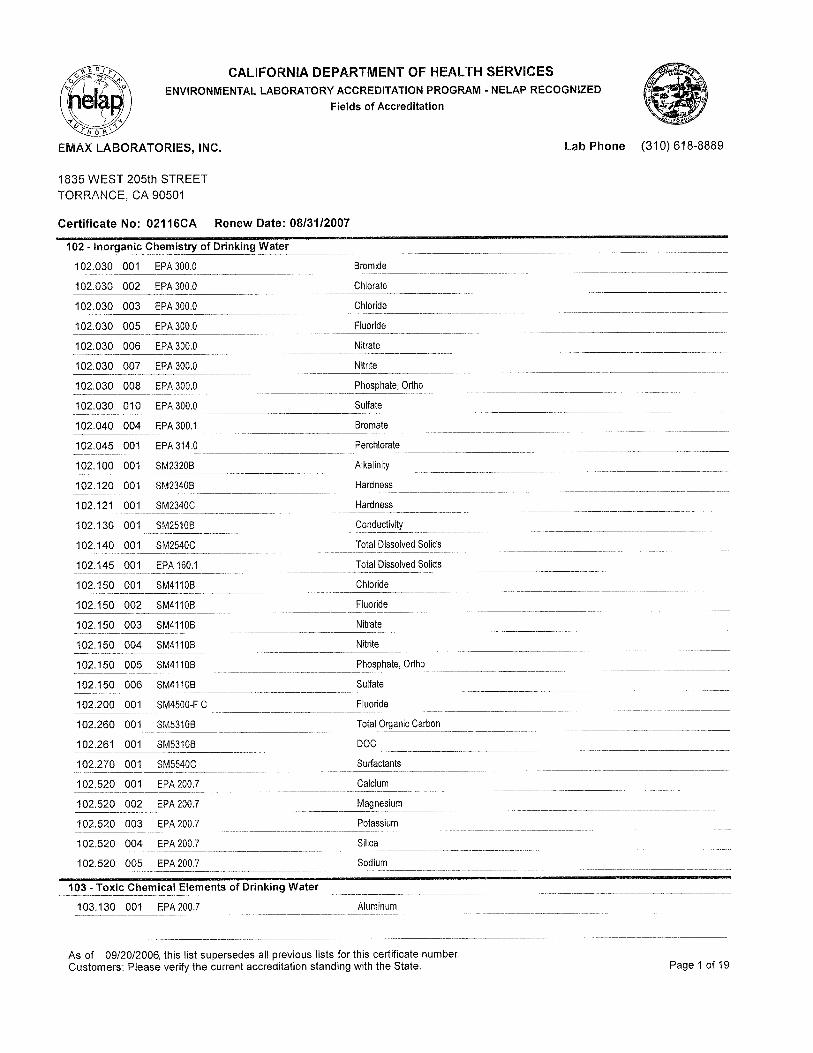
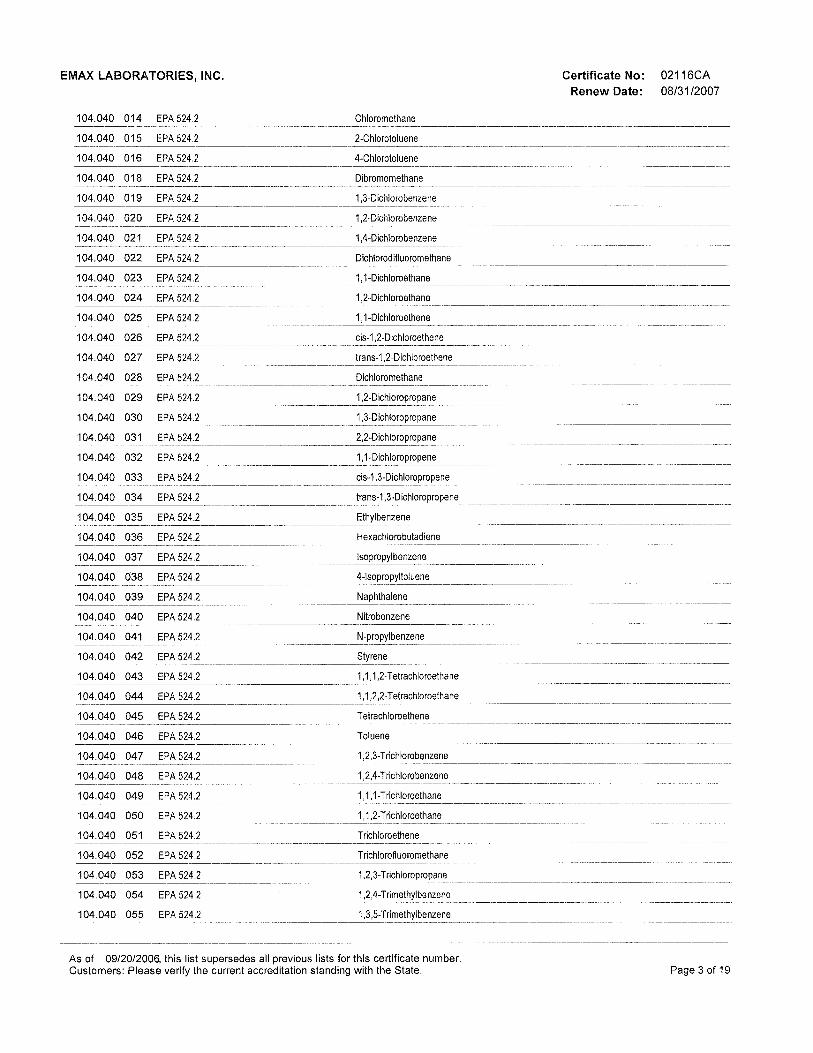
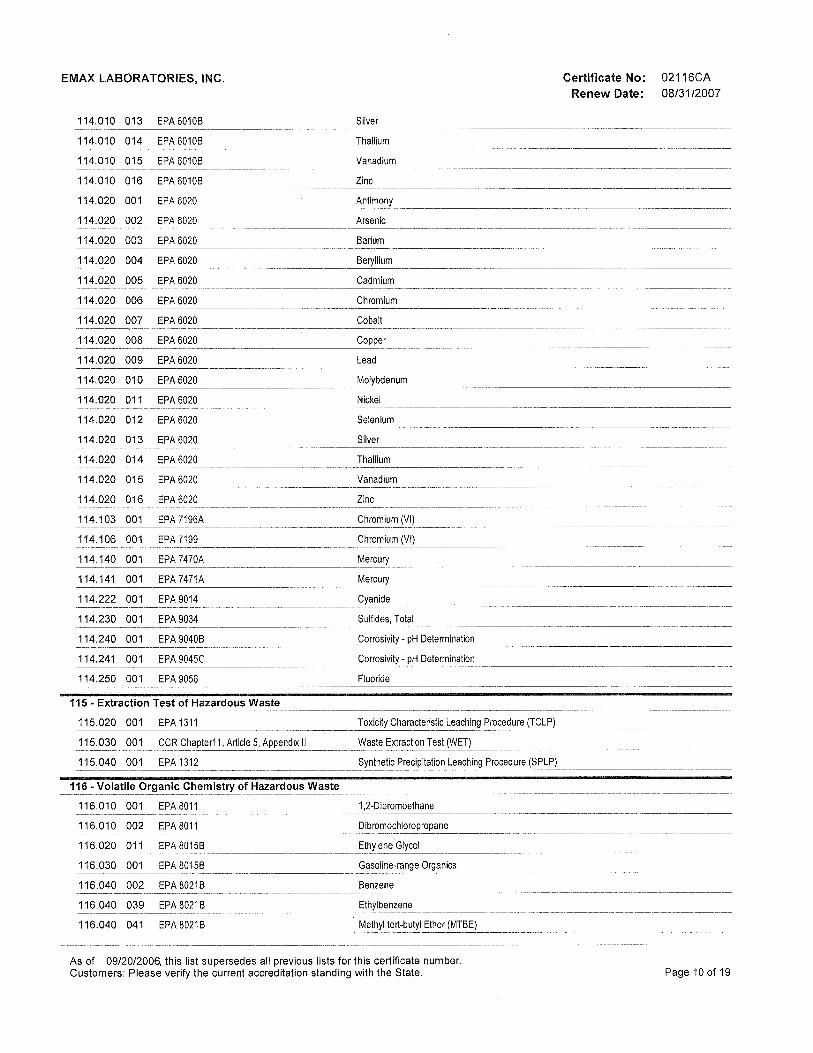
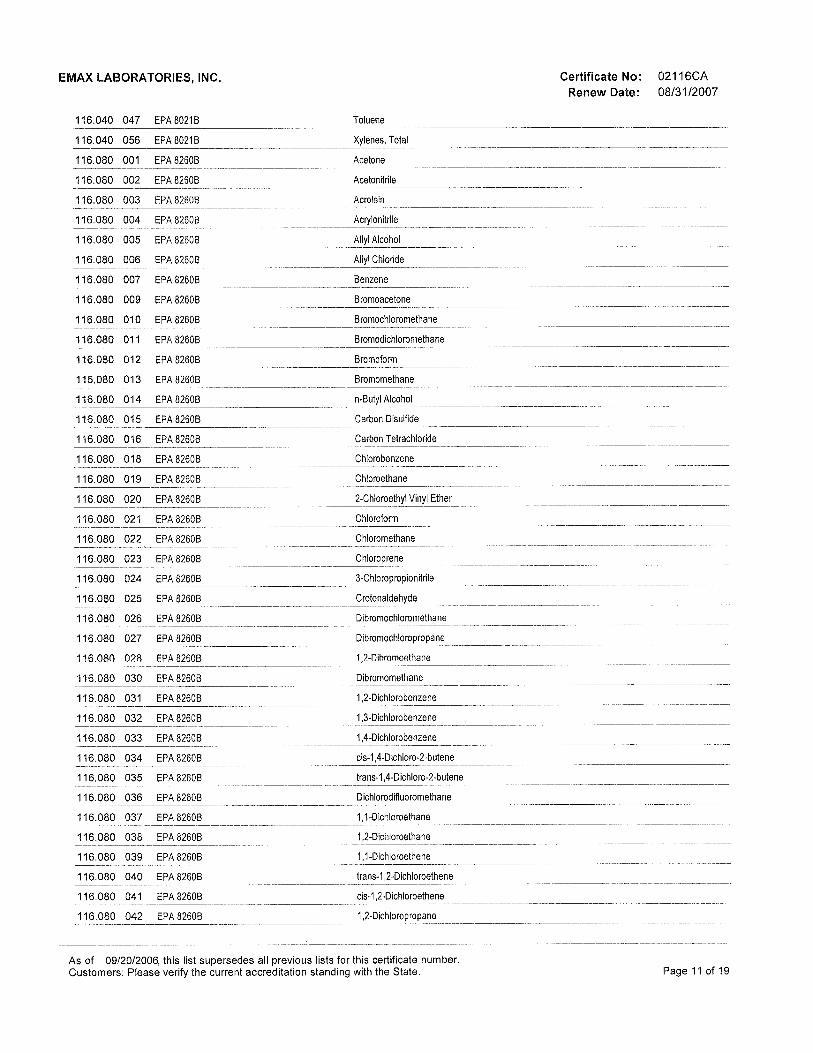
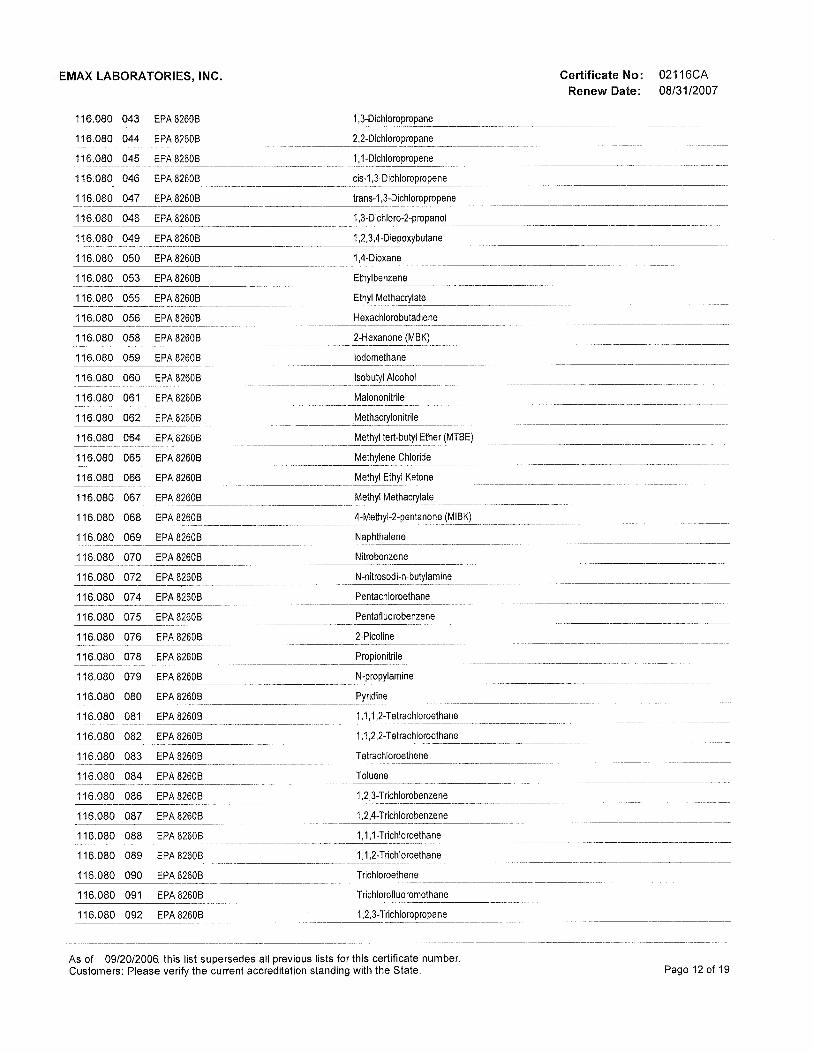
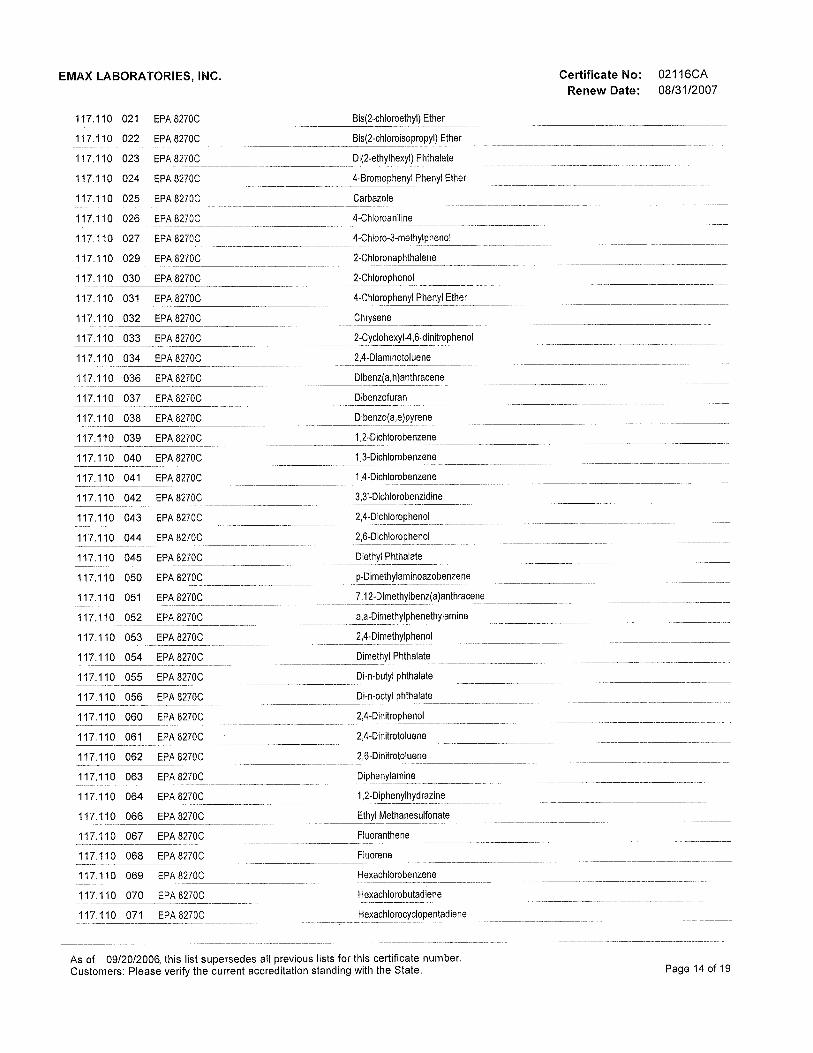
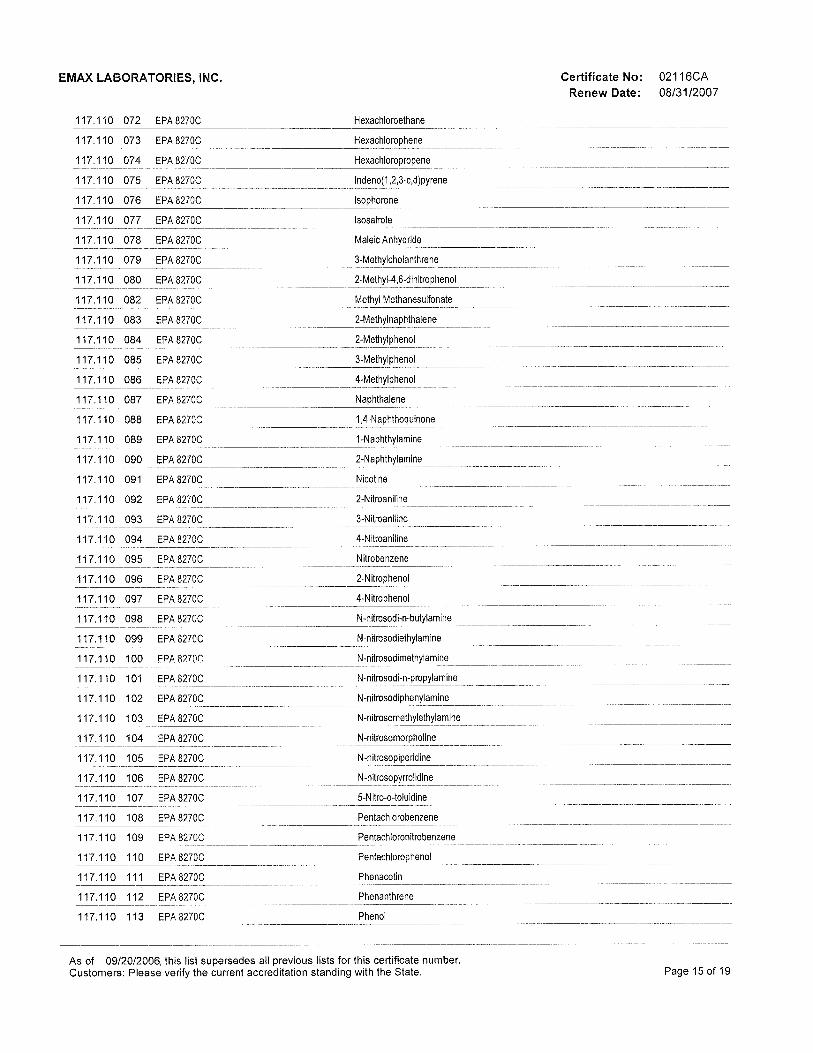
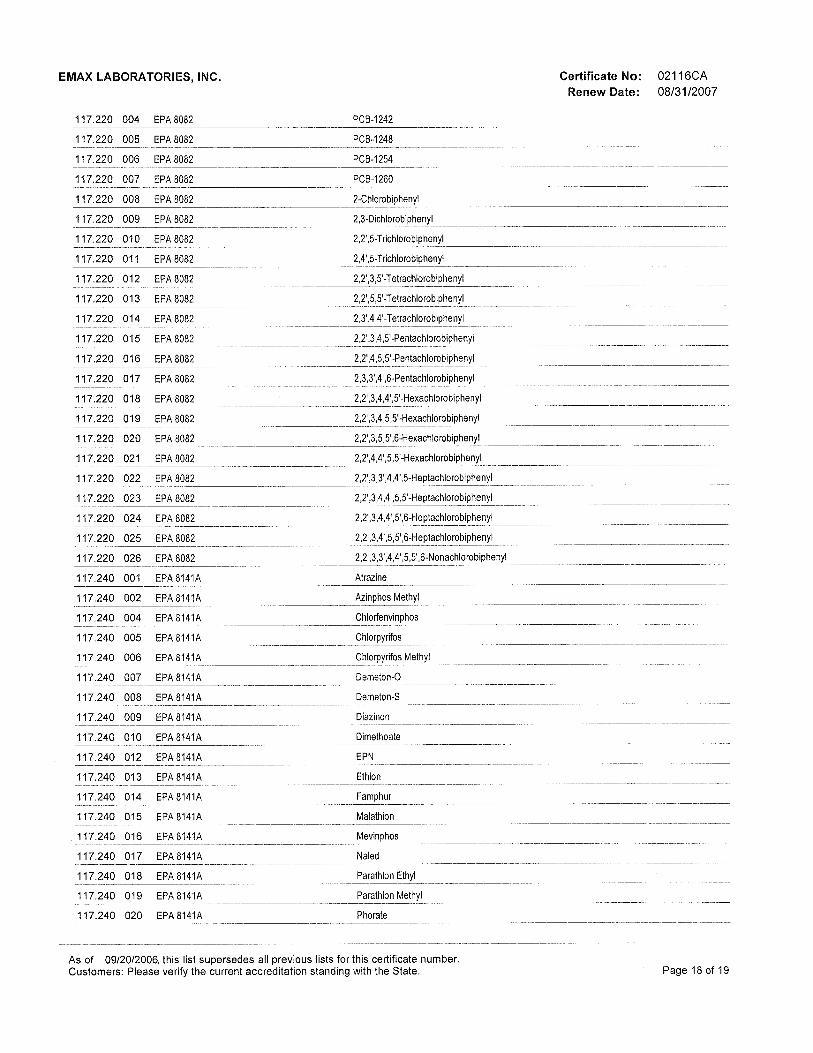
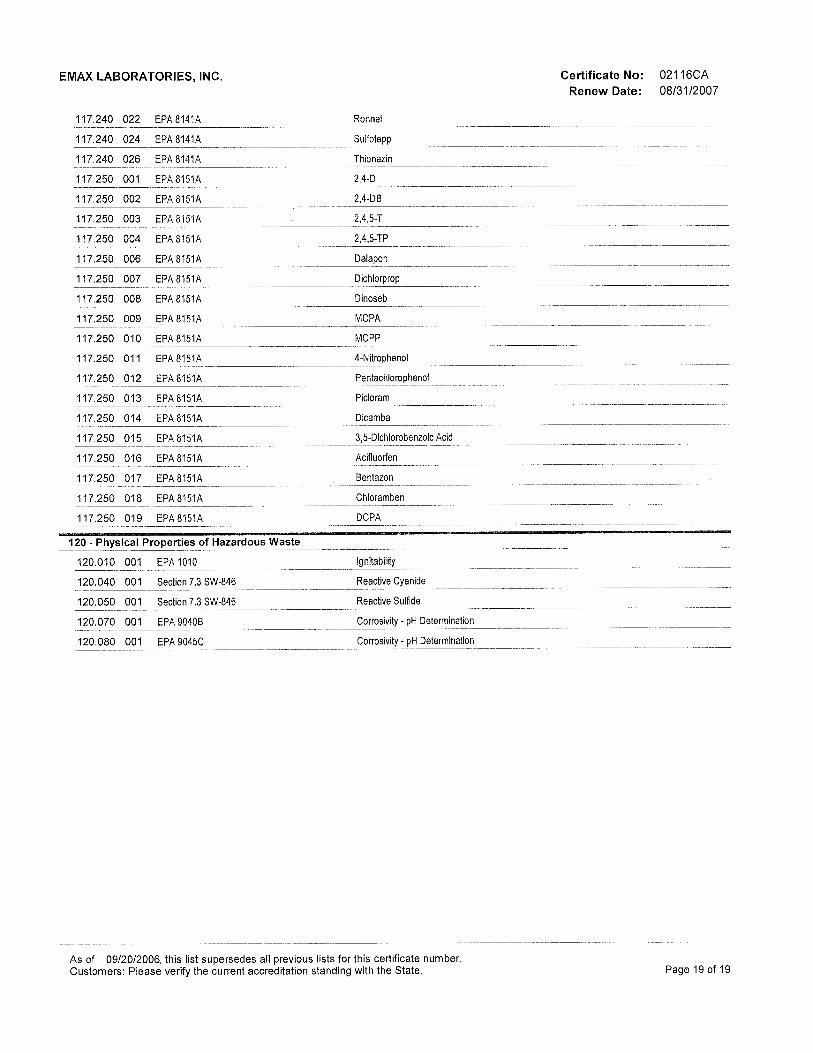
7) Comment: Provide valid California Environmental Laboratory Accreditation Program (ELAP) certificates for each lab for total and hexavalent chromium analysis for the calendar year 2006. Response: Both TLI and EMAX were ELAP certified in 2006. Copies of the certifications for 2006 are provided in Attachment A.

RESPONSE TO INVESTIGATIVE ORDER NO. R6V-2011-0105 AND PEER REVIEW COMMENTS ON LABORATORY QUALITY CONTROL DATA FOR 2007 GROUNDWATER BACKGROUND STUDY REPORT, HINKLEY REMEDIATION PROJECT
PAGE | 3
8) Comment: Discuss why EPA Method 6800 was not used for chromium species identification. Response: The Hinkley Background Study was conducted from January to November 2006 and therefore pre-dated the promulgation of Method 6800, which was posted in February 2007.
9) Comment: Discuss why EPA method 6020A was used instead of Method 6010 for total chromium. Response: USEPA method 6020A achieves a lower level of detection for total chromium than that of EPA Method 6010B and therefore was used for the project.
Attachment B to this technical memorandum provides additional responses to comments provided by Dr. Nagourney regarding the quality control procedures used by the laboratory for chromium analysis. In summary, based on a review of the laboratory methods and data obtained for the study, the quality of the laboratory analysis performed for the study was appropriate and met all of the requirements of the USEPA methods employed. The issues raised by the reviewer can be explained by 1) the incomplete answers provided to the reviewer by the laboratories, 2) expectations of the reviewer for quality control measures that were slightly different or beyond the requirements of the USEPA methods, or 3) a misunderstanding on the part of the reviewer about which methods were applied to the data set. As summarized in Attachment B, the data yielded through these analyses are deemed of high quality and the use of these data for the purposes of the background study was appropriate. A detailed response to comments on the laboratory chemistry comments is provided in Attachment B.
References CH2M Hill. 2007. Groundwater Background Study Report, Hinkley Compressor Station, Hinkley,
California. February.
__________. 2008. PG&E Program Quality Assurance Project Plan. December.
United States Environmental Protection Agency (USEPA). 2002. USEPA Contract Laboratory Program National Functional Guidelines for Inorganic Superfund Data Review. July.
Regional Water Quality Control Board, Lahontan Region (Water Board), 2011. Investigative Order R6V-2011-0105, Request for Information on Laboratory Quality Control Data for 2007 Groundwater Background Study Report, Pacific Gas and Electric Company (PG&E), Hinkley Compressor Station, San Bernardino County. December.
Attachments Attachment A California ELAP Certificates for Truesdail Laboratories, Inc. and EMAX
Laboratories Attachment B Response to Comments on Laboratory Chemistry and Quality Control Data Compact Disc (CD) Hexavalent Chromium Analytical Data, Truesdail Laboratories, Inc. and EMAX
Laboratories, Hinkley Groundwater Background Study (CH2M HILL, 2007)

Attachment A California ELAP Certificates – Truesdail
Laboratories, Inc. and EMAX Laboratories


Attachment B Responses to Comments on Laboratory
Chemistry and Quality Control Data
Attachment B: Responses to Comments on Laboratory Chemistry and Quality Control Data CH2M HILL has reviewed the Peer Review comments on the Hinkley Groundwater Background Study (CH2M HILL, 2007) related to laboratory methods and quality control data prepared by Dr. Stuart Nagourney of the College of New Jersey on behalf of the Regional Water Quality Control Board, Lahontan Region (Water Board), dated October 14, 2011. Based on this review, the quality of the laboratory analyses was determined to be appropriate and to meet all of the requirements of the USEPA methods employed.
Detailed Response to Comments
The issues raised by Dr. Nagourney fall into three general categories: method calibration, establishment of reporting limits (RLs) and method detection limits (MDLs), and quality control (QC) check procedures. Dr. Nagourney posed six questions to the Truesdail Laboratories, Inc. (TLI) and EMAX Laboratories (EMAX). Based on the responses to these questions, Dr. Nagourney provided additional questions and comments regarding QC procedures, including questions on method calibration, RLs, and MDLs. Presented below are responses to each of the additional questions and comments provided by Dr. Nagourney.
1) What calibration ranges were used for Methods 6010B, 6020A and 7199?
Comment on information provided by TLI: It is unclear from the response if the low level calibration ranges cited in the response for Methods 6010B and 6020A were used for the analyses in this study. If not, the data for this study for total chromium (Cr(T)) would be questionable.
Response:
Method 6010B was not used by either lab for the Hinkley Groundwater Background Study.
For Method 6020A, the laboratories used the following calibration ranges: − TLI used 0.2 micrograms per liter (µg/L) to an upper range of 100, 200 or 500 µg/L. − EMAX used 10 µg/L to an upper range of 100 µg/L.
For Method 7199, the laboratories used the following calibration ranges: − TLI used a calibration range of 0.2 to 50 µg/L. As noted here, TLI did use a low
concentration standard, 0.2 µg/L, for the low end of the calibration range. − EMAX used 0.2 µg/L to an upper range of 5.0 µg/L.
2) For Method 6020A, what was the value of the Contract Required Quantitation Limit Check
Standard (CRI) and the method control limits?
Comment on information provided by TLI: TLI admitted in their response that they failed to perform this quality assurance as required by the method during the time that data for this study were obtained.
Response: CRI is not a required criterion of 6020A, and as such the failure of TLI to perform this
check did not compromise the quality of the data obtained.
ATTACHMENT B: RESPONSES TO COMMENTS ON LABORATORY CHEMISTRY AND QUALITY CONTROL DATA
2 | P A G E
Regarding method control limits, the PG&E Program Quality Assurance Project Plan (QAPP) (CH2M HILL, 2008) requires the following: − Laboratory Control Sample (LCS) of 85 – 115% (method requires 80 – 120%). An
LCS is a reagent water blank fortified with the compound(s) of interest that is processed through the entire method process just like a sample.
− Matrix Spike/Matrix Spike Duplicate (MS/MSD) of 75 – 125% − The relative percent difference (RPD) or precision between the MS and MSD or
sample and sample duplicate 20%RPD − Post spike and serial dilution are also required per the method requirements.
3) Were reporting limit (RL) check samples analyzed for Methods 7199 and 6010B? If so what are the control limits and what were the actual recoveries?
Comment on information provided by TLI: TLI admitted in their response that they failed to analyze a RL check sample during the time that data for this study were obtained.
Response:
6010B was not used for the Hinkley Groundwater Background Study. RL checks are not required by either method, and as such the failure of TLI to perform
this check did not compromise the quality of the data obtained.
4) How were RLs established for Methods 6010B, 6020A and 7199? What is the relationship between the method detection limit (MDL) & RL for each method? Comment on information provided by TLI: TLI's response of varying criteria for a quantitative relationship between the MDL and RL is too vague to be acceptable.
Response: MDL studies are performed annually and are required to meet the 40 CFR Part 136B
criteria. The California Environmental Laboratory Accreditation Program (ELAP) states the RL
must be defensible, be greater than the MDL, and will be specified by the end user of the data.
The RL is defined by the CDPH as the concentration at which an analyte can be detected in a sample and its concentration can be reported with a reasonable degree of accuracy and precision. The CDPH defined reasonable as ± 20% accuracy and 20% RSD for replicate determinations. The acceptable ranges depend somewhat on the analytical methodology used. The CDPH states that for samples that do not pose a particular matrix problem, the RL is typically about three to five times higher than the MDL.
The RLs used by the labs for the Hinkley Groundwater Background Study were derived from reporting limits specified in the June 29, 2001 Cleanup and Abatement Order (CAO) (Water Board, 2001), also specified in the QAPP (subsequent Waste Discharge Requirements [WDRs] such as R6V-2004-0034 actually specified a higher RL of 1 µg/L for Cr(VI) and 5 µg/L Cr(T)).
In accordance with the project QAPP, an RL level low standard is used in the calibration curve.
No data are reported below the RL. (Non-detects are reported at the RL.)

ATTACHMENT B: RESPONSES TO COMMENTS ON LABORATORY CHEMISTRY AND QUALITY CONTROL DATA
3 | P A G E
5) What standard reference material (SRM) was used for QC for 7199 as per Section 5.4? This data was apparently not reported.
Comment on information provided by TLI: The use of a mid-range check sample is not acceptable as a QC material as per the criteria for quality control specified in Method 7199. This would make the data for this study for Cr(VI) questionable.
Response:
Section 5.4 of the method requires a QCS (quality control sample) defined as “a mid-range standard, prepared from an independent commercial source” (i.e., a secondary source, separate from the initial calibration standards) be used to verify the instruments performance. It does not require Standard Reference Material (SRM), only a standard from a secondary source as defined by the QCS. The procedures used were in keeping with the method and the data obtained is therefore not questionable. − TLI uses a second source material for both their LCS and the second source mid-
range calibration check standard. − EMAX uses a second source for their LCSs.
Both laboratories report LCS data in the lab reports.
6) Why were the spiking levels for both Cr(T) and Cr(VI) analyses much higher than the expected sample concentrations for all analytical methods?
Comment on information provided by EMAX and TLI: This response was not satisfactory. The laboratory should have chosen the concentration level of matrix spikes for both Cr(T) and Cr(VI) to closer to the actual sample levels (usually a multiple of 3-5 the expected value is applied). The choice of much higher spiking levels means that the calculated recoveries have little value in assessing the quality of the actual sample concentrations and the impact to those results from possible matrix interferences.
Response: Method 6020A specifics – “MS/MSD samples should be spiked at the same level, and
with the same spiking material, as the corresponding laboratory control sample that is at the project-specific action level or, when lacking project-specific action levels, at approximately mid-point of the linear dynamic range.” No project specific action level was specified for the background study; therefore, the labs followed the spiking levels specified by the method.
Both laboratories used 1.0 µg/L as the spike concentration for Method 7199. The concentration of the matrix spike was five times the reporting level and applicable to the majority of sample concentrations determined over the study.

ATTACHMENT B: RESPONSES TO COMMENTS ON LABORATORY CHEMISTRY AND QUALITY CONTROL DATA
4 | P A G E
In addition to the initial six questions, Dr. Nagourney noted six additional concerns with analytical data in comments. The following are the concerns and the responses to those concerns.
1. Comment: No criteria were provided from either laboratory as to the criteria for data assigned “U” or “J” flags.
Response: Laboratory analytical data was reviewed by CH2M HILL’s project chemists to assess data quality and to identify deviations from analytical requirements. The flags provided in the Groundwater Background Study were assigned by the project chemists and the criteria associated to a specific result/flag are listed in Appendix F (Data Requiring Validation Flags).
2. Comment: “unusually high percentage of samples failed the quality control criteria for the Continuing Calibration Verification (CCV).”
Response: During the first Hinkley Background Study sampling event, (January/February 2006) all Method SW 7199 sample analyses were performed by TLI and the CCV recoveries for all analyses were within the method criteria of 90 – 110% recovery. For the three subsequent sampling events, all Method SW7199 sample analyses were performed by EMAX Laboratory (EMAX). Of the 129 sample analyses performed by EMAX, 31 (26 samples, 5 field duplicates) or 24 percent had one or more of the bracketing CCVs with recoveries that were outside the method criteria. CCV recoveries for the out of control sample analyses ranged from a low of 72 percent to a high of 123 percent with 19 results biased low and 12 biased high. In accordance with the PG&E program Quality Assurance Program Plan (QAPP) (CH2M HILL, 2008) that cites USEPA National Functional Guidelines for Inorganic Data Review (2002), the range of the out of control CCV recoveries was not significant enough to warrant data rejection, but did require data qualification by applying “J/UJ” flags to out of control results. Therefore, the results were determined to be of sufficient quality to be used for purposes of the background study.
3. Comment: How were samples chosen for matrix spiking (was this procedure randomized so as to not bias the results?)
Response: The matrix spikes were randomly selected by the laboratory.
4. Comment: The work plan specifies the use of method 6010 for the analysis of Cr(T); Method 6020A was used instead. This may impact the ability to quantify for Cr(T) at low concentration levels since the RL for Method 6020A is much lower than that for Method 6010.
Response: Both methods use an Inductively Coupled Plasma (ICP) however Method 6020A pairs that with a mass spectrometer (measuring mass weight) which allows for lower concentration reporting for most metals. Method SW6020A met the RL objectives for the project.
5. Comment: Some data for Cr(VI) in this study were reported by USEPA determinative method 218.6, other data was reported by Method 7196A and still other data was reported by Method 7199. These methods all have different sensitivities and different capabilities to report Cr(VI) without analytical interferences. Why were different methods used to measure Cr(VI)?
ATTACHMENT B: RESPONSES TO COMMENTS ON LABORATORY CHEMISTRY AND QUALITY CONTROL DATA
5 | P A G E
Response: Only Method 7199 was used during the Hinkley Groundwater Background Study to analyze and report standard Cr(VI) results. There is no reference in the background study to either Method 218.6 or 7196.
6. Comment: The authors of the report chose to use a method from the USGS to attempt to define specific Cr species present in samples. This method is not certified by the State or NELAP. Information that was supplied suggests that this USGS method has only been applied to speciation of arsenic. USEPA Method 6800, Elemental and Speciated Isotope Dilution Mass Spectrometry allows the identification of individual Cr species… USEPA Method 6800 is certified by State and NELAP. Why was Method 6800 not used for this application?
Response: Method 6800 was posted in February 2007, and the Hinkley Groundwater Background Study samples were collected quarterly from January 2006 to November 2006 and the report was submitted to the Water Board in Feb 2007 and therefore pre-date promulgation of Method 6800.

A2-5: February 23, 2012: Excelchem Laboratories review of PG&E’s Response to
Investigative Order No. R6V-2011-0105

