a5b: line spectra and energy
TRANSCRIPT

Date Modified 11/20/07 1
A5b: Line Spectra and Energy Before you come to the lab, complete I-III!!!
I. Read the ENTIRE lab.
II. Answer the following questions:
a. What kind of spectra will you be viewing? (Emission, Absorption, or Continuous) How do you know?
b. How many nanometers (nm) are in 1 meter? What fraction of 1 meter is 1 nm? (Give your answer as a power of ten)
c. What fraction of 1 Joule (J) is 1 elevtronvolt (eV) (Give your answer in scientific notation)
d. Given the wavelength, λ, and speed of light, c, how will you find the frequency?
e. Given the frequency, f, and Planck’s constant, h, how will you find the energy of a photon in Joules (J)?
III. Complete tables 1 and 2 of pg. 9 in the analysis section before you begin. These are the theoretical energy levels of electrons and the differences between electron energy levels in the Hydrogen atom in electronvolts (eV) which you will then compare to photon energies in (eV).

Date Modified 11/20/07 2
Introduction:
The purpose of this experiment is to observe the line spectra produced by several low-pressure atomic gasses when they are subjected to a large electric potential. For one of the gasses, Hydrogen, the wavelengths will be measured and the corresponding energies will be calculated. This experiment will provide an opportunity to become more familiar with concepts of radiation, energy absorption, and the behavior of gasses when their energy levels are excited, all of which are of central concern to many different health studies related careers. The relationship between energy levels, line spectra, and atomic energy all can be easily related to such equipment as the X-Ray machine.
Apparatus: Grating
Spectrometer (Sargent-Welch #3693B)
High Voltage Induction Coil with Spectrum Tube Holder
Gas Spectrum Tubes (Neon, Hydrogen, and Mercury)
Figure 1
Date Modified 11/20/07 3
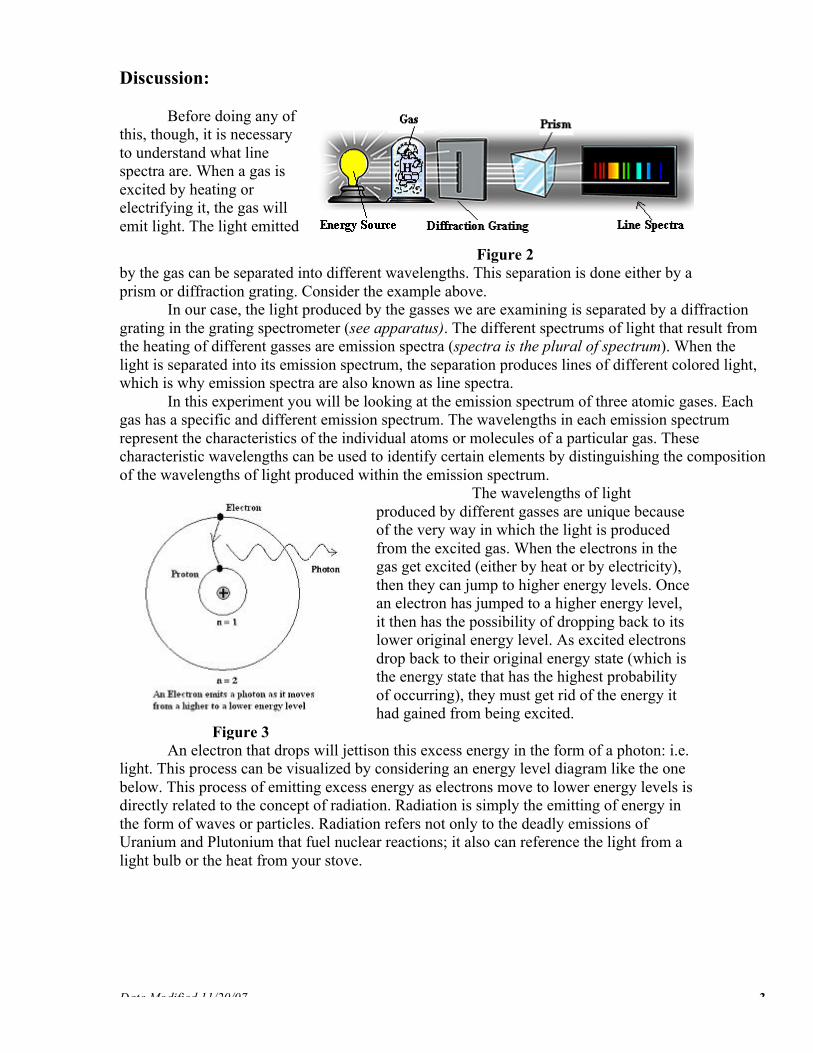
Discussion: Before doing any of this, though, it is necessary to understand what line spectra are. When a gas is excited by heating or electrifying it, the gas will emit light. The light emitted
Figure 2
by the gas can be separated into different wavelengths. This separation is done either by a prism or diffraction grating. Consider the example above.
In our case, the light produced by the gasses we are examining is separated by a diffraction grating in the grating spectrometer (see apparatus). The different spectrums of light that result from the heating of different gasses are emission spectra (spectra is the plural of spectrum). When the light is separated into its emission spectrum, the separation produces lines of different colored light, which is why emission spectra are also known as line spectra.
In this experiment you will be looking at the emission spectrum of three atomic gases. Each gas has a specific and different emission spectrum. The wavelengths in each emission spectrum represent the characteristics of the individual atoms or molecules of a particular gas. These characteristic wavelengths can be used to identify certain elements by distinguishing the composition of the wavelengths of light produced within the emission spectrum.
Figure 3
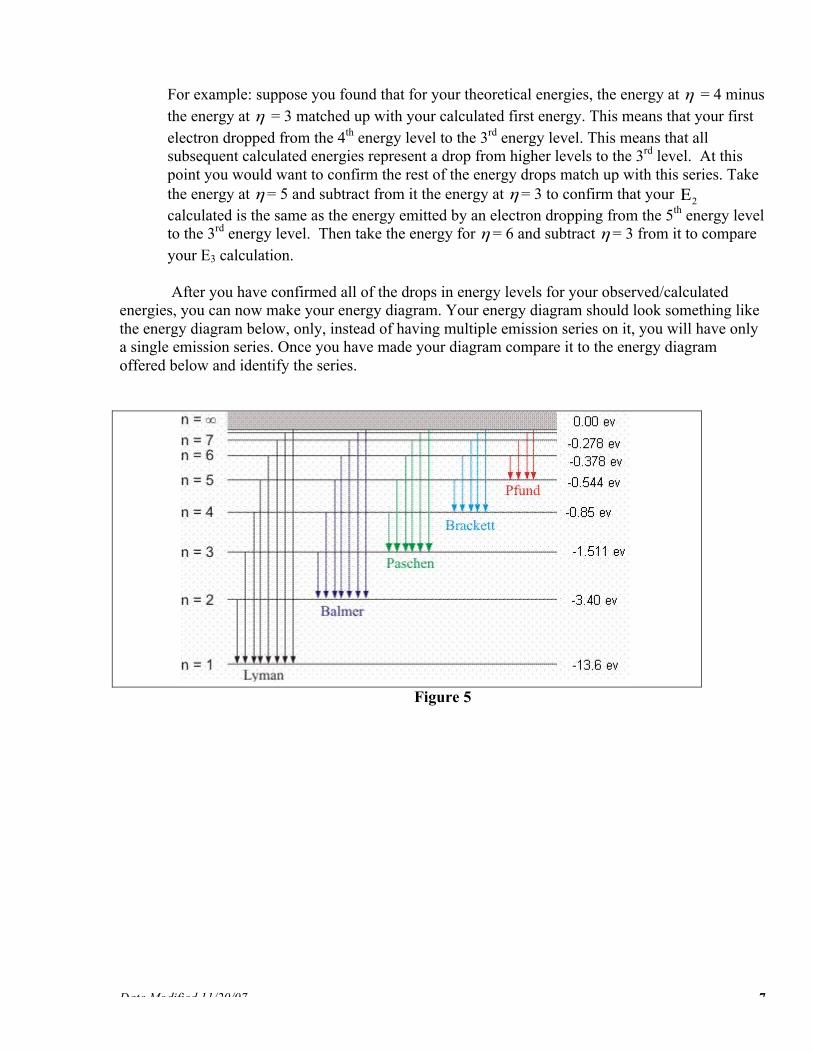
The wavelengths of light produced by different gasses are unique because of the very way in which the light is produced from the excited gas. When the electrons in the gas get excited (either by heat or by electricity), then they can jump to higher energy levels. Once an electron has jumped to a higher energy level, it then has the possibility of dropping back to its lower original energy level. As excited electrons drop back to their original energy state (which is the energy state that has the highest probability of occurring), they must get rid of the energy it had gained from being excited.
An electron that drops will jettison this excess energy in the form of a photon: i.e. light. This process can be visualized by considering an energy level diagram like the one below. This process of emitting excess energy as electrons move to lower energy levels is directly related to the concept of radiation. Radiation is simply the emitting of energy in the form of waves or particles. Radiation refers not only to the deadly emissions of Uranium and Plutonium that fuel nuclear reactions; it also can reference the light from a light bulb or the heat from your stove.

Date Modified 11/20/07 4
Figure 4
One type of radiation that is well known and also commonly used is X-ray radiation. X-rays, as we are all aware, have widespread use in medical diagnostics. An X-ray is created when a metal sheet is bombarded with electrons. If the electrons have enough energy to knock an electron from a one of the lower energy levels in the metal target, then a new electron from a higher orbit will fall into the vacant space. As it falls it emits radiant energy, radiation, in the form of an X-ray. X-rays are useful because due to their wavelength they can penetrate some solid objects, such as flesh, but are unable to penetrate others, such as bone, allowing the medical diagnosticians to take a “picture” of the skeletal system.
For more information on the concept of line spectra, radiation, and energy levels for electrons, it is strongly suggested that you read over reference material such as:
Chapter 27, section 4: “The Bohr Theory of the Hydrogen Atom”.
From Wilson and Buffa’s College Physics: pages 886-892.
Chapter 28, sections 2 and 3: “Atomic Spectra” and “The Bohr Theory of Hydrogen”. From
Serway and Faughn’s College Physics: pages 866-873. Chapter 24, sections: “Spectra: The Fingerprints of Atoms”, “Radiation and Solids”,
“Plank’s Models of Blackbodies”, “Another Puzzle: The Photoelectric Effect”, “Einstein Answers the Puzzle”, and “The Bohr Model of the Hydrogen Atom”.
From Boleman’s Physics: A Window On Our World: pages 357-364.
See your Lab Instructor for access to these textbooks.

Date Modified 11/20/07 5
Procedure: The spectrometer and gas emission tubes should already be assembled. Please see one of the lab instructors for guidance on proper use of the equipment and safety precautions. Please make sure all of three of the gas spectrum tubes are turned off when you finish the experimental portion of this lab.
1. Observe the line spectra produced by Neon gas. Make a diagram of this line spectrum including the reference wavelength scale and notations for the colors observed.
2. Observe the line spectra produced by Mercury gas. Make a diagram of this line spectrum including the reference wavelength scale and notations for the colors observed.
3. Observe the line spectra produced by Hydrogen gas. 4. Make a detailed diagram of the line spectrum. 5. Measure the wavelengths that are visible. 6. Using this measurement calculate the corresponding frequencies and energies. 7. Identify the series. 8. Draw an energy level diagram for this series including all the transitions. Indicate the
corresponding transitions you observed.

Date Modified 11/20/07 6
Analysis:
The following three equations are needed for the analyses of this experiment. They can be found with more details in the reference books listed at the end of the Introduction. Equation 1 c = λ·f Where : c = speed of light
c = 2.99792458 x 10⁸ m/s λ = wavelength f = frequency Equation 2 Ε = f·h Where : Ε= energy of the light f= frequency of the light h = Plank’s constant
h = 6.626 x 10⁻³⁴ Js 1 J = 6.242 x 10¹⁸ eV (electron volt)
Equation 3 ηΕ = 2
6.13η
− (eV) Where η can be from 1 to 7
***Also 1nm = 10-9m. First, solve Equation 1 for the frequency of each of the lines obtained from your plot of the spectra of the hydrogen gas. Then, using Equation 2, it becomes possible to calculate energy of each line spectrum of the hydrogen gas. Notice that it is also necessary to convert the energies from joules to electron volts. Fill this information in to the appropriate spots on the Data Table. In the last equation, Equation 3, you will use trial and error to find out which η s corresponds to the energies you have previously calculated. First, making use of the fact that η can go from 1 to 7, calculate the energies of each of the different orbits for a hydrogen atom. Fill these numbers into the Data Table. Next, you will need to look at the differences between one η and the next. Start by calculating the difference of the energy at η = 2 minus the energy of η = 1. Then calculate the energy at η = 3 minus the energy at η = 2. Continue with these calculations until you find a difference that corresponds to your calculated value for the first line spectrum of hydrogen. Once you have found which difference corresponds to your calculated energy, it is possible to decipher which emission series your emission spectrum corresponds with. Then calculate the subsequent differences between the energies at η for the rest of your series.
Date Modified 11/20/07 7
For example: suppose you found that for your theoretical energies, the energy at η = 4 minus the energy at η = 3 matched up with your calculated first energy. This means that your first electron dropped from the 4th energy level to the 3rd energy level. This means that all subsequent calculated energies represent a drop from higher levels to the 3rd level. At this point you would want to confirm the rest of the energy drops match up with this series. Take the energy at η = 5 and subtract from it the energy at η = 3 to confirm that your 2Ε calculated is the same as the energy emitted by an electron dropping from the 5th energy level to the 3rd energy level. Then take the energy for η = 6 and subtract η = 3 from it to compare your E3 calculation.
After you have confirmed all of the drops in energy levels for your observed/calculated energies, you can now make your energy diagram. Your energy diagram should look something like the energy diagram below, only, instead of having multiple emission series on it, you will have only a single emission series. Once you have made your diagram compare it to the energy diagram offered below and identify the series.
Figure 5
Date Modified 11/20/07 8
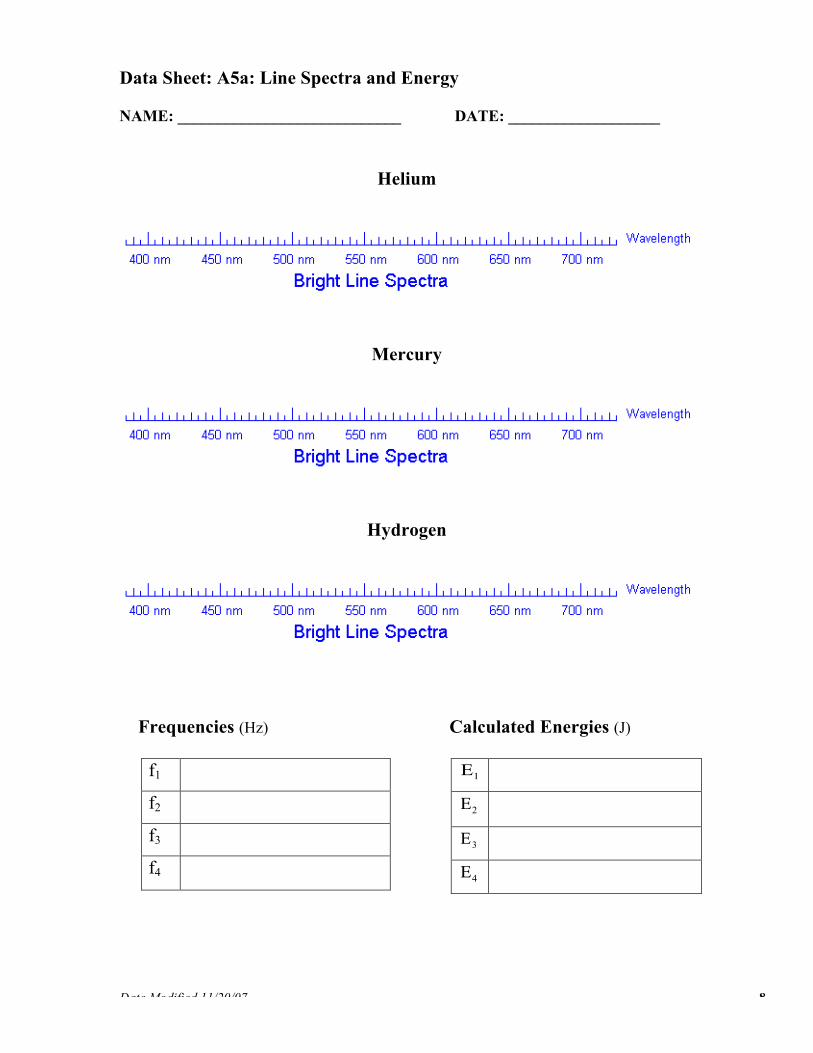
Data Sheet: A5a: Line Spectra and Energy NAME: ____________________________ DATE: ___________________
Helium
Mercury
Hydrogen
Frequencies (Hz)
f1
f2
f3
f4
Calculated Energies (J)
1Ε
2Ε
3Ε
4Ε
Date Modified 11/19/07
9
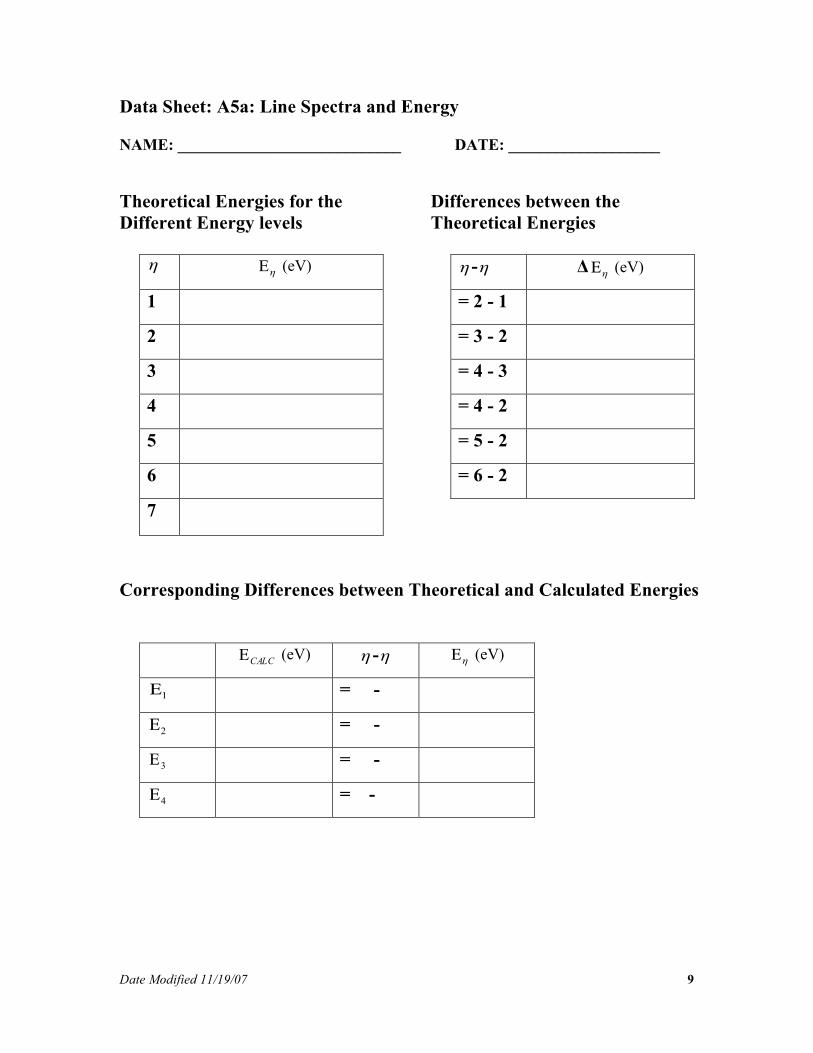
Data Sheet: A5a: Line Spectra and Energy NAME: ____________________________ DATE: ___________________ Theoretical Energies for the Different Energy levels
η ηΕ (eV)
1
2
3
4
5
6
7
Differences between the Theoretical Energies
η -η Δ ηΕ (eV)
= 2 - 1
= 3 - 2
= 4 - 3
= 4 - 2
= 5 - 2
= 6 - 2
Corresponding Differences between Theoretical and Calculated Energies
CALCΕ (eV) η -η ηΕ (eV)
1Ε = -
2Ε = -
3Ε = -
4Ε = -

10
Conclusion: 1. Based on your results, what emission series where you looking at? (Refer to fig. 5) 2. Would you be able to tell if emission lines due to something other than Hydrogen were also present? How? 3. Suppose the Hydrogen light source were moving away from you. At what wavelengths would you expect to find the emission lines? What if the source were moving towards you?