aberdeen proving ground, · pdf filea method of predicting permanent deformation of...
TRANSCRIPT
Ji l Or U hd ii.... 11
MEMORANDUM REPORT NO. 1461MARCH1963
c= THE RESPONSE OF CYLINDRICAL SHELLS TO
EXTERNAL BLAST LOADING
______William J. Schuman, Jr.
RDT & E Project No. 1M0I0501A006
BALLISTIC RESEARCH LABORATORIES
ABERDEEN PROVING GROUND, MARYLAND
ASTIA AVAILABILITY NOTICE
Qualified requestors may obtain copies of this report from ASTIA.
The findings in this report are not to be construedas an official Department of the Ar=y position.

BALLISTIC RESEARCH LABORATORIES
MEMORANDUM REPORT NO. 1461
MARCH 1963
THE RESPONSE OF CYLINDRICAL SHELLSTO EXTERNAL BLAST LOADING
William J. Schuman, Jr.
Terminal Ballistics Laboratory
Funded Under DASA NWER Sub-Task 02.053
RDT & E Project No. 1M5OlOO1A006
ABERDEEN PROVING GROUND, MARYLAND
BALLISTIC RESEARCH LABORATORIES
wimMN 4 REPORT NO. 1461
WJSchuman/cetAberdeen Proving Ground, Md.Nku ch 1963
THE RESPONSE OF CYLINDRICAL SHELLSTO EXTERNAL BLAST LOADING
ABSTACT
A method of predicting permanent deformation of thin-walled unstiffened
cylindrical shells to external blast loading from charges of high explosives
in presented. Empirical relations are derived from a series of firings con-
ducted at Aberdeen Proving Ground against scaled shells. The average deviation
between the predicted and the actual blast pressures required for permanent
deformation is 1i.
3 Ii
bTTABLE OF CONTNTS
SAB87RACT . . . . . . . . . . . . . . . . . . . . . . . . . . . . 3
INTR C•X•TION. . . . . . . . . . . . .. . . . . . . . . . . . 7
TEST A•RAENES AND PROCEDURES .... o. . .. .. 8
TE.ST RESULTS AND DISCUSSION ... . . . .. . . . . .. . . . o 1
PREDICTION OF DEFO•MATION ...
CONCLUSIONS .. . . .. ... .. ... .. ... ... . . . ... o 9
A C 1 XOWLEIDGEMNENNS . . . .. .. .. .. -o
AP PNIDICES ....... ....... . o 45
REFERENCES ............ . ..... . 169
DISTRIBUTION LIST ... ............. ...... . .. . 171
5
INTRODUCTION
The problem of missile vulnerability is quite complex, involving many
factors. A quick resume of these factors will establish the relationship ofthe present report to the overall problem.
Missile Condition - A missile may be in the storage, transport, launch,
in-flight, or re-entry condition. The missile was considered to be
in an unhardened, launch !ondition in this study.
Kill Mechanisms - A missile is vulnerable in varying degrees to fragments,
x-rays, thermal inputs and blast. Blast is the mechanism of concern
in this study and it may be further divided into: overturning of
the complete missile, excess acceleration loading of internal struc-
tural and electrical components, and crushing of the basic structure
and internal components. This report will be limited to considera-
tions of crushing damage to the basic structure.
Approach - The problem may be treated theoretically or experimentally.
A survey of previous work indicated that some analytical studies had
been made at Brooklyn Polytechnic InstituteI* and Columbia Univer-
sity 2 for various loading and boundary conditions. The Space Tech-nology Laboratories 3 have conducted tests on mylar cylinders with
uniform compressive loadings and rise times much slower than those
obtained from blast. Avco Corporation4 has used sheet explosive
applied to segments of the surface of a cylinder to obtain deforma-
tion. Southwest Research Institute5 is also studying this problem
and has conducted some experimental work with flexural type loadings.
Suffield Experimefital Station is investigating the details of blast
loading of various simple structures, including cylinders.
The lack of experimental data, the complexity of the required
theoretical analyses and the urgent need for design data were impor-
tant factors in deciding that both an experimental and theoretical
approach be taken, with the experimental phase receiving precedence.
Only the experimental phase of the study will be reported at this
time.
* Superscripts refer to references listed at end of report.
S~7
Targets - There are three types of targets that might be chosen: actual
hardware, scaled-models and simplified models. It was decided to
utilize simplified models to define the basic parameters and their
relatiorships before proceeding to the more sophisticated models and
actual hardware. The simplified model chosen was a right-circular,
thin-walled, unstiffened cylinder.
The primary goal of the first phase of this study was to develop an
empirical method of predicting the blast parameters necessary to cause perma-
nent deformation of a wide spectrum of cylinder geometries and materials. The
secondary goal was to obtain details of loading and response for correlation
and to aid in further studies.
TEST ARRANGEMENTS AND PROCEDURES
Preparation of Models
The cylindrical shells were fabricated from steel and aluminum foil, sheet
and tubing. The steel shells were formed from 1040 hot-rolled sheet and butt-
welded. The aluminum shells were either sections of 6061-T6 seamless tubing
or formed from ±100-0 or 5052-H3' foil and fastened by solder or by cloth-
backed adhesive tape. The shell diameters varied from 3 to 24 inches, the
lengths from 2 to 48 inches, and the thicknesses from 0.003 to 0.136 inches.
These dimensions provided shells that were geometrically scaled and have length-
to-diameter ratios of 0.7 to 10 and diameter-to-thickness ratios of 60 to 2000.
The dimensions of the shells used are presented in Table I.
A few representative shells were instrumented internally with Baldwin-
Lima-Hamilton FAB-25-35, 350-ohm foil strain gages for measuring details of
response. One gage pattern is shown in Fig. 1. A solid cylinder (non-
responsive) was instrumented with flush-mounted piezoelectric gages for measur-
ing details of loading. The gage pattern is shown in Fig. 2.
The shells were fastened to heavy end caps and this assembly then was
fastened over a rigid tube. This tube prevented rotation of the end caps
about an axis perpendicular to the longitudinal axis of the shell and there-
fore minimized bending in the shell. A schematic of the shell and support
tube assembly is shown in Fig. 3.
8
TABLE ICylindri•al •hell Diaensiano
* 1 Disimter Length ThLokaess L/D D/t MiterialD L t(in.) -. a
1 ,. 2 3.0 6.0 0.019 2.0 158 Steel Sheet -1003 - 6 3.o 8.62 0.019 2.87 158
7 3.0 9.0 0.019 3.0 158 H
8,9 3.0 11.62 0.019 3.87 158 H
op, 11 3.0 1A4.62 0.019 4.87 158Its, 13 3.0 18.0 0.019 6.0 158 "24, 15 3.0 24.0 0.019 8.o 15816, 17 3.0 8.6a 0.035 2.87 86
18 3.0 9.0 0.035 3.0 8619 3.0 18.0 0.035 6.0 86
2D, 21 6.0 18.0 0.019 3.0 31622, 23 6.0 17.5 0.035 2.91 172
A 6.o 18.0 0.035 3.0 17225, 26 6.o 17.5 0.076 2.91 79 "
27 6.o 18.o 0.076 3.0 79 "26, 29 12.0 35.38 0.076 2.94 158
30 12.0 35.38 o.136 2.94 8831, 32 214.0 147.25 o.136 1.98 176
33 3.0 6.0 0.003 2.0 100 Alum.Foll 5052 - E383- 3.0 9.0 0.003 3.0 Woo
37 3.0 15.0 0.003 5.0 1000 "3 -ho 3.0 9.0 o.006 3.0 5oo "
4i 3.0 15.0 o.oo6 5.0 500 "23.0 23.0 0.006 7.67 5o034, 3.0 30.Q o.oo6 10.0 500 "3- 46 3.0 9.0 0.012 3.0 250 H47 - 49 3.0 9.0 o.o214 3.0 125 "
50 - 53 6.0 18.0 0.003 3.0 2000S- 5 6.0 18.0o o.o6 3,0 1000 .57, 58 3.0 9.0 o.o22 3.0 136 Alum.Tubing - 6061 - T6
(O, 6D 3.0 9.0 0.0o2 3.0 716, 6.o 18.o o.042 3.0 114363 3.0 2.0 0.006 0.67 500 Alum.Fotl - 1300 - 0S3.0 2.0 0.006 1.0 50 "
53.0 5.0 o.oo6 1.67 500663.0 6.0 o.oo6 2.0 50o 0
67'-7 3.0 9.0 o.oo6 3.0 5o076 3.0 12.0 0.006 4.0 500
77, 78 3.0 15.0 o.6 5.0 5o79 3.0 23.0 o.=o6 7.67 500
s -82 3.0 9.0 0.010 3.0 30083, 8' 3.0 2.0 0.012 0.67 250 "85- a7 3-. 3.0 0.012 1.0 250 "
8691 3.0 9.0 0.012 3.0 250S6.0 9.0 0.006 1.5 iooo m93 6.0 11.0 o.006 1.83 100094 6.0 4.0 0.012 0.67 500 "95 6.0 6.o 0.012 1.0 50096 6.o 9.0 0.012 3.0 500
97, 96 6.o 11.0 o.012 1.83 500 H99 7.5 7.5 o.o63 1.0 119 Alm. (Poastinn Arsa)* 7.5 7.5 0.125 1.0 60 Alum. (Piostimy Arseasl)
9i
4L AR2
C14
IL _ /IC 4~3C
I CHARGE
NOTE:
L - LONGITUDINAL STRAINC - CIRCUMFERENTIAL STRAIN
IL _ _ 3L3C _
IC& 44C CHARGE
21LI 2C
FIG. t. STRAIN GAGE PATTERN
10
L .- 4 ..
"cI.__ __ ____________L90 90
4 + 00100 + 0 + 0
SEC A-A SEC B-B SEC C-C
FIG. 2. PRESSURE GAGE PATTERN
11
FTHICKNESS If IT D IAMETER (0)
END CAPSHELL
SUPPORT TUBE
LENGT (
FIG. 3 - TYPICAL SHELL SPECIMEN
1
12
Test Arrangements
The blast loading was provided by detonating charges of high explosive
(HE) ranging in weight from one pound to 216 pounds. The smaller charges of
bare spherical Pentolite was suspended as shown in Fig. 4. The larger charges
were placed on the ground. The free air blast parameters; overpressure,
impulse, and duration are determined by use of tabulated data7' 8 . (References 9
and 10 define and discuss the various blast parameters.)
The shell and support tube assemblies were mounted on portable stands at
a height of 6 feet to minimize ground effects as shown in Figs. 4 and 5. They
were oriented with respect to the charge so that the blast impinges on the
shells either along a line perpendicular to the longitudinal axis (lateral
loading) or along an extension of the longitudinal axis (longitudinal loading).
A nose cone was added to the shell for the longitudinal loading orientation to
minimize the disturbance of the flow.
Test Procedure
A group of uninstrumented shells were positioned about an explosive charge
at various distances such that the pressure levels would be below that required
to cause permanent deformation. The shells were then repositioned in incre-
ments until optimum deformation - defined in this study as approximately 5% to
10% of the original diameter - was obtained.
The instrumented cylinders were fired on individually because of instru-
mentation requirements. The signals from the strain gages were recorded by a
16 channel CEC Miller Recording Oscillograph that has a maximum writing speed
of 400 in/sec and a frequency response of DC to 200 KC. The signals from the
pressure gages were amplified, presented on cathode ray tubes and recorded by
General Radio streak cameras. This system has a maximum writing speed of 2500
in/sec and a frequency response of DC to 100 KC.
TEST RESTTLTS AND DISCUSSION
Uninstrumented Shells
Values of overpressure and impulse for the shells fired on are listed in
* Tables II and III for the lateral and longitudinal loading orientations.
13
LATERAL LOADING
CHARGE STAN
FIG. 4 -TYPICAL FIELD ARRANGEMENT
14I
15
U, CI W,
M~U~t-. - - -
0 0 UOsrOD 0a "*0 104 0
000 0'. OD O ., C CO00 OD OD O oSO
AIR~~~~~~~~~0~ r0C 16%Dt-D'N91%QArqA:c0,4RgF
416
4-)
ax aa.0 Lr, 0- -0 a
L(%ju~ UNU ^U %c-2% ý S~ P zPaZ
.. 4t- CD.-~t- ' Ž
0; uý W%,g ý ý,CM c r-lLf% cu0Lý ~ -A - m . , - wcu
'44tp' C lJ 04 U C.-.4
r- C4 C 4 6 .1 4 -L%
t Cý 4 H W Ltzktz 0 ON ooo _;r1
.43
17
41
2 aj* I In Il ia i IIto*.* F~"~
~F
v4 RVVuI jr^*,Co 0W,71.78N 4 coDt-co
~~Aq 4 0 cJO O ..4. e-C4 NN * J !**-
'R ~ 4.f R 8 U%'- it U
Uýe-O . .. ... l 199. . . .l -- UUg A E-:~ t.:.: ~ t-Ao * u C4 Uý ý44
18
L ii
1 4 )
to~ 0,
k m
t. 41
*ý 9 0l 9q NC\U
I.I CID
-4A -r
419
Plots of incident impulse (Ii) vs. incident pressure (pi) for the shells
listed in Table II as having approximately the optimum deformation are pre-
sented in Fig. 6. Iso-damage curves are drawn through these points that
represent the various combinations of pressure and impulse for equivalent
deformation of a given shell material and configuration (see points 4-5-6-7,54-55-56, etc., Fig. 6). These curves form the boundaries between regimes of
deformation and non-deformation.
The effect of variations of explosive weight on the blast parameters can
easily be determined from these curves. As the explosive weight increases,
moving from right to left along one of these curves, the impulse increases
but the pressure decreases. For very large explosive weights the pressure-
time histories will approach a step function (long durations, high impulse
values) and the iso-damage curves should approach asymptotically some minimum
value of pressure that will cause deformation.
If curves are drawn through different sets of points (i.e., 4-8-10, etc.)
the effects of changes in length of the shells can be determined. In this
case, the curve appears as a straight line. As length is increased, moving
from right to left (all other parameters constant) the required values of
pressure and impulse decrease. It is expected that an increase in length
beyond a certain minimum value will not produce a further reduction in pres-
sure and impulse values. At this point, the shell can be considered infinite
and end conditions will not influence the deformation at the center. This
minimum length has not been determined at this time.
In like manner, the variation of pressure and impulse values for changes
only in diameter, thickness or type of material can be determined. As expected,
an increase in pressure and impulse values is required if either the thickness
is increased oz the diameter decreased.
Having a family of iso-damage curves and the variation of the significant
parameters, it is possible to generate a method of predicting deformation of
cylindrical shells. The details of the method will be presented in the next
section, "Prediction of Deformation."
2
20
II
21
The nearly vertical, dotted lines on Fig. 6 show that shells of differentconfigurations will be deformed at the same pressure level by unlike explosive
weights. A close examination of the connected points indicates that "geomet-
rical" modeling laws apply for these large deformations. For example, refer
to Fig. 6 and Fig. 7 - Scaling Parameters, and Table II: Point 5 on Fig. 6represents a cylinder of given geometry (3 in. diameter, 8.62 in. length,
0.019 in. thickness) laterally loaded by an explosive weight of 8.4 lbs.
positioned at a distance of seven feet. The equivalent deformation of a shell
whose geometry has been scaled by the factor K = 2 (Point 23 - 6 in. diameter,
17.50 in. length, 0.035 in. thickness) exposed to an explosive weight of
64 lbs. (i.e., W oc or Doc v¶ or Dwo 0 oc 2 and, therefore,
W2oc K 3 Dw3 c (2)3 . (2)3 oc 64) located at a distance of 2d = 2 x 7 = 14 ft.
validates this conclusion as do the other sets of points.
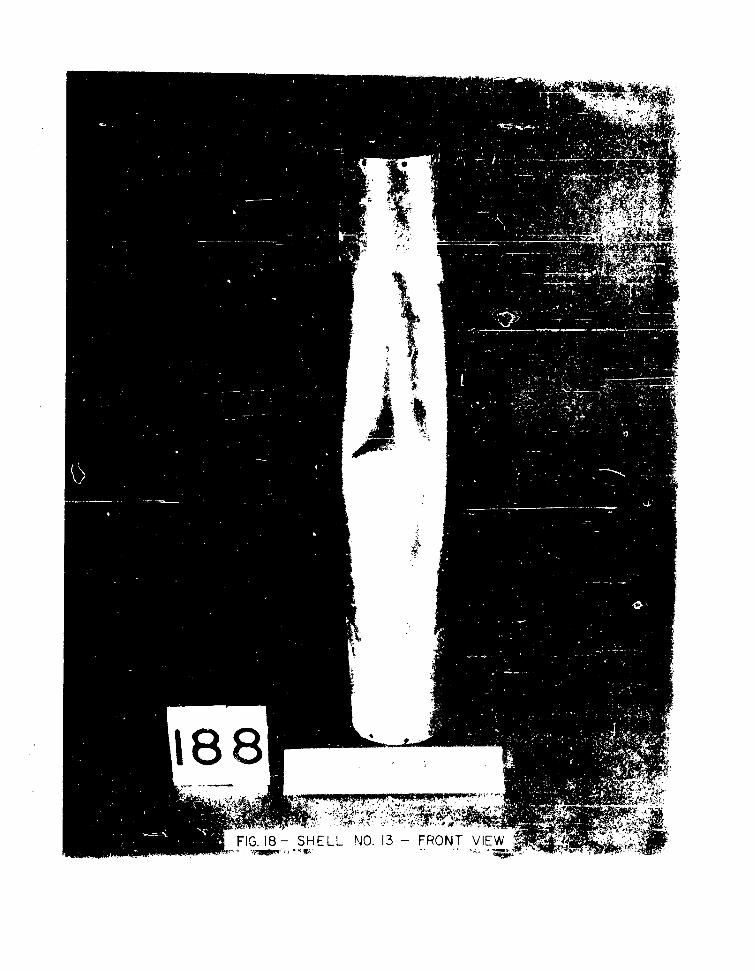
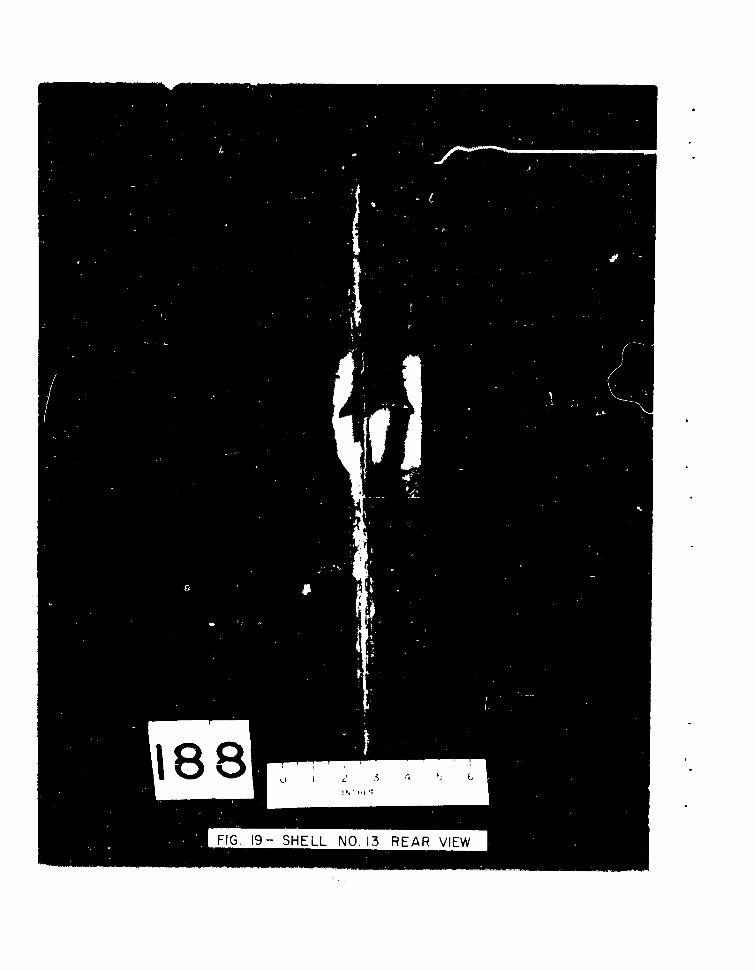
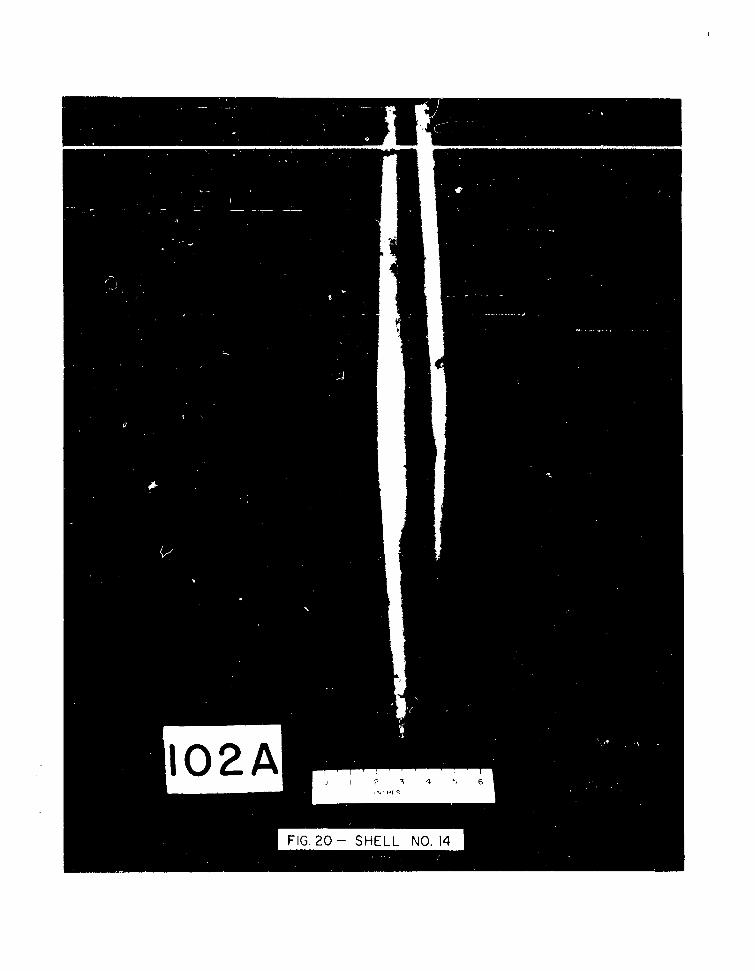
There are two general deformation patterns arising from lateral loadings:
a single transverse crease or multiple longitudinal lobes. Typical transverse
and longitudinal patterns are shown in Figs. 8 - 10 and i. and 12. A typical
deformation pattern resulting from longitudinal loading is shown in Fig. 13.
Photographs of all shells are presented in Appendices A and B for the lateral
and longitudinal loadings respectively.
The two lateral loading patterns seem to be primarily a function of the
shell geometry. The thicker shells deform with a transverse crease while the
thinner form a lobe pattern. However, one of the shell. deformed in a com-
pound pattern when the explosive weight was increased. (See Fig. 14.) Further
investigation is required to define the applicable parameters and their vari-
ation.
One shell was tested statically to compare its pattern with those shown
in Figs. 8 - 10. The shell and support tube assembly was mounted on v-blocks
in a testing machine. The line load was applied perpendicular to the center-
line of the shell at the center with a 1/4 x 4 inch striker plate. The
deformation pattern Is similar to that of the transverse crease (see Figs. 15
and 16). The shell cmmenced to deform at 3 lb. load and the load increased
22
t9
t d
CHARGE OF HIGH EXPLOSIVE
WD3D
kLW cDw N TE
W-WEIGHT OF EXPLOSIVECHARGE
k- SCALE FACTOR
SCALED CHARGEkDw OF HIGH EXPLOSIVE
kD
WaCkDw )3
We k 3 Dw3
FIG. 7- SCALING PARAMETERS
23
. .0 2 3 4 5 6 7 8 9 to 12
FIG. 8 -DEFORMATION PATTERN -SHELL NO. 9
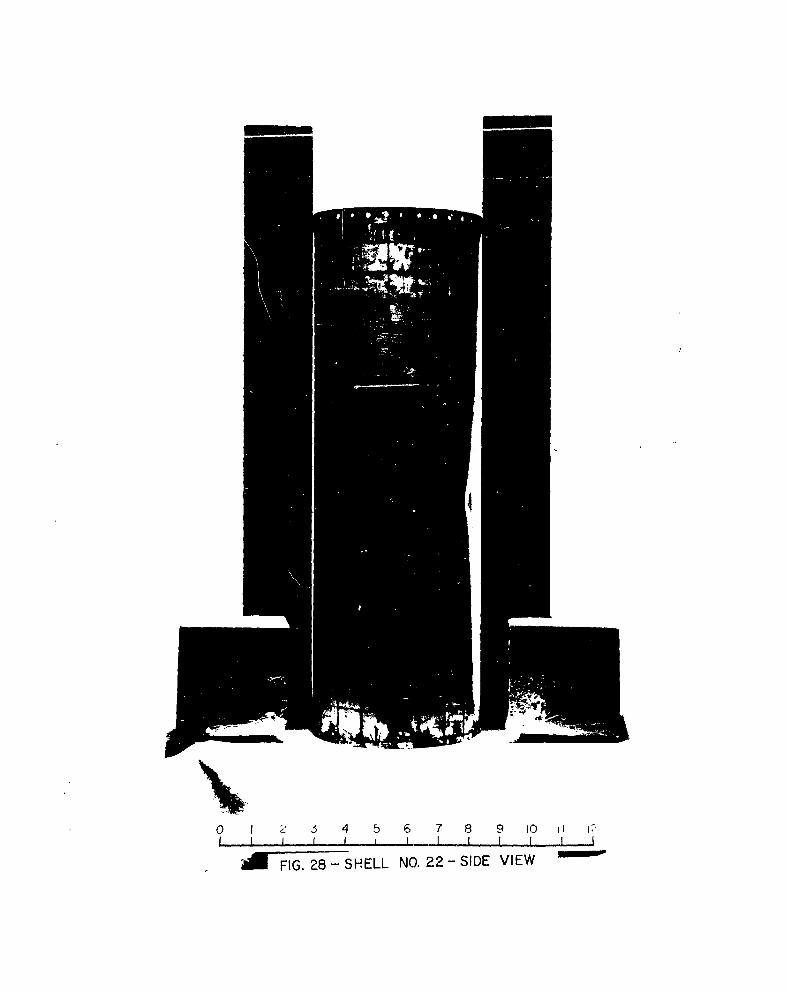
FIG. 9 - DEFORMATION PATTERN - SHELL NO. 22
25
, kk
0 6 12,
A*SCALE I N INCHESFIG. I10- DEFORMATION PATTERN - SHELL NO. 28
0 I 2 3 4 5 6
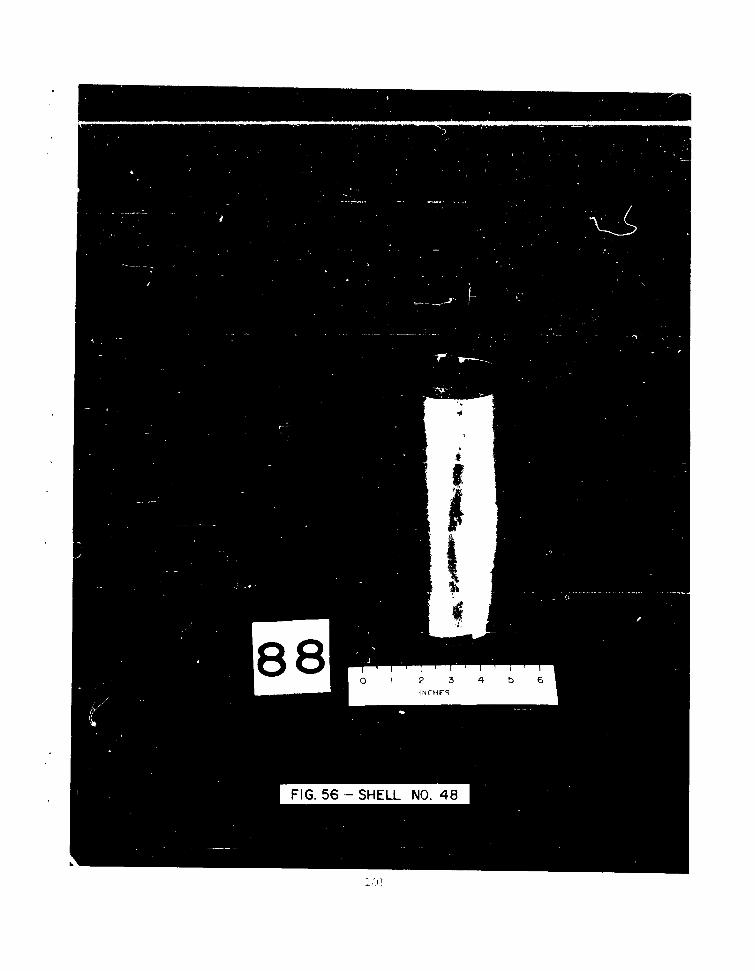
FIG, 11 DEFORMATION PATTERN -SHELL NO. 88
4" JI 0 i 2 3 4 5 6
INCHES
FIG. 12 - DEFORMATION PATTERN - SHELL NO. 66

CjLO
dz
LLJm
zcrLLJ
z0
cr0LLL.LiaILo
0LL
CDC*j
"t
Ld
Q)0 -
,FIG. 15- DEFORMATION PATTERN - SHELL NO. 75
FIG. 16- DEFORMATION pATTERN -SHELL No. 75
continuously as the deformation increased. The load was increased to a maxi-
mum value of 10 lb. and then removed. This requirement that the load must be
increased in order to increase the deformation also agrees with the blast
loading results.
Instrumented Shells
The results of exploratory firings for checking out the strain gage
recording system are presented in Table IV. Only peak strains were read.
Additional firings will be conducted and the results coordinated with similar
investigations being carried out at the Suffield Experimental Station.
A number of firings have been made against the solid loading cylinder,
but calibration difficulties preclude presenting the data at this time.
PREDICTION OF DEFORMATION
A semi-graphical method for predicting the critical incident pressure
required to cause permanent deformation for a cylindrical shell in the lateral
loading orientation has been generated. The necessary curves are shown in
Figs. 17 - 20.
The four curves of Fig. 17 are plots of the length-to-diameter ratio -
L/D - vs. critical incident pressure pcr for the four materials tested: steel
and the three types of aluminum alloy. Each of these curves is based on a
change of L/D for a constant explosive weight of one pound, a diameter of three
inches and a thickness of 0.019 in. for steel and 0.006 in. for aluminum.
If the explosive weight, diameter, or thickness are different from the
above standard values, the value of critical incident pressure pcr must be
adjusted. The necessary correction factors have been determined from the inde-
pendent effect of each of these factors on the critical pressure and are given
in Figs. 18 - 20. The required pressure is then:
Pcr = Pcr KD Kt K
where P = Critical Incident Pressure for lateral loadingcr
Pcr = Critical Incident Pressure (for standard conditions) (Fig. 17)
Kw = Correction factor for explosive weight 'Fig. 18)
33
TABLE IV
Strain Data for Lateral Loading of Shell*
Round No. 106 107 109 110 111
Explosive Wt. (lb) 1.06 1.O6 1.07 8.19 8.19
Explosive Dist. (ft) 3.75 3.75 3.5 8.0 8.0
Press. pi (psi) 69.2 69.2 82.4 58.8 58.8
Gage Position Maximum Strain (it in/in)
1U 603 551 61u --
lC 1635 1281 1749 1923 --
2L 559 536 752 581 633
2C 790 752 1112 656 894
3L 909 668 1308 726 983
3C 1065 663 646 1749 151 3
4L 577 57 4 74 5 612 656
4C 641 514" 790 734 1013
*Shell Dimensions - Diameter - 3", Length - 9", Thickness - .019", Material -
.teel
34
loo?
5004-
3-
200
I00_9-S7-
50\N
z 2_1040 STEELo 20
lot9
7 6061- T66- ALUMINUM
54 STANDARD CONDITIONS ALUMINUMH 38
3-EXPLOSIVE WEIGHT- I LB.
2 WALL THICKNESS - 10.019 #STEEL ____
2 0.O06#ALUM
1100-0ALUMINUMI
0.1 0.2 3 4 0.56 71691.0 2.0 3 4 5,06 79910 20 3 4 506 7 19100
L/D
FIG. 17 LENGTH -TO-DIAMETER RATIOVS
CRITICAL INCIDENT PRESSURE FOR STANDARD CONDITIONS
35
K
I U U
I0
-W.
10J
C-
N w K
-- 2
* .
-V€)
Y.- z
0
U, 00.
w
0
w
/0
(I,
0 0
•36
_ _ _ __ Xu
108 -
76
54
3-
2
9-
* 0.5
"4-3
'0.2
0.1
7-6-
0.05
4-
3-
0.02
0.1 0.2 3 40.5 1.0 2.0 5.0 71890 20 450 7 8ý100D/3
FIG. 19. CORRECTION FACTOR FOR VARIATIONS OF DIAMETER
37
1009-
a--
76
50 -0____ ____ ___ __
4-
Kt3-
20
10 /9- /
7-6-
4-
3-
Kt
.7-
.4-
.3-
0.2
0 .1 1 1 It l lI l I i I
0.1 0.2 3 40.567631.0 2 3 4 5 6 To910 20 3 4 506769100
t /0.019-STEEL ; t/0.0O6-ALUMINUM
FIG. 20. CORRECTION FACTOR FOR VARIATIONS OF WALL THICKNESS
38
KD = Correction Factor for Diameter (Fig. 19)
Kt = Correction Factor for Thickness (Fig. 20)
As an example, consider Shell No. 30. It is steel and L/D 2.94 (Table I).
Therefore pcr = 150 psi
also D = 12.0 in.,-2 = 4 and KD = 0.27
t 0.136 in., 0 = 7.17 and Kt = 24.2
W = 389 lb., K = 0.265
Therefore Pcr = Pcr KD Kt Kw
= (150) (0.27) (24.2) (0.265)
P = 26 0 psicr
The actual pressure was pi = 257 psi. Therefore, the deviation of the
predicted value from the actual value is + 1.2%.
The average deviation between predicted and actual pressures for the
laterally-loaded cylinders listed in Table V is 12% with a spread of -40%
to + 40%.
If the shell is exposed to longitudinal loading, the pressure required
for deformation is higher. The data presently available seem to follow the
general trend of the other set of iso-damage curves. Therefore, the critical
pressure for the lateral loading should be determined and multiplied by a
factor of X where X : 6.0 for steel, and X *2.0 for aluminum.
CONCLUSIONS
The primary goal of the first phase of an investigation of the response
of thin walled cylinders exposed to external blast loading has been achieved.
An empirical method of predicting the critical incident blast pressure required
to cause permanent deformation has been presented. The correlation of pre-
dicted and actual pressure values is satisfactory (average deviation of 12%).
However, there are several areas requiring further investigation. It is
planned to conduct a series of firings in the 1000 lb. to 30,000 lb. explosive
weight range at the Yuma Test Station the early part of 1963. This will help
define the iso-damage curves at much higher impulse levels.
39
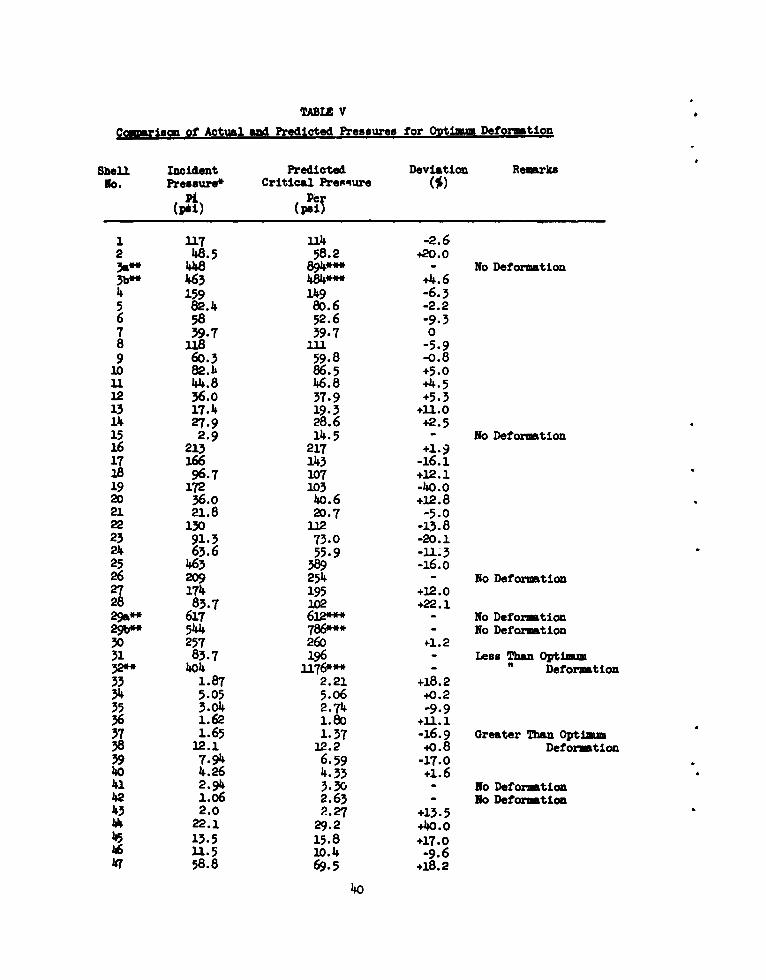
TAB3I V
Cciw•rison of Actual and Predicted Pressures for Optima Deformt ion
Shell Incident Predicted Deviation RemarksNo. Pressure* Critical Pressure (M)
Ag Peý(pal) 51
1 117 .114 -2.62 48.5 58.2 +20.0
14148 894*** - No Deformation3b** 1463 144*** .4.64 159 149 -6.35 82.4 80.6 -2.26 58 52.6 -9.37 39.7 39.7 08 118 111 -5.99 6o.3 59.8 -0.8
10 82.h 86.5 +5.011 44.8 46.8 +4.512 36.0 37.9 +5.313 17.14 19.3 +11.014 27.9 28.6 +2.515 2.9 14.5 - No Deformation16 213 217 +1.917 166 1143 -16.118 96.7 107 +12.119 172 103 -o.0020 36.o 40.6 +12.821 21.8 20.7 -5.022 130 112 -13.823 91.3 73.0 -20.124 63.6 55.9 -1-325 463 389 -16.o26 209 2514 - No Deformation27 171. 195 +12.028 83.7 102 +22.129a** 617 612*** - No Deformation29b** 544 786*** - No Deformation30 257 260 4-1.231 83.7 196 - Less Than Optimu32** 404 1176*** - " Deformation33 1.87 2.21 +18.234 5.05 5.06 +0.235 3.04 2.74 -9.936 1.62 1.8o +11.137 1.65 1.37 -16.9 Greater Than Optima38 12.1 12.2 +0.8 Deformation39 7.94 6.59 -17.040 4.26 4.33 +1.641 2.94. 3.30 - No Deformation12 1.06 2.63 - No Deformation
.43 2.0 P.27 +13.5S22.1 29.2 ,Am0.
45 13.5 15.8 +17.016 11.5 lo. 4 -9.647 58.8 69.5 +18.2
40o
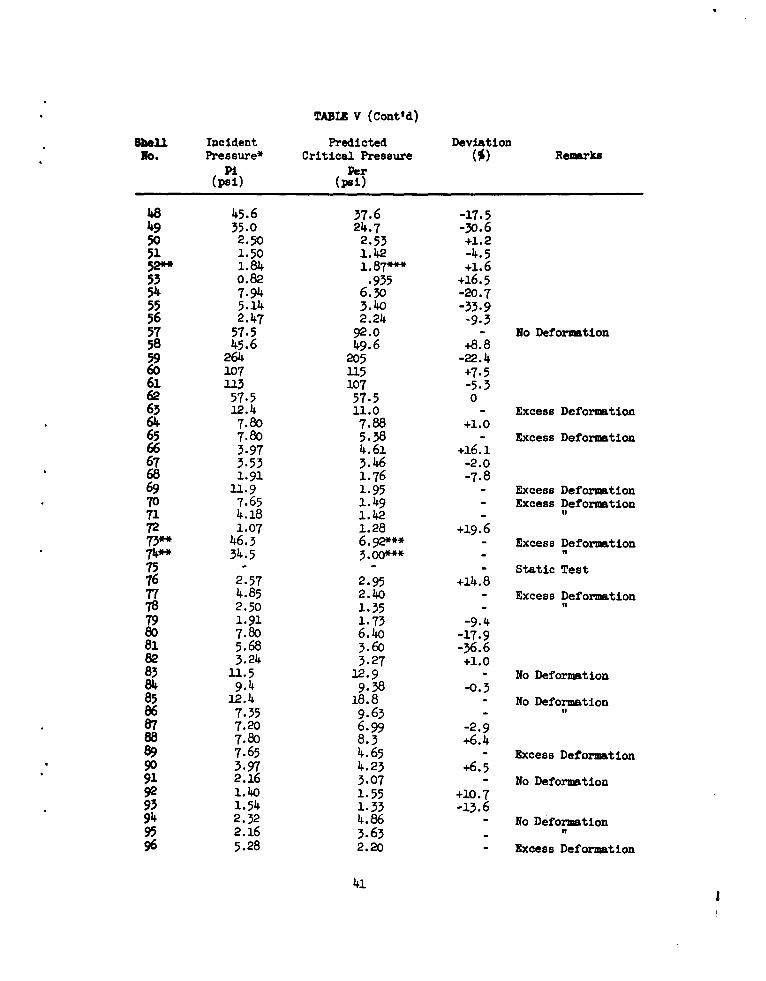
TABLE V (Cont'd)
shell Incident Predicted DeviationNo. Pressure* Critical Pressure () Re-ks
P1 Per(psi) (psi)
48 45.6 37.6 -17.549 35.0 24.7 -30.650 2.50 2.53 +1.251 1.50 1.42 -4.552*'* 1.84 i.87*•* +1.653 0.82 .935 +16.554 7.94 6.30 -20.755 5.14 3.40 -33.956 2.47 2.24 -9.357 57.5 92.0 - No Deformation58 45.6 49.6 +8.859 264 205 -22.460 107 115 +7.561 113 107 -5.362 57.5 57.5 063 12.4 11.0 - Excess Deformation64 7.80 7.88 +1.065 7.80 5.38 - Excess Deformation66 3.97 4.61 +16.167 3.53 3.46 -2.068 1.91 1.76 -7.869 12.9 1.95 - Excess Deformation70 7.65 1.49 - Excess Deformation71 4.18 1.42 - "72 1.07 1.28 +19.673"* 46.3 6.92*** - Excess Deformation74** 34.5 3.00*** - "75 - " - Static Test76 2.57 2.95 +14.877 4.85 2.40 - Excess Deformation78 2.50 1.35 - "79 1.91 1.73 -9.80 7.80 6.4o -17.981 5.68 3.60 -36.682 3.24 3.27 +1.083 11.5 12.9 No Deformation84 9.4 9.38 -0.385 12.4 18.8 - No Deformation86 7.35 9.63 -87 7.20 6.99 -2.988 7.80 8.3 +6.489 7.65 4.65 - Excess Deformation90 3.97 4.23 +6.591 2.16 3.07 - No Deformation92 1.40 1.55 +10.793 1.54 1.33 -13.694 2.32 4.86 - No Deformation95 2.16 3.63 "96 5.28 2.20 - Excess Deformation
411
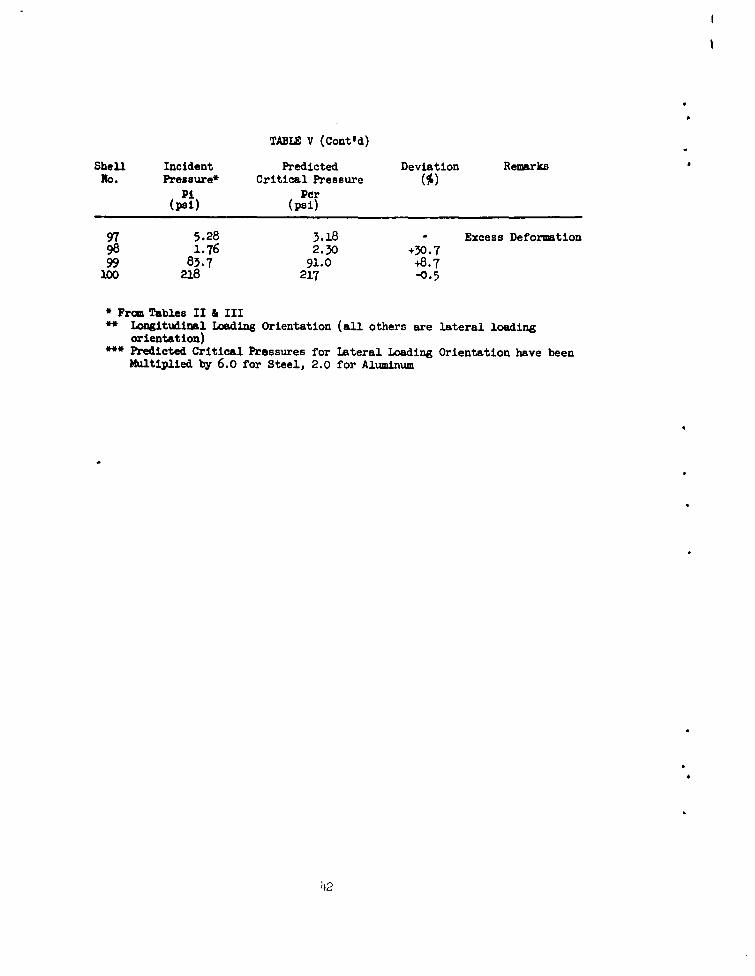
TABLE V (Cont'd)
Shell Incident Predicted Deviation Remarks5O. Pressure* Critical Pressure (%)
Pi Per(psi) (psi)
97 5.28 3.18 - Excess Deformation98 1.76 2.30 +30.799 83.7 91.0 +8.7
100 218 217 -0.5
* From Tables II & III** Longitudinal Loading Orientation (all others are lateral loading
orientation)*** Predicted Critical Pressures for Lateral Loading Orientation have been
Multiplied by 6.0 for Steel, 2.0 for Aluminum
42
Shells are being fabricated with greater lengths to determine at what
point end conditions may be neglected. The variation in deformation patterns
will be studied further. The iso-damage curves for the longitudinal loading
orientation will be defined more accurately. The effects of free-body motion
of the shell are now being studied.
Continuation of study of the instrumented shells will provide valuable
data for analytical correlation of the loading and response.
Future work with actual hardware will determine the degree of applicabil-
ity of these simplified models.
This is an interim report released at this time so that Government and
private agencies may integrate these results into overall vulnerability
analyses.
ACKNOWLEDGMENTS
The assistance afforded the author by Professor Norman Davids, Department
of Mechanics, the Pennsylvania State University in the planning of these tests
and in the preparation of this report is gratefully acknowledged.
Acknowledgment is also made of the assistance of Miles Lampson, Harry
Goldstein and the many members of the BRL field crew in conducting experiments
at BRL ranges.
WILLIAM JAC JR.
4~3
APPENDIX A
DEFORMATION OF LATERALLY LOADED SHELLS
45
100 Y" 4 5 6
FIG. I. -SHELL NO. I

2INCHES
FIG. 2. - SHELL NO. 2
............
SCALE IN INCHES .i
FIG. 3 - SHELL NO. 4 -- SIDE VIEW
48
I
o I 2 3 4 5 6*I I a a I I I
SCALE IN INCHES .
FIG. 4 - SHELL NO. 4 - FRONT VIEW
"49
-o-j
0 1 2 4 5 6 7 8 9 1 0 II 12
FIG. 5 -SHELL NO. 5 -SIDE VIEW
50
0 I 2 4 5 ~' 7 8 9 10 I 2
F{G6 -SHELL NO. 5 -FRONT VIEW
51
FIG,? -SHELL NO. 6 SIDE VIEW
52
tO I A
HCEL NO. 6 -. ,"
FIG. 8- SHELL NO. 6- FRONT VIEW
53
z
-J
Ia)
FIG. 10-SHELL NO. 8- SIDE VIEW
FIG. 11 SHELL NO. 8 -FRONT VIEW
56

FIG. 12- SHELL NO. 9 - SIDE VIEW
I t -
FIG. 13- SHELL NO.9- FRONT VIEW
58
(2i
FIG. 14- SHELL NO.1IO- SIDE VIEW
I 5
FI
• .If
FIG. 15- SHELL NO. I0 - FRONT VIEW
0 1 2 3 4 5 6~
SCALE IN INCHES
FIG. 16- SHELL NO. If
m
FoG. 0 I S 3 4 5 6
FIG. 17- SHELL NO. 12
m0
Tr7'
47-t, -1-7
R-7
101
188 1 3
FIG. 19- SHELL NO. 13 REAR VIEW
102A
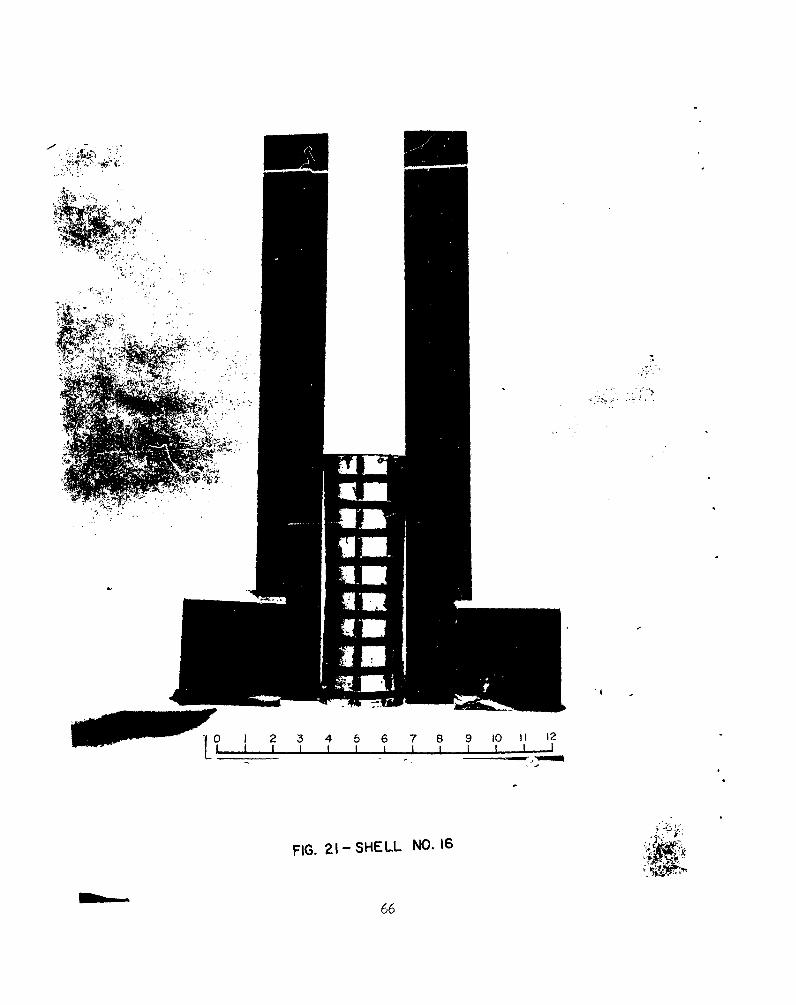
FIG. 21 -SHELL NO. 16
66
FIG. 22 -SHELL NO. 18
1030 2 3 4 5 6
IN H- F
FI.23 - SHELL NO. 19
VI
104B30 1 2 3 4. 5 6
INCHFS
/FIG. 24- SHELL NO. 20
184 1 2 3 4 5 6INCHES
FIG. 25-SHELL NO.21-FRONT VIEW
70
184 0 1 2 3 4 5 6IN rHFq
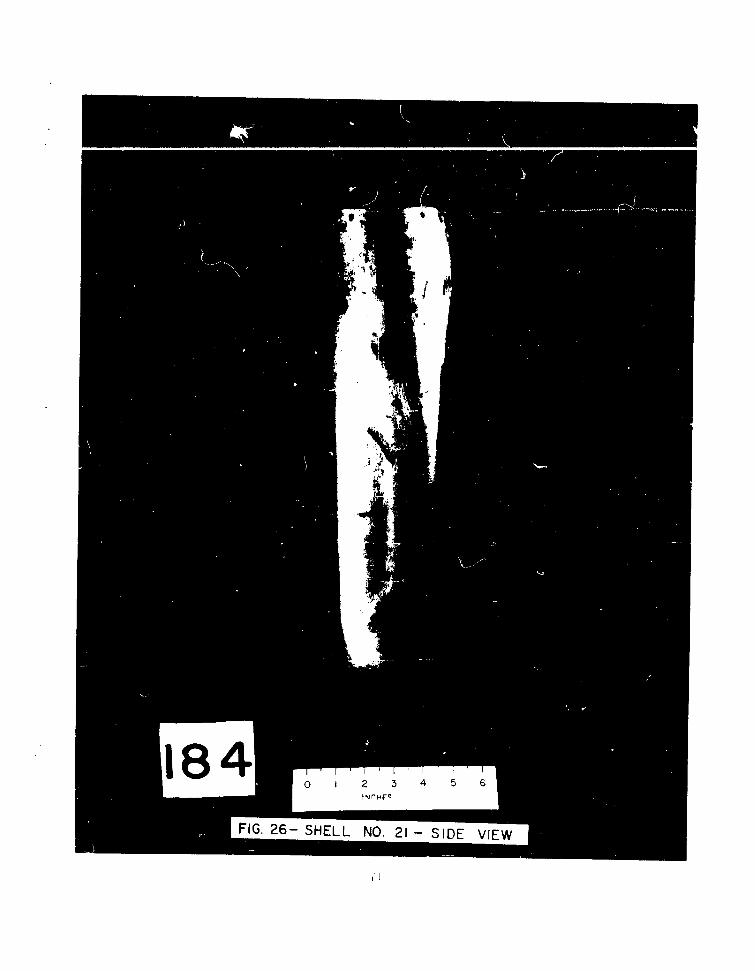
IG. 26- SHELL NO. 21 SIDE VI
1840 1 2 3 5 6
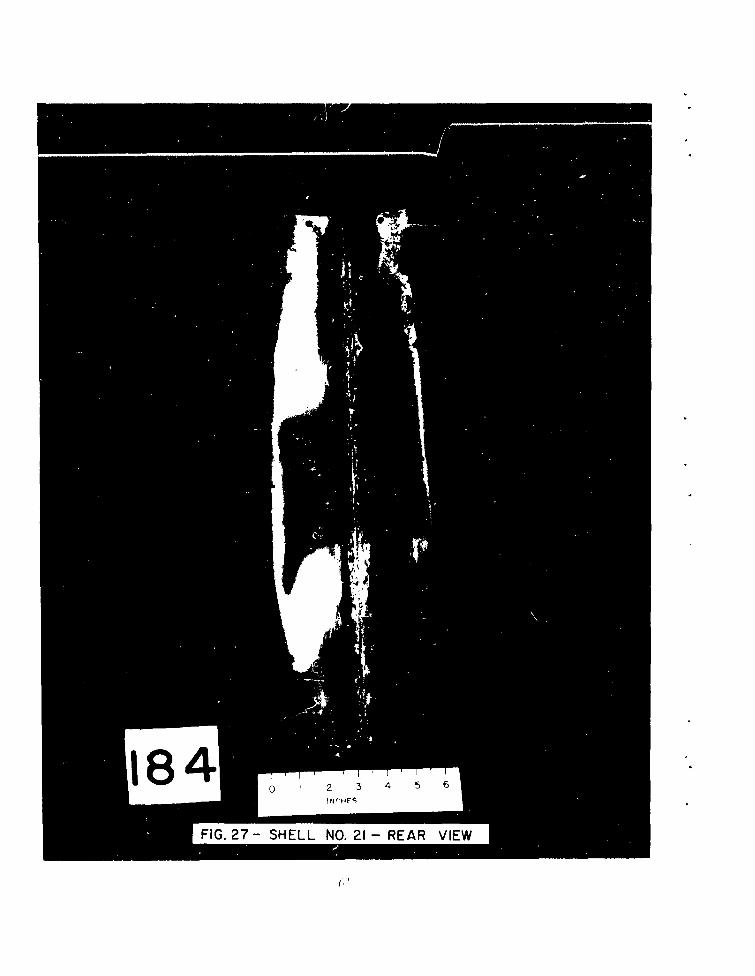
FIG. 27- -SHELL NO. 21 -REAR VIEW
0 I 2 5 4 5 6 7 8 9 10 I '
A I I I I S, I 2 I S II V
a FIG 8- HELL NO. 22.- SIDE VIEW-
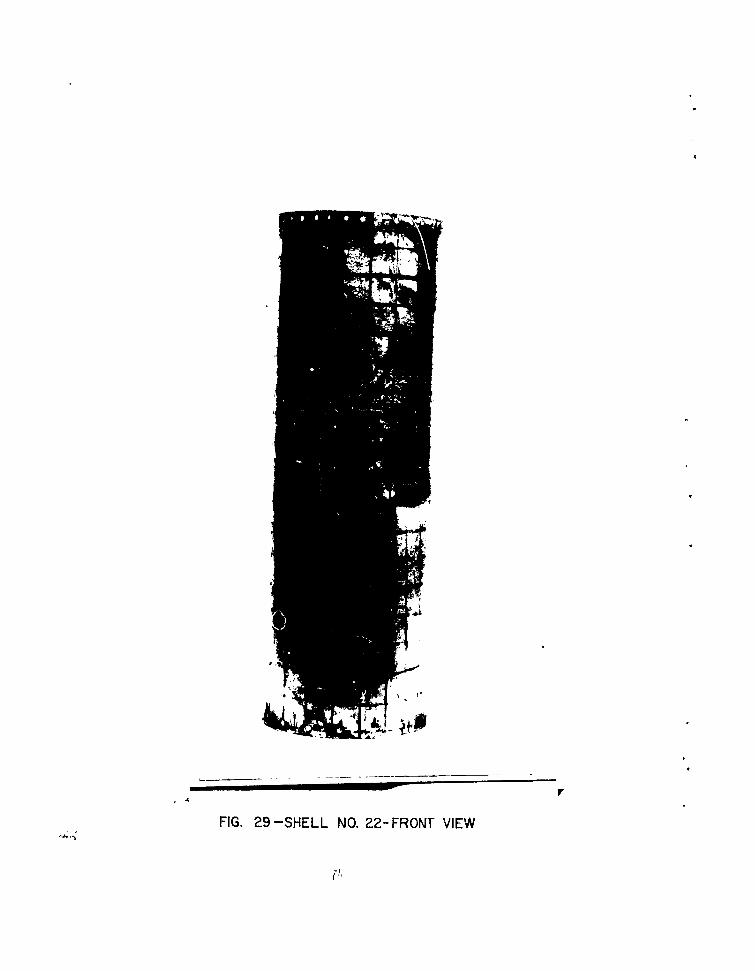
FIG. 29 -SHELL NO. 22- FRONT VIEW
A irfoi
A 4111 M
a tr SIR IN
a
An 4,
As
Is Is
It %U
lot
aw
go
Oki
am
B 14ý A'011ý Vro,
FIG. 30 - SHELL NO. 23 SIDE VIEW
ir'
4pd
Ift
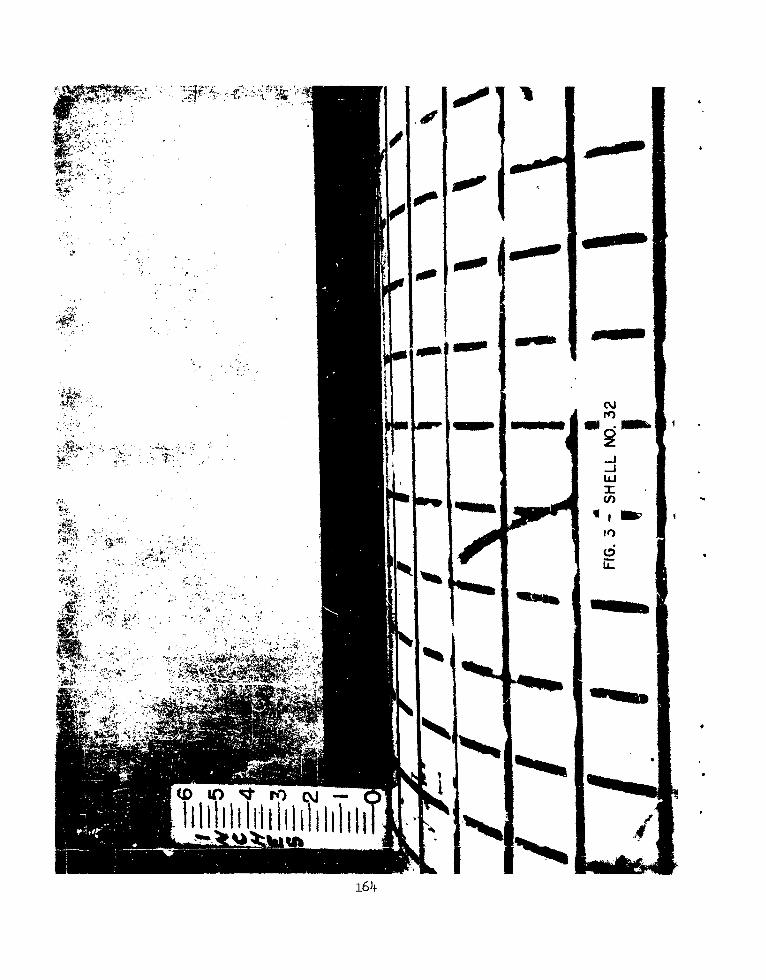
FIG. 32 - SHELL NO.2
A
FIG. 33-SHELL NO. 25
N~ wiCln >W w
aa
w
0(/))
LL
C\j
Cl
Now*
LAJ
CY
ODMow N
d
UJ_j LLJ
ch
LL
4 wzn
uP OD
ii ~ /
w r w At it IL
db
NA
44
tIV 0
w amp EML
zOV w
0 is,
wT-
ODlie I K)
W& or AN
40 of M
ok
r
40
VA M
1
96
lot
N
LIJ
I~lk
I' 84
196 oINrHFS
FIG. 40- SHELL NO. 33
85
380A 0 2 3 4 5 6
INCHES
FIG. 41 - SHELL NO. 34-FRONT VIEW
86

INCHES /FIG. 42- SHELL NO. 34- REAR VIEW
By(
"1l' 012 5 2AphirmES
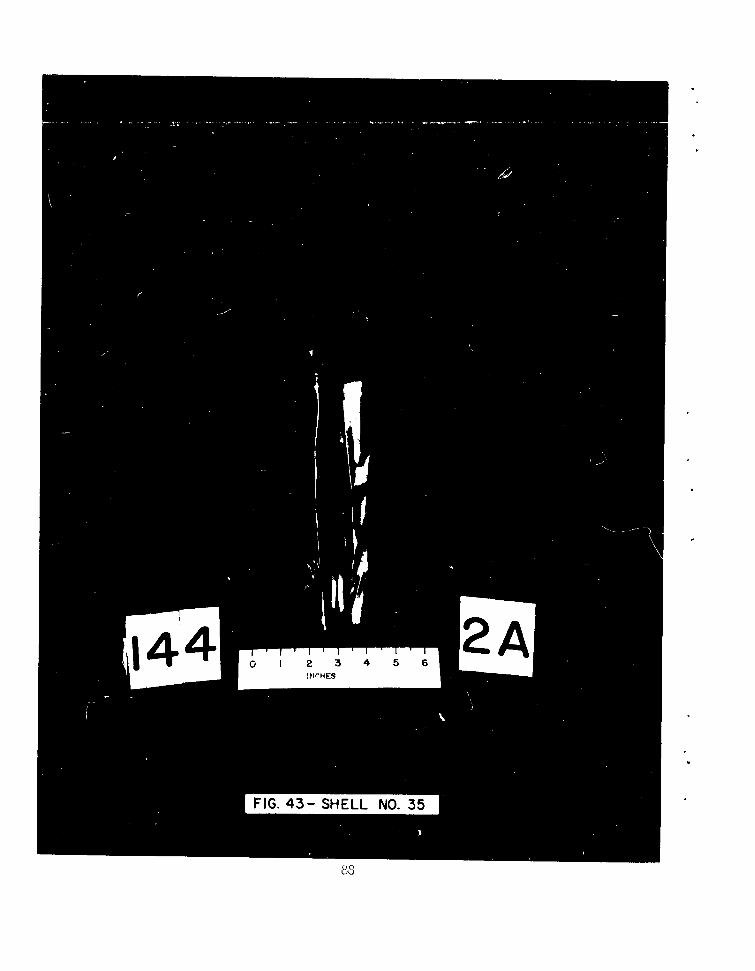
FIG. 43- SHELL NO. 35
LA)
rf)
uj
T-
Y)
qt
200 2 3 4 5 6
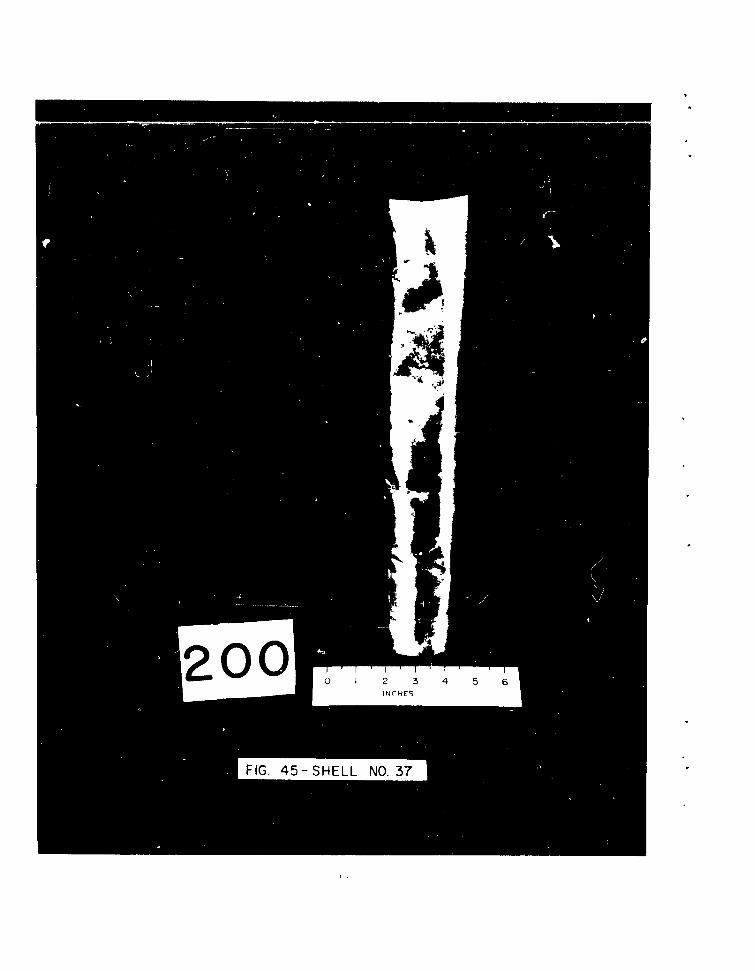
FIG. 45-SHELL NO. 37
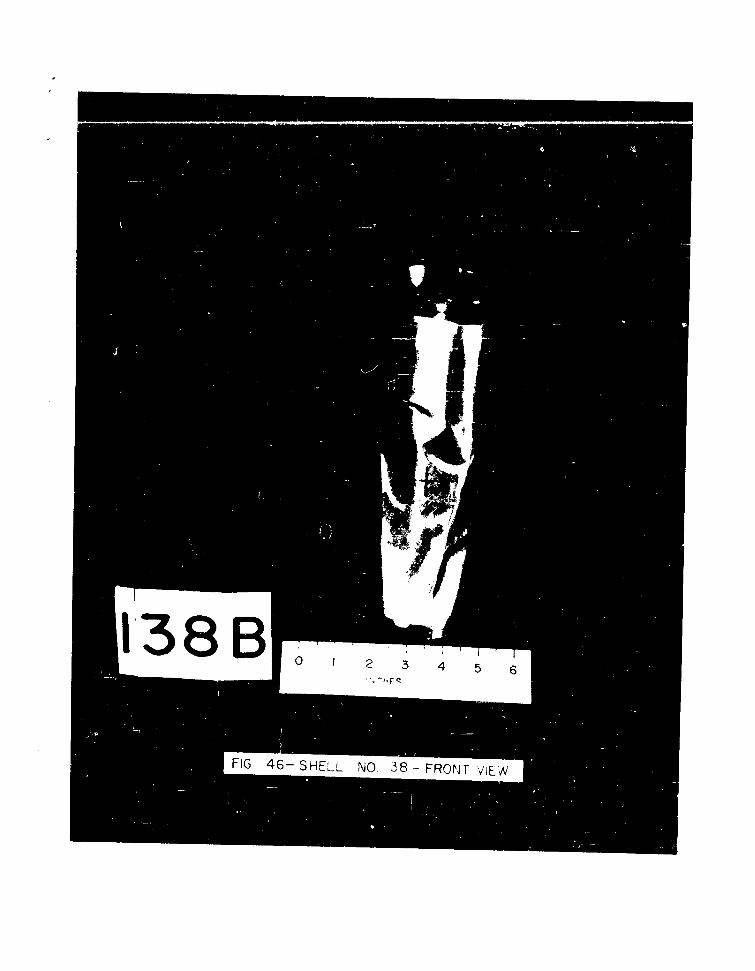
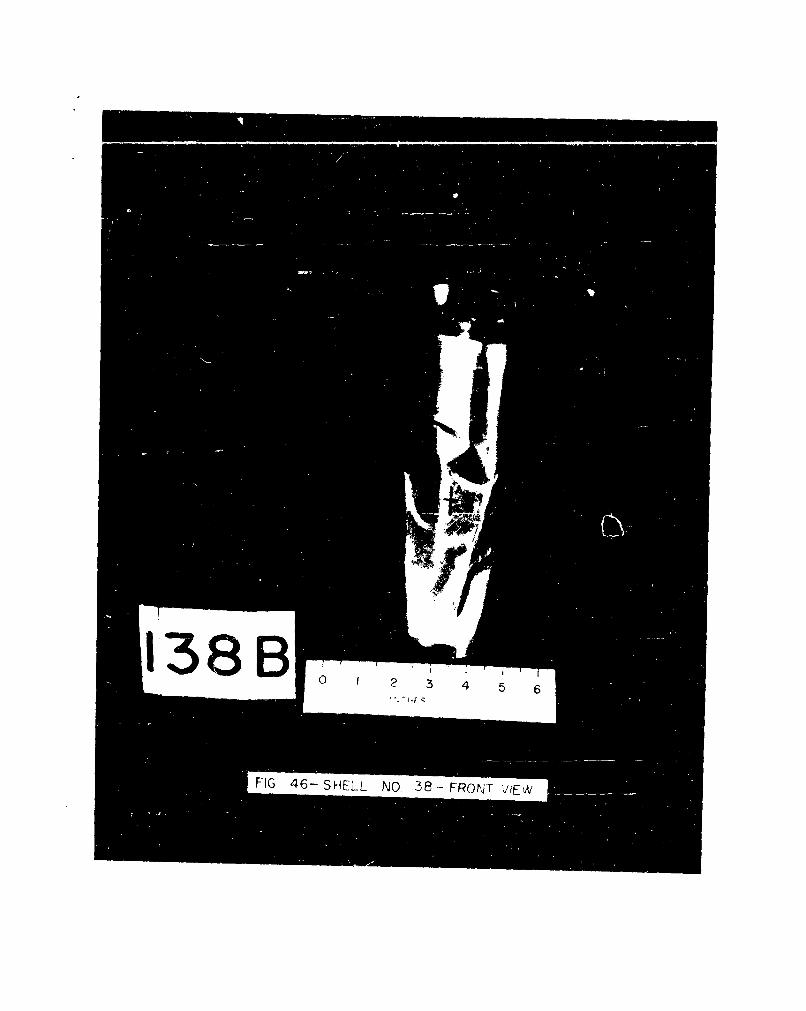
1,38 B 0 2 34 5I
FIG 46- SHELL NO- .8 - FRONT IV
-K-I-.
HG 46- SHELL NO 36 - EROt'JT �R�v
038 2 3 4 5 6
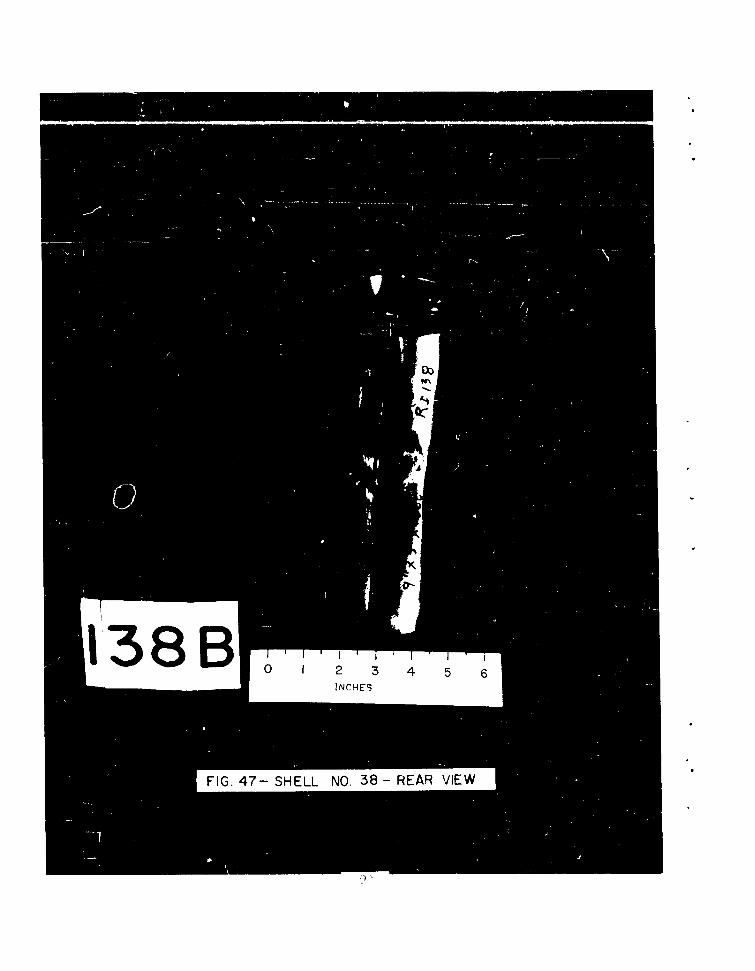
FIG. 47- SHELL NO. 38 -REAR VIEW
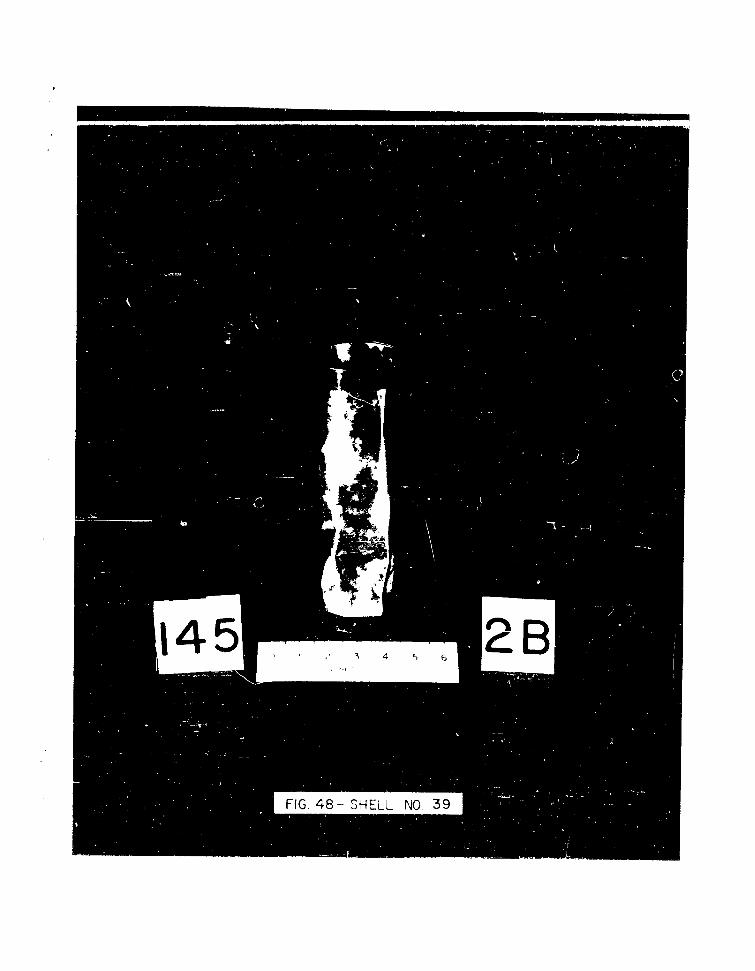
FIG. 48-- SHELL NO. 39
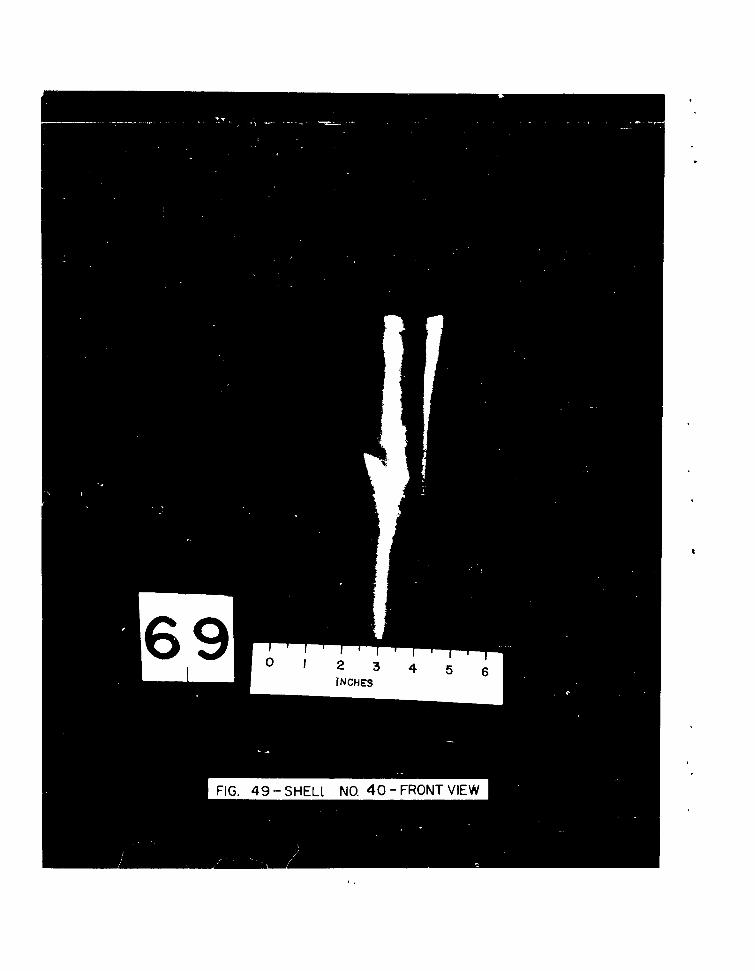
690 I 2 3 4 5 6
INCHES
FIG. 49- SHELL NO. 40- FRONT VIEW
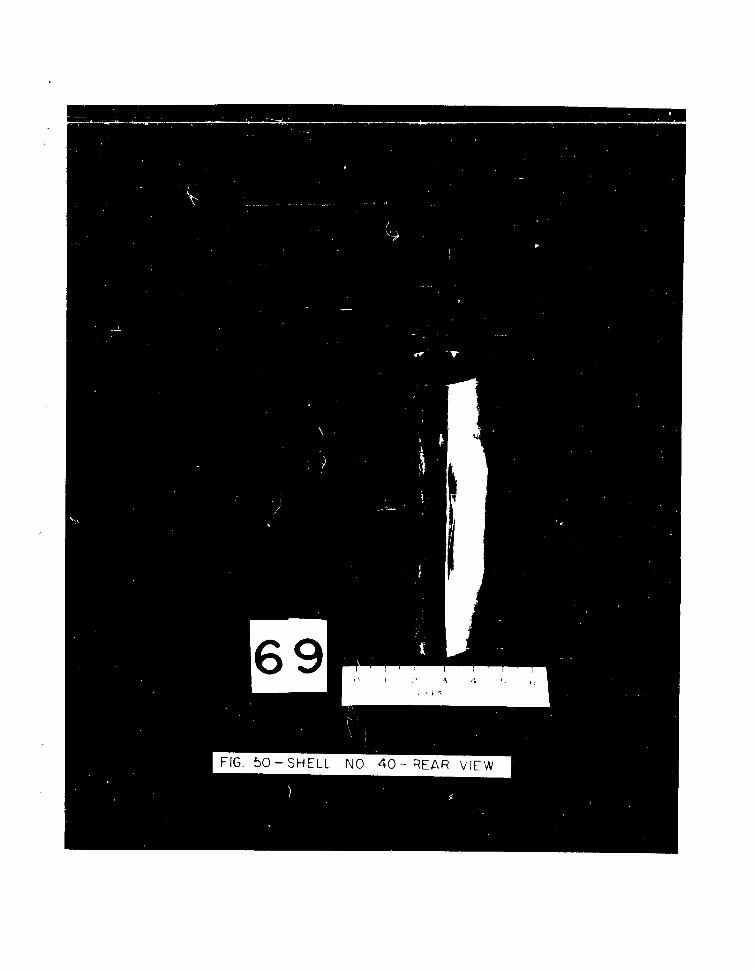
FIG. 50-SHELL NO. 40- REAR VIEW
0 12 3 4 5 6
INCHES
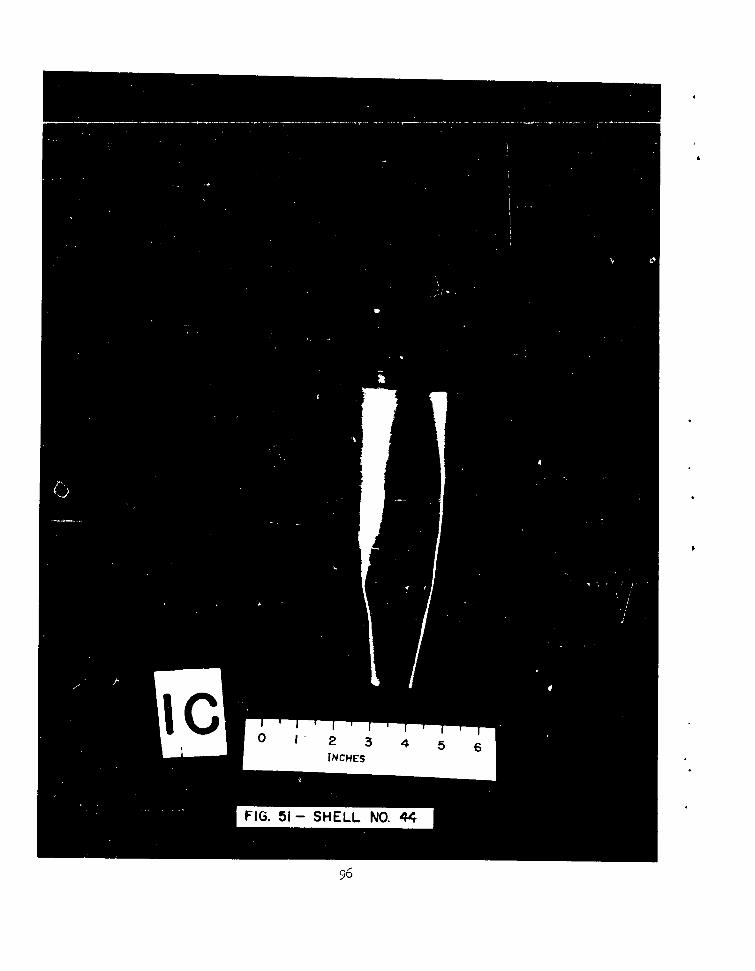
FIG. 51- SHELL NO. 44
96
U
1I. 2 3 4 5 N
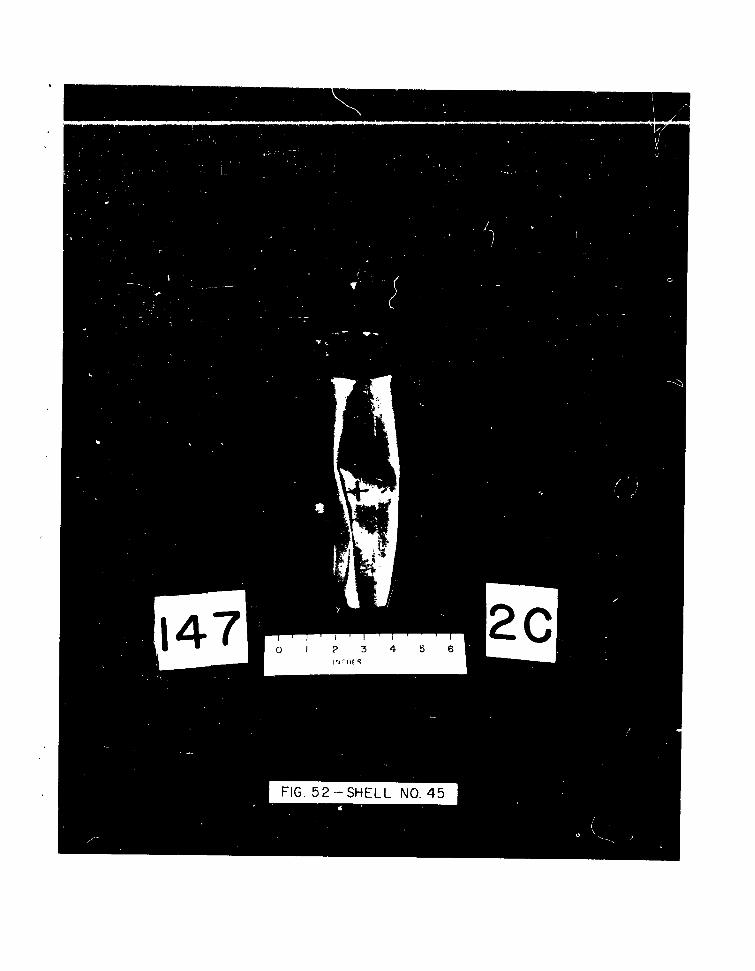
FIG. 52 -SHELL NO. 45
72
INCHES
98

72A 1 2 3 4 5 61 N rHF7S
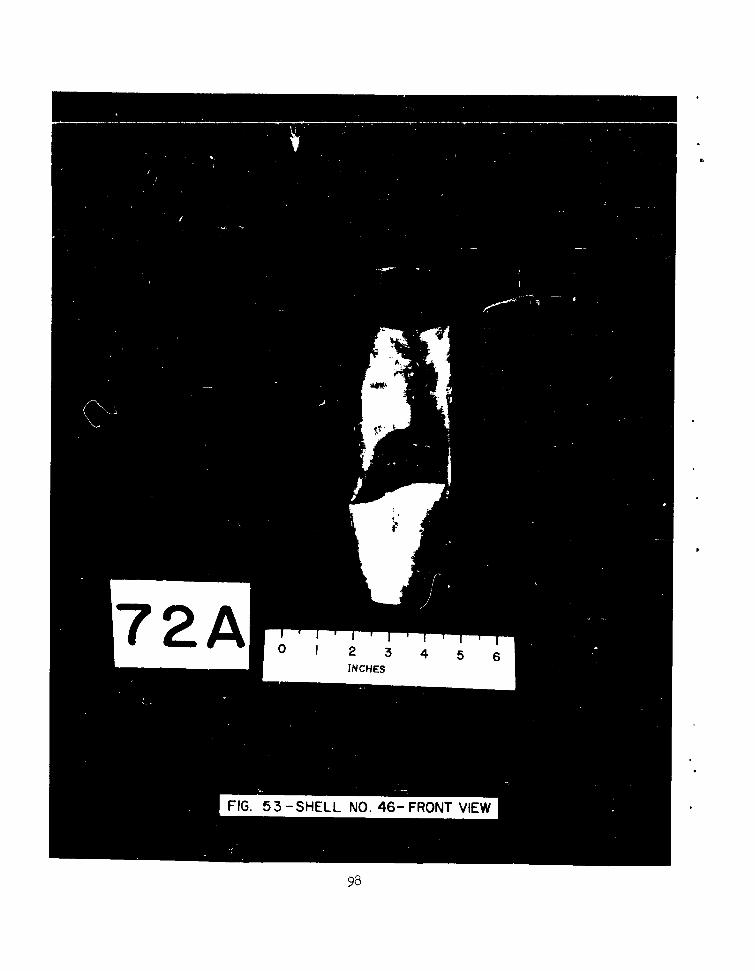
FIG. 54-SHELL NO. 46-REAR VIEW

DoZ 012 3 45 6INCHES
FIG. 55- SHELL NO. 47
100
88~)
83 ~~INCHES456
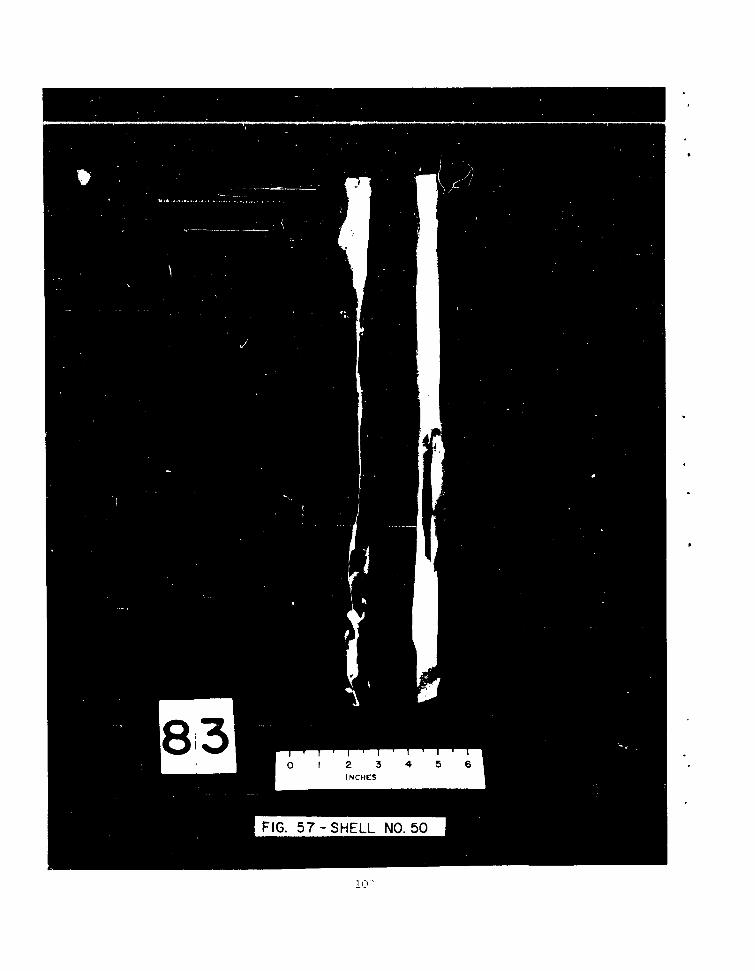
FI.57 -SHELL NO. 50
890 1 2 3 4 5 6
INCHfS
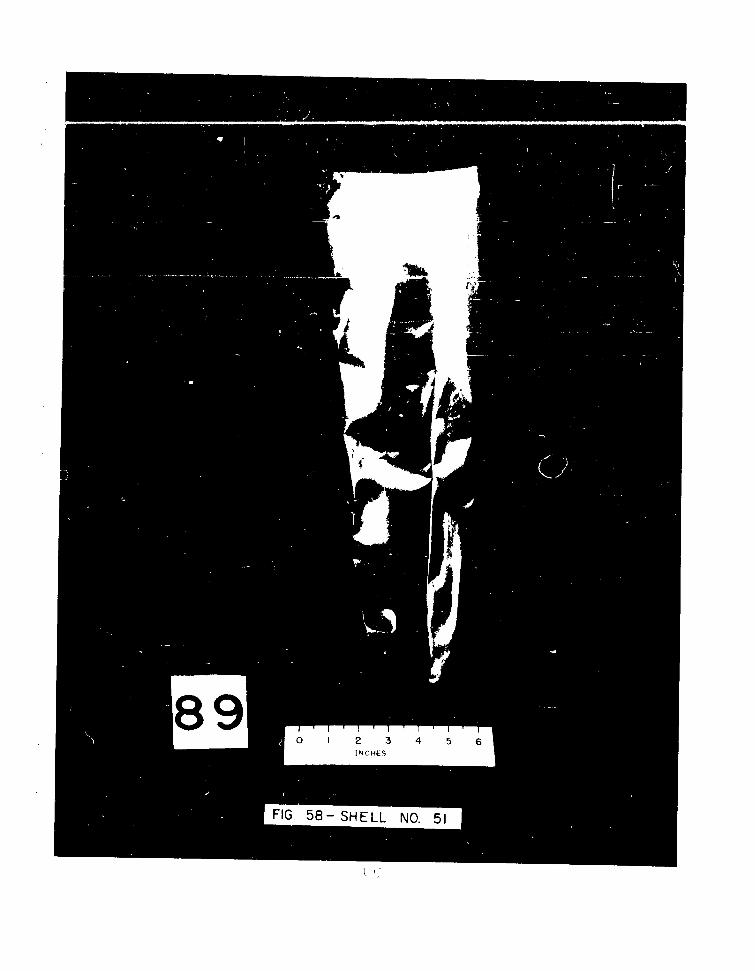
58- SHELL NO. 51
OD(D
al

0 1 4 5 6m ~~IN H
60- SHELL NO. 54
FIG. 61 -SHELL NO. 55--FRONT VIEW'
146 ,,0 1 2 3 4 1) C
C~-j
... .. .
M
C',
(0L
FIG 64- SHELL NO. 58
400 .,4I 2 3 4 5 6
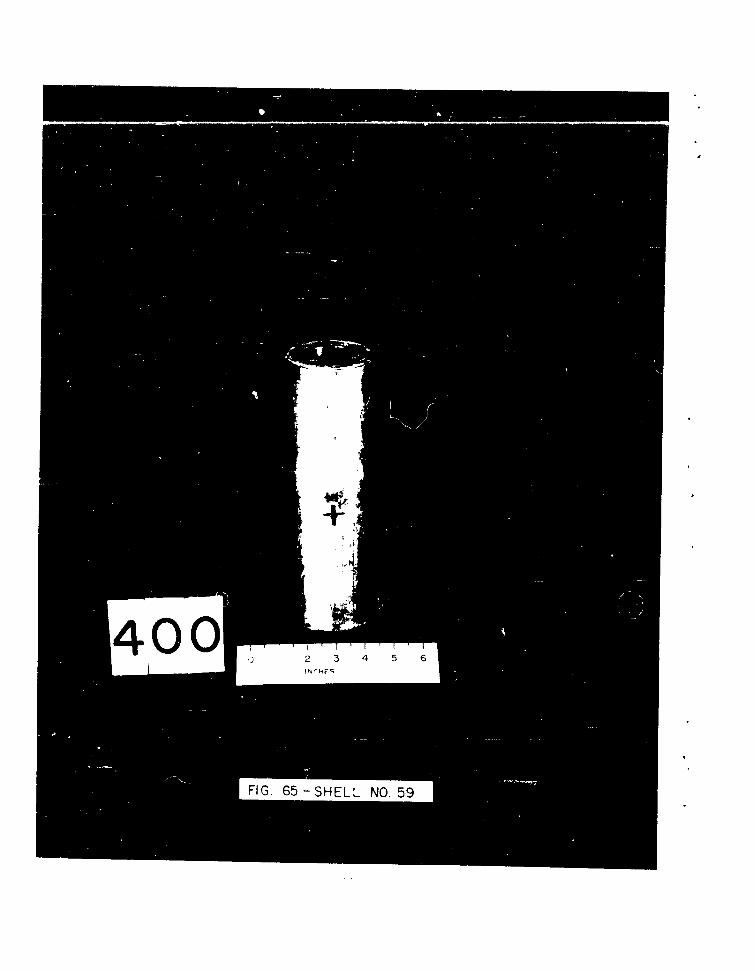
FIG. 65-SHELL NO. 59
401 3 4
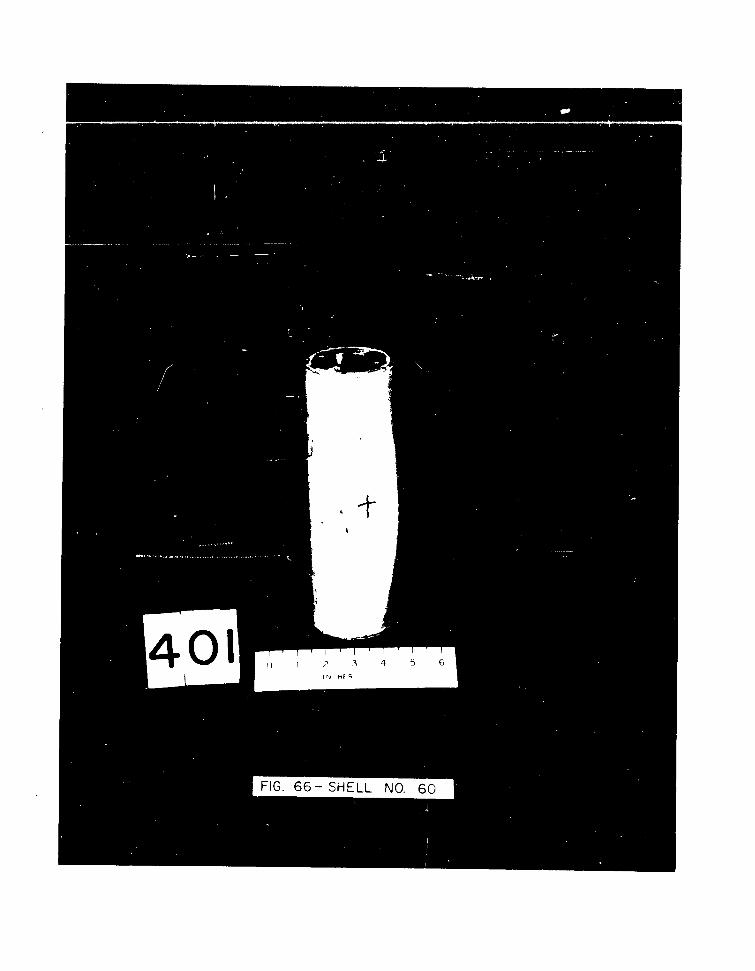
FIG. 66- SHELL -NO. 60
93
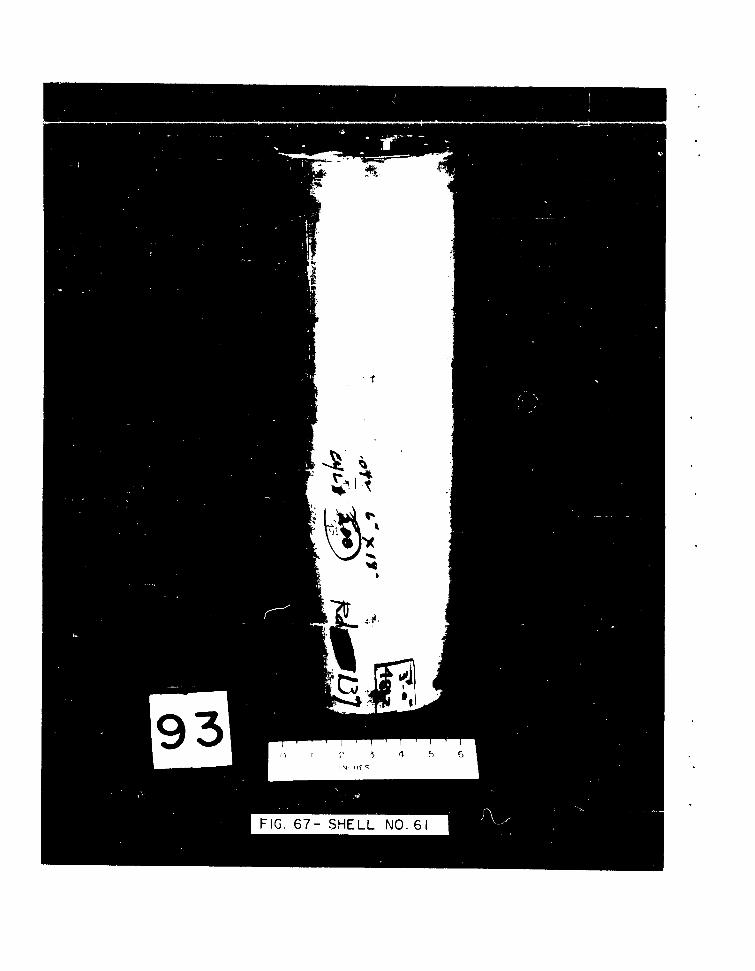
FI.67- SHELL NO. 61
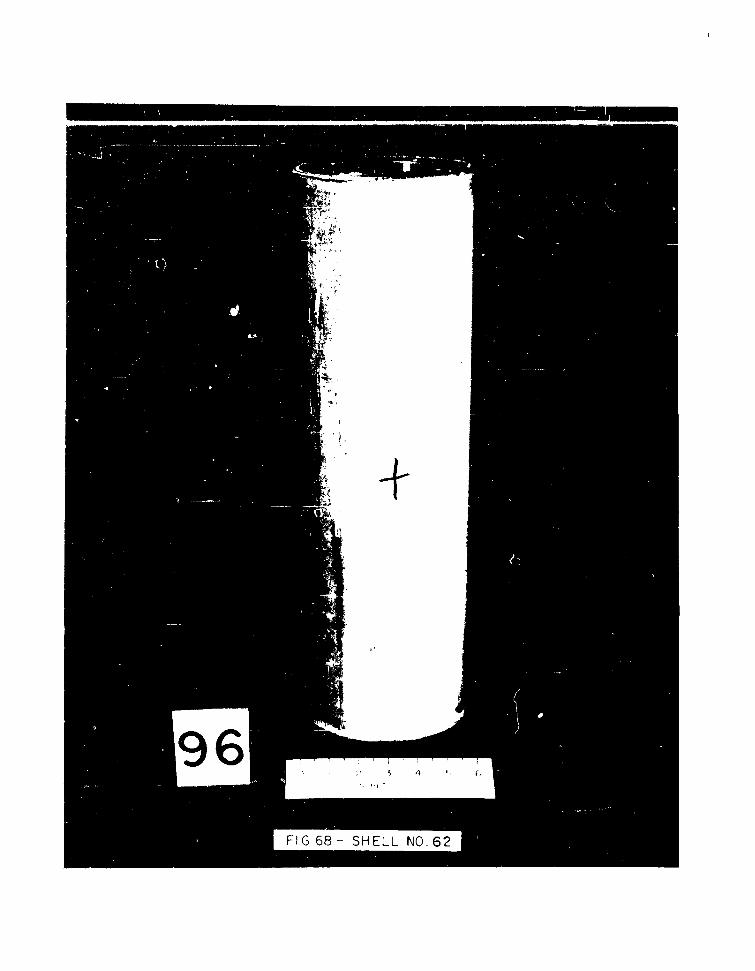
FIG 68 - SHELL NO. 62
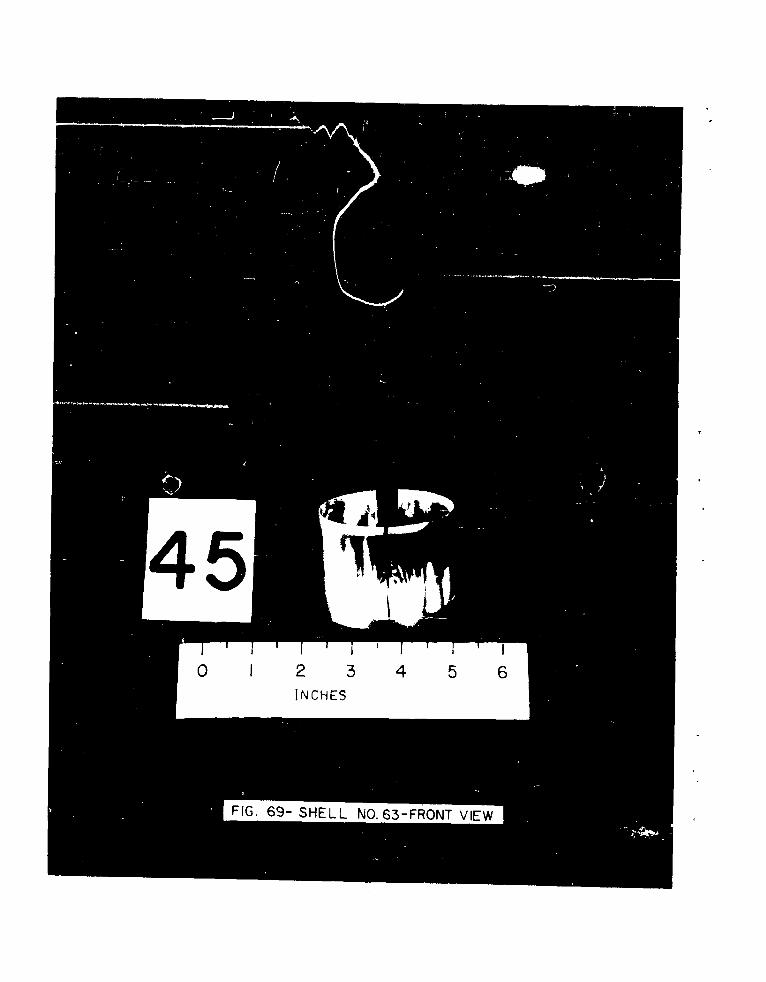
FIG 6 2 N3 -F VIINCHES
FIG. 69- SHELL NO. 63-FRONT VIEW
0 I 2 3 4 5 6
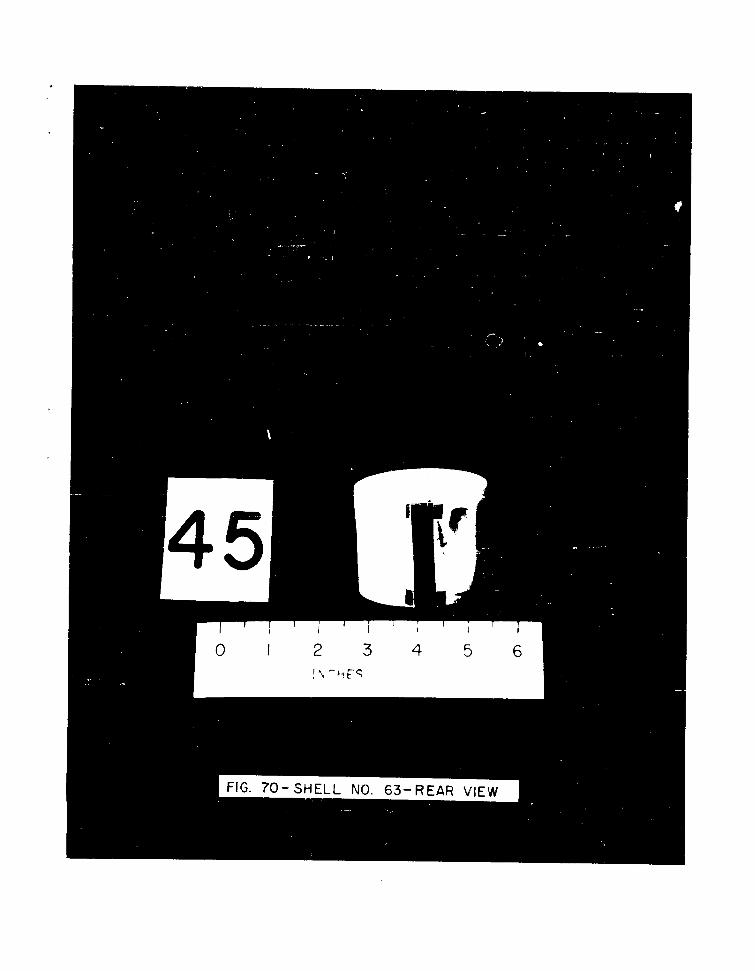
FIG. 70-SHELL NO. 63-REAR VIEW
270 I 2 3 4 5 6
INCHES
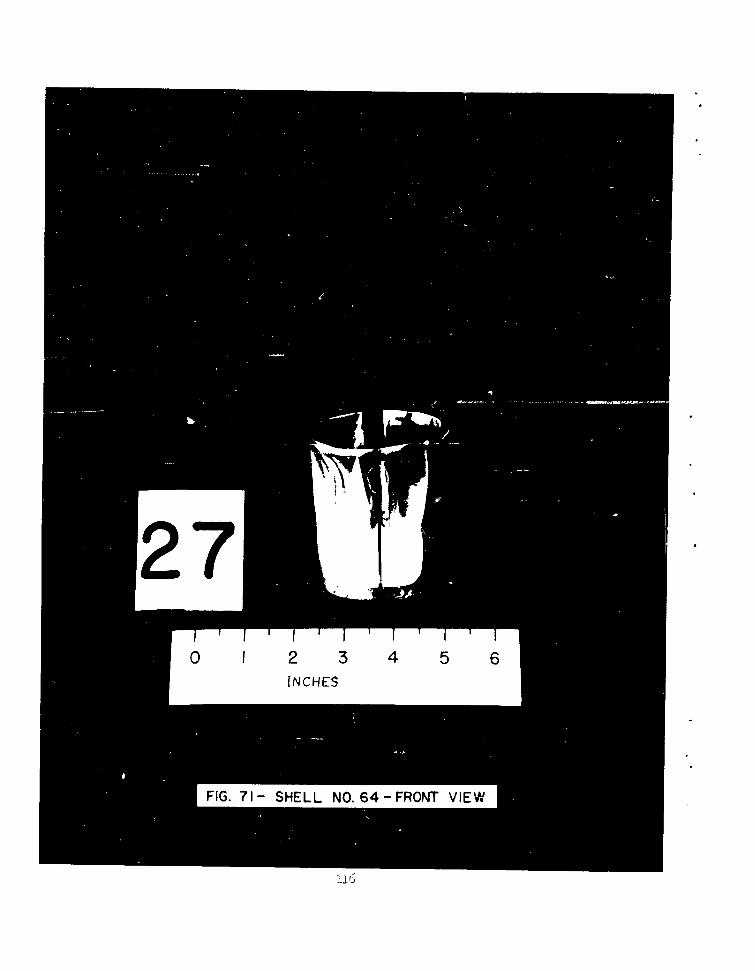
FIG. 71- SHELL NO. 64-FRONT VIEW
0 1 2 3 4 5 6INCHES
I4 !
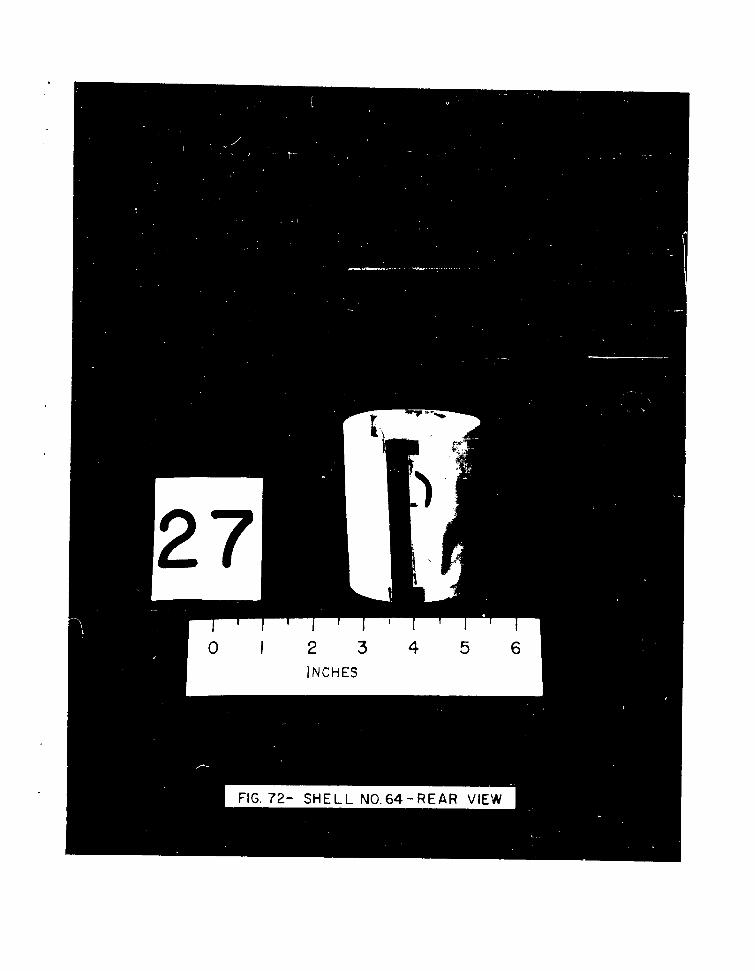
FIG 2 3 4 5
FI.73- SHELL NO. 65
NC, 2 3* INCHES
FIG. 74-SHELL NO. 66-FRONT VIE_..W
474. 0 i 2 3 4 5 6
INCHES
FIG. 75-SHELL NO.66-REAR VIEW
25G
FIG. 76- SHELL NO. G7-FRONT VIEW
25C
0 2 3 4 5 6
FIG. 77-SHELL NO. 67-REAR VIEW
S N IN
62A 62BFIG. 78-SHELL NO. 68-FRONT VIEW
i 123

o 4 25~ 6
FIG. 79 -SHELL NO, 68- REAR VIEW

FIG. 80- SHELL NO.69-FRONT VIEW
125
I
FIG. 81 -SHELL,,. NO. 69-SIDE VIEW
5F
0 1 2 3 4 5 6
INCHES
ll l/iI.82- SHELL NO. 71- SIDE VIEW
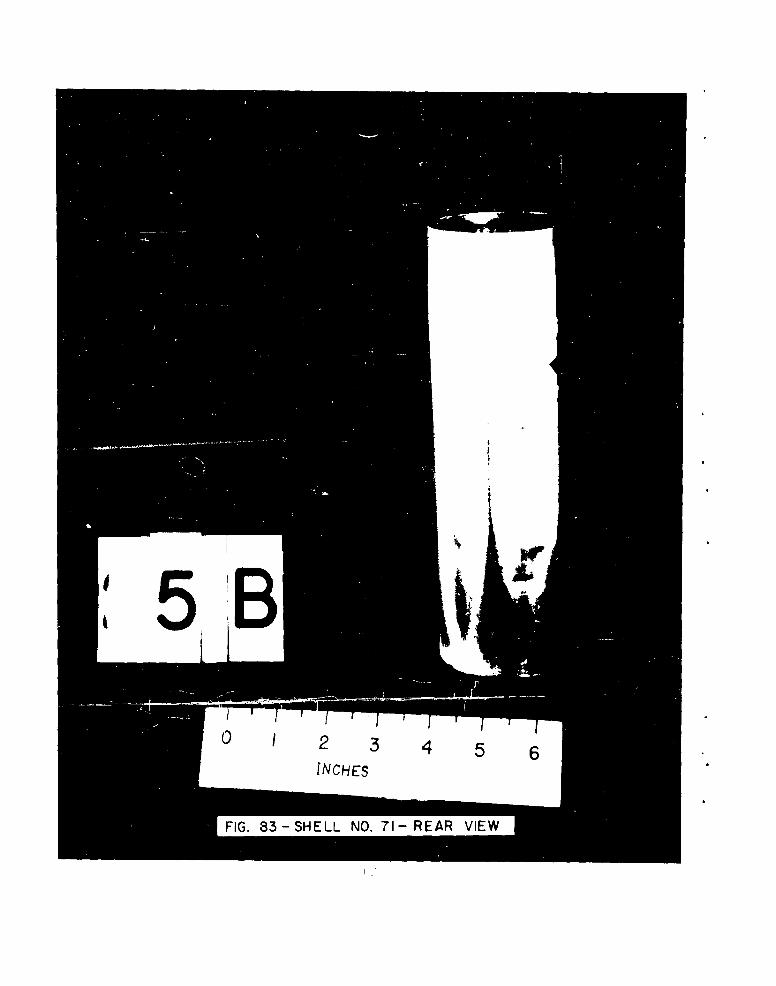
INCHES
FIG.~~~~~ 83-HLN.7-REA
uj
N
-Now 6
co0U-
c -ow
LiiJw
w
Lc)m O-
= 0L
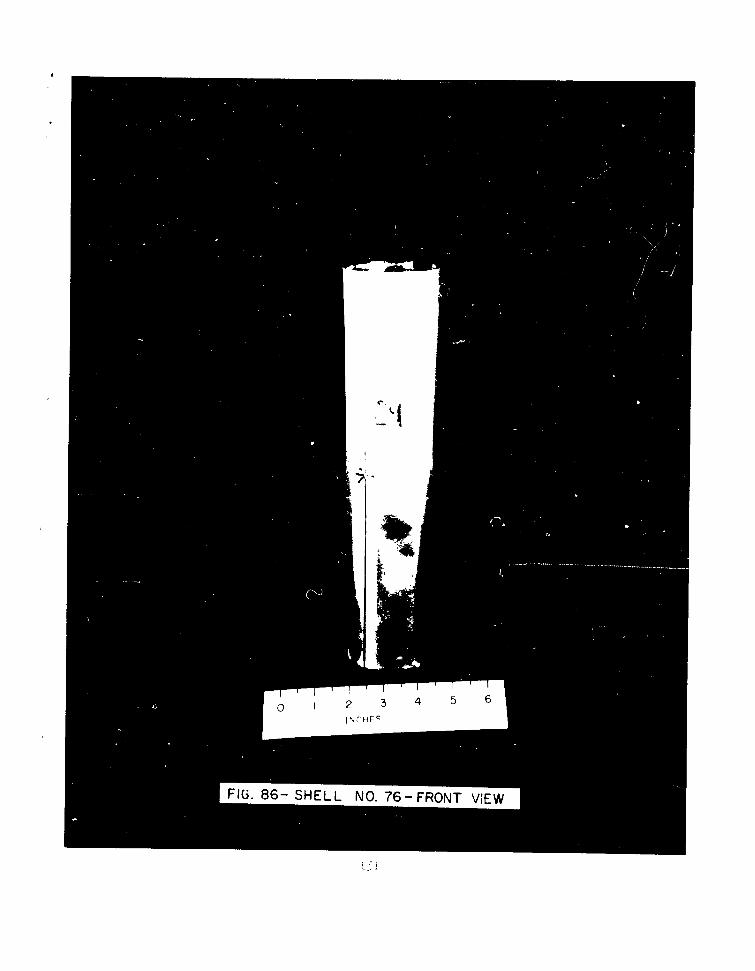
0 2 6
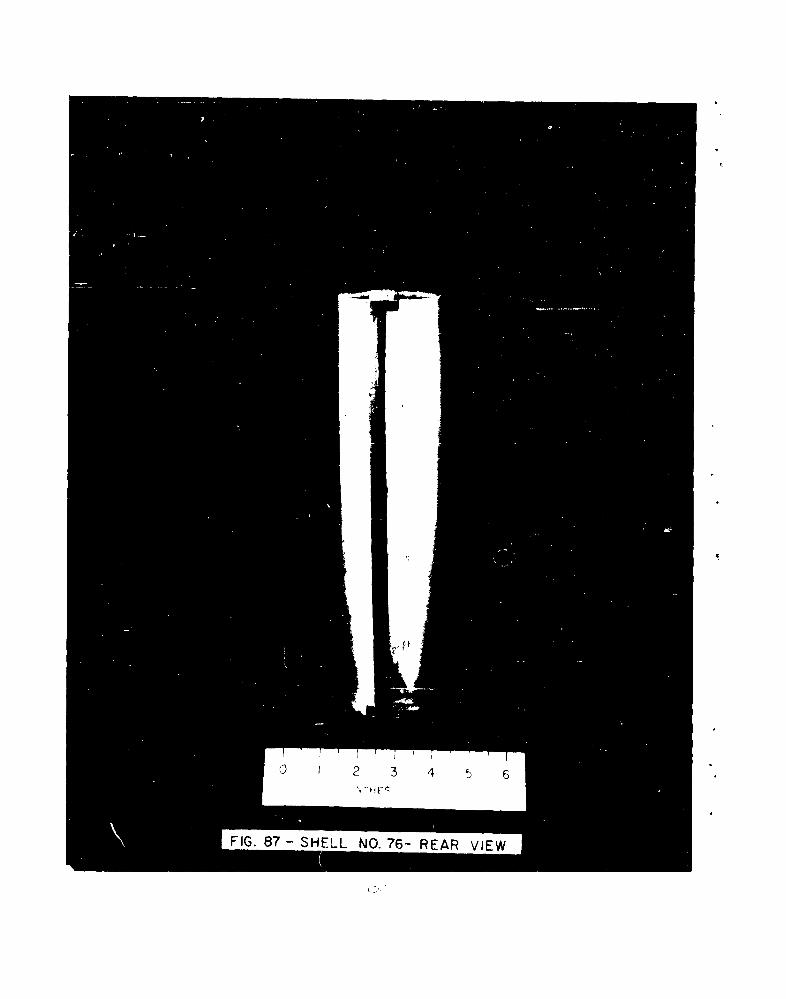
FIG. 87- SHELL NO. 76-RERVW
I I 3 4 5 0
133
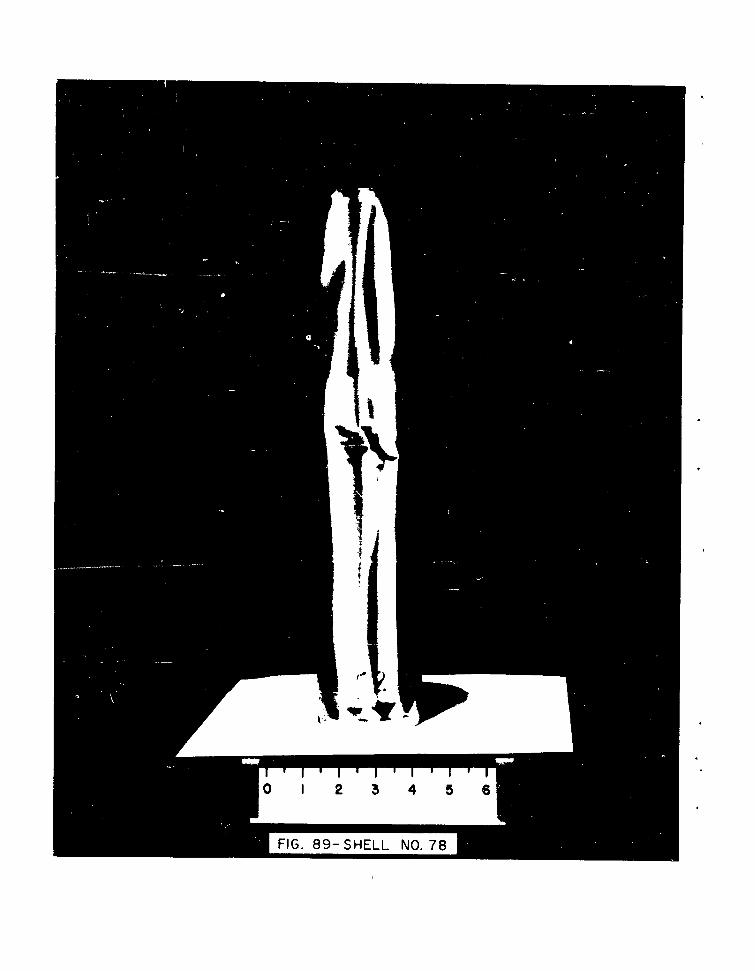
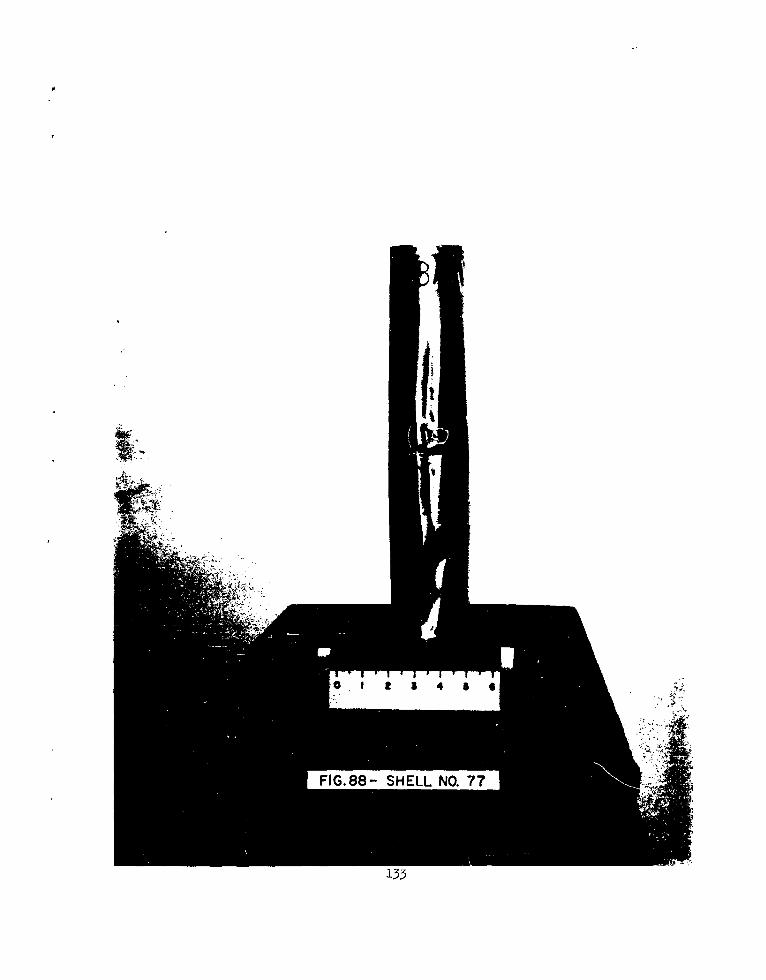
FG -8-SHELL No. 781
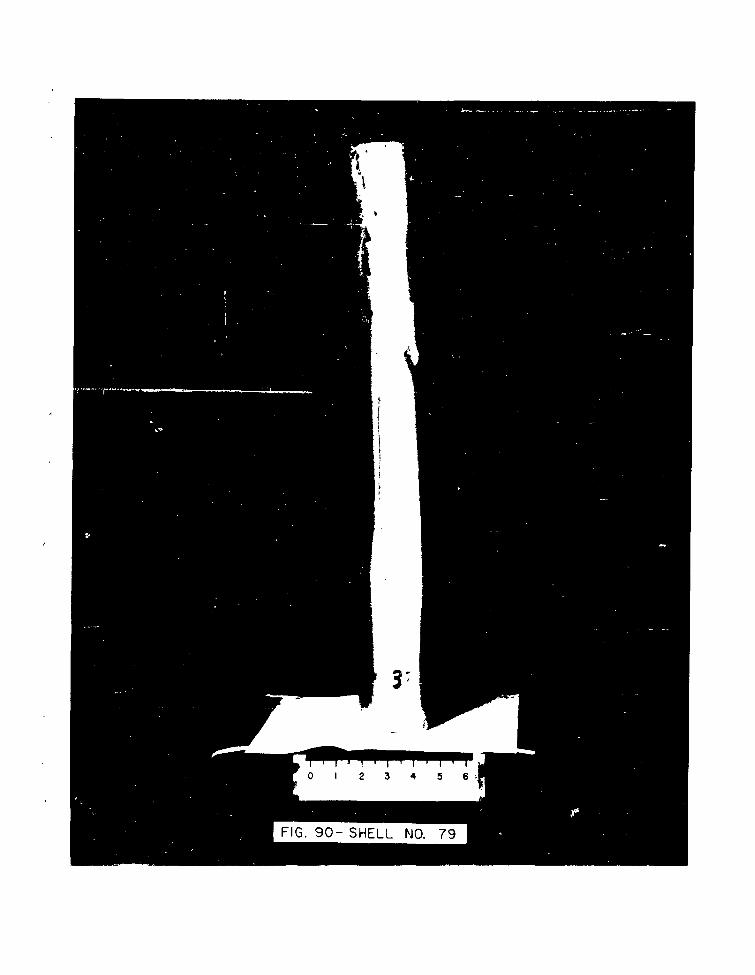
FIG.• • 90-2 3 N 79
FG90- SHELL N.7
S0 1 2 3 4 5 6
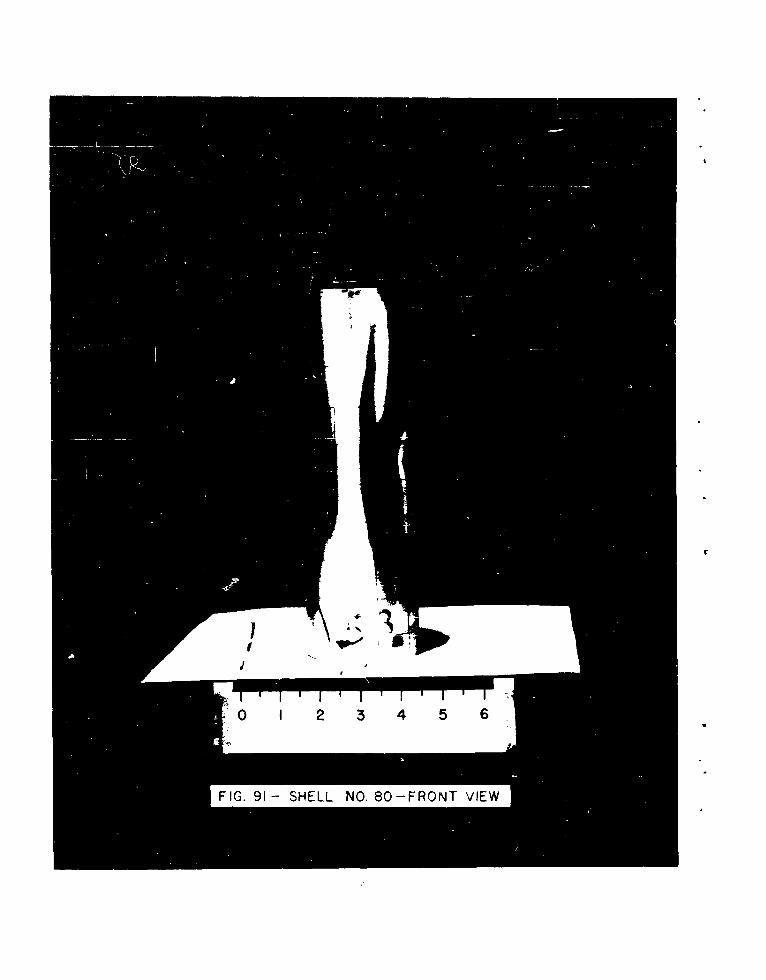
FIG. 91 - SHELL NO, 80-FRONT VIEW
137
/
0 I 2 3 4 5 6
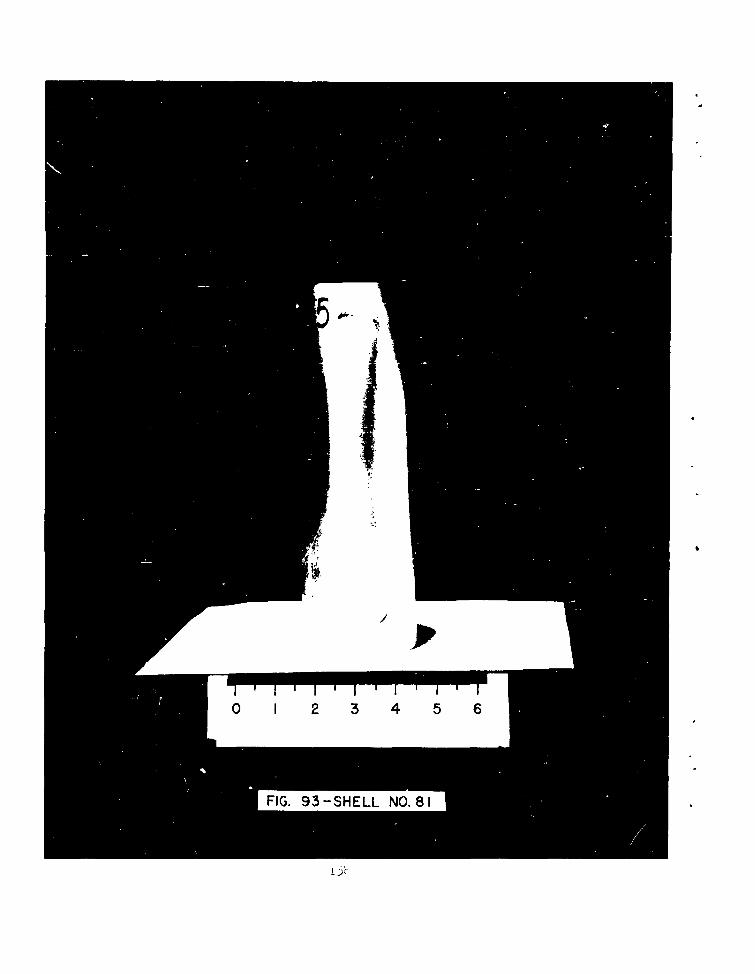
FIG. 93 -SHELL NO. 81
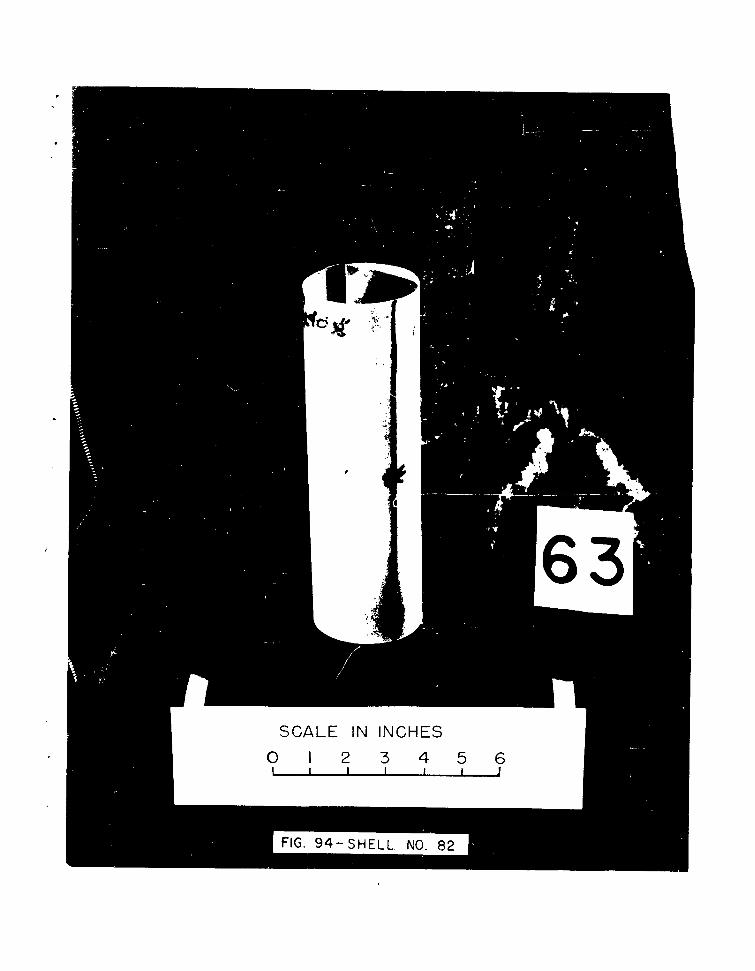
63
SCALE IN INCHES
0 I 2 3 4 5 69 HI I I I I82

-0-J
"W4 4-'
I I1 ~(D
0 2 3 4 5 6INCHES
FIG. 97- SHE'LL NO.88- FRONT VIEW
- I T
0 1 2 3 4 5 6
FIG.98-HELL NO. 88- SIDE VIEW
I
FIG. 99- SHELL NO. 89 -FRONT VIEW
1-45
5ýý9 A 59 590C
SCAL IN INCHES
SCALE IN INCHES
FG. 103 - SHELL NO. 92 -FRONT VIEW
14,'
SCALE IN INCHES
FIG 1.0 - SHL NO 2; I D VIE
• IA W5
SCALE IN INCHES
0 I 2 3 4 5 6I 5I I S I I I I
FIG. 105-SHELL NO.93FOTVE
FIG. 106-SHELL NO. 9-3- REAR VE
1~51
F IG -I
SCALE IN INCHES
0 1 2 3 4 5 6
LFIG 107 SHL N -FON VIE
SCALE IN INCHES
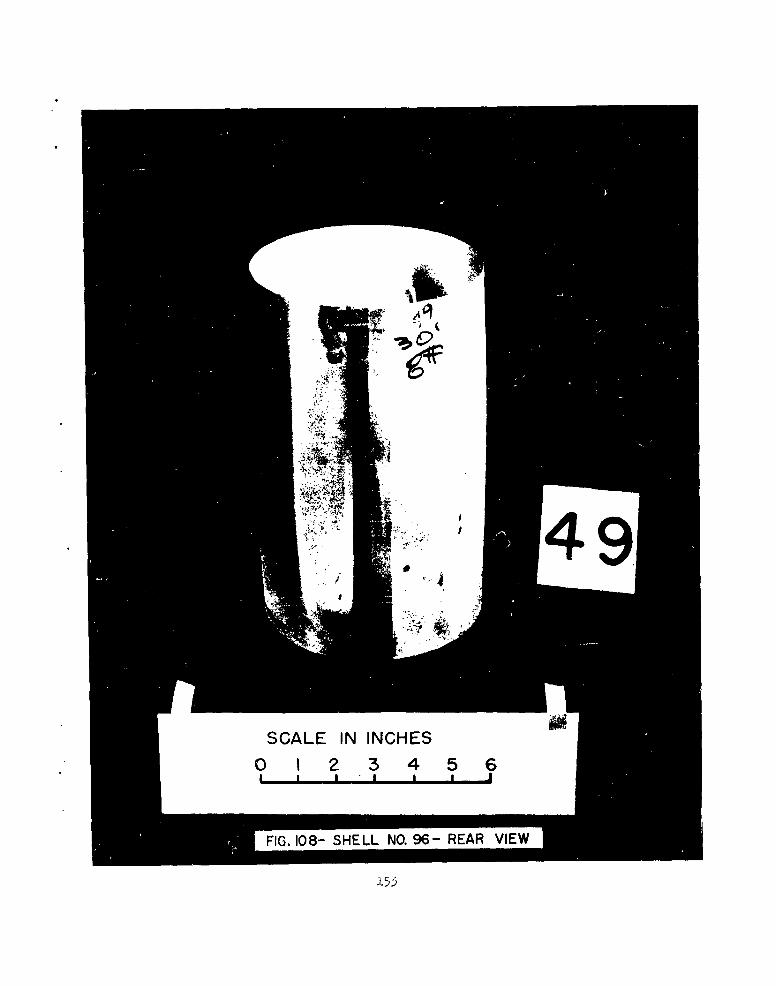
0 1 2 3 4 5 6
SHELL NO. 96- REAR
155
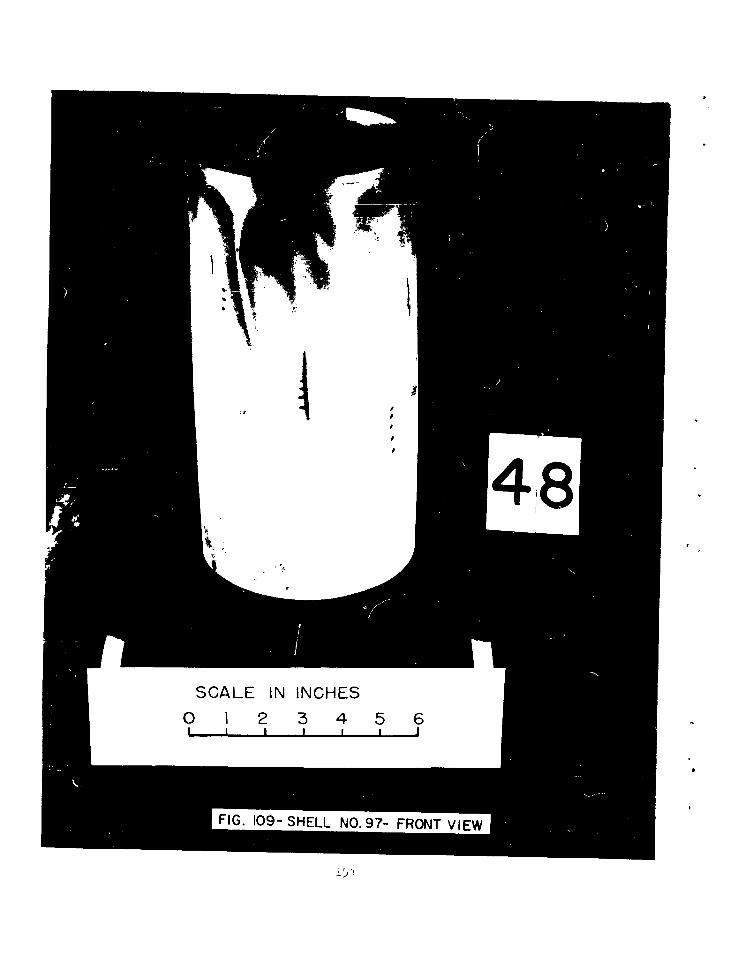
SCALE IN INCHES
o 1 2 3456F IN I9 HES
F IG 09 SHL NO 95 FRN6VE
.. . . .... ..
IJ
IL-
N-J
156
tj
w
5;w
co(D
Lli
z
LAJ
cli
J6-
Lj
LL
C5
LAJ
C/)
158
I 59J
APPENDIX E,
DEFORKATION OF LONGITUDINJALLY LOADED SHELLS
161
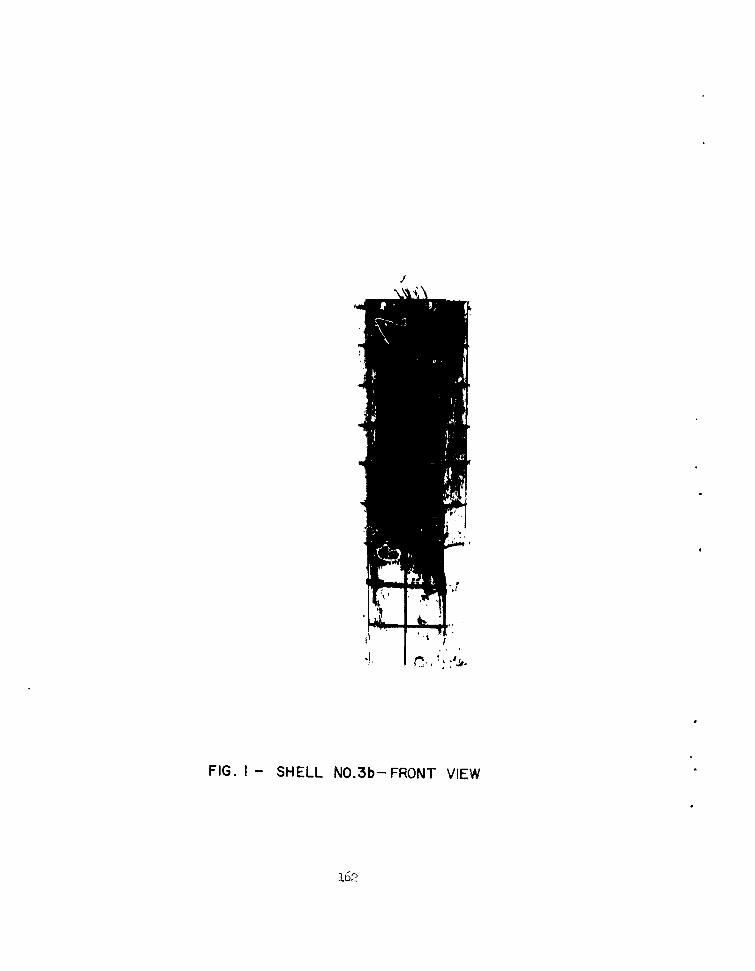
/
FIG. I- SHELL NO.3b-FRONT VIEW
162
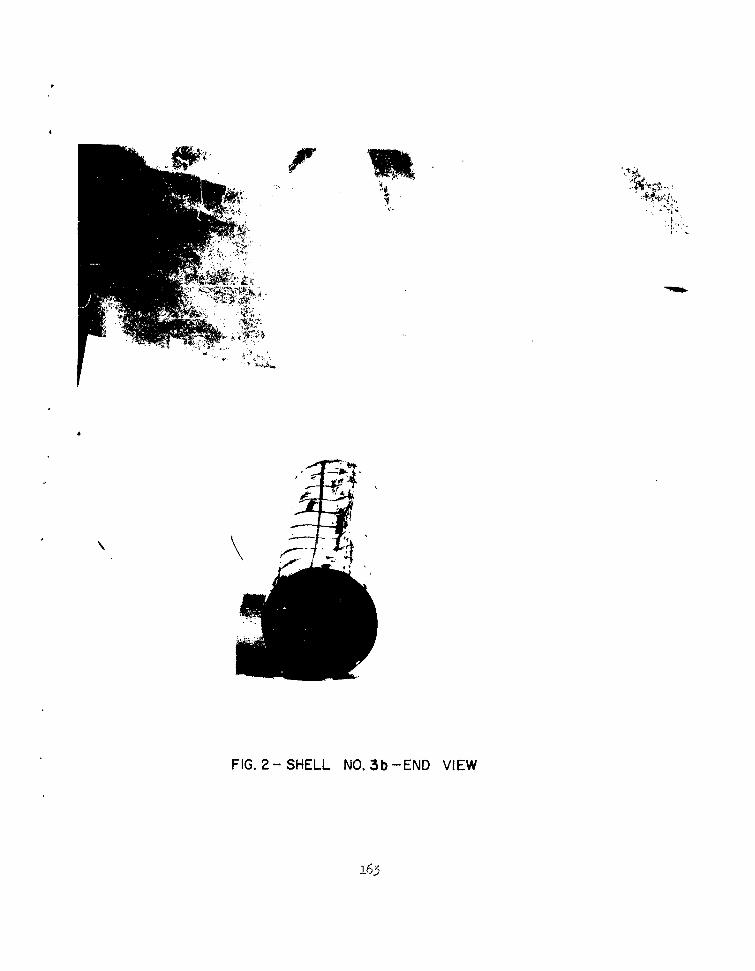
FIG. 2- SHELL NO. 3b-END VIEW
163
00 - I
A-s-
jogj
-LJ
It)
164
CMjC
165)
1alp
FG - IHL N .(
It
FIG. 7- SHELL NO. 74
REFERENCES
1 1. Hodge, P. G. Impact Pressure Loading of Rigid-Plastic Cylindrical ShellsPolytechnic Institute of Brooklyn Report No. 255, MAy 1954.
Hodge, P. G. Ultimate Dynamic Load of a Circular Cylindrical ShellPolytechnic Institute of Brooklyn Report No. 265, November 1954.
Hodge, P. G. The Influence of Blast Characteristics on the Final Deforma-tion of Circular Cylindrical Shells Polytechnic Institute of BrooklynReport No. 266, December 1954.
Sankaranarayanan, R. Dynamic Response of Plastic Circular CylindricalShells Under Lateral and Hydrostatic Pressures Polytechnic Institute ofBrooklyn Report No. 573, June 1961.
2. Mindlin, R. D. and Bleich, H. H. Response of an Elastic Cylindrical Shellto a Transverse Step Shock Wave Technical Report No. 3, ContractNonr-266(08), Columbia University, March 1952.
Baron, M. L. and Bleich, H. H. Further Studies of the Response of aCylindrical Shell to a Transverse Shock Wave Technical Report No. 10,Contract Nonr-266(08), Columbia University, December 1953.
Bleich, H. H. and Dimaggio, F. L. Dynamic Buckling of Submerged Platesand Shells Technical Report No. 12, Contract Nonr-266(O8), ColumbiaUniversity, September 1954.
3. Seide, P., Weingarten, V. I., and Morgan, E. J. Final Report on theDevelopment of Design Criteria for Elastic Stability of Thin Shell Struc-tures Space Technology Laboratories, AFBMD/TR-61-7, December 1960.
Final Report on Buckling of Shells Under Dynamic Loads Final Report,Contract NASr-56, Space Technology Laboratories, October 1961.
4. Radkowski, P. P. et al Studies on the Dynamic Response of Shell Structuresand Materials to a Pressure Pulse AVCO Corporation, AFSWC-TR-61-31 (II),July 1961.
5. DeHart, R. C. and Basdekas, N. L. Response of Aircraft Fuselages andMissile Bodies to Blast Loading Southwest Research Institute, ASD-TDR-62 -Preprint, March 1962.
6. Scientific- Observations on the Explosion of a 20 Ton TNT Charge, VolumeOne, General Information and Measurements Report No. 203, SuffieldExperimental Station, Ralston, Alberta, September 1961.
7. Goodman, H. J. Compiled Free-Air Blast Data on Bare Spherical Pentolite,BRL Report No. 1092, February 1960.
S-. 'Ecaker, 'W. E. and Schuman, W. J. Air Blast Data for Correlation with MovingAirfoil Tests BRL Technical Note No. 1421, August 1961.
169

9. Kinney, G. F. Explosive Shocks in Air The MacMillan Company, 1962.
10. Cole, R. H. Underwater Explosions Princeton University Press, 1948.
170
NDISTIBUTION LIST
No. of No. ofCopies Organization Copies Organization
10 Commander 1 Commanding Officer" Armed Services Technical Harry Diamond Laboratories
Information Agency ATTN: Technical InformationATTN: TIPCR Office, Branch 012Arlington Hall Station Washington 25, D. C.Arlington, Virginia
1 Commanding General2 Chief U. S. Army Missile Command
Defense Atomic Support Agency ATTN: ORDXM-RFCATTN: Blast and Shock Division Redstone Arsenal, AlabamaWashington 25, D. C.
1 Defense Intelligence AgencyCommanding General ATTN: APl(K2), Mr. WhiteField Command Washington 25, D. C.Defense Atomic Support AgencySandia Base 2 CommanderP. 0. Box 5100 U. S. Naval Ordnance LaboratoryAlbuquerque, New Mexico White Oak
Silver Spring 19, MarylandDirectorDefense Research and 2 Director
Engineering (OSD) U. S. Naval Research LaboratoryATTN: Director/Electronics ATTN: Code 5367Washington 25, D. C. Washington 25, D. C.
1 Director 1 CommanderIDA/Weapon Systems Evaluation U. S. Naval Ordnance Test Station
Group ATTN: Army Ordnance RepresentativeRoom 1E875, The Pentagon NOTS AnnexWashington 25, D. C. 3202 E. Foothill Boulevard
Pasadena 8, CaliforniaCommanding GeneralU. S. Army Materiel Command 1 CommanderATN: AMCRD-RS-PE-Bal U. S. Naval Missile CenterResearch and Development Point Mugu, California
DirectorateWashington 25, D. C. 3 Chief
Bureau of Naval Weapons5 Commanding Officer ATTN: DIS-33
Picatinny Arsenal Department of the NavyATN: Feltman Research and Washington 25, D. C.
Engineering LaboratoriesDover, New Jersey
171
DISRIBUTION LIST
No. of No. ofCopies Organization copies Or'gan iation
1 Comander 1 HadNquarters ,A EuropeU. S. Naval Ordnance Test Station ATTN: Operations AnalysisATTN: Code 4057 APO 633China Lake, California New York, Now York
1 Comander 1 ASD (ASRSHF-2)U. S. Naval Weapons Laboratory Wright-Patterson Air Force BaseATTN: Technical Library OhioDahlgren, Virginia
4 ASD (ASRNDS-12)1 Conmnding Officer Wright-Patterson Air Force Base
Naval Ordnance Laboratory OhioATTN: Technical LibraryCorona, California 4 BSD (BSBKR, BSTBK, BSQK, BSTAK)
Norton Air Force Base1 Inspector of Naval Material California
428 South Warren StreetSyracuse 2, New York 2 AFSWC (SWRA)
Kirtland Air Force Base2 Comnanding Officer Albuquerque, New Mexico
Naval Air Development CenterJohnsville, Pennsylvania 10 Director
National Aeronautics and1 Chief of Naval Research Space Administration
ATTN: O0R: 439: N. Perrone ATTN: Mr. R. A. SchmidtWashington 25, D. C. Code MLO
Washington 25, D. C.1 Comnanding Officer and Director
David W. Taylor Model Basin 4 DirectorATTN: Technical Library, National Aeronautics and
Code 142 Space AdministrationWashington 7, D. C. Langley Research Center
ATTN: Mr. Harold B. Pierce2 Hq., USAF (AFRDC) Atmospheric Input Section
Washington 25, D. C. Langley Field, Virginia
1 RADC 2 Marshall Space Flight CenterGriffies Air Force Base ATTN: Claude GraLn/M-P&VE-SDRome, New York Huntsville, Alabama
1 FTD 2 National Aero Space AdministrationWright-Patterson Air Force Base Manned Space CraftOhio Houston 1, Texas
172
DISTRIBUTION LIST
* No. of No. ofCopies Organization Copies Organization
1 Applied Physics Laboratory 2 J. G. Engineering ResearchATTN: Col. Hackman Associates8621 Georgia Avenue 3831 Menlo DriveSilver Spring, Maryland Baltimore 15, Maryland
1 AVCO 1 Lockheed Missile and SpaceResearch and Advanced Division
Development Division ATTN: Mr. J. F. M. GramATTN: Mr. P. P. Radkowski Sunnyvale, California201 Lowell StreetWilmington, Massachusetts 2 Lockheed-Georgia Company
ATTN: B. H. Little, Jr.1 Avidyne Research, Incorporated 865 Cobb Drive
ATTN: Dr. N. P. Hobbs Marietta, Georgia76 Cambridge StreetBurlington, Massachusetts 1 The Martin Marietta Corporation
ATTN: H. R. Fuehrer, MP-1091 Aerospace Corporation Sand Lake Road
ATTN: R. M. Cooper Orlando, FloridaP. 0. Box 95085Los Angeles 45, California 1 The Martin Marietta Company
Baltimore 3, Maryland1 Armour Research Foundation
Mechanics Research Division 1 The Martin Marietta CorporationATTN: Dr. E. Sevin Technical Development Section10 West 35th Street ATTN: Dr. A. A. EzraChicago 16, Illinois Denver, Colorado
2 Aircraft Armaments, Incorporated 2 The Pennsylvania State UniversityAAT•N: Dr. W. E. Baker Department of EngineeringCockeysville, Maryland Mechanics
ATTN: Prof. N. Davids1 Boeing Company University Park, Pennsylvania
Seattle 14, Washington1 Republic Aviation Corporation
1 Cornell Aeronautical Laboratory ATTN: Sup. Eng. LibraryP. 0. Box 235 Farmingdale, Long Island, New YorkBuffalo 21, New York
1 Raytheon Company1 Falcon R&D Company Mail No. 550
Denver 18, Colorado Hartwell RoadBedford, Massachusetts
173
DISTRIBUTION LIST
No. of No. ofCopies Organization Copies Organization
Suffield Experimental Station 2 Massachusetts Institute ofATTN: J. M. Dewey TechnologyRalston, Alberta, Canada ATTN: Dr. E. A. Witmer
Dr. J. R. RuetenikKaman - Nuclear Cambridge 39, MassachusettsATTN: D. C. SachsGarden of Gods Road 1 University of ChicagoColorado Springs, Colorado Institute for Air Weapons
ResearchSpace Technology Laboratories Chicago 37, IllinoisATTN: Dr. J. D. WoodOne Space Park 10 The Scientific InformationRenondo Beach, California Officer
Defence Research Staff1 Stanford Research Institute British EmbassyPoulter Laboratories Division 3100 Massachusetts Avenue, N. W.ATTN: Dr. G. Abrahamson Washington 8, D. C.Menlo Park, California
4 Defence Research MemberSouthwest Research Institute Canadian Joint StaffDepartment of Mechanical Sciences 2450 Massachusetts Avenue, N. W.ATTN: Dr. H. N. Abramson Washington 8, D. C.8500 Calebra RoadSan Antonio 6, Texas
q
174
4J 41
~1 ! I.
4.4 I . 8
.1U 44
41 4 0
'444
q., 4-)4
4-11 1
.- 4 I 't
041 34 1
II