about jasig inc. and the sakai foundation€¦sakai and those of duraspace (fedora and dspace) and...
TRANSCRIPT

1 25 September 2011
About Jasig Inc. and the Sakai Foundation Some numbers: Membership, revenue and expense, and software use
Background On 7 October 2010 Jasig Inc. and the Sakai Foundation announced �an intention to pursue a merger of their two organizations, subject to the approval of their respective communities.� The initial announcement continued:
The new organization would provide shared infrastructure, expertise, and other resources for the development of a wide range of open source software projects that are designed to meet the needs of academic institutions. It would conduct outreach and explore more meaningful relationships with a broad range of open source and standards organizations. It would provide a clearinghouse for best practices on related management issues such as crafting open source-friendly procurement processes and assessing the adoption risks of open source software.
A Joint Working Group was established and continues to plan for the merger. This has motivated sharing data and analyses among the two organizations.
These charts were developed from the exchanged data. They provide summary visual representations of the activities of the two organizations. The purpose is to provide some insight into the two organizations that is difficult may be difficult to see in the some ten detailed spreadsheets.
In the document you will see data from ESUP Portail, a French collaboration that began using Jasig�s uPortal and CAS and then supplemented this use with software products subsequently developed by Jasig.
Cautions There are some differences in the data because of differing data from the two organizations�different dates, different definitions, and different formats.
Also there are differences between the organizations now and the organizations the data represented then. For example the retention of Sakai members has increased since 2008 and the last Sakai conference income exceeded expenses. Jasig continues to increase use of its products among members.
The document�s organization follows the provided data. It begins with membership and revenue from member fees and continues with comparative financial data for calendar year 2010 and the use of the software products.

2 25 September 2011
Membership Membership data includes ESUP Portial data as well. ESUP Portial is a French organization that encourages and supportes the use of open source software in Europe. It represents the largest concentration of open source software in tertiary education. Software products from Jasig and Sakai and those of Duraspace (Fedora and DSpace) and Moodle have been implemented. Jasig�s CAS system is used by all of the universities for single signon and, increasingly for federated authentication.
In Figure 1 the focus is total membership in a geographic area. Figure 2 shows comparative membership for the three organizations.
Figure 1 � Total membership by geographic area, Jasig,Sakai and ESUP Portial
0
10
20
30
40
50
60
70
United States
Canada Europe Australia and Asia
Africa South America
2011 Members by Area
SakaiJasigESUP Portial
Figure 2 � Comparative membership by geographic area
3 25 September 2011
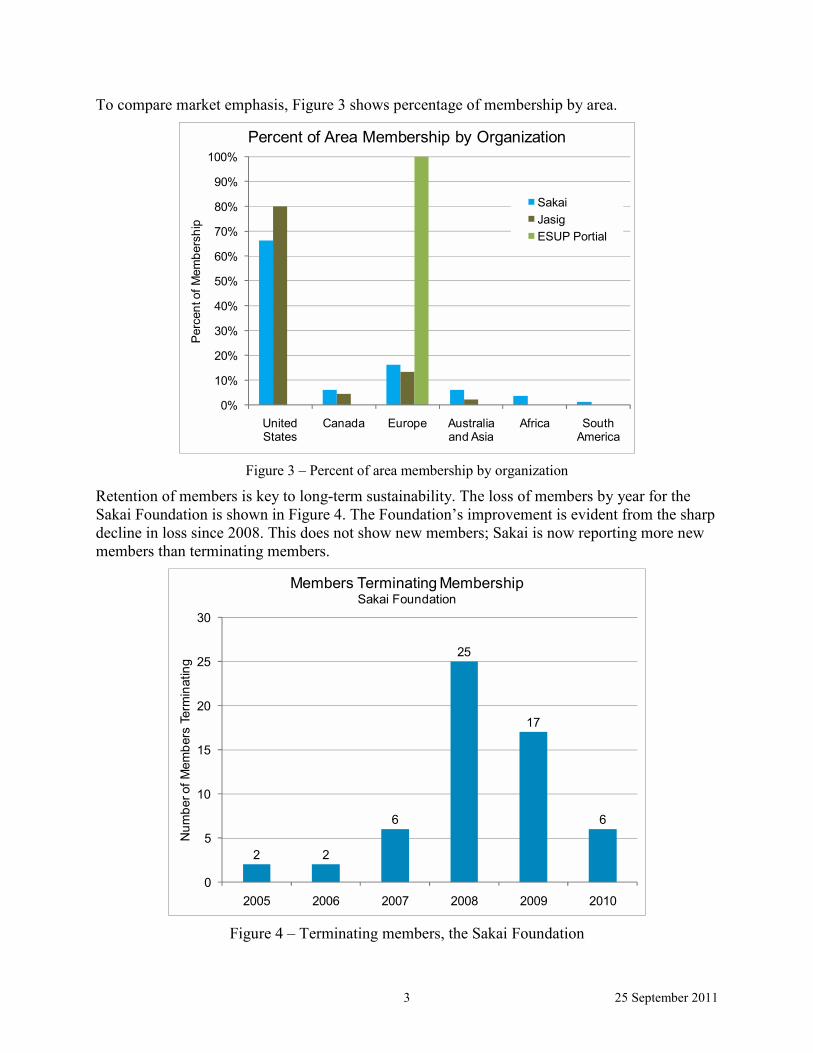
To compare market emphasis, Figure 3 shows percentage of membership by area.
0%
10%
20%
30%
40%
50%
60%
70%
80%
90%
100%
United States
Canada Europe Australia and Asia
Africa South America
Perc
ent o
f Mem
bers
hip
Percent of Area Membership by Organization
SakaiJasigESUP Portial
Figure 3 � Percent of area membership by organization
Retention of members is key to long-term sustainability. The loss of members by year for the Sakai Foundation is shown in Figure 4. The Foundation�s improvement is evident from the sharp decline in loss since 2008. This does not show new members; Sakai is now reporting more new members than terminating members.
2 2
6
25
17
6
0
5
10
15
20
25
30
2005 2006 2007 2008 2009 2010
Num
ber o
f Mem
bers
Ter
min
atin
g
Members Terminating MembershipSakai Foundation
Figure 4 � Terminating members, the Sakai Foundation

4 25 September 2011
Data for Jasig is shown in Figure 5 for both added and lost members.
0
1
2
3
4
5
6
7
8
9
10
2008 2009 2010 2011
Jasig Members Added and Lost
AddedLost
Data for 2011 is estimated based on June 2011 data. Figure 5 � Jasig Members added and lost
The estimated annual financial impact from lost membership for the Sakai Foundation is shown in Figure 6. This is based on the membership fees that would have been paid by the lost members.
15,000 20,000
55,000
245,000
144,000
55,000
$0
$50,000
$100,000
$150,000
$200,000
$250,000
$300,000
2005 2006 2007 2008 2009 2010
Annual Revenue Lost from Terminated MembershipsSakai Foundation
Figure 6 � Revenue lost from terminated membership, Sakai Foundation

5 25 September 2011
Revenue The historical annual revenue for Jasig is shown in Figure 7. The projection for 2011 assumes there are no members lost and no members added and that all members will pay the amount invoiced. The data includes notes of a few members who are declining to pay membership fees until the merger is complete.
These data do not include amounts earned from the conferences, payments by project sponsors that are paid either to Jasig or for services on behalf of Jasig.
$130,000
$183,000
$170,000
$182,500
$195,000
$0
$50,000
$100,000
$150,000
$200,000
$250,000
2007 2008 2009 2010 2011
Annual Amount Invoiced, Jasig
Data for 2011 assumes all members invoiced and projected to be invoiced will pay. Through May 2011 $118,500 has been collected,
Figure 7 � Actual and projected revenue from memberships fees.
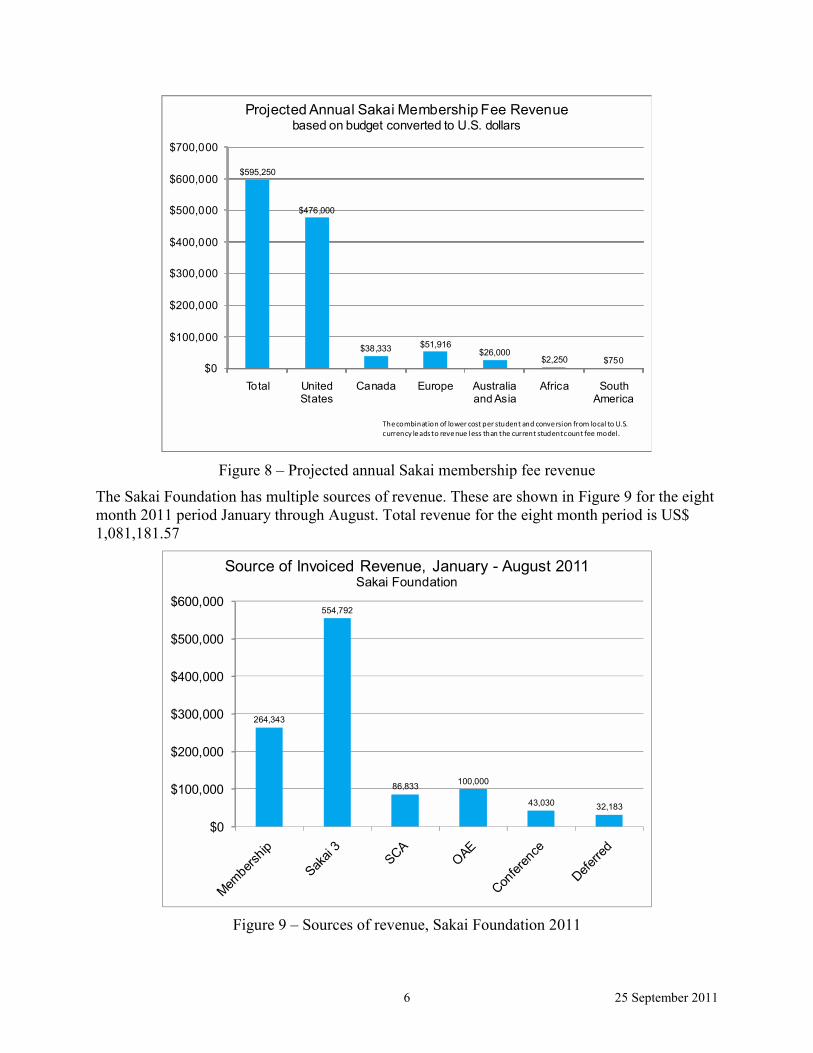
The Projected Annual Sakai Membership Fee Revenue is shown in Figure 8 by geographic area. This assumes the same number of members in the same geographic areas. This also assumes a new fee structure based on the budget of the college or university instead of headcount students.
The budget estimate is based on the number of students multiplied by the cost per student. This estimate is based on the OECD (Organization of Economic and Cooperate Development) recent publications based on 2008. The comparative cost per student is given in U.S. dollars. The conversion is based on currency exchange rates.
This leads to lower revenue for the Sakai Foundation; likely less than US$ 50,000 because of the few members from low-cost areas.
6 25 September 2011
$595,250
$476,000
$38,333 $51,916$26,000
$2,250 $750$0
$100,000
$200,000
$300,000
$400,000
$500,000
$600,000
$700,000
Total United States
Canada Europe Australia and Asia
Africa South America
Projected Annual Sakai Membership Fee Revenuebased on budget converted to U.S. dollars
Thecombination of lower cost per student and conversion from local to U.S. currency leads to revenue less than the current student count fee model.
Figure 8 � Projected annual Sakai membership fee revenue
The Sakai Foundation has multiple sources of revenue. These are shown in Figure 9 for the eight month 2011 period January through August. Total revenue for the eight month period is US$ 1,081,181.57
264,343
554,792
86,833 100,000
43,030 32,183
$0
$100,000
$200,000
$300,000
$400,000
$500,000
$600,000
Source of Invoiced Revenue, January - August 2011Sakai Foundation
Figure 9 � Sources of revenue, Sakai Foundation 2011

7 25 September 2011
This is also displayed as percentage of revenue in Figure 10. Sakai 3 was renamed Open Academic Environment (OAE). The data for the two was not combined in Figures 9 or 10 since they are accounted for separately in prior agreements on funding, and recorded this way in the accounting records. The combined total for the software with two names is US$ 654,791.60 and 60.5% of invoiced revenue for the eight month period..
24%
51%
8% 9%
4% 3%
0%
10%
20%
30%
40%
50%
60%
Membership Sakai 3 SCA OAE Conference Deferred
Source of Invoiced Revenue, January - August 2011Sakai Foundation
Figure 10 � Distribution of sources of revenue, Sakai Foundation 2011
The combination of sources of income is also shown in Figure 11 by month.. This pattern shows some of the complexity of revenue from membership, projects, and payment plans.
$0
$100,000
$200,000
$300,000
$400,000
Tota
l Inv
oice
d
Total Invoiced by Month, Calendar 2011Sakai Foundation
DeferredConferenceOAESCASakai 3Membership
Figure 11 � Total invoiced by month, Sakai Foundation 2011

8 25 September 2011
A combination of actual and projected revenue for the academic year July 2011 through June 2012 is shown in Figure 12. Some of the membership fees, represented by prepaid in this chart and by deferred in prior charts is the part of membership fees that have been paid for subsequent years. Often there is a discount; in this case the reduced amount for each year is shown. Prepaid applies to these payment plans showing the amount paid that extends their membership. The invoiced amount is an approximation of cash income.
$0
$20,000
$40,000
$60,000
$80,000
$100,000
$120,000
$140,000
$160,000
$180,000
Invoicing of the Current Sakai Members for Membership Fees July 2011 - June 2012
Prepaid - 3 yearInvoiced amount
There are 85 current members, one is terminating
Annual Total US $611,000Invoiced $491,000Prepaid $120,000
Figure 12 � Expected invoiced revenue academic year 2011-2012, Sakai Foundation

9 25 September 2011
Finances These charts are based on 2010 calendar year data from the U.S. Internal Revenue Service�s (IRS) Form 990 as filed. Preliminary data for the 2011 calendar year now appear to show improvement in the financial condition of both organizations. These charts provide a summary of the sources of income and expenses. These are also presented as percentages to identify different patterns for the two organizations.
Figure 13 shows the sources of income as found in the IRS Form 990 filings for the calendar year 2010. Subsequently there has been more emphasis on sponsored projects that rely on separate contributions.
65.3%
21.0%
0.2%2.7% 2.5% 4.3%
0.8%3.3%
49.9%
13.4%
0.0%
33.7%
2.7%0.0% 0.4% 0.0%
0%
10%
20%
30%
40%
50%
60%
70%Sources of Income Calendar Year 2010
Jasig
Sakai
Figure 13 - Sources of income, Jasig and Sakai 2010
The distribution of expenses by type is shown in Figure 14. There are some differences in the accounting for conferences. The expenses may include charged seminars, corporate contributions, and internal subsidies. The pattern of revenue and expenses will be significantly different for the subsequent calendar year because of project funding and organizational changes.

10 25 September 2011
0% 10% 20% 30% 40% 50% 60% 70% 80%
Conference expenses
Payroll and Staff Expenses
Travel
Equipment and Services
Bank and Service Fees
Professional expenses
Insurance
Dues and Subscriptions
Conference sponsorship
Miscellaneous
Infrastructure and Services
Marketing
Expenses Calendar Year 2010
Jasig
Sakai
Figure 14- Distribution of expenses, Jasig and Sakai 2010

11 25 September 2011
Product Use Jasig has data on the use of the Jasig software products by members. This is only a small fraction of users worldwide, but gives an insight into what is important to the members. The Jasig data also includes the use of Sakai software products. Sakai OAE is the renamed Sakai 3. Thirty nine Jasig members�76% of the 51 current members�use Jasig and Sakai software products.
0
5
10
15
20
25
30
35
40
45
Any product
CAS uMobile uPortal Bedework Sakai CLE
Sakai OAE
Num
ber o
f Use
rs
Software Product Use by Jasig Members
Figure 15 � Use of Jasig and Sakai products by Jasig Members
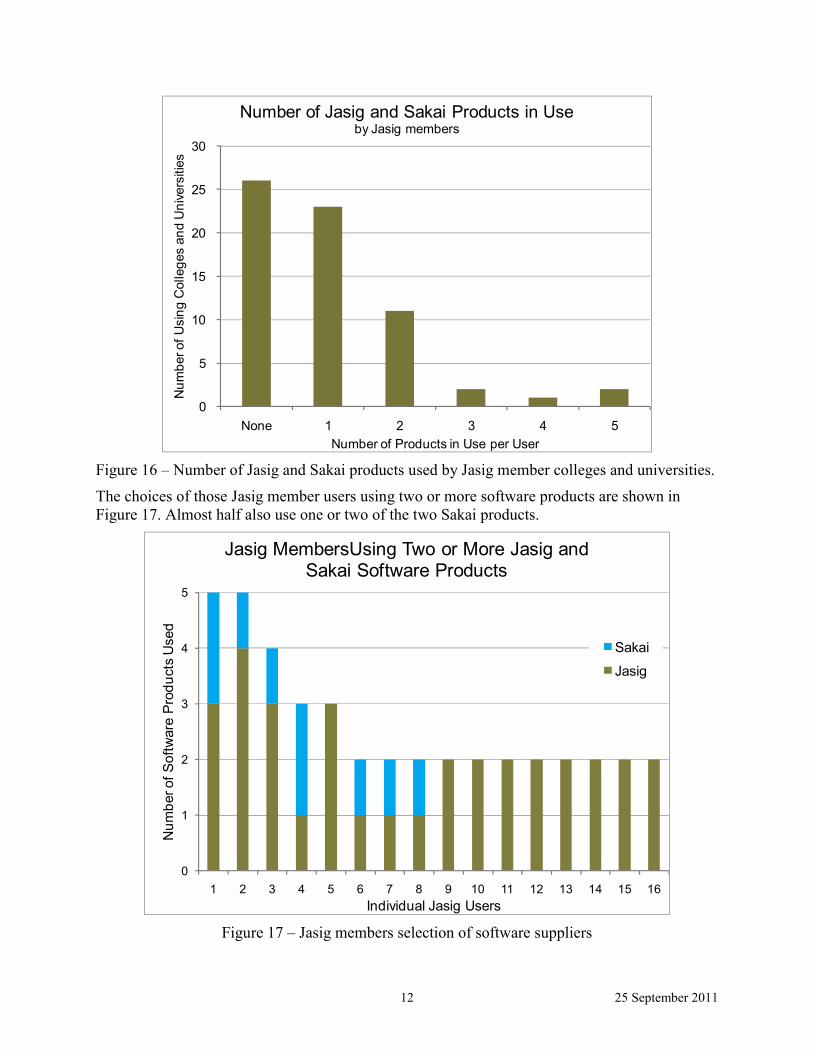
The number of combined Jasig and Sakai product in use by Jasig members is shown in Figure 16.
12 25 September 2011
0
5
10
15
20
25
30
None 1 2 3 4 5
Num
ber o
f Usi
ng C
olle
ges
and
Uni
vers
ities
Number of Products in Use per User
Number of Jasig and Sakai Products in Useby Jasig members
Figure 16 � Number of Jasig and Sakai products used by Jasig member colleges and universities.
The choices of those Jasig member users using two or more software products are shown in Figure 17. Almost half also use one or two of the two Sakai products.
0
1
2
3
4
5
1 2 3 4 5 6 7 8 9 10 11 12 13 14 15 16
Num
ber o
f Sof
twar
e P
rodu
cts
Use
d
Individual Jasig Users
Jasig MembersUsing Two or More Jasig and Sakai Software Products
Sakai
Jasig
Figure 17 � Jasig members selection of software suppliers

13 25 September 2011
The five top Jasig software users using three or more software products are listed in Figure 18.
0 1 2 3 4
Unicon
Yale University
Cornell University
New York University
University of CA/Berkeley
Number of Jasig Products Used
Jasig Members Using Three or More Products
Figure 18 � Jasig Members using three or more software products
Though dated, the Jasig website has a list of installation and the number of students, faculty, staff and others who are using the portal. This does not include data for ESUP-Portial. These are shown in Figure 19.
613,000
240,000
97,000
37,000 34,000 10,000 8,000 1,050
0
100,000
200,000
300,000
400,000
500,000
600,000
700,000
United States
United Kingdom
Canada China Switzerland Japan Spain Macedonia
Num
ber o
f Por
tal U
sers
-S
tude
nts,
facu
lty a
nd o
ther
s
Users served by uPortal by Country
Total of 1,040,050 users, for the 51 registered institutions providing data
Figure 19 � Number of individual users by country

14 25 September 2011
The number of installations is shown in Figure 20. Each installation is counted only once for a using institution.
5
2
01 1 1 1
3
7
39
0
5
10
15
20
25
30
35
40
CA CN FR JP MK ES SE CH UK US
Canada China France Japan Macedonia Spain Sweden Switzerland United Kingdom
United States
Registered Jasig uPortal Implementations By Country
Figure 20 � Number of uPortal installations by country
The number of installations is also given for geographic areas. These are shown in Figure 21.
44
13
3
0 0 00
5
10
15
20
25
30
35
40
45
North America Europe Asia South America Middle East Africa
Registered Jasig uPortal Installations by Area
Figure 21 � Number of installations by geographic area