about this laboratory handbooksep 29, 2011 · about this laboratory handbook welcome to earth...
TRANSCRIPT

ABOUT THIS LABORATORY HANDBOOKWelcome to Earth Science. You are about to embark on an exciting course of study to help you understand the workings of your home planet. Earth Science is an applied science. That means you will learn about your home using many different science disciplines. There will be physical science, geography, chemistry, and physics.
There are forty investigations in this book related to and intrinsically linked to the Physical Setting Earth Science. Each investigation is just that, a puzzle that must be solved with information from your knowledge of Earth Science.
Each investigation is followed by ten questions. Each question is more in depth than the previous one. All questions are to be answered in complete sentences. Single word answers do not fully explain your understanding of the material.
Terms to know for the Handbook:
Essential Question: What is this investigation about? Why are we conducting the experiment? An example of the essential question is “Why is the sky blue?”
Hypothesis: Hypo means less than and Thesis is a statement that must be proved. Therefore, a hypothesis is not quite a full theory. The hypothesis attempts to answer the essential question. An excellent format is the “If…then…because”.
“If the various qualities of the minerals are tested then the minerals can be identified because minerals have very specific qualities.”
Variables: There are two types of variables which are tested. The independent variable is the variable that is being manipulated. The dependent variable is the variable that changes as the result of the change in the independent variable. If you were conducting an experiment in the Living Environment on plant growth, the amount of water would be the independent variable because you control it. The plant growth would be the dependent variable. Time is a quality of the independent variable.
Free Response Questions: The free response questions are based on the results of your investigation as well as the pre-lab readings. Some questions call on your knowledge of Earth Science and your ability to read the Earth Science Reference Table.
The author:Rosemarie Sanders,Earth Science Teacher
Subject Area Representative, Earth Science forScience Teachers Association of New York State, Westchester Section
Earth Sc. Lab Bk MASTER 2010.ind3 3 9/29/2011 3:11:58 PM
Physical Setting Earth ScienceLaboratory Investigation Handbook
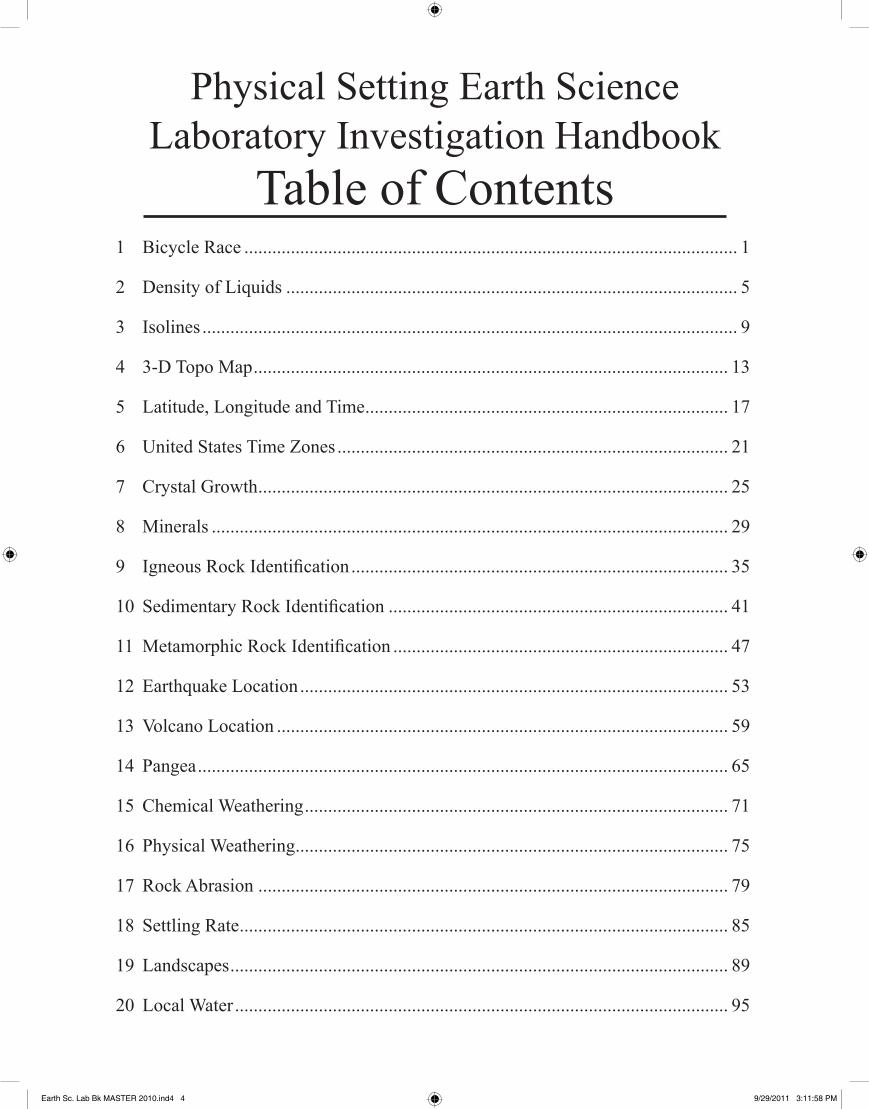
Table of Contents1 Bicycle Race .......................................................................................................... 1
2 Density of Liquids ................................................................................................. 5
3 Isolines ................................................................................................................... 9
4 3-D Topo Map ...................................................................................................... 13
5 Latitude, Longitude and Time .............................................................................. 17
6 United States Time Zones .................................................................................... 21
7 Crystal Growth ..................................................................................................... 25
8 Minerals ............................................................................................................... 29
9 IgneousRockIdentification ................................................................................. 35
10 SedimentaryRockIdentification ......................................................................... 41
11 MetamorphicRockIdentification ........................................................................ 47
12 Earthquake Location ............................................................................................ 53
13 Volcano Location ................................................................................................. 59
14 Pangea .................................................................................................................. 65
15 Chemical Weathering ........................................................................................... 71
16 Physical Weathering ............................................................................................. 75
17 Rock Abrasion ..................................................................................................... 79
18 Settling Rate ......................................................................................................... 85
19 Landscapes ........................................................................................................... 89
20 Local Water .......................................................................................................... 95
Earth Sc. Lab Bk MASTER 2010.ind4 4 9/29/2011 3:11:58 PM

21 Stream Beds ......................................................................................................... 99
22 GeologicProfiles ............................................................................................... 105
23 Geologic Calender ............................................................................................. 109
24 M & M Half Life Lab ........................................................................................ 113
25 Coriolis Effect .................................................................................................... 117
26 Atmospheric Pressure and Cyclones.................................................................. 121
27 Dewpoint and Humidity..................................................................................... 127
28 Clouds ................................................................................................................ 133
29 Cloud Height ...................................................................................................... 137
30 Station Models ................................................................................................... 141
31 Weather Map ...................................................................................................... 147
32 Hurricanes .......................................................................................................... 153
33 A Tale of Two Lighthouses ................................................................................ 159
34 Seasons .............................................................................................................. 167
35 Electromagnetic Spectrum ................................................................................. 173
36 Where is Our Sun? ............................................................................................. 181
37 Lunar Orbit and Phases ...................................................................................... 185
38 Tides and Time ................................................................................................... 189
39 Newton’s Laws .................................................................................................. 193
40 Kepler’s Laws .................................................................................................... 197
Reference Tables for Earth Science (2010 Edition) ................................................ 203
Physical Setting Earth ScienceLaboratory Investigation Handbook
Table of Contents
Earth Sc. Lab Bk MASTER 2010.ind5 5 9/29/2011 3:11:58 PM

LandscapesCopyright © 2010Topical Review Book Company
Page 89
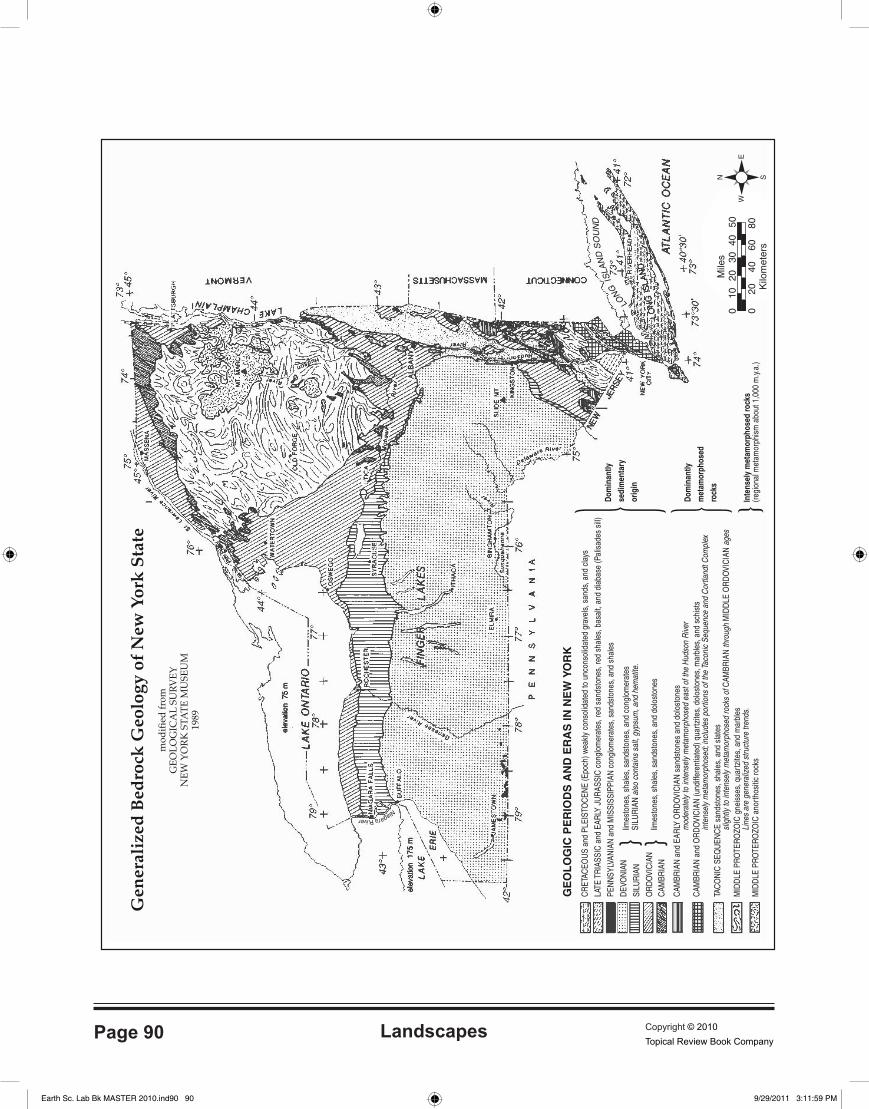
19 Landscapes A landscape is a region on Earth’s surface. The shapeand makeup of the landscape is formed by the climate, local bedrock, and human activities. The relief of land-scapes is described as mountains, plateaus and plains. In New York State, the landscape is not only determined by geology and climate but has also been deeply affected by the glaciers. When we look at the landscape regions of New York State, we must look to see the underlying geology. Mountainous regions have metamorphosed bedrock in New York State. What appear to be mountains may not, in fact, be mountains and areas that appear to be small foothills are the remains of once tall mountains. To truly determine the landscape region, we must look underneath the surface.
Objective:
The objective of this lab is to apply information on landscapes of New York State and to understand the topography of the state.
Essential Question:___________________________________________________________________________
___________________________________________________________________________
Hypothesis:___________________________________________________________________________
___________________________________________________________________________
Materials: • Colored pencils
Procedure:
1. In the following inquiry, compare the bedrock of various areas of New York State.
2. Compare the landscape regions based on the underlying bedrock.
3. On the Landscape Regions map on page 91, color the mountain regions red, the plateau regions green and the plains regions blue.
P.S./E. Sci.–June ’04 [6]
19 The cross section below shows rock layers thatunderwent crustal movement during an igneousintrusion in the Cretaceous Period.
Which statement best describes the cause of theridges shown?(1) The rock layers were evenly weathered.(2) Some rock layers were more resistant to
weathering and erosion.(3) The igneous intrusion flowed over the surface.(4) More deposition occurred at the ridge sites
after uplift.
20 The picture below shows a geological feature inthe Kalahari Desert of southwestern Africa.
Which process most likely produced the presentappearance of this feature?(1) wind erosion(2) volcanic eruption(3) earthquake vibrations(4) plate tectonics
21 Which group of organisms, some of which werepreserved as fossils in early Paleozoic rocks, arestill in existence today?(1) brachiopods (3) graptolites(2) eurypterids (4) trilobites
22 The diagram below shows the shadow cast by atelephone pole on March 21 at solar noon at alocation in New York State.
Which shadow was cast by the same telephonepole on June 21 at solar noon?
23 Which two New York State landscape regions areformed mostly of surface bedrock that is approxi-mately the same geologic age?(1) Manhattan Prong and Atlantic Coastal Plain(2) Erie-Ontario Lowlands and Adirondack
Mountains(3) Adirondack Mountains and Allegheny Plateau(4) Tug Hill Plateau and St. Lawrence Lowlands
( 2 ) ( 4 )
( 1 ) ( 3 )
Shadow Cast on March 21
Ridges
Igneous intrusion
NAME _________________________________
Earth Sc. Lab Bk MASTER 2010.ind89 89 9/29/2011 3:11:59 PM
LandscapesPage 90 Copyright © 2010Topical Review Book Company
Physical Setting/Earth Science Reference Tables — 2010 Edition 3
Gen
eral
ized
Bed
rock
Geo
logy
of N
ew Y
ork
Stat
em
odifi
ed fr
omG
EOLO
GIC
AL
SURV
EYN
EW Y
ORK
STA
TE M
USE
UM
1989
NiagaraRiver
GE
OL
OG
IC P
ER
IOD
S A
ND
ER
AS
IN N
EW
YO
RK
CR
ETAC
EOU
S an
d PL
EIST
OC
ENE
(Epo
ch) w
eakl
y co
nsol
idat
ed to
unc
onso
lidat
ed g
rave
ls, s
ands
, and
cla
ys
LATE
TR
IASS
IC a
nd E
ARLY
JU
RAS
SIC
con
glom
erat
es, r
ed s
ands
tone
s, re
d sh
ales
, bas
alt,
and
diab
ase
(Pal
isad
es s
ill)
PEN
NSY
LVAN
IAN
and
MIS
SISS
IPPI
AN c
ongl
omer
ates
, san
dsto
nes,
and
sha
les
DEV
ON
IAN
limes
tone
s, s
hale
s, s
ands
tone
s, a
nd c
ongl
omer
ates
SILU
RIA
NSI
LUR
IAN
also
con
tain
s sa
lt, g
ypsu
m, a
nd h
emat
ite.
OR
DO
VIC
IAN
limes
tone
s, s
hale
s, s
ands
tone
s, a
nd d
olos
tone
sC
AMBR
IAN
CAM
BRIA
N a
nd E
ARLY
OR
DO
VIC
IAN
san
dsto
nes
and
dolo
ston
es
mod
erat
ely
to in
tens
ely
met
amor
phos
ed e
ast o
f the
Hud
son
Rive
rC
AMBR
IAN
and
OR
DO
VIC
IAN
(und
iffer
entia
ted)
qua
rtzite
s, d
olos
tone
s, m
arbl
es, a
nd s
chis
tsin
tens
ely
met
amor
phos
ed; i
nclu
des
porti
ons
of th
e Ta
coni
c Se
quen
ce a
nd C
ortla
ndt C
ompl
exTA
CO
NIC
SEQ
UEN
CE
sand
ston
es, s
hale
s, a
nd s
late
ssl
ight
ly to
inte
nsel
y m
etam
orph
osed
rock
s of
CAM
BRIA
Nth
roug
hM
IDD
LE O
RD
OVI
CIA
N a
ges
MID
DLE
PR
OTE
RO
ZOIC
gne
isse
s, q
uartz
ites,
and
mar
bles
Line
s ar
e ge
nera
lized
stru
ctur
e tre
nds.
MID
DLE
PR
OTE
RO
ZOIC
ano
rthos
itic
rock
s
} }
}} }Dom
inan
tly
sedi
men
tary
orig
in
Dom
inan
tly
met
amor
phos
ed
rock
s
LON
GIS
LAN
DS
OU
ND
Inte
nsel
y m
etam
orph
osed
rock
s(re
gion
al m
etam
orph
ism
abo
ut 1
,000
m.y.
a.)
N S
WE
020
40
020
4060
80K
ilom
eter
s
Mile
s10
3050
Earth Sc. Lab Bk MASTER 2010.ind90 90 9/29/2011 3:11:59 PM

LandscapesCopyright © 2010Topical Review Book Company
Page 91
2 Earth Science Reference Tables — 2001 Edition
TU
GH
ILL
PLA
TE
AU
TH
EC
AT
SK
ILLS
ALL
EG
HE
NY
PLA
TE
AU
LAK
EE
RIE
LAK
E O
NTA
RIO
AD
IRO
ND
AC
KM
OU
NTA
INS
ST. L
AWR
ENC
E LO
WLA
ND
S
ER
IE–O
NTA
RIO
LO
WLA
ND
S(P
LAIN
S)
GR
EN
VIL
LE
PR
OV
INC
E(H
IGH
LA
ND
S)
NEWENGLAND P
ROVINCE
(HIG
HLANDS)
INT
ER
IOR
LO
WL
AN
DS
TACONIC MOUNTAINS
NEWARK
LOWLANDS
HU
DS
ON
HIG
HLA
ND
S
MA
NH
ATTA
N P
RO
NG
CHAMPLAINLOWLANDS
Gen
eral
ized
Lan
dsca
pe R
egio
ns o
f N
ew Y
ork
Stat
e
APPALACHIAN
PLATE
AU(U
PLA
ND
S)
ATLA
NTI
CC
OA
STA
LP
LAIN
HUDSON–MOHAWKLOWLANDS
KEY
Maj
or G
eogr
aphi
c P
rovi
nce
Bou
ndar
y
Land
scap
e R
egio
n B
ound
ary
Sta
te B
ound
ary
Inte
rnat
iona
l Bou
ndar
y
N
Earth Sc. Lab Bk MASTER 2010.ind91 91 9/29/2011 3:11:59 PM

LandscapesPage 92 Copyright © 2010Topical Review Book Company
Observations:
1. Describe the type of bedrock in a mountainous region.
________________________________________________________________________
________________________________________________________________________
________________________________________________________________________
2. Describe the stream valleys associated with mountains.
________________________________________________________________________
________________________________________________________________________
________________________________________________________________________
3. Describe the type of bedrock in a plateau region.
________________________________________________________________________
________________________________________________________________________
________________________________________________________________________
4. Describe the stream valleys associated with plateaus.
________________________________________________________________________
________________________________________________________________________
________________________________________________________________________
5. Describe the type of bedrock in a plains region.
________________________________________________________________________
________________________________________________________________________
________________________________________________________________________
6. Describe the stream valleys associated with plains.
________________________________________________________________________
________________________________________________________________________
________________________________________________________________________
Earth Sc. Lab Bk MASTER 2010.ind92 92 9/29/2011 3:12:00 PM

LandscapesCopyright © 2010Topical Review Book Company
Page 93
7. WhatgeologicfeatureswouldonefindinamountaininNewYorkState?
________________________________________________________________________
________________________________________________________________________
8. Explain why the term Catskill Mountains is misleading.
________________________________________________________________________
________________________________________________________________________
________________________________________________________________________
________________________________________________________________________
________________________________________________________________________
________________________________________________________________________
________________________________________________________________________
9. IsNewYorkamountainousstate?Explainyouranswer.
________________________________________________________________________
________________________________________________________________________
________________________________________________________________________
10. Describe the landscape region where you live. Explain and defend your statement citing your local bedrock. ________________________________________________________________________
________________________________________________________________________
________________________________________________________________________
________________________________________________________________________
________________________________________________________________________
________________________________________________________________________
________________________________________________________________________
________________________________________________________________________
________________________________________________________________________
________________________________________________________________________
Earth Sc. Lab Bk MASTER 2010.ind93 93 9/29/2011 3:12:00 PM

A Tale of Two LighthousesCopyright © 2010Topical Review Book Company
Page 159
33 A Tale of Two Lighthouses The coastal areas of oceans have features that are created by wave action. The beaches are accumulations of sediment deposited by this wave action. Long Island is the largest island in the contiguous United States. It lies in southeastern New York State. It is also a very young island. It was formed during glacial period as terminal moraines. Long Island was created in two depositional events. What is nowLong IslandSoundwasa flooded valleywhensea levels rose after the melting of the last ice age. The island is still undergoing changes today. Recall from deposition and erosion, that when depositional forces and erosional forces occur at roughly equal rates, it is called dynamic equilibrium. This means that no one force is greater than the other and so the landform is more or less unchanged. In this investigation we will look at two concerns on the Island. The Montauk Lighthouse and Fire Island Lighthouse were both built over one-hundred years ago. Today, their relation to the oceanismuchdifferentthenwhentheywerefirstbuilt.
Objective:
The objective of this investigation is to gain an understanding of coastal processes.
Essential Question: ______________________________________________________________________________
___________________________________________________________________________
Hypothesis: _____________________________________________________________________________
___________________________________________________________________________
Materials: • Coastline Chart • Pencil
NAME _________________________________
Earth Sc. Lab Bk MASTER 2010.ind159 159 9/29/2011 3:12:00 PM

A Tale of Two LighthousesPage 160 Copyright © 2010Topical Review Book Company
Pre-lab:
First, let’s look at the formation of the coastline. This diagram depicts the Atlantic Coastal Plain.
a. Referring to your Earth Science Reference Table on page 205, whattypeofbedrockwouldyouexpecttoseeinthisarea?_________________________
b. Looking at the area labeled Harbor Hill Moraine, what dothinkthematerialinthemoraineismadefrom?________________________________
c. Intheoutwashplain,whatwouldyouexpecttheparticlesizetobe? _________________________________________________________________
d. In the image below of Long Island, there appears to be two areas of deposition that created this island. Looking at the east end, label the Harbor Hill and the Ronkonkoma Moraine.
Barrier islands are islands that form along coastal regions where there is a lot of sand and a passive continental margin. Padre Island is the longest in the United States, over 112 miles long. As seen to the left, barrier islands are long narrowislands that create a protected water area behind them. New York’s Fire Island is also a barrier island and part of the subject of this investigation. The process of erosion and deposition is called littoral drift. In south facing beaches, littoral drift shifts the sand to the west.
Base your answers to questions 48 through 50 on the map of Long Island, New York. AB, CD, EF, and GHare reference lines on the map.
48 Which agent of erosion transported the sediments that formed the moraines shownon the map?(1) water (3) ice(2) wind (4) mass movement
49 The cross section below represents the sediments beneath the land surface along oneof the reference lines shown on the map.
Along which reference line was the cross section taken?(1) AB (3) EF(2) CD (4) GH
50 A major difference between sediments in the outwash and sediments in the morainesis that the sediments deposited in the outwash are(1) larger (3) more angular(2) sorted (4) older
RonkonkomaMoraine
Harbor HillMoraine
OutwashOutwash
Map
A
B
C
AtlanticOcean
Long Island Sound
Harbor Hill Moraine
Outwash
E HG
FN
OutwashDRonkonkoma Moraine
P.S./E. Sci.–June ’08 [16]
Earth Sc. Lab Bk MASTER 2010.ind160 160 9/29/2011 3:12:00 PM

A Tale of Two LighthousesCopyright © 2010Topical Review Book Company
Page 161
Wave Action Waves are the driving force of the erosional – depositional action of the shoreline. Waves are energy that passes through the ocean. Like other waves, these waves can be refracted and reflected. As waves driven by wind approach the shore, the wave energytouches bottom, creating a frictional force. The refraction of the waves at the shoreline focuses wave energy. In the picture below, locate the arrows along the bottom of the picture. Above each arrow, draw another arrow up to the next waveform. The arrow must be perpendicular to thewaveform.Thefirstrowarrowshavebeendoneforyou.Thearrowswill revealapatternin the waveform. Observe the pattern it creates and answer the questions below.
a. Whereistheenergyfocused?
________________________________________________________________________
b. Whatdoyouthinkishappeningatthepoint(s)ofenergyfocus?
________________________________________________________________________
________________________________________________________________________
c. Wheredidthewavesrefractfrom?
________________________________________________________________________
d. Whatdoyouthinkishappeningatthepoint(s)ofrefraction?
________________________________________________________________________
________________________________________________________________________
e. Whatwilleventuallyhappentotheshoreline?
________________________________________________________________________
________________________________________________________________________
↑ ↑ ↑ ↑ ↑ ↑ ↑ ↑ ↑ ↑
Bay Bay
Headland
Land Mass
Ocean
Earth Sc. Lab Bk MASTER 2010.ind161 161 9/29/2011 3:12:00 PM

A Tale of Two LighthousesPage 162 Copyright © 2010Topical Review Book Company
Erosion
President George Washington commissioned the Montauk Lighthouse to be built in 1796, The builders knew that Montauk Point was prone to erosion. The original lighthouse was built 300 ft from the sea. 200 years later, the lighthouse stands only 100 feet from the ocean. The lighthouse is in the far eastern end of this point of land. That’s 200 feet of erosion in two hundred years. Look at the image below.
a. Storms are more severe in the winter. Winter storms are called nor’easters. They are in the AtlanticOcean.Wherearethewindsofthewinterstormsblowingfrom?
________________________________________________________________________
________________________________________________________________________
b. Using your knowledge about points of focus, draw an arrow on the image above that most likely would be the point of focus on this land mass.
c. Explain why Montauk is having a problem with erosion.
________________________________________________________________________
________________________________________________________________________
d. Whatwouldhappenifthewinterwavesweretoapproachfromthesouthwest?
________________________________________________________________________
________________________________________________________________________
e. Give an example of what can be done to slow the erosion.
________________________________________________________________________
________________________________________________________________________
Long Island Sound
Long Island
CONN.Montauk Lighthouse
(exaggerated)
ATLANTICOCEAN
Earth Sc. Lab Bk MASTER 2010.ind162 162 9/29/2011 3:12:01 PM

A Tale of Two LighthousesCopyright © 2010Topical Review Book Company
Page 163
Base your answers to questions 45 through 48 on the diagram below. The arrows show the direction inwhich sediment is being transported along the shoreline. A barrier beach has formed, creating a lagoon(a shallow body of water in which sediments are being deposited). The eroded headlands are composed of diorite bedrock. A groin has recently been constructed. Groins are wall-like structures built into the water perpendicular to the shoreline to trap beach sand.
45 The groin structure will change the pattern of deposition along the shoreline, initially causing the beach to become(1) wider on the western side of the groin (3) narrower on both sides of the groin(2) wider on the eastern side of the groin (4) wider on both sides of the groin
46 Which two minerals are most likely found in the beach sand that was eroded from the headlands?(1) quartz and olivine (3) potassium feldspar and biotite(2) plagioclase feldspar and amphibole (4) pyroxene and calcite
47 The sediments that have been deposited by streams flowing into the lagoon are mostlikely(1) sorted and layered (3) unsorted and layered(2) sorted and not layered (4) unsorted and not layered
48 Which event will most likely occur during a heavy rainfall?(1) Less sediment will be carried by the streams.(2) An increase in sea level will cause more sediments to be deposited along the
shoreline.(3) The shoreline will experience a greater range in tides.(4) The discharge from the streams into the lagoon will increase.
N
Wetlands
Lagoon
Ocean
Streams carryingsediments
Sedimentsdeposited inquiet water
Barrier beach
Sand depositedon beach and onseafloor
Groin
Beach
Erodedheadland
E
SW
P.S./E. Sci.–June ’09 [14]
Deposition
Waves approach the beach at the angle the wind is blowing them. Sea breezes bring the waves’ upwash onto the shore following the waves’ momentum. The backwash to the sea is straight back. This ongoing movement is called swash. As waves approach at an angle, the swash is in a zigzag pattern. This moves sediment. The movement that takes place in a motion that moves parallel to the shore is called longshore current. The movement of sediment is called littoral drift.
Look at Fire Island. Fire Island is a barrier island to the south of Long Island. It protects the estuary of the Great South Bay. The lighthouse was built in 1858 next to the Fire Island Inlet at the western most section of Fire Island. Today, it is located 6 miles away from the Fire Island Inlet. When strong winter winds blow from the east, they often take beach with them but in this case, they leave behind winter sand; a reddish purple sand that gets deposited during winter storms. It is made of garnets, magnetite and some quartz. In the summer, quartzite and dolomite materials are left behind.
a. Howfastistheisland“moving”?
________________________________________________________________________
________________________________________________________________________
Longshorecurrent
Great South BayGreat South Bay
ATLANTIC OCEAN
Fire Island
ATLANTIC OCEAN
Fire Island
Fire Island 1858 Fire Island Today
Earth Sc. Lab Bk MASTER 2010.ind163 163 9/29/2011 3:12:02 PM
A Tale of Two LighthousesPage 164 Copyright © 2010Topical Review Book Company
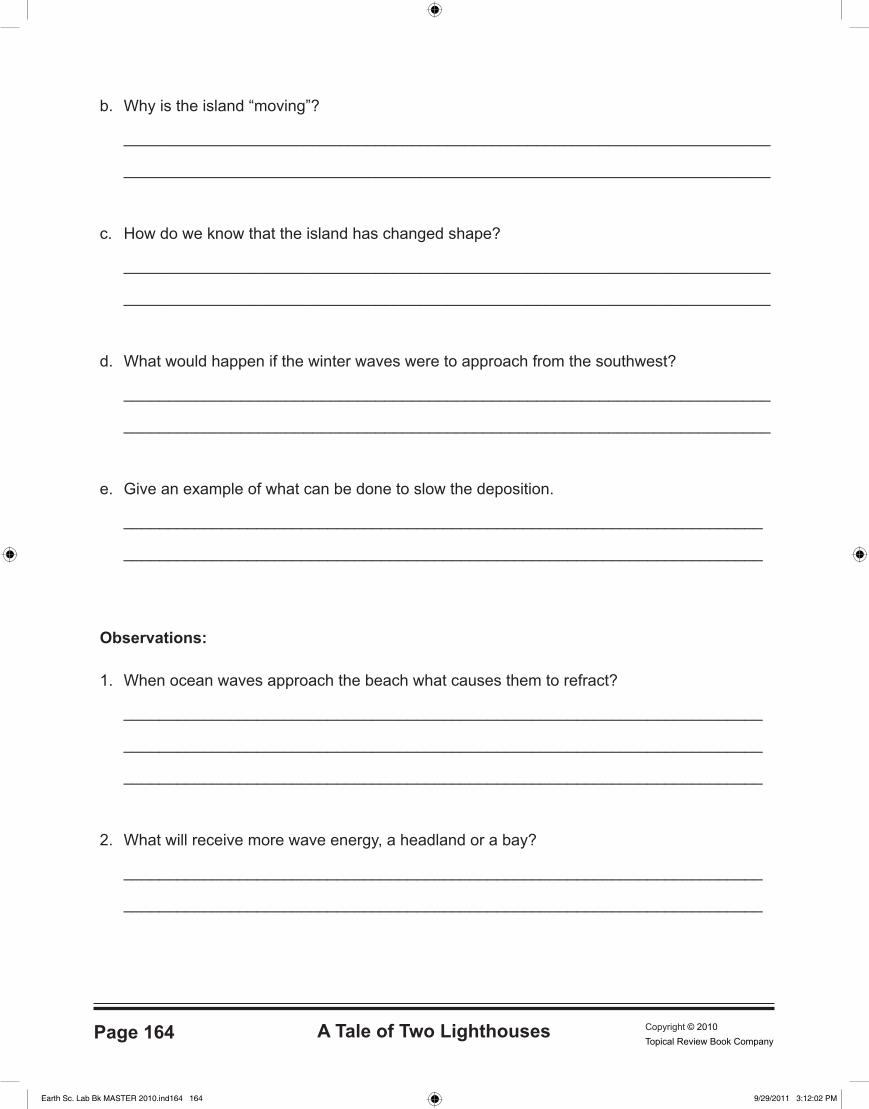
b. Whyistheisland“moving”?
________________________________________________________________________
________________________________________________________________________
c. Howdoweknowthattheislandhaschangedshape?
________________________________________________________________________
________________________________________________________________________
d. Whatwouldhappenifthewinterwavesweretoapproachfromthesouthwest?
________________________________________________________________________
________________________________________________________________________
e. Give an example of what can be done to slow the deposition.
________________________________________________________________________
________________________________________________________________________
Observations:
1. Whenoceanwavesapproachthebeachwhatcausesthemtorefract?
________________________________________________________________________
________________________________________________________________________
________________________________________________________________________
2. Whatwillreceivemorewaveenergy,aheadlandorabay?
________________________________________________________________________
________________________________________________________________________
Earth Sc. Lab Bk MASTER 2010.ind164 164 9/29/2011 3:12:02 PM

A Tale of Two LighthousesCopyright © 2010Topical Review Book Company
Page 165
3. Whywillthisareareceivemoreenergy?
________________________________________________________________________
________________________________________________________________________
4. Ifdepositionalforceswereequalwitherosionalforces,whatwouldwecallthat?
________________________________________________________________________
5. WhyisMontaukLighthouseindangeroffallingintotheocean?
________________________________________________________________________
________________________________________________________________________
6. WhichforceismoreprevalentinMontauk,erosionordeposition?Why?
________________________________________________________________________
________________________________________________________________________
________________________________________________________________________
________________________________________________________________________
7. WheredoesthewintersandatFireIslandcomefrom?
________________________________________________________________________
________________________________________________________________________
8. Ifunchecked,whatwillhappentoFireIslandInlet?
________________________________________________________________________
________________________________________________________________________
________________________________________________________________________
________________________________________________________________________
________________________________________________________________________
Earth Sc. Lab Bk MASTER 2010.ind165 165 9/29/2011 3:12:02 PM

A Tale of Two LighthousesPage 166 Copyright © 2010Topical Review Book Company
9. Looking at the bedrock of Long Island and the Atlantic Coastal Plain, explain the role of erosional and depositional forces that created and are shaping the island.
________________________________________________________________________
________________________________________________________________________
________________________________________________________________________
________________________________________________________________________
________________________________________________________________________
________________________________________________________________________
________________________________________________________________________
________________________________________________________________________
________________________________________________________________________
10. Describe what changes may happen to this region of New York State.
________________________________________________________________________
________________________________________________________________________
________________________________________________________________________
________________________________________________________________________
________________________________________________________________________
________________________________________________________________________
________________________________________________________________________
________________________________________________________________________
________________________________________________________________________
________________________________________________________________________
Earth Sc. Lab Bk MASTER 2010.ind166 166 9/29/2011 3:12:02 PM

Electromagnetic SpectrumCopyright © 2010Topical Review Book Company
Page 173
35 Electromagnetic Spectrum Light is a form of energy visible to the human eye that is radiated by moving charged particles. Scientists have learned through experimentation that light behaves like a particle at some times and like a wave at other times. The particle features are called photons. When light refracts, or bends slightly as it passes around a corner, it shows wavelike behavior. The waves associated with light are called electromagnetic waves. They consist of changing electric and magnetic fields. Light has many qualities, including energy andwavelength that cannot be seen by human eyes.
Objective:
The objective of this lab is to gain an understanding of the properties of the electromagnetic spectrum.
Essential Question: _____________________________________________________________________________
___________________________________________________________________________
Hypothesis: _____________________________________________________________________________
___________________________________________________________________________
Materials: • Spectroscope • “Ultraviolet Black” Light • UV Security Ink • Index Cards • Shadow Box • Infrared Imaging Device • Laser Pointer (Check with local Fire Department)
• Hair Spray • Mirror • Electromagnetic Spectrum on back cover • Slinky
15 The diagram below shows a greenhouse.
What is the primary function of the clear glass ofthe greenhouse?(1) The glass reduces the amount of insolation
entering the greenhouse.(2) The glass allows all wavelengths of radiation
to enter and all wavelengths of radiation toescape.
(3) The glass allows short wavelengths of radia-tion to enter, but reduces the amount of long-wavelength radiation that escapes.
(4) The glass allows long wavelengths of radiationto enter, but reduces the amount of short-wavelength radiation that escapes.
16 The cross section below shows the prevailingwinds that cause different climates on the wind-ward and leeward sides of this mountain range.
Compared to the climate conditions on the lee-ward side of this mountain range, the conditionson the windward side are usually(1) cooler and wetter(2) cooler and drier(3) warmer and wetter(4) warmer and drier
17 The California Ocean Current, which flows alongthe west coast of North America, is a (1) cool current, flowing north(2) cool current, flowing south(3) warm current, flowing north(4) warm current, flowing south
18 Which change at a particular location in a streamusually causes more sediments to be deposited atthat location?(1) decrease in stream velocity(2) decrease in stream width(3) increase in stream slope(4) increase in stream discharge
19 Rocks are classified as igneous, sedimentary, ormetamorphic based primarily on their(1) texture(2) crystal or grain size(3) method of formation(4) mineral composition
20 The internal atomic structure of a mineral mostlikely determines the mineral’s(1) color, streak, and age(2) origin, exposure, and fracture(3) size, location, and luster(4) hardness, cleavage, and crystal shape
21 How are the minerals biotite mica and muscovitemica different?(1) Biotite mica is colorless, but muscovite mica
is not.(2) Biotite mica contains iron and/or magnesium,
but muscovite mica does not.(3) Muscovite mica scratches quartz, but biotite
mica does not.(4) Muscovite mica cleaves into thin sheets, but
biotite mica does not.
22 Which three minerals are most commonly foundin the igneous rock granite?(1) amphibole, calcite, and hematite(2) amphibole, biotite mica, and gypsum(3) plagioclase feldspar, pyroxene, and olivine(4) plagioclase feldspar, potassium feldspar, and
quartz
OceanMountain range
Prevailingwind
Windward side Leeward side
Greenhouse
InsolationClear glass
P.S./E. Sci.–Aug. ’04 [4]
NAME _________________________________
Earth Sc. Lab Bk MASTER 2010.ind173 173 9/29/2011 3:12:02 PM

Electromagnetic SpectrumPage 174 Copyright © 2010Topical Review Book Company
Procedure:
Follow the directions listed for each station. With your lab group, go to each station and perform the activity as outlined. You do not need to go in order, but complete all stations.
Under no circumstances are you to look directly into any light source!
High energy ← → Low Energy Shorter wavelength ← → Longer wavelength
Station One: Using the spectroscope, observe different light sources. Using your colored pencils, color in the space provided the colors you observed.
Colors observed (indicate if you cannot see all colors)
1. Sunlight
2. Fluorescent light
3. Incandescent light
Observe:
Compare and contrast the three light sources that you observed.
________________________________________________________________________
________________________________________________________________________
________________________________________________________________________
________________________________________________________________________
________________________________________________________________________
________________________________________________________________________
Gamma rays
X rays
Ultraviolet Infrared
Microwaves
Radio waves
Visible light
Violet Blue Green Yellow Orange Red
Decreasing wavelength Increasing wavelength
(Not drawn to scale)
Electromagnetic Spectrum
DRY
60° SWET
DRY
S.E.
N.W.Winds
30° S
0°
60° N
30° N
WET
DRY
S.E.Winds
N.E.Winds
N.E.
S.W.Winds
DRY
Tropopause
Polar front
Polar front jet stream
Subtropicaljet streams
Polar front jet stream
WET
Sea Level
Alt
itu
de
Temperature Zones
Mesopause
Mesosphere
Stratopause
Stratosphere
Troposphere
Temperature(°C)
–100° 0° 100°–90° –55° 15°
Pressure(atm)
Atmospheric Pressure
0 20 40
Concentration(g/m3)
WaterVapor
km mi
Thermosphere(extends to 600 km)
0 1.0
40 25
80 50
120 75
140 100
0 0
Tropopause
14 Physical Setting/Earth Science Reference Tables — 2010 Edition
Planetary Wind and MoistureBelts in the Troposphere
The drawing on the right shows the locations of the belts near the time of anequinox. The locations shift somewhatwith the changing latitude of the Sun’s vertical ray. In the Northern Hemisphere,the belts shift northward in the summerand southward in the winter.
(Not drawn to scale)
Selected Properties of
Earth’sAtmosphere
Earth Sc. Lab Bk MASTER 2010.ind174 174 9/29/2011 3:12:02 PM

Electromagnetic SpectrumCopyright © 2010Topical Review Book Company
Page 175
Infer:
Based on your knowledge of the electromagnetic spectrum, what is the cause of these differences,ifany?
________________________________________________________________________
________________________________________________________________________
________________________________________________________________________
Station Two: Place the index card, given by your teacher, under the Ultraviolet light in the light box. Read it.
Observe:
WhatdoyouseewithUVthatyoucan’tseewithvisiblelight?
________________________________________________________________________
________________________________________________________________________
________________________________________________________________________
Infer:
Based on your knowledge of the electromagnetic spectrum, what is the cause of these differences,ifany?
________________________________________________________________________
________________________________________________________________________
________________________________________________________________________
Station Three: Infrared imaging. Your teacher will assist with this station.
Astudentwalksinstockingfeetonthefloor.Findfootsteps.Whatdoyousee?
________________________________________________________________________
________________________________________________________________________
Lookatastudentwearingglassesand/orbraces.Whatdoyousee?
________________________________________________________________________
________________________________________________________________________
________________________________________________________________________
Earth Sc. Lab Bk MASTER 2010.ind175 175 9/29/2011 3:12:03 PM

Electromagnetic SpectrumPage 176 Copyright © 2010Topical Review Book Company
Station Four: Use the back page of this lab book and place a slinky at the edge of the Visible Light Spectrum. Grasp both ends of the slinky so that a small portion of the slinky is on the ruled edge. With your left hand aligned to the beginning of the centimeter ruler, have the coils of the slinky spread so that each coil is 1 cm apart.
With your right hand on 10 cm mark.
1. Pull your right hand to the 25 cm mark.
a. Didyourrighthandgotowardorawayfromyourlefthand?____________________ b. Record any changes in the wavelength.
___________________________________________________________________ c. Whatportionofthevisiblespectrumdidthecolorshiftto?
____________________________________________________________________
Put your right hand back to the 10 cm mark.
2. Push your right hand to the 5 cm mark.
a. Didyourrighthandgotowardorawayfromyourlefthand?____________________
b. Record any changes in the wavelength.
___________________________________________________________________
c. Whatportionofthevisiblespectrumdidthecolorshiftto?
___________________________________________________________________
Station Five: Reflection Aim laser pointer at a mirror. Spray hairspray about 15 cm above, not at the mirror, parallel to table. Move the laser pointer at different angles to mirror. Observe results.
________________________________________________________________________
________________________________________________________________________
Infer:
We know that in every energy transaction, energy is lost in the form of heat. Does reflectedlighthavethesameenergyasinsolation?
________________________________________________________________________
________________________________________________________________________
________________________________________________________________________
Earth Sc. Lab Bk MASTER 2010.ind176 176 9/29/2011 3:12:03 PM

Electromagnetic SpectrumCopyright © 2010Topical Review Book Company
Page 177
Station Six: Research
Use the internet to answer the following questions. Some suggested sites are listed below. http://science.nasa.gov/headlines/y2004/07jul_bluemoon.htm?list793613 http://www.gi.alaska.edu/ScienceForum/ASF8/861.html http://www.sciencemadesimple.com/sky_blue.html
1. Whatistheparticlesizeofmaterialintheatmospherethatscattersredandyellowlight?
________________________________________________________________________
2. Whatisthewavelengthrangethatisnotscatteredbytheseparticles?
________________________________________________________________________
3. If we know that the longer wavelengths of the visible spectrum pass readily though the atmosphere,whatarethecolorsthatgetscatteredintheatmosphere?
________________________________________________________________________
________________________________________________________________________
4. Whatisthescatteringcalled?
________________________________________________________________________
5. Whyistheskyblue?
________________________________________________________________________
________________________________________________________________________
Earth Sc. Lab Bk MASTER 2010.ind177 177 9/29/2011 3:12:03 PM

Electromagnetic SpectrumPage 178 Copyright © 2010Topical Review Book Company
Directions: Use the Electromagnetic Spectrum Chart below to answer questions 1-3.
Observations:
1. WhatisthewavelengthrangeofX-rays?
________________________________________________________________________
2. Whatistheapproximaterangeofwavelengthsofvisiblelight?
________________________________________________________________________
3. Whichhasalongerwavelength,ultravioletraysorinfraredrays?
________________________________________________________________________
4. What is the fundamental difference in the properties of the various light groups on the ElectromagneticSpectrum?
________________________________________________________________________
________________________________________________________________________
________________________________________________________________________
14 Earth Science Reference Tables — 2001 Edition
30° N
60° N
60° S
30° S
0°
S.W.WINDS
DRY
DRY
WETN.E.
N.E. WINDS
S.E.WINDS
WET
DRY
WET
DRYS.E.
N.W.WINDS
Polar Front
SubtropicalJet Streams
Tropopause
Polar Front Jet Stream
Polar Front Jet Stream
Planetary Wind and Moisture Belts in the Troposphere
km 150
100
50
0
75
50
25
0
mi
Sea Level
Altitude
Temperature Zones
Thermosphere
Mesopause
Mesosphere
Stratopause
Stratosphere
TropopauseTroposphere
Temperature (°C)
–100° 0° 100°–90° –55° 15° 10
–4
10–3
10–2
10–1
10 0
Pressure (atm)
Atmospheric Pressure
0 20 40
Concentration(g/m3)
WaterVapor
Decreasing Wavelength
10010–10
4.0×
10–5
10–9 10–8 10–7 10–6 10–5 10–4 10–3 10–2 10–1 101 102 103
0.00
0,00
0,00
0,1
0.00
0,00
0,00
1
0.00
0,00
0,01
0.00
0,00
0,1
0.00
0,00
1
0.00
0,01
0.00
0,1
0.00
1
0.01
0.1
1.0
10 100
1,00
0
cm
cm
Increasing Wavelength
Gamma rays x rays
Ultraviolet Infrared
Visi
ble
Radio waves
Microwaves
Violet Blue Green Yellow Orange Red
Visible Light
4.3×
10–5
4.9×
10–5
5.3×
10–5
5.8×
10–5
6.3×
10–5
7.0×
10–5
Electromagnetic Spectrum
The drawing to the left showsthe locations of the belts nearthe time of an equinox. Thelocations shift somewhat withthe changing latitude of theSun’s vertical ray. In theNorthern Hemisphere, the beltsshift northward in summer andsouthward in winter.
Selected Properties of Earth’s Atmosphere
Earth Sc. Lab Bk MASTER 2010.ind178 178 9/29/2011 3:12:03 PM

Electromagnetic SpectrumCopyright © 2010Topical Review Book Company
Page 179
5. Referring to station four, question 1, what do you think happens to the light emitted when astronomersseestarsmovingawayfromthem?
________________________________________________________________________
________________________________________________________________________
________________________________________________________________________
6. Referring to station four, question 2, what do you think happens to the light emitted when astronomersseestarsmovingtowardfromthem?
________________________________________________________________________
________________________________________________________________________
________________________________________________________________________
7. Referringtostationfive,inferencequestion,whathappenstotheincomingsolarradiation “whitelight”asitisreflectedofftheplanet?
________________________________________________________________________
________________________________________________________________________
________________________________________________________________________
8. Whatdoesinfraredimagingrecord?Howdoyouthinkfirefighterscouldusethis information?
________________________________________________________________________
________________________________________________________________________
________________________________________________________________________
9. Explainhowthisshowshowobjectsradiateelectromagneticenergy?
________________________________________________________________________
________________________________________________________________________
________________________________________________________________________
________________________________________________________________________
Earth Sc. Lab Bk MASTER 2010.ind179 179 9/29/2011 3:12:03 PM

Electromagnetic SpectrumPage 180 Copyright © 2010Topical Review Book Company
10. Assuming your lab partner was absent today, write a brief note to your partner to summarize new information you learned today about the properties of the electromagnetic spectrum.
________________________________________________________________________
________________________________________________________________________
________________________________________________________________________
________________________________________________________________________
________________________________________________________________________
________________________________________________________________________
________________________________________________________________________
________________________________________________________________________
________________________________________________________________________
________________________________________________________________________
________________________________________________________________________
Earth Sc. Lab Bk MASTER 2010.ind180 180 9/29/2011 3:12:03 PM

Where is Our Sun?Copyright © 2010Topical Review Book Company
Page 181
36 Where is Our Sun? Ancient people believed that the Sun and all of the celestial objects revolved around the Earth. This is known as the geocentric model. Ancient people closely watched the movement of the Sun. These people built simple devices called sundials, to tell time. The sundial works on the notion that the sun moves at regular speed across the sky. A gnomon is the shadow cast by the sun on a sundial. Knowing the angle of the Sun and your longitude, one can easily determine the local time. Local time is when people determine noon to be when the Sun appears to be at its highest point in the sky. When people need to determine true north, people need to know the difference between where the compass is pointing and the North Pole. This difference is called magnetic declination.
Objective:
The objective of this lab is to determine the angle of the Sun and the local time.
Essential Question: ____________________________________________________________________________
___________________________________________________________________________
Hypothesis:_____________________________________________________________________________
___________________________________________________________________________
Variables: Independent:___________________________________________________________
Dependent:___________________________________________________________
Materials: • Two Meter Sticks • Compass (directional) • USGS Quadrangle • Protractor
NAME _________________________________
Earth Sc. Lab Bk MASTER 2010.ind181 181 9/29/2011 3:12:03 PM

Where is Our Sun?Page 182 Copyright © 2010Topical Review Book Company
Procedure:1. Find the Magnetic declination on the USGS Quadrangle.
2. Go to an area of direct sunlight (outside)
3. Find a level place of ground.
4. Have one partner hold one end of the meter stick loosely until it touches the ground. This will allow the stick to be perpendicular to the ground.
5. Finding the shadow it casts, place the second meter stick on the ground, along its gnomon. Be sure to place the lower numbers of the meter stick at the vertical meter stick.
6. Place the compass on the ground, next to the meter stick. Make sure your angle is less than 90°. Adjust the dial so that while the compass is still on the ground, the arrow aligns with the needle. This is the arc of the shadow.
7. Measure the gnomon. (Read the line where the shadow falls. Zero is facing the vertical meter stick.)
8. Draw your shadows (scale 1:10) in the space below. We know that the vertical line of the right triangle is 1 meter and the gnomon is the horizontal length.
100
90
80
70
60
50
40
30
20
10
0
cent
imet
ers
Earth Sc. Lab Bk MASTER 2010.ind182 182 9/29/2011 3:12:03 PM

Where is Our Sun?Copyright © 2010Topical Review Book Company
Page 183
TIME CHART Magnetic Arc of Shadow and Declination magnetic declination Rotation/hour Whattimeisit?
Remember, there are 60 minutes in an hour, adjust your decimal from division accordingly. If it is morning, subtract hours and minutes from noon. If it is afternoon, add hours and minutes to noon.
Observations:
1. Definemagneticdeclination.
________________________________________________________________________
________________________________________________________________________
2. Whatisthelocalmagneticdeclination?
________________________________________________________________________
3. Definegnomon.
________________________________________________________________________
________________________________________________________________________
4. Whatisthelengthofthegnomon?______________________________________cm.
5. WhatistheangleoftheSun?_____________________________________________°
6. Howmanydegreesdoesthesunappeartotravelinanhour?______________________°
7. Whatisthedifferencebetweenmagneticnorthandtheangleofthegnomon?(The directional compass will show you.)
________________________________________________________________________
________________________________________________________________________
________________________________________________________________________
________________________________________________________________________
÷
Earth Sc. Lab Bk MASTER 2010.ind183 183 9/29/2011 3:12:03 PM

Where is Our Sun?Page 184 Copyright © 2010Topical Review Book Company
8. Whatisthelocaltime?______________________________________________________
9. Whyisthelocaltimesodifferentthanstandardtime?
________________________________________________________________________
________________________________________________________________________
________________________________________________________________________
________________________________________________________________________
________________________________________________________________________
________________________________________________________________________
10. If we know the time in Greenwich, England, and we know our local time, what else can wefindout?
________________________________________________________________________
________________________________________________________________________
________________________________________________________________________
________________________________________________________________________
________________________________________________________________________
________________________________________________________________________
Earth Sc. Lab Bk MASTER 2010.ind184 184 9/29/2011 3:12:03 PM

Times and TimeCopyright © 2010Topical Review Book Company
Page 189
38 Tides and Time There is an old saying, “Tides and time wait for no man.” It means that tides are constant and predictable and most importantly, unstoppable. Tides are the daily changes in the surface level of the Earth’s oceans. Each quarter rotation of the Earth causes a major change in tides. Many of us have experienced setting our towel on the sandy beach only to find out later thatour things are getting soaked. Different areas of the planet experience tides differently. Some areas have almost no tidal changes and in other areas the tides are dramatic. The Bay of Fundy in Canada has the highest tidal range on Earth. Tides are caused by the pull of the Moon’s gravity. Each day, there are two high tides and two low tides. Because the Moon is closer to the earth than the sun is, the Moon has a stronger gravitational pull on the Earth. During the full Moon and new Moon phases, spring tidesoccur.Spring tidesaresimplyhighesthigh tidesand lowest low tides.During thefirst-and last-quarter phases of the Moon. Neap tides are where there is not a great tidal range.
Objective:
The objective of this lab is to plot a tide at the Battery in New York Harbor to determine if a pattern exists in tides.
Essential Question: ____________________________________________________________________________
___________________________________________________________________________
Hypothesis:_____________________________________________________________________________
___________________________________________________________________________
Variables: Independent:___________________________________________________________
Dependent:___________________________________________________________
Materials: • Tide Chart • Tidal Ranges, New York Harbor
NAME _________________________________
Earth Sc. Lab Bk MASTER 2010.ind189 189 9/29/2011 3:12:04 PM

Tides and TimePage 190 Copyright © 2010Topical Review Book Company
Procedure:1. Find the tidal predictions in the tidal chart below.
2. Plot the dates on the horizontal axis on the next page.
3. Plot the water level on the vertical axis.
4. Review Lunar Orbit and Phases investigation.
The following is a tidal chart, recorded hourly at the area of New York Harbor known as the Battery, the southern tip of Manhattan Island. It is named the Battery for the artillery battery that protected the early settlement of New York.
The following is a tidal chart, recorded hourly at the area of New York Harbor known as the Battery, the southern tip of Manhattan Island. It is named the Battery for the artillery battery that protected the early settlement of New York.
Date HoursWater Level
(meters)Date Hours
Water Level(meters)
April 10 00:00:00 am 1.4 April 11 06:00:00 am 0.7
April 10 01:00:00 am 1.2 April 11 07:00:00 am 1.1
April 10 02:00:00 am 1.0 April 11 08:00:00 am 1.5
April 10 03:00:00 am 0.8 April 11 09:00:00 am 1.7
April 10 04:00:00 am 0.6 April 11 10:00:00 am 1.8
April 10 05:00:00 am 0.5 April 11 11:00:00 am 1.8
April 10 06:00:00 am 1.0 April 11 12:00:00 pm 1.6
April 10 07:00:00 am 1.3 April 11 01:00:00 pm 1.2
April 10 08:00:00 am 1.7 April 11 02:00:00 pm 0.9
April 10 09:00:00 am 1.9 April 11 03:00:00 pm 0.6
April 10 10:00:00 am 2.0 April 11 04:00:00 pm 0.4
April 10 11:00:00 am 1.7 April 11 05:00:00 pm 0.5
April 10 12:00:00 pm 1.4 April 11 06:00:00 pm 0.7
April 10 01:00:00 pm 1.0 April 11 07:00:00 pm 1.2
April 10 02:00:00 pm 0.7 April 11 08:00:00 pm 1.6
April 10 03:00:00 pm 0.4 April 11 09:00:00 pm 1.9
April 10 04:00:00 pm 0.5 April 11 10:00:00 pm 2.1
April 10 05:00:00 pm 0.6 April 11 11:00:00 pm 2.0
April 10 06:00:00 pm 0.9 April 12 00:00:00 am 1.8
April 10 07:00:00 pm 1.4 April 12 01:00:00 am 1.5
April 10 08:00:00 pm 1.8 April 12 02:00:00 am 1.1
April 10 09:00:00 pm 2.0 April 12 03:00:00 am 0.8
April 10 10:00:00 pm 2.2 April 12 04:00:00 am 0.5
April 10 11:00:00 pm 1.9 April 12 05:00:00 am 0.4
April 11 00:00:00 am 1.6 April 12 06:00:00 am 0.5
April 11 01:00:00 am 1.2 April 12 07:00:00 am 0.8
April 11 02:00:00 am 0.8 April 12 08:00:00 am 1.2
April 11 03:00:00 am 0.7 April 12 09:00:00 am 1.5
April 11 04:00:00 am 0.5 April 12 10:00:00 am 1.7
April 11 05:00:00 am 0.5
Earth Sc. Lab Bk MASTER 2010.ind190 190 9/29/2011 3:12:04 PM

Times and TimeCopyright © 2010Topical Review Book Company
Page 191
41 How many degrees will the Sun’s vertical rays shift on Earth’s surface as Earthtravels from position C to position D?(1) 15° (3) 47°(2) 23.5° (4) 365°
Base your answers to questions 42 and 43 on the graph below, which shows two days of tidal data from acoastal location in the northeastern United States.
42 The change in the tides as shown on the graph is primarily the result of(1) Earth’s rotation and the Moon’s revolution(2) Earth’s rotation and revolution(3) the Moon’s rotation and Earth’s revolution(4) the Moon’s rotation and revolution
43 If the pattern shown continues, the most likely height and time for the first high tideon day 3 would be(1) 2.2 meters at 4 a.m. (3) 2.2 meters at 5 a.m.(2) 2.3 meters at 4 a.m. (4) 2.3 meters at 5 a.m.
MidMid 2 4 6 8 10 N 2 4 6 8 10 Mid 2 4 6 8 10 N 2 4 6 8 10 2 4 6 8 10
2.4
2.2
2.0
1.8
1.6
1.4
1.2
1.0
0.8
0.6
0.4
Tid
e H
eig
ht
(met
ers)
a.m. p.m.
Day 1
a.m. p.m.
Day 2
a.m.
Day 3
Tidal Changes
Key
Mid – Midnight N – Noon
P.S./E. Sci.–Jan. ’09 [13] [OVER]
Observations:
1. Isthisgraphindicativeofarandom,direct,inverseorcyclicpattern?
________________________________________________________________________
________________________________________________________________________
2. Approximately,howmuchtimeelapsesbetweenhightides?
________________________________________________________________________
________________________________________________________________________
3. Isonehightidehigherthananotherinatwenty-fourhourperiod?Why?
________________________________________________________________________
________________________________________________________________________
4. If a complete cycle is from high tide to high tide, how many complete cycles are on your graph?
________________________________________________________________________
________________________________________________________________________
Earth Sc. Lab Bk MASTER 2010.ind191 191 9/29/2011 3:12:04 PM

Tides and TimePage 192 Copyright © 2010Topical Review Book Company
5. Whatisthetimeofthefirstlowtideonyourgraph?
________________________________________________________________________
________________________________________________________________________
6. Whatistheaveragetidalrangeonyourchart?
________________________________________________________________________
________________________________________________________________________
7. Isthetidalrangeincreasingordecreasing?
________________________________________________________________________
8. Whatcausestides?
________________________________________________________________________
________________________________________________________________________
________________________________________________________________________
9. Whyaretheretwotidalcyclesinatwenty-fourhourperiod?
________________________________________________________________________
________________________________________________________________________
________________________________________________________________________
________________________________________________________________________
10.Assumingthechartreflectsthemaximumrange,whatcanyouinferaboutthelunar cycleinthisgraph?
________________________________________________________________________
________________________________________________________________________
________________________________________________________________________
________________________________________________________________________
________________________________________________________________________
Earth Sc. Lab Bk MASTER 2010.ind192 192 9/29/2011 3:12:04 PM