absorption spectra of methane in the near infrared - nist · i l paraboloidal mirror ts ..... so ,...
TRANSCRIPT

-
U. S. Department of Commerce National Bureau of Standards
Research Paper RP1944 Volume 41, December 1948
Part of the Journal of Research of the National Bureau of Standards
Absorption Spectra of Methane in the Near Infrared By Richard C. Nelson,! Earle K. Plylerl and William S. Benedict
A grating spectrometer with a PbS cell for detector has been used for the measurement of the infrared absorption bands of methane in the region of 1.66 p,. Many lines of the P, Q, and R branches of the 1.66-p, band have been observed.
These are well resolved and are of the correct structure and spacing for the F2 component of 2 V3. The lines for values of J up to 10 are sharp, showing no indication of split ting due to interaction with neighboring s tatcs or to centrifugal distortion. The rotational constants obtained for this band are B' = 5. 178, 13= 0.0346. The latter value is lower than in the V3 fundamental. Other bands observed are more, complex and irregular, presumably due to mutual interaction.
In the infrared spectrum of m ethane th ere are two strong bands, th e fundamental frequeneies, 1'3 at 3020.3 cm- I , and /14 at 1306.2 cm- I • B ecause of the symmetry of the molecule, th e other two fundamentals /II at 2914.2 cm- I and /12 at 1526 cm- I , are not active in the infrared, although these frequencies may appear in combination bands with the other frequencies and their overtones, to give bands in the near infrared. Many previous studies, both experimental and theoretical, have been made of the methane molecule. A good discussion of the general problem, including references to th e literature, may be found in H erzberg's book [1] .2 One of the unsettled problems concerns the influence of the Corio lis forces in the fine structure of the overtone and combination bands. Accordingly it was thought that further experimen tal data with higher resolution would be of value. The present paper r eports such data in the regions from 1.5 to 1.7 }J. , and from 1.15 to 1.19 }J., with particular emphasis on one band of relatively simple structure, the F2 componen t of 2/13, at about 6,004 cm- I . Quite recent studies on the atmospheric absorption have revealed the presence of methane bands [2]. McMath, Mohler, and Goldberg [2] have also studied the 2/13 band under high resolution.
In om studies, high resolution was obtained by the use of a specially designed grating instrument, which employs a PbS photo-conducting cell con-
1 Rcsearch Associate, Northwestern University. , Figures in brackets indicate the litcrature rcferences at the end of this
paper.
Absorption Spectra of Methane
structed by Cashman [3] as the detecting unit. One of the authors [4] has previously given a description of the instrument and only a brief outline of the arrangement will be repeated her e.
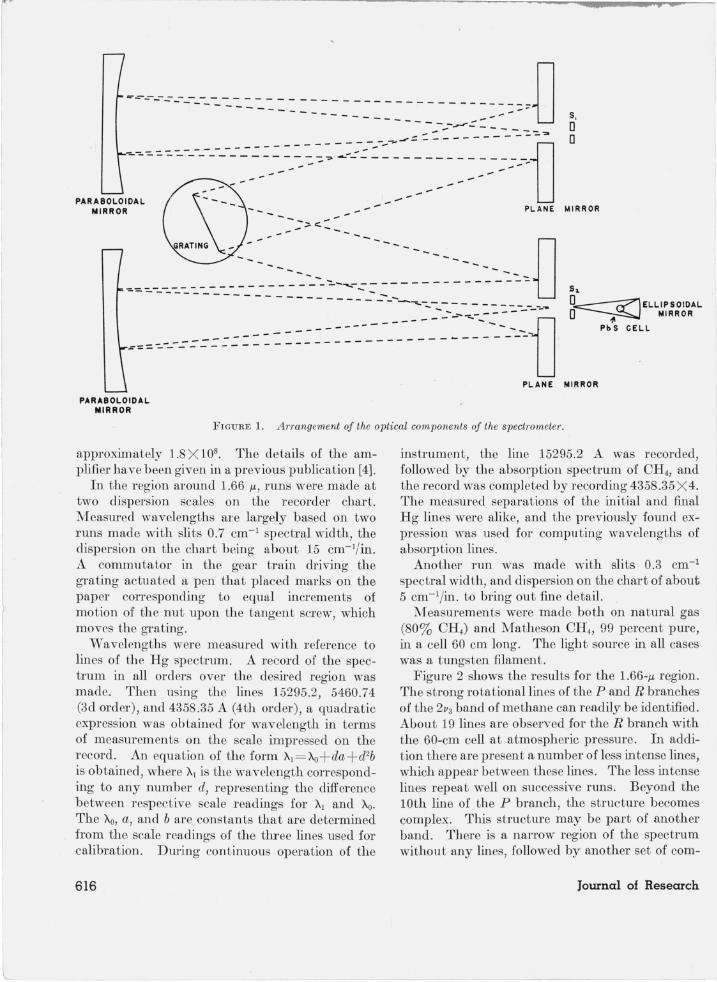
Figure 1 shows th e plan of the optical parts of the spectrometer. The system i designed according to th e arrangement described by PfUlld [5J. The paraboloidal mirrors have a focal length of 2 ill and are 12 in. in diameter. The grating has 15,000 lines per inch and the ruled surface is 3 by 5 in. , giving a thcoretical resolution in the first mder of 75,000. An ellipsoidal mirror, with a conjugate focal ratio of 1:3, was used to focus the energy from the exit slit onto the PbS cell. With this magnification, spectrometer slits 18 mm in length could be used with the PbS cell, which possessed a sensitive surface 7 mm long. A tungsten lamp was used as the source, and a quartz lens focused the filament on the entrance slit of the spectrom eter. The absorption cell, which was 60 cm in length , was placed in front of the entrance slit. A chopper, which interrupts the radiant energy approximately 1,000 times a second, was placed immediately in fron t of the entrance slit.
For any selected region the grating was rotated continuously. The driving m echanism has five scanning speeds, and the Speedomax recorder has six speeds for the chart, a selection which made it pdssible to have dispersions of 50 to 0.02 A/mm on the recording chart.
A speeial narrow-band-pass amplifier was u ed with t he PbS cell. The over-all voltage gain was
615
)
I L
PARABOLOIDAL MIRROR
ts .....
S,
o o
MIRROR
s~
O~ELLIPSOIDAL O~ MI RROR
PbS CELL
PLANE MIRROR
FIGURE 1. Arrangement of the optical components of the spectrometer.
approximately 1.8 X 10⁸• The details of the amplifier have been given in a previous publication [41.
In the region around 1.56 p" runs were made at two dispersion scales on the recorder chart. Measured wavelengths are largely based on two runs made with slits 0.7 cm-1 spectral width, the dispersion on the chart being about 15 cm- I/in. A commutator in the gear train driving the grating actuated a pen that placed marks on the paper corresponding to equal increments of motion of the nut upon the tangent screw, which moves the grating.
Wavelengths were measured with reference to lines of the Hg spectrum. A record of the spectrum in all orders over the desired region was made. Then using the lines 15295.2, 5460.74 (3d order), and 4358.35 A (4th order), a quadratic expression was obtained for wavelength in terms of measurements on the scale impressed on the record. An equation of the form XI = Xo+ da + d2b is obtained, where XI is the wavelength corresponding to any number d, representing the difference between respective scale readings for XI and Xo. The Xo, a, and b are constants that are determined from the scale readings of the three lines used for calibration. During continuous operation of the
616
instrument, the line 15295.2 A was recorded, followed by the absorption spectrum of CH4, and the record was completed by recording 4358.35 X 4. The measured separati.ons of the ini.tial and final Hg lines were alike, and the previously found expression was used for computing wavelengths of absorption lines.
Another run was made with slits 0.3 cm-1
spectral width, and dispersion on the chart of about 5 cm-I /in. to bring out fine detail.
Measurements were made both on natural gas (80% CH4) and Matheson CH4, 99 percent pure, in a cell 60 cm long. The light source in all cases was a tungsten filament.
Figure 2 shows the results for the 1.56-p, region. The strong rotational lines of the P and R branches of the 2113 band of methane can readily be identified. About 19 lines are observed for the R branch with the 50-cm cell at atmospheric pressure. In addition there are present a number of less intense lines, which appear between these lines. The less intense lines repeat well on successive runs. Beyond the 10th line of the P branch, the structure becomes complex. This structure may be part of another band. There is a narrow region of the spectrum without any lines, followed by another set of com-
Journal of Research

.....
200
180
160
,"140
'" 120
~
1 Z 100
~ ~ I-U 80 w ...J 30.0 ... W 0 60
72 .9 26.7 59.1
40 15.0 38 .3
91.6
20 I I
5829 .9Cm- J 590~4Cm -1
0 11.4 11.0 10.6 10.2 9 .8 9 .4
83.3 26 .4 15.8
4 9.6 12 .2 36.8 61.0
47.0 67.2
57.3 77. 1
6003.9Cm- 1
9.0 8 .6 8.2 7. 8 7.4 7.0
86.9 9 6 .4
'0.3
42.2
33.2 23.8
14 .7
I 6106.1 em-I
6.6 6.2 5 .8 5.4 5 .0 4.6 4.2 SCALE NUMBER
FIGURE 2. A bsorption spectrum of the 1.66-/-1 band Clf,. 'I' be cell was 60 em in lengtb and the gas at atmospheric prcssw·e.
105r---._---.---.---,r---r---.----.---.---.----r---.---.---_r---.---,r-~,_--._--_r--_.--_.
90
:li' :li' 75
z - 60
z o ~ 45 <.:>
'" ...J
::; 30 o
15
1 5983.3cm - 1
91.5
ge."
26." 15 ..
O~ __ ~ __ ...J-__ -L __ ~ ____ ~ __ ~ __ ...J-__ -L __ ~~~~ __ L-__ ~ __ -L __ ~ __ ~ ____ L-__ ~ __ _L __ ~ __ _...J
3.3 3.2 3.1 3.0 2.9 2 .8 2 . 7 2 .6 2 .5 2.4 2 .3 SCALE NUMBER
FIGURE 3. Center of the 1.66-/-1 band, showing fine structure states of the zero branch.
plex lines. These lines may be part of a combination band , but no term assignment fits very well. When the absorption of the gas was measured with a spectral slit of 0.3 cm- I , the zero branch showed more structure. Figure 3 shows the central part of the band. The gas was at atmospheric pressure for these observations. 'When a smaller pressure of gas was used, better separatio~ of the stronger components of the Q branch was obtained , but the less intense components were not present.
Absorption Spectra of Methane
The intensities given are measured to within 2 percent. The stronger lines may actually be more intense than the measurements indicate. That is, the finite slit widths may make it impossible to find the maximum absorption at the center of the lines. All faint lines that measure less than 3 percent are arbitrarily marked 2 percent in intcnsity. The intensity figure in the table denote the percentagc ab orption of the minimum point of the lines.
617
)

L
All the observed lines of appreciable intensity for the region are listed in table 1. Wave numbers of some of the lines are marked for iden tification. A sufficient number of lines are numbered on the figure so tha t the tables can be related to th e experimental results. The band for the 1.10- to 1.13-IL region, shown in figure 4, does not have the regular structure as observed in the 2va band . The wa velengths and intensit ies of all the lines ar e given in table 2.
The 2va band gives sufficient data for calculating some of the constants of methane. '1'he only lines in the OH4 absorption that can be given a defini te interpretation are listed in table 3. These are the strongest lines in the region, and form a band consisting of P, Q, and R branches of simple structure, the band bearing a marked resemblance to the Va fundamen tal. The vibrational transition involved, 2va, is the first overtone of that fundamental. The theory of the structure of this band has been given by Johnston and D ennison, [6] and by Shaffer , Nielsen , and '1'homas [7]. The firs tnamed authors have pointed out that the upper level is six-fold degenerate in the zeroth-order approximation, but that the first-order Ooriolis interaction due to the internal angular momentum of the vibration removes the degeneracy, giving six different energies for each value of the rotational quantum number J . At J = O, these may be grouped into tlu'ee sub-bands of different symmetry . Transitions are permitted from the ground state to only one of these sub-bands, the t riply-degenerate F2 ; and for each branch , t..J= - 1, 0, or + 1, transitions are permitted to only one of the three components, thus giving the band of simple structure, as observed.
The second-named authors have considered the effect of second-order interactions, which in principle may further r emove the degeneracy of the energy levels, splitting each J level into a number of components of differen t K , and which may permit t ransitions from the ground state to the E subband. (These authors gave selection rules and intensities for the band which differ from those of Johnston and Dennison [6], and which appear to be in: error. ) The second-order interactions are of two types; first, those due to cent rifugal stretching and distortion of the molecule; and second, those due to resonance interactions between the vibrational level and other neighboring levels of the same total (vibrational plus
618
T ABLE 1. Wavelength, wave number, and intensity of the observed lines in the 1.66-11- region
Wave· Wave Absorp· V{ave· Wave AbsoJ'p· length number Lion length number tion
A cm-1 Percent A cm-1 Percent 16112.7 6:104.6 3 16859.9 5929.6 5 16113.6 6192.7 2 16868. 0 59~6. 7 50 16148.5 6190.8 2 16884.7 .5920.9 10 16t65.9 6184.1 2 16894.6 5917.4 5 16175.6 6180.4 2 16901. 4 5915.0 50
1618.5. 3 6176.7 2 16918.9 5918.9 20 16200.3 6171. 0 2 IG934.8 5903.4 50 16209.6 6167.5 5 16943.2 5900.4 20 16233.7 6158.3 10 16968.5 5891.6 55 16254.8 0150.3 20 16977.2 5888.6 10
16260.2 6148.2 5 16995.3 5882.4 25 16267. 2 6145.6 30 17003.6 587~. 5 25 16276.2 6142. 2 30 17022.7 ,',872.9 30 16281.4 6140. ~ 15 17030.6 .5870.2 20 16288.2 6137.1 10 17040. I 5.%6.9 15
16~00. 2 6133.2 50 17048. 4 5864. 1 30 16309.6 5129.7 5 1,062. S 5859. I 30 16315.3 6127.3 5 17076.4 5854.4 30 16325.1 6123.8 50 17081. 8 5857.6 20 16331.4 6121. 5 10 17090. I 5849.7 15
16338.6 6118.8 10 17100.5 5846.2 20
16349.4 6114 ... 55 17110.6 5842.7 10
I 16356.0 6112.3 10
17117.2 5840.5 15
16362.2 6110.0 10 17133.3 5835.0 15
16372. 6 6106.1 70 17148.3 5829.9 IS
17164.7 5824.3 20 16386. 6 6100.9 ]0 17200.9 5812.0 15 !G398.7 6096.4 70 17209. 4 5809.2 10 16424.2 6086.9 70 172 17.2 5806.5 10 16450.6 6077. 1 75 17222.6 5804.7 20 16477.4 6067.2 65
17232.6 5.801. 3 10
16488.6 6063.1 15 17244.2 5797.5 10
16501.5 6057. :l 70 17256.3 5793.4 15
165~2. 5 6047.0 65 17205.3 5790. 4 25
16553. 1 6039.5 15 17279.3 5785.7 2U
16560.5 6036.8 50 17:104.1 5777.4 25 17315.1 5773.7 15
16589.0 6026.4 30 17345.5 5.63.6 15 16G18.4 6015.8 30 173.8.5 5752.6 15 15651.1 6003.9 85 1,:395.5 5747.0 10 16659.8 6000.8 65 16663. 2 5999.6 55
17415.1 5740.5 10 17456.1 5727.1 15
16666.5 599S.4 50 16677. 1 5994.6 25 Q BRANCH-16681. 8 ;;992.9 20 16688.3 5990.6 5 16692.9 5988. 9 5 16650.4 6004.2 100
16601. 1 600:1. 9 100 16652. 7 6003.4 100
16703.5 5983.3 25 16654.7 6002.7 100 16725.2 5977. 4 5 16656.9 6001. 9 (10 16739.5 51!72. ~ 45 16771. 1 5961.0 50 16659.8 6000.8 9U W781. 3 5957.4 70 166G3.2 5999.6 90
16666.5 ~998. 4 80 16803.1 5949.6 45 16669.0 5997.5 65 16811. 3 5946.7 15 16674.3 59!J5.6 25 16826.0 5941. 5 5 lD835.2 5938.3 50 1667i.l 5994.6 45 16848.5 5933.6 5 16681. 8 5992.9 40
- These data refer to fig. 3.
Journal of Research

160
130
100
z ~200 .... u
"' ...J U.
"' o
170
140
WATER VAPOR
SCALE NUMBER
FrGUHE 4. Upper curve shows the absorption of water vapor in the atmosphere; lowe?' curve is the absorption of methane interposed on the atmospheric absOrlJtion.
T ABLE 2. W avelength, wave numbeT, and intensity of obseTved lines in the 1.16-J..I. Tegion
Wave Wave· Absorp- Wave W ave- Absorp-nunlber length tion number length UOn
cm- 1 A Percent cm-1 A Percent 8656.5 11548.9 3U 8567.7 11608.5 15
8t>45.2 11.1f>3.9 30 8546.5 11597.5 15
8637.6 11574.0 20
8628.6 11586.2 15 8523. 7 11728.8 10 8616.6 11602.3 20 8509.0 11749.0 5
8489.6 11775.9 5 8606.5 11615.9 30 8460.9 11815. 9 2 Sf>Ol. 6 11622.6 35 8421.3 11871.4 10
8587.2 11642.0 25
rotational) symmetry. The centrifugal splitting is roughly independent of the particular vibra
I tional level in question, and is proportional to : J2(J + 1)·. The resonance splitting, proportional
to J (J + l ), is very dependent on the vibrational state. Thus in the 114 fundamental [8], the splitting is experimentally observable as low as J =3, and has been well accounted for [11] by the secondnamed effect. In the 113 fundamental [8] however, and equally so in th e 2113 band here studied, the
Absorption Spectra of Methane
experimental observation is that the lines of the P and R branche are ;:;harp and narrow, and agree in position and intensity with the predictions of the first-order theory, except for relatively small correction for centrifugal stretching, up to J = 1 L This shows that the second-order interactions leading to splitting are of comparatively minor importance in 2113' Presumably such interactions are much more important for the other overtone and combination bands in the region, resulting in bands of much more complex structure which we are unable to interpret.
The following equations represent the observed lines to the required accuracy:
R branch: lI = vo+B'[(J+l) (J + 2)+ 2'[(J- l )]-B" J (J + 1)-4D(J + 1)3
Q branch: v= lIo+ B'[(J (J + 1)-6r]-B" J (J + 1) (1)
P branch: v= vo+ B'[(J-1)J-2r(J+ 2)]B"J (J +1)+4DJ 3.
619
I
--~)
I
l
6016
6 01 4
6012
6010
6008
!I ~ 6006
6004
6002
6000
5998
5996
5.360
5.350 0
0 5.3 40
0 r J ~ ~. 3 30 or .,. 5.320 0
5.310 0
~300 ~~~7-~~7-~--~~--~~--~~ o 20 4 0 60 80 100 120 140 160 18 0 200 220
JtJ + I)
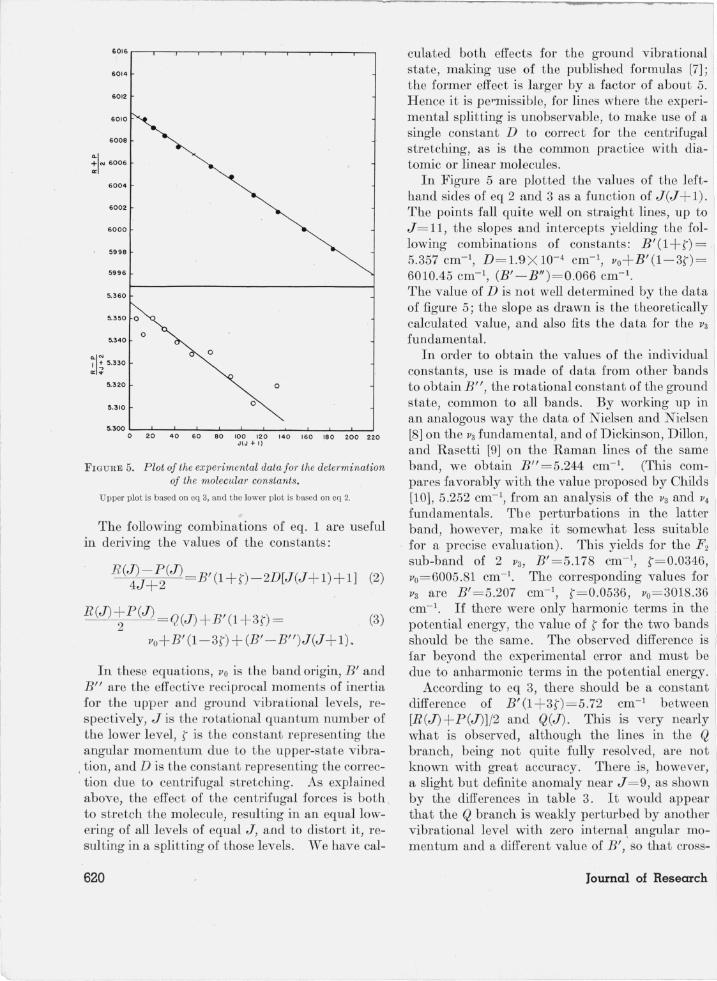
FIGURE 5. Plot of the experimental data for the determination of the molecular constant.s.
Upper plot is based on eq 3, and the lower plot is based on eq 2.
The following combinations of eq. 1 are useful in deriving the values of the constants:
R(J) - P (J) = B'(1 +S)-2D[J(J + 1) + 1] (2) 4J+ 2
R(J)+P (J) Q(J)+B' (1+3S)= (3) 2
lIo+B'(1-3S) + (B' - B")J (J + 1).
In t hese equations, 110 is the band origin, B' and B" are t he effective reciprocal moments of inertia for t he upper and ground vibrational levels, respectively, J is t he rotational quantum number of the lower level, t is t he constant representing the angular momentum due to t he upper-state vibra-
, tion , and D is t he constant representing t.he correction due to centrifugal stretching. As explained above, the effect of t he centrifugal forces is bot h to stretch t he molecule, resulting in an equal lowering of all levels of equal J , and to distort it, resulting in a splitting of those levels. We have cal-
620
culated both effects for the ground vibrational I state , making use of the published formulas [7] ; . the former effect is larger by a factor of about 5. H ence it is permissible, for lines where the experimental splitting is unobservable, to make use of a single constant D to correct for the centrifugal stretching, as is the common practice with diatomic or linear molecules.
In Figure 5 are plotted the values of the lefthand sides of eq 2 and 3 as a function of J (J + 1). The points fall quite w'811 on straight lines, up to J = ll , the slopes and intercepts yielding the following combinations of constants: B' (1 + t) = 15.357 cm- I , D = 1.9 X 10- 4 em-I, 1'0+B'(1-3t)= 6010.45 cm- \ eB' - B" )= 0.066 cm- I .
The value of D is not well determined by t he data of figure 5; the slope as drawn is the t.heoretically calculated value, and also fits the data for the 1'3 fundamental.
In order to obtain the values of the individual constants, use is made of data from otber bands to obtain B", the rotational constant of the ground . state, common to all bands. By working up in an analogous way the data of Nielsen and Nielsen [8] on the 1'3 fundamental, and of Dickinson, Dillon, and Rasetti [9] on the Raman lines of the same band, we obtain B" = 5.244 cm- I • (This compares favorably with the value proposed by Childs [10] , 5.252 cm- I , from an analysis of the 1'3 and 1'4 fundamentals. Tb e perturbations in the latter band, however, make it somewhat less suitable for a precise evaluation). Tbis yields for the F2 sub-band of 2 1'3, B' = 5.l78 cm-\ t= 0.0346, 1'0=6005.81 cm- I . The corresponding values for 113 are B' = 5.207 cm-\ t = 0.0536, 1'0 = 3018.36 I
cm- I • If there were only harmonic terms in the , potential energy, the value of t for the two bands should be the sam e. The observed difference is far beyond the experimental error and must be due to anharmonic terms in the potential energy.
. According to eq 3, there should be a constant I difference of B' (1+3t)=5.72 cm- I between I [R (J) + P (J)] /2 and Q(J) . This is very nearly what is observed, al though the lines in the Q branch, being not quite fully resolved, are no t known with great accuracy. There .is, bowever, I
a slight but defini te anomaly near J = 9, as shown by the differences in table 3. It would appear r
that the Q branch is wealdy perturbed by another i
vibrational level with zero interna~ angular momentum and a different value of B' , so that cross-
Journal of Research

TABLE 3. I dentified lines in the 2~3 band of CH 4
R(J) O(J) P (J )
J Ob· Calcu - Ob- Caleu- Ob- Caleu-
served lated ser ved latecl served laLed ----- --- ------ ------
em-I cm-1 cm-1 cm- 1 em-I em-I
0 6015.8 6016.17 ------ ------ ---_.- .-----1 6026.4 6026. 38 ------ 6004.60 5994.2 5991. 22 2 6036.8 6036.83 6004. 2 6004.34 5983.3 5983.25 3 6047.0 6047.10 6003.9 6003.94 5972.2 5972. 14 4 6057.3 6057.25 6003.4 6003.41 5961.0 5960. 93
5 6067.2 6067. 23 6002.7 6002.75 5949.6 5949.58 6 6077.1 6077. 05 6001. 9 6001. 96 5938. 3 5938. 13 i 6086. 9 6086. 71 6000.8 6001. 04 5926.7 .5926.59 8 6096.4 6096.19 5999.6 5999.98 5915.0 5914. 94 9 6106.1 6105.52 5998.4 5998.75 5903.1 5903.20
10 6114. 7 6114. 66 5997.5 5997.47 5891. 6 5891. 36 11 6123.8 6123.61 5995.6 5996.02 5879.5 5879.43 12 6133.2 6132.39 5994.6 5994. 44 5866.9 5867.43 13 6142.2 6140.94 5992.9 5992. 72 5854.4 5855. 35 14 6150.3 6149.33 ------ ------ -- -- -- ------
15 6158.3 6157. 52 ------ ---- .- -----. ------
ing with the F 2° component occurs ncar this point. The perturbing level may be the Al sublevel of 2 /13, or possibly some other combination band with Al symmetry.
In addition to the good agreement between the observed and calculated frequencies, the relative intensities of the lines, especially in the P and R branches, show excellent agreement with those calculated by Jahn [I1J. In particular, the relative weakness of the lines with JII = 5 and strength of those withJ" = 6 is mal'kedly apparent.
The ultimate O'oal of a study of the CH4 spectrum is to derive constants that will yield the observed positions, effective moments of inertia, and effective '\'s of all observable overtone and combination bands, and to explain these in terms
Absorption Spectra of Methane
of a potential function. From the small number of completely interpreted bands this is not yet possible, al though the pre ent work is a short step in that direction. Further experimental study under high resolution of C:H4 and its deuterated derivatives, and further theoretical studies using a potential function of somewhat grea ter implicity than that of Shaffer, Nielsen and Thomas [7], are required. A simplification of the experimental band structure may be expected if measurements are made at low temperatures.
References
[1] Gerhard Herzberg, Molecular spectra and molecular struct lll'e (D. Van Nostrand Co., New York, N. Y., 1945) .
[2] Marcel V. Migeotte, Phys. Rev. 73, 519 (1948); R. R. McMath, O. C. Mohler, and L. Goldberg, Phys. Rev. 73, 1203 (1948).
[3] R. J . Cashman , Pl'oc. at. E lec. Conf. 2 (Chicago, 1946).
[4] R. C. Nelson and W. R. Wilson, Proc. Nat. Elec. Conf. 3 (Chicago, 1947).
[51 A. H . Pfund, J. Opt. Soc. Am. &; Rev. Sci. Instr. 14, 337 (1927).
[6] D. M. Dennison and M. John ton, Phys . Rev. 407, 93 (1935) .
[7] W. H . Shaffer , H . H . Niel en, and L. H. Thomas, Phys. Rev. 56, 895, 105 1 (1939).
[8] A. H. Nielsen and H. H . ielsen, Phys. Rev. 54, 118 (1938).
(9) R. G. Dickinson, R . P. Dillon , and F. Rasetti, Phys. Rev. 340, 582 (1929).
[101 W. H . J. Childs, Proc. R oy. Soc. (London) 153, 555 (1936) .
[11] H . A. Jahn , Proc. Roy. Soc. [A], 168, 469, 495 (1938); H . A. Jahn and W. H . J . Childs, Proc. Roy. Soc. [A], 169, 451 (1939).
W ASHIN GTON, October 1, 1948.
621
.J