abstract - department of accounting · abstract many countries have recently adopted policies to...
TRANSCRIPT
Do Investors Value Corporate Tax Return Information? Evidence from Australia
Shannon Chen
University of Texas at Austin
January 17, 2017
Abstract
Many countries have recently adopted policies to increase corporate tax transparency, including
policies requiring public disclosure of tax information. However, little is known about the
consequences of such disclosures. I exploit a June 2013 law change requiring the Australian
Taxation Office (ATO) to publicly report line items from Australian corporate tax returns to
examine (1) the market’s expectations of the costs and benefits of public disclosure of tax return
information, and (2) whether tax return information disclosed in the ATO’s report is value relevant
to investors. I test market reactions around key legislative event dates and find evidence that
investors anticipated an overall net benefit of disclosure, such as benefits from reduced information
asymmetry or improved monitoring of companies’ tax activities. However, in cross-sectional
analysis, I find that firms likely to face increased public or regulatory scrutiny as a result of
disclosure experience negative, but small, market reactions. Finally, I find no significant market
reaction to the ATO report itself, suggesting the information contained in the disclosure has little
incremental value to investors at the time of its release. This study is a first step towards
understanding of the consequences of mandatory tax return information disclosure.
Keywords: public tax disclosure, tax transparency, mandatory disclosure, event study
_________________________
I appreciate guidance from my dissertation committee: Jonathan Cohn, Ross Jennings, John McInnis,
Lillian Mills (Chair), and Brady Williams, and I am grateful to Antonis Kartapanis, Daehyun Kim, Colin
Koutney, Christina Lewellen, Jeanmarie Lord, Paul Mason, Kathleen Powers, Jeri Seidman, Bridget
Stomberg, Erin Towery, Ben Van Landuyt, and workshop participants at the University of Texas at Austin
for helpful comments and discussions. I also thank Alfred Tran and a tax partner in Australia for their
assistance with the institutional details of Australia’s tax and financial reporting environment. I gratefully
acknowledge financial support from the AICPA Foundation’s Accounting Doctoral Scholars Program, the
Red McCombs School of Business, and the Tokyo Foundation’s Ryoichi Sasakawa Young Leaders
Fellowship Fund.

1
1. Introduction
Demand for greater tax transparency has grown in recent years as companies face
increasing scrutiny for their corporate tax planning strategies (Chen, Powers, and Stomberg 2016).
Tax transparency encompasses a number of policies, including the exchange of tax information
between countries, increased disclosure of taxpayer information to tax authorities, such as
Schedule UTP in the U.S. (Towery 2016), and, important to this study, the public disclosure of
corporate tax return information (EY 2015, OECD 2015). In Australia, lawmakers passed a tax
transparency bill in June 2013 to counter tax aggressive behavior. Starting with the 2013/2014 tax
year, the Australian Taxation Office (ATO) must publicly report taxable income and taxes paid
from corporate tax returns for companies with total income exceeding AUD 100M.1 Similar to the
U.S., Australian tax returns were historically confidential, and due to a number of differences
between financial and tax reporting, companies’ exact Australian taxable income and tax payments
generally are not available in their public financial statements.2
In this study, I explore the capital market impact of public disclosure of corporate tax return
information by exploiting the law change in Australia to examine (1) investor expectations of the
costs and benefits of such a disclosure, and (2) whether investors find reported taxable income and
taxes paid to be useful and value relevant. Answering both of these questions is important. First,
understanding investor perceptions of the costs and benefits of disclosure is important because it
reveals investor expectations of future consequences. Specifically, understanding whether the
market reacts positively or negatively to increased tax transparency is a first step in predicting
1 Note that for purposes of this rule, “total income” refers to a line item from the Australian corporate tax return that
is closer to a gross income figure rather than net income. 2 For example, the allocation of tax expense between continuing and discontinued operations, differing consolidation
rules, the recognition of accounting accruals such as the tax reserve, and tax credits can lead to differences between
taxable income estimated from financial statement information and true taxable income. See Tran (2015) for additional
discussion of Australian book-tax differences.

2
future firm behavior in response to the new disclosure. If firms suffer economic costs in the form
of negative market returns, the more likely firms will respond with real changes in behavior.
Second, examining the market’s reaction, if any, to the disclosure itself is important because it
reveals whether investors find corporate tax return information to be incrementally useful. Most
companies prefer to keep information regarding their actual tax payments private (EY 2015); thus,
evidence regarding the usefulness of this information is important to both regulators and managers.
Several factors likely influence investor perceptions of the costs and benefits of tax return
disclosure. If investors believe a salient, public disclosure of tax return information will impose
increased net costs on firms, I expect them to react negatively. For example, investors could
anticipate that the disclosure will result in public outcry and backlash if the public perceives firms
do not pay their “fair share” of taxes. Beyond costly protests and boycotts (e.g., scrutiny of
Starbucks in the U.K.), this public pressure could force the ATO or lawmakers to increase scrutiny
of firms’ taxes and lead to more extensive audits of companies or new legislation combating
corporate tax avoidance, increasing tax costs.
On the other hand, investors could react positively for two reasons. First, investors could
anticipate the public disclosure will incrementally lower cost of capital by enhancing information
transparency and decreasing information asymmetry. As in the U.S., it is difficult to estimate
Australian taxable income based on financial statement information alone (Hanlon 2003, Lisowsky
2009, Tran 2015); thus, the disclosure of precise Australian tax payments could reduce investor
uncertainty regarding a company’s tax position and help investors better forecast future cash flows.
Second, investors could expect public disclosure to reveal new information about firms’ tax
avoidance. Prior studies theorize that firms’ tax planning activities are conducive to managerial
rent extraction (e.g., Desai and Dharmapala 2006; Desai, Dyck, and Zingales 2007). More precise
3
information regarding tax avoidance would allow shareholders to better monitor firms’ tax
behavior and constrain managerial opportunism arising from tax avoidance, thus increasing
shareholder value. Because it is unclear whether the perceived (potential) costs or benefits
associated with the public disclosure of tax return information dominates, I examine this question
empirically.
To examine these market perceptions, I use the multivariate regression model (MVRM)
from Schipper and Thompson (1983) to test stock returns in the 3-day window around four key
events leading up to the passage of the transparency bill. Starting with the government’s
announcement of the transparency initiative and ending with final bill passage, each of the four
event dates either clarifies details about the disclosure rule or increases expectations of the
probability of passage. Across the four events, I find an overall small, positive market reaction to
the transparency bill, which suggests investors anticipated the net benefits of disclosure exceed the
costs. However, interestingly, the market reacted negatively to the two earlier event dates, which
received much greater media coverage than the last two events. The market reaction to the latter
two event dates is positive and reverses the initial negative reaction. This suggests the media
initially influenced overall investor perceptions of the costs of tax return disclosure, but the market
re-evaluated the net costs and benefits as certainty of the bill’s passage increased.3 In additional
cross-sectional analysis, I find evidence consistent with investors anticipating net costs of
disclosure for firms more likely to face increased scrutiny for their corporate taxes, though market
reactions are generally small in magnitude.
Next, I examine the market reaction to the issuance of the ATO tax report on December
17, 2015, to test whether investors value tax return information. Whereas my previous tests
3 It is possible that the differing market reaction across event dates is driven by variation in investor sophistication
and, thus, susceptibility to media influence. I will explore this explanation for my results in future drafts.

4
investigate market ex ante perceptions of the costs and benefits of disclosure, this test addresses
whether tax return disclosure is informative. If the disclosure reveals new information that changes
investors’ assessment of firms’ tax costs, I expect a significant market reaction to the ATO tax
report. In contrast, if the information contained in the report is redundant, irrelevant, or untimely,
then I do not expect a market reaction. Consistent with the latter, I do not find evidence of a
significant market reaction in the 3-day window around the ATO report release.4
Taken together, these results suggest that, on average, firms did not experience
overwhelming negative capital market consequences in relation to the tax transparency bill. Thus,
the evidence provides little support for a prediction that firms will respond to the tax disclosure
rule with real changes in behavior consistent with lawmakers’ goals of reducing tax
aggressiveness. In a preliminary test of firms’ effective tax rates using the limited time series data
currently available, I do not find evidence that firms reduced their tax avoidance behavior in
reaction to the transparency bill. A more thorough investigation of whether firms change tax
avoidance behavior as a result of the bill is an important and interesting avenue for future research
once more time series data is available.
My study makes several contributions. First, as noted in Leuz and Wysocki (2016), we
have little evidence of the economic effects of novel disclosure regulation. To my knowledge, my
study is one of the first to examine the capital market consequences of mandatory tax return
disclosure and serves as a first step towards answering the call for more research in this area of the
disclosure literature.5 I also advance the growing literature examining the consequences of public
4 In future work, I will examine whether the disclosure of corporate tax return information is associated with analyst
forecast revisions or improved earnings forecast accuracy as evidence of the usefulness, if any, of this information. 5 In a concurrent working paper, Hoopes, Robinson, and Slemrod (2016) examine consumer sentiment, investor
reaction on two dates related to the disclosure rule, and descriptive evidence of changes in companies’ reported income
and taxes paid using aggregated private data from the ATO.
5
disclosure of tax return information. Prior archival studies of public tax return disclosure focus on
whether taxpayers change their tax avoidance behavior (e.g., Bø, Slemrod, and Thoresen 2015;
Hasegawa et al. 2013). My study is unique in that it examines how investors react to and use public
tax return disclosures and can inform predictions about future firm behavior.
Second, examining the consequences of mandatory tax return disclosure is important for
tax policy. Tax avoidance and tax transparency are key areas of concern across many jurisdictions.
In April 2016, the European Commission introduced a proposal to require public country-by-
country reporting for large multinational companies operating within the European Union (EU)
(European Commission 2016).6 Although public tax return disclosure is not a policy currently
under discussion in the U.S., lawmakers proposed mandatory disclosure of tax return information
as recently as 2003, and President Obama’s Framework for Business Tax Reform highlighted tax
transparency once again in 2012 (Hasegawa et al. 2013), and U.S. multinational companies are
subject to disclosure rules in other jurisdictions.
Finally, understanding the impact of the Australian tax transparency rule on firm value is
also important to managers, particularly those in the U.S., who generally oppose any public
disclosure of tax return information and who are increasingly concerned about their firms’ tax
reputation (EY 2015). My results suggest that overall, there are benefits associated with modest
increases in tax transparency, which may motivate firms to voluntarily disclose more information
about corporate taxes to their investors.
6 Specifically, companies with annual global revenues exceeding EUR 750 million must publish a public report
disclosing on a country-by-country basis the nature of the company’s activities, number of employees, net turnover,
pre-tax income, tax accrued, tax paid, and accumulated earnings in each EU member country. Companies must also
disclose aggregated information for non-EU operations. However, companies must separately report any operations
in tax haven countries (European Commission 2016).

6
2. Prior Literature and Background
2.1 Mandatory Disclosure
Accounting information and other disclosures serve two pivotal roles in capital markets:
(1) facilitate the efficient allocation of capital by reducing information asymmetry between those
inside (e.g., managers) and outside (e.g., investors, creditors) of the firm; and (2) mitigate agency
problems that exist when there is separation of control and ownership (Beyer et al. 2010, Healy
and Palepu 2001). Beyond the investment context, accounting information and disclosures are also
important to other stakeholders, such as competitors, tax authorities, and regulators. However,
information is costly to collect and disseminate, disclosures often impose proprietary costs, and
disclosures have the potential to reveal information that increases external scrutiny, such as from
a tax authority.
There are many sources of corporate information, but mandatory disclosures are most
relevant to my study.7 Mandatory disclosures include information contained in firms’ financial
statements and other non-voluntary information. Studies in this area examine the effects of changes
in accounting standards and new disclosure requirements, generally focusing on quantifying
economic consequences of disclosure (i.e., stock market reactions) and whether changes in
disclosure provide incremental, value relevant information to users.8 A related mandatory
disclosure study in a tax setting is Frischmann, Shevlin, and Wilson (2008), which examines both
7 Much research focuses on the determinants and consequences of voluntary disclosure by firms, such as management
forecasts and earnings guidance (Beyer et al. (2010) and Healy and Palepu (2001) review this literature). Information
intermediaries, including analysts (e.g. DeFond and Hung (2003) and Givoly and Lakonishok (1979); Ramnath, Rock,
and Shane (2008) review the literature) and the media (Bushee et al. (2010); Drake, Guest, and Twedt (2014); Fang
and Peress (2009); and Miller (2006)), also provide corporate financial information to firm outsiders. 8 Studies examining changes in accounting standards or financial statement disclosures include Ayers (1998), Barth
(1994), Dhaliwal et al (1999), and Espahbodi et al. (2002). New disclosure regimes include the Sarbanes-Oxley Act
of 2002 (e.g., Jain and Rezaee 2006; Li, Pincus, and Rego 2008; Zhang 2007), and the U.S. Securities and Exchange
Commission’s adoption of enhanced executive compensation disclosures (Robinson et al. 2011) and risk factor
disclosures (Campbell et al. 2014).
7
the economic consequences of adopting FASB Interpretation No. 48 (FIN 48) and investor
valuation of initial FIN 48 disclosures. Contrary to critics’ warnings that the mandatory disclosure
of tax reserves would impose tax costs, Frischmann et al. (2008) find no evidence that investors
anticipated significant costs of disclosure but find some evidence of a positive market reaction at
the release of initial FIN 48 disclosures.
In these prior studies, standard-setters and regulators require firms to disclose certain
financial information, which leads to the possibility of noncompliance (e.g., Robinson, Xue, and
Yu 2011; Ayers, Schwab, and Utke 2015). In the context of this paper, a governmental entity –
specifically, the tax authority – is the source of tax return information. From the user’s perspective,
this centralization reduces the potential for reporting noncompliance and provides greater
confidence in the reliability of the disclosure. The report also allows for direct comparison between
companies that would be less salient if users must individually collect the same information from
different companies’ reports. From the firm’s perspective, there are no incremental compliance
costs because no additional information gathering or effort is required.
Finally, Leuz and Wysocki (2016) posit that mandatory disclosures are increasingly used
to incentivize or discourage corporate behavior in lieu of explicit regulations.9 In line with this
view, Australian lawmakers specifically stated that a key goal of the tax transparency bill is to
discourage tax aggressive behavior. In the present study, by testing the capital market
consequences of disclosure, I provide initial evidence that informs predictions about future firm
behavior. Examining the real effects of public tax return disclosure, such as testing for changes in
9 Lawmakers concerned about tax aggressiveness can explicitly prohibit certain tax planning techniques instead of
indirectly addressing aggressive behavior by mandating disclosure of tax return information. Australian lawmakers
subsequently enacted a comprehensive anti-avoidance bill, Tax Laws Amendment (Combating Multinational Tax
Avoidance) Bill 2015, effective January 1, 2016, on December 3, 2015. Alternatively, governments can attract taxable
income to their jurisdictions through tax incentives, such as lower tax rates on innovation-related income (e.g.,
Bradley, Dauchy, and Robinson 2015; Chen et al. 2016; Evers, Miller, and Spengel 2015).

8
tax avoidance behavior, cost of equity, or cost of debt, is a fruitful avenue for future research.
2.2 Public Disclosure of Tax Return Information
A small but growing literature explores the theoretical consequences of public disclosure
of tax return information and taxpayer behavioral responses. Advocates of public disclosure name
several potential benefits. First, the threat of public “shaming” would discourage tax aggressive
behavior (Kornhauser 2005; Lenter et al. 2003). Thorndike (2002) and Pomp (2003) argue
publicity would encourage companies to be honest and forthcoming about their taxes. Recent
practitioner surveys of managers find that an increasing proportion of firms are concerned about
how the media and the public view their tax activities (EY 2014, PwC 2014, Taxand 2015),
suggesting firms would be sensitive to shaming. However, empirical studies of the reputational
consequences of tax aggressiveness and negative publicity surrounding firms’ taxes do not find
that firms respond by constraining tax avoidance behavior (Chen et al. 2016, Gallemore et al.
2014). Second, disclosure of tax return information would be useful to investors and creditors,
echoing the broader roles of accounting information discussed previously (Avi-Yonah and Siman
2014, Lenter et al. 2003). Third, the revelation of corporate tax return information would increase
public pressure on politicians and regulators to adopt and enforce good tax policy (Lenter et al.
2003). Finally, disclosing tax return information would enhance the enforcement function of tax
authorities by recruiting the public to act as “watchdogs” to detect noncompliance (Blank 2014).
On the other hand, opponents of public tax return disclosure cite several arguments against
the policy. First, in contrast to the claim that public disclosure would have a deterrence effect, an
unintended consequence of disclosure could be increased noncompliance and aggressive behavior
(Blank 2009, 2014; Lenter et al. 2003). Specifically, Blank (2014) argues that knowledge of other
9
firms’ tax payments would put pressure on mangers to similarly minimize their tax obligations.10
Second, public disclosure of corporate tax return information would expose proprietary
information (Blank 2014; Lenter et al. 2003; TEI 2002, 2006). Finally, the complex nature of tax
returns could cause confusion and misinterpretation of tax return information rather than improved
transparency, especially when the tax return only covers a portion of the firm’s global operations
(Blank 2014; Lenter et al. 2003; TEI 2002, 2006).
Two studies empirically examine whether taxpayer behavior changes under a public
disclosure regime and demonstrate that the results for one group of taxpayers do not necessarily
generalize to other settings. Hasegawa et al. (2013) find Japanese taxpayers near the disclosure
threshold under-report income to avoid disclosure, and corporations subject to disclosure did not
reduce their tax avoidance. In Norway, however, Bø et al. (2015) find that business owners
increased reported taxable income once individual tax payments became publicly available via the
internet, which does suggest a deterrence effect of disclosure.
These empirical studies do not explore the capital market consequences of public tax return
disclosure, however. Only a handful of countries allow public access of individual and/or corporate
tax return information. Norway, Finland, Iceland, Sweden, and Denmark are small economies, and
several of these countries require application for information access (Bø et al. 2015). Japan, a large
economy, initiated public disclosure of both individual and corporate tax return information in
1950 and abolished the disclosure regime in 2004. Thus, the recent Australia initiation of a public
disclosure regime provides a unique opportunity to examine capital market implications of tax
return disclosure in a time of heightened public attention of corporate tax issues.
10 Blaufaus, Bob, and Otto (2014) test the effect of public disclosure on tax compliance in an experiment and find that
the “contagion” effect of noncompliance dominates the “shaming” effect, suggesting public disclosure would lead to
more tax evasion overall.

10
2.3 Australia Tax Transparency Bill
The Australian Parliament passed Tax Laws Amendment (2013 Measures No. 2) Act 2013
on June 28, 2013, to improve tax transparency. In the explanatory memorandum for the bill,
lawmakers expressed concern about tax-motivated income shifting and base erosion and other
aggressive tax avoidance strategies.11
Under the new rule, the ATO must publish the following line items from Australian
corporate tax returns for companies with total income exceeding AUD 100M:
Company name and Australia Business Number (ABN)
Total income (item 6(S))
Taxable income (item 7(T)) [if greater than zero]
Income tax payable [if greater than zero]
The rule is effective starting with the 2013/2014 tax year, and the ATO published its first report
on December 17, 2015, about 18 months after the end of the tax year. This report included 1,539
Australian and foreign public companies as well as foreign private entities. The ATO published its
second report on March 22, 2016 for 321 Australia-resident private companies with total income
exceeding AUD 200M.
Anecdotal evidence suggests firms were concerned about the public perception of their tax
activities leading up to the release of the ATO report, particularly those previously in the public
spotlight for their taxes. For example, the Luxembourg tax leaks in 2014 named AMP Limited as a
company using income-shifting strategies to avoid tax, and BHP Billiton, one of the largest companies
in Australia, faced a Senate inquiry for using a Singapore haven (Chenoweth 2014, 2015). On March 26,
2015, AMP Limited published its first Tax Report, a separate document from its annual report,
11 Examples of studies examining tax-motivated income shifting include Collins, Kemsley, and Lang (1998); De
Simone (2016); Hines and Rice (1994); Huizinga and Laeven (2008); Klassen, Lang, and Wolfson (1993); and Klassen
and Laplante (2012).
11
highlighting the company’s taxes paid and tax strategy.12 BHP Billiton also announced in 2015
that it would publish a detailed annual tax report. BHP Billiton’s chief financial officer directly
responded to criticisms of the firm’s tax strategies through an opinion piece published in a top-ten
Australian newspaper (see Appendix B). These responses underscore the importance managers
place on public perception and market valuation of tax return information disclosure.
3. Hypotheses
3.1 Anticipated Net Costs and Benefits of Disclosure
Several competing factors likely influence whether investors anticipate net costs or benefits
of disclosure. Public disclosure of tax return information could be costly for a number of reasons.
First, investors could anticipate increased public scrutiny of companies’ taxes due to the “name
and shame” nature of such a disclosure. This could increase public pressure on the tax authority
and regulators to better address tax aggressive behavior and ultimately increase tax costs for firms.
Second, beyond tax costs, public scrutiny would also be costly if the outrage leads to protests or
boycotts and ultimately damage a company’s brand.13 If investors are concerned public disclosure
will impose these additional costs on firms, then I expect an overall negative market reaction to
the bill.
On the other hand, investors could anticipate several benefits of disclosure. First, in line
with prior literature that finds higher reporting quality reduces information asymmetry and thus
lowers cost of capital (e.g., Diamond and Verrechia 1991), investors could anticipate that greater
tax transparency will also reduce information asymmetry. Corporate tax law is a complex area and
prior studies document that analysts, who are considered sophisticated financial statement users,
12 Accessed: http://shareholdercentre.amp.com.au/phoenix.zhtml?c=142072&p=irol-reports 13 The possibility of costly public backlash is not improbable. Anecdotally, Starbucks faced tremendous public scrutiny
after a Reuters report revealed the company’s low tax payments relative to its revenues in the UK (Bergin 2012, 2014).
Starbucks subsequently agreed to “voluntarily” over USD 15M in UK taxes (Boyle 2013).

12
have difficulty incorporating tax-related information into their earnings forecasts (Chen and
Schoderbek 2000, Plumlee 2003, Weber 2009).14 The disclosure of firms’ tax payments could
reduce uncertainty regarding a company’s tax position and improve investors’ ability to forecast
future cash flows. If investors anticipate these informational benefits, then I expect an overall
positive market reaction to the transparency bill.
Second, investors could expect the tax return disclosure will reveal new information about
firms’ tax avoidance. This information would allow shareholders to better monitor firms’ tax
avoidance activities. If investors share lawmakers’ concerns that firms are engaging in risky and
aggressive tax strategies, then they would value information that enables them to constrain
unwanted behavior. Further, prior studies theorize that the opaque nature of many tax aggressive
strategies provide management the opportunity to extract rents (Desai and Dharmapala 2006, Desai
et al. 2007).15 To the extent that investors anticipate tax return information will increase their
ability to constrain opportunistic managerial behavior, these factors predict a positive market
reaction to public disclosure.
Ex ante, it is unclear which of these competing effects will dominate. Thus, I make no
directional prediction of investor perceptions of the net costs and benefits of public tax return
disclosure and formally state my first hypothesis in the null:
H10: There is no market reaction to events that increase the probability of mandatory public
disclosure of corporate tax return information.
3.2 Value Relevance of Corporate Tax Return Information
Next, I examine whether investors value the corporate tax return information contained in
14 In contrast, more recent work suggests that analysts can forecast effective tax rates more accurately than
management when there is high complexity (Bratten et al. 2016), but this level of sophistication likely does not
generalize to all market participants. 15 For example, Desai (2005) describes in detail how Tyco’s tax avoidance strategies enhanced executives Dennis
Kozlowski and Mark Swartz’s ability to extract company funds for their personal benefit.

13
the ATO report. Here, I am interested in testing whether the tax return disclosure contains new
information for investors, whereas my previous hypotheses relate to market perceptions in
anticipation of the report. If the ATO report contains new information that changes investors’
assessment of firms’ tax payments, then I expect a significant market reaction on the date of the
report release. This could be the case if financial accounting rules lead to differences between a
company’s actual tax payment and taxes reported in the financial statements.
On the other hand, investors would not find the ATO report valuable if it provides
information that is redundant, irrelevant, or lacks timeliness, and I would expect no market reaction
on the report release date. For example, if investors can accurately predict Australian taxable
income or tax payments, then the report will not be an information event. A simple, domestic-only
company with few book-tax differences likely reports similar tax payable amounts in both its
financial statements and tax return, leading to little surprise on the report release date. However,
investors are less likely to find Australian tax return information relevant if companies have
extensive foreign operations and pay a large portion of their taxes overseas. In this case, the
Australian disclosure would only provide a piece of the full picture of companies’ tax activities.
Finally, the report could be uninformative because it relates to a reporting period that is already
over a year stale. Given these competing predictions, I again state my hypothesis in the null:
H20: There is no market reaction to the public disclosure of firms’ tax return information.
4. Research Design
4.1 Event Selection
I identify four events that provide investors with new information regarding the bill or
impact investors’ expectations regarding the probability of bill passage. Each event increases the
probability of passage as there is no indication in the legislative process of sufficient opposition to

14
cause the bill to fail to pass.
My first event is the announcement on February 4, 2013, by Assistant Treasurer David
Bradbury of the government’s intention to improve corporate tax transparency with some form of
public tax disclosure. This was a largely unanticipated announcement and practitioners were
surprised by the initiative. The Sydney Morning Herald reported that the executive director of the
Corporate Tax Association “had not heard of any other country targeting taxpayer confidentiality
in a bid to pressure firms” (Yeates 2013).
Second, on April 3, 2013, the Treasury released a discussion paper, Improving the
Transparency of Australia’s Business Tax System, outlining the proposed tax transparency bill.
This discussion paper specified the AUD 100M disclosure threshold and proposed reporting of
company name and unique Australian Business Number (ABN), total income, taxable income, and
income tax payable. The Treasury allowed a three week comment period, which further indicates
market participants would have paid attention to the release of the discussion paper. I consider this
a major information event, because the disclosure threshold and exact line items to be disclosed
were previously unknown.
Third, I include May 29, 2013, the date the House of Representatives introduced the bill.
On this date, the Clerk of the House reads the long title of the bill, members of the House receive
copies of the bill and explanatory memorandum, and the Parliament publishes the full text of the
bill on its website (www.aph.gov.au/bills) (Parliament of Australia 2016). The language of the bill
is confidential up this date. However, as the bill is not significantly different from the proposed
legislation, I consider this an event that increased probability of passage rather than an information
event.
My final event date is June 28, 2013, when both Houses passed the transparency bill. The

15
Governor-General’s assent of the bill occurred shortly thereafter on June 29, 2013. As the bill
moved quickly through the House and Senate with few changes to the tax transparency proposal,
I do not include any intermediary dates. The final date of law passage resolves any potential public
uncertainty regarding the ultimate nature of the bill or the probability of passage. Table 1
summarizes these events.16
4.2 Multi-Event Study
I test for market reactions to the events leading up to the passage of the tax transparency
bill (H1) using the multivariate regression model (MVRM) proposed by Schipper and Thompson
(1983). Examining abnormal returns on a security-by-security basis for contemporaneous events
can lead to unreliable statistical inferences due to cross-correlation and cross-sectional
heteroscedasticity in residuals (e.g., Campbell, Lo, and MacKinlay 1997; Espahbodi et al. 2002;
Frischmann et al. 2008; Sefcik and Thompson 1986). This is most evident in events surrounding
legislative or regulatory events as these events occur on the same calendar date for all firms in the
sample. Further, firms affected by a legislative or regulatory event are often in the same industry
or share other common factors (here, size due to the income threshold for disclosure). To account
for these econometric concerns, I test for market reactions on a portfolio basis using MVRM.
Specifically, I estimate the following OLS regression:
16 I exclude events after the transparency bill passed. On November 24, 2014, the Labor Government proposed an
amendment to the tax disclosure rule to accelerate the effective date to the 2012/2013 tax year. It is clear from the
Finance Minister’s immediate dismissal of the proposal that there was little credible probability of bill passage, and
the bill did not advance in the legislative process (Khadem 2014). On March 13, 2015, the ATO issued a consultation
paper, Tax Secrecy and Transparency: Administrative Arrangements for Reporting Entity Information, outlining the
administrative process for public disclosure. As this report simply clarified procedural issues, I do not consider it an
information event for market participants. Lastly, a number of legislative events occurred between August and
December 2015 related to the exemption from and subsequent re-inclusion of privately-owned Australian resident
companies in the disclosure rule. Although the treatment of private companies could indirectly affect market
participants’ evaluation of the costs and benefits of disclosure for public companies, I do not include these events
because significant tax reform proposals also occurred during this time. Specifically, the Australian government
passed substantial legislation to curb tax aggressive strategies, Tax Laws Amendment (Combating Multinational Tax
Avoidance) Bill 2015, on December 3, 2015, which would confound any measured market reactions for large, public
companies to changes in the public tax disclosure rule.

16
𝑅𝑝𝑡 = 𝛼𝑝 + 𝛽𝑝𝑅𝑚𝑡 + ∑ 𝑔𝑝𝑘𝐷𝑘𝑡𝐾𝑘=1 + 𝑒𝑝𝑡. (1)
Following Frischmann et al. (2008), Rpt is the portfolio (p) return computed for day t for all
firms anticipated to be subject to the disclosure rule based on a financial statement proxy for total
income. I calculate companies’ daily stock returns using data from Computat Global Security
Daily. Rmt is the daily market return, which I measure using the ASX All Ordinaries Index (from
Thomson Reuters Datastream/Worldscope). This index includes the 500 largest listed companies
on the ASX by market capitalization and accounts for 76 percent of the Australian equity market
as of April 2016. My period of estimation is January 1, 2013 (prior to the initial announcement of
the tax transparency initiative) through December 31, 2013, and Dkt is an indicator variable set
equal to one for the three-day period surrounding the kth event date. Estimated coefficients on Dkt
capture the cumulative abnormal returns surrounding each event date. I interpret a positive and
significant cumulative reaction to the events as anticipated net benefits of the legislation whereas
a negative reaction indicates anticipated net costs.
4.3 Release of ATO Tax Transparency Report
I follow the same MVRM event study methodology detailed above to test for market
reactions to the release of the ATO’s report (H2) because the common release date of companies’
tax return information generates similar econometric concerns discussed previously. Specifically,
I estimate equation (1) using a portfolio of publicly listed firms that appear on the ATO’s report.
Rpt as the equally-weighted daily portfolio return of this sample of firms and Rmt is the daily market
return as defined previously. However, for purposes of testing whether there is any market reaction
to the report release, I use absolute value of stock returns rather than signed returns. I begin my
estimation period on December 7, 2015, and end the estimation period on March 18, 2016, to avoid

17
significant confounding tax events.17 Dkt is an indicator variable set equal to one for the three-day
period surrounding the release of the ATO report on December 17, 2015.
5. Data and Sample
My sample for testing the stock market reaction to the public disclosure rule includes
Australian listed firms at the intersection of Compustat Global Fundamentals Annual and
Compustat Global Security Daily. As detailed in Panel A of Table 2, I retain 371 firms with total
revenue (REVT) over AUD 100M in my sample of firms expected to be subject to the disclosure
rule.18 After eliminating firms missing daily returns data, my final event study sample includes
348 unique firms. Additional data requirements to test for cross-sectional variation in market
reaction reduces my sample to 317 unique firms.
To test the stock market reaction to the release of the ATO report, I begin with the list of
1,539 companies from the report and match the companies to GVKEY identifiers from Compustat
Global.19 I eliminate 912 proprietary limited companies (“Pty Ltd”) as these are private companies.
For the remaining 627 companies, I match company names and manually inspect the matching
procedure for accuracy, including confirming whether any corporate name changes that occurred
during 2015 create a discrepancy between Compustat and the ATO report.20 Panel B of Table 2
17 Several confounding tax-related legislative events occurred in 2015, including the passage and subsequent reversal
of an amendment exempting private Australian companies from the tax return disclosure requirement. Further, as
noted above, Parliament passed the Combating Multinational Tax Avoidance Bill on December 3, 2015, which
addresses issues such as country-by-country reporting and transfer pricing and income shifting strategies. Thus, I
begin my estimation period on December 7, 2015. I end my estimation period on March 18, 2016, prior to the release
of the private company tax transparency report on March 22, 2016. 18 Alternative sources of financial statement and returns data for non-U.S. firms include the Thomson Reuters
Datastream/Worldscope database and BvD’s Orbis database. I use data from Compustat Global for my market reaction
tests as it provides more detailed variables than the other data sources (e.g., availability of a variety of tax-related
variables). However, one caveat in using these data sources is that they report consolidated numbers rather than
standalone Australian financial statement information. This imprecise proxy for tax return total income adds noise to
my empirical tests. 19 Report accessed: http://www.data.gov.au/dataset/corporate-transparency 20 I also confirm unmatched companies do not appear on the Australian Stock Exchange to ensure I am not missing
publicly listed companies.

18
shows I am able to match 336 listed firms appearing on the ATO report to a Compustat GVKEY
and generate a final sample of 306 unique firms with daily returns data necessary to conduct my
market reaction test.21 Data requirements for calculating additional descriptive variables reduce
my sample to 298 firms.
6. Results
6.1. Multi-Event Study
6.1.1 Market Reaction to Legislative Events
Table 3, Panel A describes the full sample of firms included in the multi-event study
sample. I winsorize all continuous variables at the top and bottom 1 percent to reduce the influence
of outliers. By construction, sample firms have total revenue greater than AUD 100M. These firms
are also large (by total assets) and profitable, on average. In comparison, the sample of Compustat
Global Australian firms with total revenue less than AUD 100M report mean total assets of 64.5,
pre-tax loss of 3.4, and return on assets of -0.39 (untabulated).
Panel B of Table 3 presents the market reactions for each event date leading up to the
passage of the tax transparency bill. The overall market reaction aggregated across all four events
is a small, but positive and significant, cumulative abnormal return of .0032 (p-value < 0.001).
This result suggests market participants anticipated overall benefits of the new tax legislation, such
as reduced information asymmetry and lower cost of capital or improved ability to monitor firms’
tax avoidance behavior.22
21 To ensure my match of firms is reasonable, I conduct a match by ABN to the BvD Orbis database and find 341
firms from the report are listed companies in BvD (i.e. valid ticker and ISIN). 22 My results are robust to alternative measures of the market index used in prior studies, including the ASX 100, ASX
200, ASX 300, Dow Jones Total Market Australia, Datastream Australia Total Return, and MSCI Australia Total
Return market indices (e.g., Asness, Moskowitz, and Pedersen (2013); Griffin, Kelly, and Nardari (2010); Ogneva
and Subramanyam (2007)). Results are also robust to dropping any sample firms with earnings announcements
occurring within the 5-day window around my events. Finally, there is no significant cumulative market reaction for
a sample of firms just missing the disclosure threshold with total revenue between AUD 90-100M.

19
Interestingly, this positive market reaction is driven by the last two events, which reverse
negative reactions to initial announcements of the transparency rules. In exploring potential
explanations for this returns pattern, I find there was far greater media coverage of the initial
announcements of the transparency in comparison to the last two events. The tone of the media
coverage is generally negative, describing the legislation as an effort to “name and shame”
companies. Thus, it is possible that heightened media attention around the first two events led
investors to anticipate net costs of disclosure to exceed the benefits. Once investors confirmed that
the actual requirements of the bill are no more severe than the proposed rules and absent media
influence, it appears investors re-evaluated the cost and benefits of disclosure.
6.1.2 Additional Cross-Sectional Analysis
I next consider whether certain firm characteristics affect event-date reactions.
Specifically, I predict investor reaction to the public tax disclosure rule is negative for firms more
likely to face increased tax costs as a result of disclosure. I use the portfolio weighting procedure
developed by Sefcik and Thompson (1986) to test for cross-sectional variation, consistent with
several prior studies of regulatory events (e.g., Espahbodi et al. 2002; Frischmann et al. 2008; Li,
Pincus, and Rego 2008). Because my firm characteristics of interest are each related to firms’
expected tax costs, I control for firms’ level of tax avoidance using firms’ effective tax rate (ETR)
in my cross-sectional analysis. Consistent with Dyreng, Hanlon, and Maydew (2010), I calculate
ETR as total tax expense (TXT) divided by pre-tax income (PI) adjusted for special items (SPI)
and re-set negative ETRs to zero and ETRs greater than one to one.
I use three proxies to capture firms that are likely to face increased tax costs. First, I expect
firms engaging in greater tax avoidance could face greater public scrutiny of their tax strategies.
However, in contrast to tax avoidance incentives in the U.S. to maximize after-tax profits, the
20
dividend imputation system in Australia gives rise to more nuanced predictions of firm tax
avoidance behavior (Bellamy 1994, Ikin and Tran 2013). An imputation system eliminates double
taxation on corporate income by assigning imputation credits to shareholders when the firm pays
dividends. Shareholders can use these credits to offset their personal tax liability. Thus, firms
whose shareholder base benefit from imputation credits, namely Australian individuals and
superannuation funds (pension funds), have incentives to pay the full amount of corporate tax and
pass on imputation credits to shareholders. On the other hand, firms whose shareholder base do
not benefit from imputation credits, such as foreign investors, have incentives to engage in tax
avoidance to maximize after-tax profit.23 To capture these nuances in tax avoidance incentives, I
use shareholder data obtained from Bureau van Dijk (BvD)’s Orbis database to calculate
percentage ownership by non-resident (foreign) shareholders (PctForeign) and individuals and
superannuation funds (PctIndSuper). BvD’s detailed categorization of shareholder type is
advantageous for purposes of this cross-sectional test. I proxy for prior years shareholder base
using 2016 data because historical ownership information is not available from Orbis.24
Second, I predict investors react more negatively to public disclosure for firms perceived
to face greater tax uncertainty. Specifically, if a firm has high effective tax rate volatility, measured
as VOL, which is the standard deviation of ETR over a 5-year period (Guenther, Matsunaga, and
Williams 2016), investors could infer the firm is engaging in risky strategies that lead to varied
outcomes. Thus, investors could anticipate increased tax costs as a result of public disclosure.
Finally, I predict investors react more negatively to public disclosure for firms subject to
23 See Appendix A.2 for additional discussion of Australia’s dividend imputation system. 24 Although this data limitation introduces measurement error, there is evidence that Orbis ownership data is
reasonably reliable within a three-year window (Shroff, Verdi, and Yu 2014). Further, I confirm using an alternate
source of ownership data, FactSet, which captures institutional ownership, that percent ownership of Australian
companies by shareholder type is “sticky” over time.

21
negative media coverage of their tax strategies in the three years prior to the passage of the tax
transparency bill. Given that a firm previously experienced public scrutiny for its tax practices, it
is likely investors anticipate a highly salient tax disclosure to lead to further public scrutiny. To
identify instances of negative media coverage of taxes in the business press, I gather news articles
about companies’ taxes published in the top Australian news sources from the Factiva database
for the period 2010 to 2015.25,26 I use a text string search and filter by Factiva’s company identifiers
to find tax-related media mentions of companies anticipated to be subject to the ATO disclosure.
Specifically, I search the following text string: ("tax*" near5 (avoid* or dodg* or evasion* or evad*
or fraud or shelter* or loophol* or abus* or disput* or investigat* or scandal* or accus*)). This
search produced 851 potential negative tax articles. I then read the articles to confirm whether the
media attention is critical or reveals negative information about a firm’s taxes. I set the indicator
variable Media equal to one for firms that experience any negative media attention for their taxes
in years prior to the legislative events and zero otherwise.
Descriptive Statistics and Results
Table 4, Panel A shows that firms in my sample report mean ETR below the Australian
statutory corporate tax rate of 30 percent, suggesting firms engage in some tax avoidance, on
average. Firms’ shareholder base and ETR volatility vary substantially. The large proportion of
foreign ownership reflects Australia’s economic position as a net importer of direct investment
(Altshuler, Shay, and Toder 2015). Finally, only a small fraction of firms (2.84%) were the subject
of a critical news article about their taxes in the prior 3-year period. Panel B presents correlations
25 I extend my search through 2015 to capture articles published around the actual ATO report release. 26 I search the following news sources: Sydney Morning Herald, Daily Telegraph, Herald Sun, The Age, Courier-Mail,
The Australian, West Australian, Adelaide Advertiser, Sunday Times, and Financial Review. These news sources are
the top ten newspapers ranked by print and digital readership as of December 2015 and account for over 90% of total
readership. Data collected by Roy Morgan Research (Accessed:
http://www.roymorgan.com/industries/media/readership/newspaper-cross-platform-audience).

22
between the cross-sectional variables of interest. Consistent with prior studies documenting the
association between shareholder base and tax avoidance, ETR and PctForeign (PctIndSuper) are
negatively (positively) correlated.27 VOL is also negatively correlated with ETR; however, Media
is not significantly correlated with other variables of interest.
Panel C of Table 4 reports the results of testing for cross-sectional variation in market
reaction to the tax transparency bill. Consistent with predictions related to tax avoidance and
shareholder base, firms with greater foreign ownership experience an overall negative market
reactions to the tax transparency bill. Given these shareholders prefer high levels of tax avoidance,
the results suggest investors anticipate increased tax costs – perhaps in the form of public pressure
for firms to reduce tax avoidance – as a negative outcome of public disclosure. In contrast, firms
with greater individual and superannuation fund ownership experience positive market reactions
to the bill. These shareholders prefer companies engage in low levels of tax avoidance. Thus,
investors are less concerned about increased tax costs. Instead, investors perceive net benefits of
disclosure, such as reduced information asymmetry.
The overall market reactions to a portfolio weighted by VOL is negative, consistent with
the hypothesis that investors anticipate net costs of public disclosure for firms that appear riskier
or exhibit greater tax uncertainty (Guenther et al. 2016; McGuire, Neuman, and Omer 2013). In
Panel D, I exclude firms with current year losses because investors may anticipate differential
costs and benefits for profitable vs. loss firms. The results for shareholder base and tax uncertainty
are consistent to those for the full sample. I find limited support that investors anticipate increased
tax costs related to public disclosure for firms previously subject to negative media attention. The
27 The mean ETR for firms in the top quartile of foreign shareholder ownership is 21.82 percent whereas the mean
ETR for firms in the top quartile of domestic individual and superannuation fund ownership is 30.21 percent. This is
again consistent with expectations of differing shareholder preferences for tax avoidance.
23
overall market reaction for the full sample is insignificant in Panel C; however, the market reaction
is negative and significant when I exclude loss firms in Panel D. Given the low occurrence of
negative media attention in my sample, I am cautious interpreting this result.
6.2 Release of ATO Tax Transparency Report
6.2.1 Descriptive Statistics
Panel A of Table 5 provides descriptive statistics for all 1,539 companies included the
ATO’s Tax Transparency Report released on December 17, 2015. As described previously, this
sample includes both publicly listed Australian companies and foreign-owned public and private
entities. The ATO amounts are denominated in millions of AUD. As expected, firms report a high
amount of gross income (mean of 1,058.4), but 30 percent of firms report zero or negative taxable
income and 38 percent report zero or negative tax payable.
Panel B describes reporting firms that I can match to Compustat Global financial statement
and daily returns data. The Compustat sample firms report more gross income (mean of 2,659.62)
than the full report sample and are overall large companies based on total asset size. Only 25
percent report zero or negative taxable income, but a similar percentage, 37 percent, report zero or
negative tax payable.28
To descriptively explore differences between taxes reported in firms’ financial statements
and the ATO’s disclosure, I calculate the variable TaxSurprise by subtracting current tax expense
(TXC) from the actual income tax payable amount reported by the ATO and scale by total assets
(AT). current income tax expense from the company’s financial statements, which, due to its
exclusion of deferred tax expense (an accounting accrual), is the closest accounting number to a
28 My proxy for total income, Compustat total revenue (REVT), is not a perfect measure as the minimum total revenue
for this sample is less than AUD 100M, likely due to consolidated losses in other jurisdictions. However, gross income
from companies’ tax returns is highly correlated with total revenue with a correlation of 0.96 (p < 0.001).

24
company’s current year tax liability on its tax return.29 Alternatively, I also calculate TaxSurprise
as the difference between taxable income per the ATO report and imputed taxable income based
on financial statement disclosures. Imputed taxable income is equal to current tax expense divided
by the Australian statutory tax rate of 30 percent.
I report scaled and unscaled TaxSurprise in millions of AUD in Panel B. Between the 25th
and 75th percentiles, TaxSurprise is generally small, indicating firms’ current tax expense and
actual tax payment are not vastly different. This evidence suggests the ATO report contains
redundant tax information for a large proportion of firms. However, the minimum and maximum
amounts show that at the tails, TaxSurprise is large – in billions of AUD. In untabulated descriptive
statistics, I find that firms with multinational operations have, overall, much larger TaxSurprise
than domestic firms at both tails and appear more frequently in the bottom quartile of
TaxSurprise.30 This descriptive evidence is consistent with the ATO report providing different
information than a multinational firm’s financial statements (i.e., Australian taxes paid,
specifically), but this information is likely irrelevant for an investor evaluating the firm’s tax
position as a whole.
6.2.2 Market Reaction to Report
The results in Table 6 indicate there was no significant market reaction to the ATO’s
release of the Corporate Tax Transparency Report. In untabulated supplemental analysis, I also
test whether the market reacts to salient information such as when the ATO report the firm pays
zero tax or when the media name specific firms in their reporting of the public disclosure. I find
29 Nevertheless, due to differences between financial accounting and tax rules, current tax expense does not perfectly
match what a company reports on its tax return. Tran (2015) provides a summary of these key differences under
Australian rules. Another possible benchmark from firms’ financial statements is cash taxes paid. However, this
amount often includes payments and settlements related to other accounting periods. 30 I obtain variables indicating multinational operations (e.g., foreign assets, foreign sales) from Thomson Reuters
Datastream/Worldscope.
25
no significant market reaction in these tests. Though the report could have been informative to the
general public, investors do not seem to find the information incrementally value relevant.
Alternatively, it is possible that investors previously impounded any informational benefits of
disclosure at the events leading up to legislation passage.
6.3 Preliminary Analysis of Change in Corporate Tax Avoidance
The tests above document, on average, fairly small capital market effects of public
disclosure of tax return information. The finding that investors do not anticipate significant
negative consequences of disclosure suggests firms have minimal incentive to change their real
activities, whereas costly negative returns may have motivated firms to re-examine their tax
avoidance policies and disclosures. As a first step towards understanding the impact of public
disclosure of tax return information on firm tax avoidance, I test for a significant change in firms’
ETRs following the adoption of the tax transparency bill. I estimate an OLS model of ETR
regressed on an indicator variable, POST, and several control variables consistent with prior
literature (Ikin and Tran 2013) using the sample of firms included in the 2013/2014 ATO report
and including years 2010 to 2015.31 I do not find evidence that firms changed their tax avoidance
behavior in reaction to the transparency bill (untabulated), but caveat that there is very limited time
series data to conduct this test given the recency of the bill. Further, there could be interesting
cross-sectional variation in behavior to examine in future work.
7. Conclusions
I exploit a recent tax law change in Australia to examine the capital market consequences
of public disclosure of corporate tax return information. First, I examine market reactions to key
31 I also estimate a model including all other Compustat firms as a control group, a model where all other Compustat
firms with REVT greater than AUD 50M is the control group, and use cash ETR as my dependent variable and
similarly find insignificant estimated coefficients on POST.

26
events leading up to the passage of the tax transparency bill to test if investors perceive net costs
or benefits of tax return disclosure. I find an overall small but positive market reaction, which
suggests investors anticipate net benefits of disclosure and believe tax return information to be
useful for investing decisions. Cross-sectionally, I find evidence that firms likely to face increased
tax costs as a result of public disclosure experience negative market reactions.
Second, I examine the stock market reaction to the publication of the first transparency
report and find no significant market reaction. These results indicate that the tax return information
contained in the ATO report is not value relevant to investors, and descriptive evidence suggest
this is because the ATO report includes largely redundant information about companies’ taxes as
well as information that lacks relevance for firms with multinational operations.
This study is one of the first to investigate the informational consequences of public
corporate tax return disclosure and contributes to both the tax and disclosure literatures. These
findings are a first step towards understanding the effectiveness of such disclosure policies and are
important to a number of stakeholders. Corporate managers should be interested in understanding
how investors interpret and value tax return information and determining whether any additional
voluntary tax disclosures could be beneficial to the firm. Regulators and policymakers should also
be interested in understanding the consequences of mandatory disclosure. The goals of the
Australian transparency bill include both constraining tax aggressive behavior and providing
useful information about corporate taxation. This study strives to address the latter and finds
limited evidence that investors value tax return information, but more empirical work is needed to
evaluate whether using a mandatory disclosure achieves these goals.
27
Appendix A: Institutional Details
A.1 Australian Financial and Tax Reporting
Financial reporting in Australia is similar to the U.S. for public companies. Companies listed on
the Australian Securities Exchange (ASX) must file full audited financial statements with the
Australian Securities and Investments Commission (ASIC) following Australian accounting
standards, which are based on IFRS. Large private companies file limited “special purpose
financial statements” with the ASIC that generally do not comply with the full disclosure
requirements of Australian accounting standards.32 These special purpose financial statements are
available for purchase from the ASIC website on a per document basis, which provides more
transparency for private companies than occurs in the U.S.
In contrast to the U.S. worldwide system of taxation, Australia uses a territorial system that
generally exempts foreign source income from taxation (Altshuler et al. 2015). As discussed in
more detail in the next section, foreign income that is not subject to Australian corporate tax does
not generate imputation tax credits for shareholders. Differences in companies’ mix of Australian
vs. foreign income and the availability of certain deductions and tax credits lead to variation in
companies’ effective tax rates (Pattenden and Twite 2008).
Australian companies operate on a June 30th fiscal year end for financial accounting and tax
purposes. For tax purposes, the year ending June 30, 2014, is referred to as the “2013/2014 tax
year.” The tax return is due on the 15th day of the seventh month following year end. As such, most
companies file their return by January 15th.33
A.2 Australia Dividend Imputation System and Its Effect on Tax Avoidance Incentives
Corporate tax planning incentives differ in Australia compared to the U.S. because Australia’s tax
system “integrates” the corporate and individual tax.34 In 1987, Australia implemented a dividend
imputation system, which it simplified in 2002. In contrast to a classical system, such as the U.S.
dividend taxation system, an imputation system eliminates double taxation on corporate income.
When firms pay dividends from earnings that have been taxed, firms assign corporate income taxes
to shareholders through imputation credits. Shareholders can offset personal income tax payable
with imputation credits received.
32 For this requirement, a private company is considered large if it meets two or more of the following criteria: (1)
consolidated revenue of the company and controlled entities is AUD 25M or more, (2) year-end consolidated gross
assets of the company and controlled entities is AUD $12.5M or more, and (3) the company and its controlled entities
employ 50 or more employees at year-end. 33 Though extensions of time to file are possible, they are relatively uncommon. Firms may apply to the ATO for a
substituted accounting period, i.e., a year end different from June 30th. For example, a company with a December 31st
year end would be considered an “early balancer” and its 2013/2014 tax year refers to the year ending December 31,
2013. Conversely, a company with a September 30th year end would be considered a “late balancer” and its 2013/2014
tax year refers to the year ending September 30, 2014. 34 Other countries that have implemented a dividend imputation system include the U.K. (1973-1999) and Germany
(1977-2000).
28
A “franked” dividend indicates the firm has paid the full Australian corporate tax on the income
from which the dividends are paid, and shareholders are entitled to full imputation credits.
Unfranked dividends are paid from untaxed earnings (e.g., foreign source income) and thus do not
include a corresponding imputation credit. Firms may also distribute partially franked dividends,
which include both franked and unfranked dividends. Thus, firms subject to high effective tax rates
have a greater proportion of imputation credits to distribute than firms subject to low effective tax
rates.
Companies record franking credits in their franking account as taxes are paid. As companies
typically do not pay out 100 percent of earnings, companies frequently accumulate surplus credits
in their accounts. This pool of credits allows companies to frank a dividend even in years of low
profits or low tax payable. However, the franking credit cannot exceed the maximum amount of
income tax the company could have paid on the profits underlying the distribution. Appendix A
provides an example.35 Finally, a company cannot have a negative balance in its franking account
at year end.
Franking credits are only available on dividends paid from Australian resident companies to
Australian resident individual shareholders and other eligible shareholders. Intercompany
dividends are tax exempt and companies pass on any available imputation tax credits to the
ultimate shareholders (Pattenden and Twite 2008). Australian superannuation funds (pension
funds), a major investor in public companies, can also use imputation credits because, unlike in
the U.S., pension funds are subject to tax. Franked dividends are particularly attractive to this
group of institutional investors because these entities have a low marginal rate on investment
earnings (15%) and can use excess franking credits to reduce tax payable on other income or
receive a refund (Ikin and Tran 2013). On the other hand, companies with a predominantly non-
Australian (foreign) or tax-exempt (e.g., charities, certain not-for-profit organizations and
associations) shareholder base face less pressure to distribute franked dividends as their
shareholders would not realize the tax benefit of imputation credits (Bellamy 1994, Ikin and Tran
2013).
Consequently, an imputation dividend system gives rise to different corporate tax avoidance
incentives than a classical system. Firms whose shareholder base prefers franked dividends, such
as Australian residents and superannuation funds, and a high dividend payout ratio, have incentives
to maximize their pre-tax profits, pay the full amount of tax due, and pass on imputation credits to
shareholders. On the other hand, firms with a foreign or tax-exempt shareholder base have
incentives to minimize taxes to maximize the after-tax profits (Bellamy 1994). In support of this
theory, Ikin and Tran (2013) find evidence that firms paying franked dividends engage in less tax
avoidance than firms that do not pay franked dividends. Thus, the imputation system provides
interesting cross-sectional variation in how investors could perceive the costs and benefits of the
new ATO disclosure. Some shareholders could be concerned about increased tax costs from
scrutiny of low tax payments, whereas other shareholders may be more interested in viewing
evidence of high tax payments to support franked dividends.
35 For an example of a partially franked dividend, see Cannavan et al. (2004) p. 195.

29
A.3 Dividend Imputation Example
Company ABC earns $100 of pre-tax earnings and pays corporate income tax of $25 during the
year. The company decides it will pay a dividend equal to 60 percent of after-tax earnings. The
calculation of the allocable franking credits is as follows:
Pre-tax earnings $100
Corporate income taxes paid ($25)
After-tax earnings $75
Dividend amount (60%) $45
Maximum franking credit allowed:
Amount of frankable distribution x [Corporate tax rate ÷ (100% - Corporate tax rate)]
Franking credit = $45 x [30% ÷ 70%] = $19.29
Assuming a single shareholder with a 30% marginal tax rate, the shareholder would recognize
taxable income of $64.29 (dividend of $45 plus gross-up of taxes of $19.29) and owe personal
income tax payable of $19.29. However, the shareholder’s tax liability is entirely offset by the
imputation credit received of $19.29, and he would not be required to pay any additional
shareholder-level taxes.
The remaining balance in the franking account is $25 - $19.29 = $5.71 on undistributed earnings
of $30.

30
Appendix B: BHP Billiton Response in the Media
BHP is proud to pay its fair share of local taxes
Peter Beaven, Chief Financial Officer
18 August 2015
Our tax system continues to ignite debate among individuals, politicians, organisations and businesses – including
the contribution from resource and other sectors to Australia’s bottom line.
As one of the largest taxpayers in Australia for many years, we welcome this debate.
We are proud to support the economy through royalties, payments to suppliers and wages for more 20,000
Australians who work for us in places as diverse as the Pilbara in Western Australia, the Bowen Basin in
Queensland and Melbourne.
In the 2014 financial year this contribution, including tax, was around $27 billion.
This month we celebrate the 130th anniversary of the incorporation of BHP. As the world has advanced, our
company has changed and become increasingly global. Like many large Australian companies today, BHP Billiton
generates profits from creating a value chain.
For us this includes exploration, production, processing and the sale and freight of products from Australia to
markets all over the world, crossing a number of borders on the way.
Just as our company has evolved over the past 130 years, so have global tax rules. Income wasn’t even taxed in
Australia 130 years ago. Today there are sophisticated tax rules and Australia has some of the most stringent rules in
the world to ensure business pays its fair share.
As a major global business, we also engage in policy discussions with major economies to make tax rules against
profit shifting even more effective. In the tax contribution debate, there has been some discussion on why BHP
Billiton has a presence in Singapore with allegations from some that we set up our marketing operations to avoid
paying tax in Australia. This isn’t true.
We locate our management and people as close as possible to our operations, plants, ports – and customers.
For example, our Iron Ore division is managed from Perth and our marketing operations are predominantly based in
Singapore, one of the great global trading hubs in the world, close to the majority of our customers.
Our marketing organisation was not set up to avoid Australian tax. We have hundreds of employees in Singapore
who perform critical functions – customer sales, freight, credit risk and market forecasting for our commodities
including iron ore.
Our customers are in Asia – so it makes sense for our marketing team to be based in Singapore supported by
regional offices in key customer markets like China, Japan and India.
The vast bulk of our profits come from the production and processing of Australian commodities in Australia and
this is all subject to Australian tax.
What’s more, the profits we make on our marketing activities in Singapore are taxed back in Australia, through the
Controlled Foreign Company rules.
Building on our long-running Sustainability Report, later this year we will also voluntarily publish how much tax we
pay for each of our mining projects around the world.
This reflects our commitment to paying our fair share.

31
Appendix C: Variable Definitions
This appendix details how I calculate each variable in my empirical analysis. I obtain all data items
from Compustat Global unless otherwise noted. I include Compustat item names in parentheses.
Market Reaction to Legislation Passage
ETR = Total income tax expense divided by pre-tax income adjusted for special items
(TXT/(PI-SPI)); negative values and values greater than 1 are reset to 0 and 1,
respectively
PctForeign = Total percentage ownership by non-Australian shareholders collected from
Bureau van Dijk's Orbis database
PctIndSuper = Total percentage ownership by Australian individual shareholders and
superannuation funds collected from Bureau van Dijk's Orbis database
VOL = Standard deviation of ETR over a 5-year period
Media = Indicator variable set equal to one for companies that are the subject of at least
one article in a top-ten Australian newspaper critical of corporate taxes in the
prior 3-year period and zero otherwise
Variables from ATO Transparency Report
Gross Income = Total income as reported on the Company Tax Return (item 6(S))
Taxable Income = Taxable income as reported on the Company Tax Return (item 7(T))
Tax Payable = Tax payable as reported on the Company Tax Return
Market Reaction to ATO Transparency Report
TaxSurprise
TXC = Tax Payable less current tax expense (TXC)
TI = Taxable Income less imputed taxable income (TXC divided by 30%)
Total Assets = AT
Total Revenue = REVT
Pre-Tax Income = PI
Return on Assets = PI/AT
32
References
Altshuler, R., S. Shay, and E. Toder. 2015. Lessons the United States can learn from other countries’
territorial systems for taxing income of multinational corporations. Urban Institute and Brookings
Institution Research Report.
Asness, C., T. Moskowitz, and L. Pedersen. 2013. Value and momentum everywhere. Journal of Finance
68 (3): 929-985.
Australian Government, Australian Taxation Office. 2015. Tax secrecy and transparency: Administrative
arrangements for reporting entity information. Accessed:
https://www.ato.gov.au/General/Consultation/What-we-are-consulting-about/Papers-for-
comment/Tax-secrecy-and-transparency--administrative-arrangements-for-reporting-entity-
information---Consultation-process/#Paper.
Australian Government, Treasury. 2013. Improving the transparency of Australia’s business tax system.
Accessed:
http://www.treasury.gov.au/ConsultationsandReviews/Consultations/2013/Transparency-of-
business-tax.
Avi-Yonah, R., and A. Siman. 2014. The 1 percent solution: Corporate tax returns should be public (and
how to get there). Tax Notes International 73 (7): 627-628.
Ayers, B. 1998. Deferred tax accounting under SFAS No. 109: An empirical investigation of its
incremental value relevance relative to APB No. 11. The Accounting Review 73 (2): 195-212.
Ayers, B., C. Schwab, and S. Utke. 2015. Noncompliance with mandatory disclosure requirements: The
magnitude and determinants of undisclosed permanently reinvested earnings. The Accounting
Review 90 (1): 59-93.
Barth, M. 1994. Fair value accounting: Evidence from investment securities and the market valuation of
banks. The Accounting Review 69 (1): 1-25.
Beaven, P. August 18, 2015. BHP is proud to pay its fair share of local taxes. The Advertiser. Retrieved
September 13, 2016, from Factiva database.
Bellamy, D. 1994. Evidence of imputation clienteles in the Australian equity market. Asia Pacific Journal
of Management 11 (2): 275-287.
Bergin, T. October 15, 2012. Special report: How Starbucks avoids UK taxes. Reuters. Accessed:
http://uk.reuters.com/article/uk-britain-starbucks-tax-idUKBRE89E0EW20121015.
Bergin, T. April 24, 2014. Starbucks suffers first UK sales drop after tax criticism. Reuters. Accessed:
http://uk.reuters.com/article/uk-starbuckstaxbritain-idUKBREA3N0X020140424.
Beyer, A., D. Cohen, T. Lys, and B. Walther. 2010. The financial reporting environment: Review of the
recent literature. Journal of Accounting and Economics 50 (2-3): 296-343.
Blank, J. 2009. What's wrong with shaming corporate tax abuse? Tax Law Review 62 (4): 539-590.
Blank, J. 2014. Reconsidering corporate tax privacy. New York University Journal of Law and Business
11 (1): 31-121.
Blaufus, K., J. Bob, and P. Otto. 2014. The effect of tax privacy on tax compliance: An experimental
investigation. Working paper.
Bø, E., J. Slemrod, and T. Thoresen. 2015. Taxes on the internet: Deterrence effects of public disclosure.
American Economic Journal: Economic Policy 7 (1): 36-62.
Boyle, M. June 24, 2013. Starbucks pays $15.4 million U.K. corporation tax amid backlash. Bloomberg.
Accessed: http://www.bloomberg.com/news/articles/2013-06-24/starbucks-pays-15-4-million-u-
k-corporation-tax-amid-backlash.
Bradley, S., E. Dauchy, and L. Robinson. 2015. Cross-country evidence on the preliminary effects of
patent box regimes on patent activity and ownership. National Tax Journal 68 (4): 1047-1072.
Bratten, B., C. Gleason, S. Larocque, and L. Mills. 2016. Forecasting taxes: New evidence from analysts.
The Accounting Review, forthcoming.

33
Bushee, B., J. Core, W. Guay, and S. Hamm. 2010. The role of the business press as an information
intermediary. Journal of Accounting Research 48 (1): 1–19.
Campbell, J., H. Chen, D. Dhaliwal, H. Lu, and L. Steele. 2014. The information content of mandatory
risk factor disclosures in corporate filings. Review of Accounting Studies 19 (1): 396-455.
Campbell, J., A. Lo, and A. C. MacKinlay. 1997. The Econometrics of Financial Markets. Princeton,
NJ: Princeton University Press.
Cannavan, D., F. Finn, and S. Gray. 2004. The value of dividend imputation tax credits in Australia.
Journal of Financial Economics 73 (1): 167-197.
Chen, K., and M. Schoderbek. 2000. The 1993 tax rate increase and deferred tax adjustments: A test of
functional fixation. Journal of Accounting Research 38 (1): 23-44.
Chen, S., L. De Simone, M. Hanlon, and R. Lester. 2016. The effect of innovation box regimes on income
shifting and real activity. Working paper.
Chen, S., K. Powers, and B. Stomberg. 2016. Negative media coverage and corporate tax avoidance:
Determinants and consequences. Working paper.
Chenoweth, N. November 6, 2014. Global PwC tax schemes exposed. Australian Financial Review.
Retrieved September 13, 2016, from Factiva database.
Chenoweth, N. April 11, 2015. Big minders under fire at Senate inquiry. Australian Financial Review.
Retrieved September 13, 2016, from Factiva database.
Collins, J., D. Kemsley, and M. Lang. 1998. Cross-jurisdictional income shifting and earnings valuation.
Journal of Accounting Research 36 (2): 209-229.
De Simone, L. 2016. Does a common set of accounting standards affect tax-motivated income shifting for
multinational firms? Journal of Accounting and Economics 61 (1): 145-165.
DeFond, M., and M. Hung. 2003. An empirical analysis of analysts' cash flow forecasts. Journal of
Accounting and Economics 35 (1): 73-100.
Desai, M. 2005. The degradation of reported corporate profits. Journal of Economic Perspectives 19 (4):
171-192.
Desai, M., and D. Dharmapala. 2006. Corporate tax avoidance and high-powered incentives. Journal of
Financial Economics 79 (1): 145-179.
Desai, M., A. Dyck, and L. Zingales. 2007. Theft and taxes. Journal of Financial Economics 84 (3) 591-
623.
Dhaliwal, D., K. Subramanyam, R. Trezevant. 1999. Is comprehensive income superior to net income as a
measure of firm performance? Journal of Accounting and Economics 26 (1-3): 43-67.
Diamond, D., and R. Verrecchia. 1991. Disclosure, liquidity, and the cost of capital. Journal of Finance
46 (4): 1325-1359.
Drake, M., N. Guest, and B. Twedt. 2014. The media and mispricing: The role of the business press in the
pricing of accounting information. The Accounting Review 89 (5): 1673-1701.
Dyreng, S., M. Hanlon, and E. Maydew. 2010. The effects of executives on corporate tax avoidance. The
Accounting Review 85 (4): 1163-1189.
Espahbodi, H., P. Espahbodi, Z. Rezaee, and H. Tehranian. 2002. Stock price reaction and value
relevance of recognition versus disclosure: the case of stock-based compensation. Journal of
Accounting and Economics 33 (3): 343-373.
European Commission. 2016. European Commission proposes public tax transparency rules for
multinationals. Accessed: http://europa.eu/rapid/press-release_IP-16-1349_en.htm?locale=en.
Evers, L., H. Miller, and C. Spengel. 2015. Intellectual property box regimes: Effective tax rates and tax
policy considerations. International Tax and Public Finance 22 (3): 502-530.
EY. 2014. Bridging the divide: Highlights from the 2014 tax risk and controversy survey.
EY. 2015. A new mountain to climb: Tax reputation risk, growing transparency demands and the
importance of data readiness.
Fang, L., and J. Peress. 2009. Media coverage and the cross-section of stock returns. Journal of Finance
64 (5): 2023–2052.

34
Frischmann, P., T. Shevlin, and R. Wilson. 2008. Economic consequences of increasing the conformity in
accounting for uncertain tax benefits. Journal of Accounting and Economics 46 (2-3): 261-278.
Gallemore, J., E. Maydew, and J. Thornock. 2014. The reputational costs of tax avoidance. Contemporary
Accounting Research 31 (4): 1103-1133.
Givoly, D., and J. Lakonishok. (1979). The information content of financial analysts’ forecasts of
earnings. Journal of Accounting and Economics 1 (3): 165-185.
Griffin, J., P. Kelly, and F. Nardari. 2010. Do market efficiency measures yield correct inferences? A
comparison of developed and emerging markets. Review of Financial Studies 23 (8): 3225-3277.
Guenther, D., S. Matsunaga, and B. Williams. 2016. Is tax avoidance related to firm risk? The Accounting
Review, forthcoming.
Hanlon, M. 2003. What can we infer about a firm’s taxable income from its financial statements?
National Tax Journal 56 (4): 831-863.
Hasegawa, M., J. Hoopes, R. Ishida, and J. Slemrod. 2013. The effect of public disclosure on reported
taxable income: Evidence from individuals and corporations in Japan. National Tax Journal 66
(3): 571-608.
Healy, P., and K. Palepu. 2001. Information asymmetry, corporate disclosure, and the capital markets: A
review of the empirical disclosure literature. Journal of Accounting and Economics 31 (1-3): 405-
440.
Hines, J. and E. Rice. 1994. Fiscal paradise: Foreign tax havens and American business. The Quarterly
Journal of Economics 109 (1): 149-182.
Hoopes, J., L. Robinson., and J. Slemrod 2016. Public tax-return disclosure. Working paper.
Huizinga, H and L. Laeven, 2008. International profit shifting within multinationals: A multi-country
perspective. Journal of Public Economics 92 (5): 1164-1182.
Ikin, C., and A. Tran. 2013. Corporate tax strategy in the Australian dividend imputation system.
Australia Tax Forum 28 (3): 523-553.
Jain, P., and Z. Rezaee. 2006. The Sarbanes-Oxley Act of 2002 and capital market behavior: Early
evidence. Contemporary Accounting Research 23 (3): 629-654.
Khadem, N. November 26, 2014. Top companies’ tax bills stay secret. The Age. Retrieved April 30, 2016,
from Factiva database.
Klassen, K., M. Lang, and M. Wolfson. 1993. Geographic income shifting by multinational corporations
in response to tax rate changes. Journal of Accounting Research 32 (Supplement): 141-173.
Klassen, K., and S. Laplante. 2012. Are U.S. corporations becoming more aggressive income shifters?
Journal of Accounting Research 50 (5): 1245-1285.
Kornhauser, M. 2005. Doing the full monty: Will publicizing tax information increase compliance?
Canadian Journal of Law and Jurisprudence 18 (1): 95-117.
Lenter, D., J. Slemrod, and D. Shackelford. 2003. Public disclosure of corporate tax return information:
Accounting, economics, and legal perspectives. National Tax Journal 56 (4): 803-830.
Leuz, C., and P. Wysocki. 2016. The economics of disclosure and financial reporting regulation:
Evidence and suggestions for future research. Journal of Accounting Research 54 (2): 525-622.
Li, H., M. Pincus, and Sonja Rego. 2008. Market reaction to events surrounding the Sarbanes-Oxley act
of 2002 and earnings management. Journal of Law and Economics 51 (1): 111-134.
Lisowsky, P. 2009. Inferring U.S. tax liability from financial statement information. Journal of the
American Taxation Association 31 (1): 29-63.
Miller, G. 2006. The press as a watchdog for accounting fraud. Journal of Accounting Research 44 (5):
1001-1033.
McGuire, S., S. Neuman, and T. Omer. 2013. Sustainable tax strategies and earnings persistence.
Working paper.
Organisation for Economic Co-operation and Development. 2015. Transfer pricing documentation and
country-by-country reporting, Action 13 - 2015 final report. Paris: OECD Publishing.
Ogneva, M., and K. Subramanyam. 2007. Does the stock market underreact to going concern opinions?
Evidence from the U.S. and Australia. Journal of Accounting and Economics 43 (2-3): 439-452.

35
Parliament of the Commonwealth of Australia. Tax Laws Amendment (2013 Measures No. 2) Act 2013.
Bill and explanatory memorandum.
Parliament of the Commonwealth of Australia. Infosheet 7 – Making laws. Accessed:
http://www.aph.gov.au/About_Parliament/House_of_Representatives/Powers_practice_and_proc
edure/00_-_Infosheets/Infosheet_7_-_Making_laws.
Pattenden, K., and G. Twite. 2008. Taxes and dividend policy under alternative tax regimes. Journal of
Corporate Finance 14 (1): 1-16.
Plumlee, M. 2003. The effect of information complexity on analysts’ use of that information. The
Accounting Review 78 (1): 275–296.
Pomp, R. 1993. The disclosure of state corporate income tax data: Turning the clock back to the future.
Capital University Law Review 22 (2): 373-464.
PwC. 2014. 17th Annual global CEO survey: Tax strategy, corporate reputation, and a changing
international tax system.
Ramnath, S., S. Rock, and P. Shane. 2008. The financial analyst forecasting literature: A taxonomy with
suggestions for further research. International Journal of Forecasting 24 (1): 34-75.
Robinson, J., Y. Xue, and Y. Yu. 2011. Determinants of disclosure noncompliance and the effect of the
SEC review: Evidence from the 2006 mandated compensation disclosure regulations. The
Accounting Review 86 (4): 1415-1444.
Schipper, K., and R. Thompson. 1983. The impact of merger-related regulations on the shareholders
acquiring firms. Journal of Accounting Research 21 (1): 184-221.
Sefcik, S., and R. Thompson. 1986. An approach to statistical inference in cross-sectional models with
security abnormal returns as dependent variable. Journal of Accounting Research 24 (2): 316-
334.
Shroff, N., R. Verdi, and G. Yu. 2014. Information environment and the investment decisions of
multinational corporations. The Accounting Review 89 (2): 759-790.
Taxand. 2015. Taxand global survey 2015: Caught in the crossfire: MNCs prepare for the post-BEPS
world.
Tax Executives Institute. 2002. Public disclosure of corporate tax returns. The Tax Executive 54 (July-
August 2002): 353-357.
Tax Executives Institute. 2006. TEI opposes public disclosure of corporate tax returns. The Tax Executive
58 (May-June 2006): 241-243.
Thorndike, J. 2002. Promoting honesty by releasing corporate tax returns. Tax Notes 96 (July 15): 324-
325.
Towery, E. 2016. Unintended consequences of linking tax return disclosures to financial reporting for
income taxes: Evidence from Schedule UTP. The Accounting Review, forthcoming.
Tran, A. 2015. Can taxable income be estimated from financial reports of listed companies in Australia?
Australian Tax Forum 30 (3): 569-594.
Weber, D. 2009. Do analysts and investors fully appreciate the implications of book-tax differences for
future earnings? Contemporary Accounting Review 26 (4): 1175-1206.
Yeates, C. February 4, 2013. Name and shame: tax transparency plans. Sydney Morning Herald.
Accessed: http://www.smh.com.au/business/name-and-shame-tax-transparency-plans-20130204-
2du72.html.
Zhang, I. 2007. Economic consequences of the Sarbanes-Oxley Act of 2002. Journal of Accounting and
Economics 44 (1): 74-115.

36
TABLE 1
Events Leading Up to Tax Transparency Bill Passage
Event Date Description
E1 2/4/2013 Assistant Treasurer David Bradbury announces government's intention to improve
corporate tax transparency with some form of public tax disclosure
E2 4/3/2013 Treasury releases discussion paper, Improving the Transparency of Australia's
Business Tax System , outlining details of the proposed transparency bill including
the reporting threshold and the relevant line items from the corporate tax return
E3 5/29/2013 Introduction and first reading of the transparency bill in the House of
Representatives; full text of the bill available online for the first time
E4 6/28/2013 Parliament passes the transparency bill
E5 12/17/2015 Release of ATO Tax Transparency Report for public corporate entities on the
Australian government's website
Events Leading Up to Legislation Passage

37
TABLE 2
Sample Selection
This table provides the sample selection criteria for each of the samples for testing the market reaction to
key events leading up to the passage of the tax transparency bill (Panel A) and testing the market reaction
to the release of the initial ATO Corporate Tax Transparency Report (Panel B).
n
Australian listed companies from Compustat Global Annual 1,691
Less:
Companies with total revenue (REVT) less than AUD 100M (1,320)
Companies missing daily returns data (23)
Companies in event study sample (Table 3) 348
Companies in event study sample 348
Less:
Companies missing ETR (TXT/PI-SPI) (9)
Companies missing shareholder ownership data (21)
Companies missing ETR volatility data (1)
Companies in additional cross-sectional analysis sample (Table 4) 317
n
Corporate entities included in ATO Corporate Tax Transparency Report 1,539
Less:
Companies unmatched to Compustat Global (1,203)
Companies missing daily returns data (30)
Companies in reaction to ATO report sample (Table 6) 306
Companies with non-missing TXC (Table 5, Panel B) 298
Panel B: Market Reaction to ATO Report
Panel A: Market Reaction to Legislation Passage

38
TABLE 3
Market Reaction to Events Leading Up to Tax Transparency Bill Passage
This table presents descriptive statistics for the sample used in testing the market reaction to key events
leading up to the passage of the tax transparency bill (Panel A) and the results of estimating equation (1)
for an equally-weighted portfolio of publicly listed firms expected to be subject to the tax transparency bill
(Panel B). Financial information is from Compustat Global and amounts are in millions of AUD. Total
Assets is total assets (AT). Total Revenue is total revenue (REVT). Pre-Tax Income is pre-tax income (PI).
Return on Assets is return on assets (PI/AT). The cumulative abnormal return (CAR) is measured in the 3-
day window centered on the event date.
Variable n Mean Std. Dev. Minimum P25 Median P75 Maximum
Total Assets 348 3035.61 5602.64 23.31 220.37 677.80 2722.12 22740.00
Total Revenue 348 1559.86 2679.03 101.46 195.24 416.06 1392.85 10831.80
Pre-Tax Income 348 139.77 291.84 -175.60 10.60 38.25 144.16 1216.80
Return on Assets 348 0.0632 0.1372 -0.9683 0.0188 0.0597 0.1155 0.5266
Panel A: Descriptive Statistics
Event Date Description CAR [t-stat]
E1 2/4/2013 Treasury announcement -0.0007 [-0.58]
E2 4/3/2013 Discussion paper -0.0042*** [-3.24]
E3 5/29/2013 First reading of bill 0.0036*** [3.91]
E4 6/28/2013 Final bill passage 0.0045** [2.06]
Overall market reaction to events 0.0032***
F-statistic 7.93
Daily observations 253
Adj. R-squared 0.7143
Panel B: Equally-Weighted Portfolio Returns

39
TABLE 4
Additional Cross-Sectional Analysis of Market Reaction
This table presents descriptive statistics for the sample used in testing cross-sectional variation in the market
reaction to key events leading up to the passage of the tax transparency bill (Panels A and B) and the results
of estimating equation (1) for portfolios weighted by the firm characteristic indicated in each column
(Panels C and D). The cumulative abnormal return (CAR) is measured in the 3-day window centered on
the event date. ETR is total income tax expense divided by pre-tax income adjusted for special items
(TXT/(PI-SPI)) where negative values and values greater than 1 are reset to 0 and 1, respectively.
PctForeign is total percentage ownership by non-Australian shareholders. PctIndSuper is total percentage
ownership by Australian individual shareholders and superannuation funds. VOL is the standard deviation
of ETR over the prior 5-year period. Media is an indicator variable set equal to one for companies that are
the subject of at least one article in a top-ten Australian newspaper critical of corporate taxes in the prior 3-
year period and zero otherwise. Continuous variables are winsorized at the 1st and 99th percentiles. Panel B
reports Pearson correlations (above the diagonal) and Spearman correlations (below the diagonal). Values
in bold denote significance at the 0.10 level.
Variable n Mean Std. Dev. Minimum P25 Median P75 Maximum
ETR 317 0.2459 0.1727 0.0000 0.1398 0.2717 0.3065 1.0000
PctForeign 317 26.2178 26.2630 0.0000 5.9500 18.3100 36.6200 100.0000
PctIndSuper 317 4.1348 8.6066 0.0000 0.0000 0.9200 3.1700 45.9700
VOL 317 0.3175 0.7862 0.0005 0.0298 0.0994 0.2525 6.5665
Media 317 0.0284 0.1664 0.0000 0.0000 0.0000 0.0000 1.0000
Variable ETR VOL Media
ETR 0.0552 -0.0377
(0.3277) (0.5040)
PctForeign -0.1808 0.0932 -0.0047
(0.0012) (0.0977) (0.9330)
PctIndSuper 0.1811 -0.0495 -0.0672
(0.0012) (0.3800) (0.2328)
VOL -0.1906 -0.0462
(0.0006) (0.4127)
Media -0.0205 -0.0266
(0.7166) (0.6375)
(0.0044) (0.0679)
0.0218 -0.0335
(0.6990) (0.5523)
-0.1667
(0.0029)
0.1597 -0.1027
(0.1683) (0.0011)
-0.1966
(0.0004)
PctForeign PctIndSuper
-0.0776 0.1830
Panel A: Descriptive Statistics
Panel B: Sample Correlations

40
TABLE 4, continued
Additional Cross-Sectional Analysis of Market Reaction
Predicted Sign
Event CAR [t-stat] CAR [t-stat] CAR [t-stat] CAR [t-stat]
E1 0.0000 [0.97] 0.0002*** [2.93] -0.0023*** [-3.15] 0.0024 [1.04]
E2 -0.0001*** [-9.59] 0.0000 [0.53] -0.0010 [-0.70] -0.0009 [-0.96]
E3 0.0000 [0.68] -0.0001 [-1.38] -0.0004 [-0.26] -0.0034 [-1.49]
E4 0.0000 [0.29] 0.0002*** [4.77] -0.0002 [-0.14] -0.0004 [-0.15]
Overall market reaction to events
F-statistic
Daily observations
Adj. R-squared
Predicted Sign
Event CAR [t-stat] CAR [t-stat] CAR [t-stat] CAR [t-stat]
E1 -0.0000 [-0.94] 0.0002*** [3.41] -0.0011*** [-5.70] 0.0014 [0.76]
E2 -0.0001*** [-4.65] 0.0001 [1.47] -0.0008 [-1.08] 0.0008 [0.45]
E3 0.0000 [0.75] -0.0001 [-1.54] -0.0007 [-0.33] -0.0041*** [-3.23]
E4 0.0000 [0.06] 0.0001 [1.26] 0.0007 [0.57] -0.0011 [-0.28]
Overall market reaction to events
F-statistic
Daily observations
Adj. R-squared
2.93
0.0003***
8.13
253
0.2087
-0.0023
253
0.2206
+ - -
-
-0.0039**
1.06
PctIndSuper VOL Media
Panel D: Weighted Portfolio Returns - Exclude Loss Firms
- + -
2.60
253
0.0186
Panel C: Weighted Portfolio Returns
PctForeign PctIndSuper VOL Media
-0.0001***
29.55
253
-
PctForeign
-0.0046
-0.0001*** 0.0003*** -0.0019*** -0.0129**
5.66 4.35 8.44
253 253 253 253
0.0553 0.2095 0.0333 0.1541
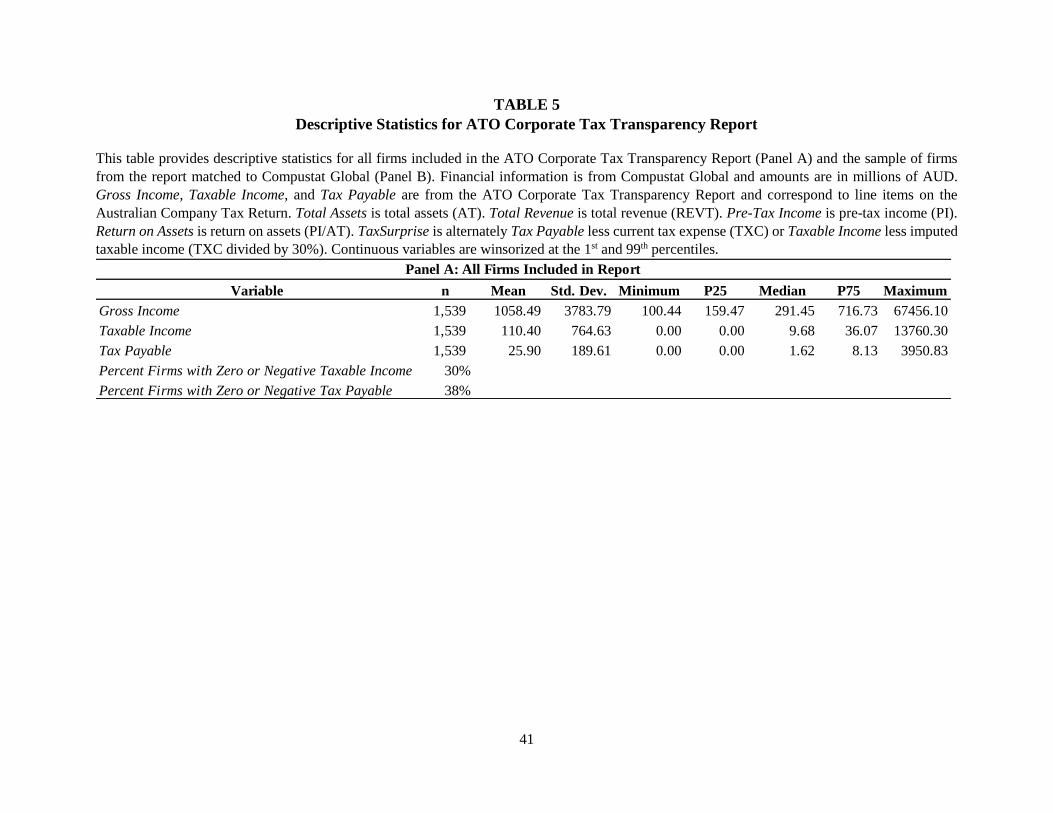
41
TABLE 5
Descriptive Statistics for ATO Corporate Tax Transparency Report
This table provides descriptive statistics for all firms included in the ATO Corporate Tax Transparency Report (Panel A) and the sample of firms
from the report matched to Compustat Global (Panel B). Financial information is from Compustat Global and amounts are in millions of AUD.
Gross Income, Taxable Income, and Tax Payable are from the ATO Corporate Tax Transparency Report and correspond to line items on the
Australian Company Tax Return. Total Assets is total assets (AT). Total Revenue is total revenue (REVT). Pre-Tax Income is pre-tax income (PI).
Return on Assets is return on assets (PI/AT). TaxSurprise is alternately Tax Payable less current tax expense (TXC) or Taxable Income less imputed
taxable income (TXC divided by 30%). Continuous variables are winsorized at the 1st and 99th percentiles.
Variable n Mean Std. Dev. Minimum P25 Median P75 Maximum
Gross Income 1,539 1058.49 3783.79 100.44 159.47 291.45 716.73 67456.10
Taxable Income 1,539 110.40 764.63 0.00 0.00 9.68 36.07 13760.30
Tax Payable 1,539 25.90 189.61 0.00 0.00 1.62 8.13 3950.83
Percent Firms with Zero or Negative Taxable Income 30%
Percent Firms with Zero or Negative Tax Payable 38%
Panel A: All Firms Included in Report

42
TABLE 5, continued
Descriptive Statistics for ATO Corporate Tax Transparency Report
Variable n Mean Std. Dev. Minimum P25 Median P75 Maximum
Gross Income 306 2659.62 7755.16 100.47 213.61 442.34 1378.84 67456.10
Taxable Income 306 356.27 1557.69 0.00 0.09 22.26 99.92 13760.30
Tax Payable 306 88.38 413.56 0.00 0.00 3.42 21.55 3950.83
Percent Firms with Zero or Negative Taxable Income 25%
Percent Firms with Zero or Negative Tax Payable 37%
Total Assets 306 15385.87 88889.52 40.22 304.38 793.57 2964.00 770842.00
Total Revenue 306 2918.34 7774.13 23.94 227.89 532.53 1746.60 51171.00
Pre-Tax Income 306 336.36 1372.29 -505.90 6.37 37.28 158.60 10308.00
Return on Assets 306 0.0431 0.1131 -0.3802 0.0120 0.0524 0.0930 0.3353
TaxSurprise (Scaled by Total Assets)
TXC 298 0.0032 0.0235 -0.0359 -0.0063 -0.0005 0.0018 0.1300
TI 298 0.0245 0.0866 -0.1181 -0.0105 0.0000 0.0305 0.4946
TaxSurprise (Unscaled)
TXC 298 -19.43 202.41 -2635.17 -6.57 -0.33 1.07 1561.90
TI 298 -2.34 692.72 -8193.03 -12.89 0.00 19.89 5376.30
Panel B: Firms Included in Report Matched to Compustat Global

43
TABLE 6
Market Reaction to Release of ATO Corporate Tax Transparency Report
This table presents the results of estimating equation (1) using the absolute value of
returns for an equally-weighted portfolio of publicly listed firms appearing on the ATO
Corporate Tax Transparency Report. The cumulative abnormal return (CAR) is
measured in the 3-day window centered on the event date.
Event Date Description CAR [t-stat]
E5 12/17/2015 Release of ATO Report -0.0012 [-1.57]
Daily observations 71
Adj. R-squared 0.4008
Equally-Weighted Absolute Value Portfolio Returns