abstract integrated design/selection mixture …
TRANSCRIPT


-
ABSTRACT
Title of dissertation: DEVELOPMENT OF A PERFORMANCE BASED,
INTEGRATED DESIGN/SELECTION MIXTURE
METHODOLOGY FOR FIBER REINFORCED CONCRETE
AIRFIELD PAVEMENTS
Stewart David Bennie, Doctor of Philosophy, 2004
Dissertation directed by: Professor Dimitrios G. Goulias Department of Civil Engineering
Recent advances in polymer technology have given rise to new research regarding
conventional building materials like concrete and the rheological material properties of
polymer fiber-concrete composites. Polymers such as polypropylene fiber are now the
industry standard for manufacture of geosynthetics which are used as the structural
element in earth walls, stabilized slopes, and to improve soft soil bearing capacity. Both
industry and researchers now recognize the benefits of polypropylene fiber reinforced
concrete in reducing temperature and shrinkage cracking and crack widths, which is
important distress criteria in airfield pavements. However, little attention has been given
to the use of high tensile strength polypropylene as a structural component of concrete
pavements. As important as the research, is the methodology used to obtain the results.
There is a need to consider concrete mixture design and selection in conjunction with
pavement design since specific mixture properties' behavior and performance

-
characteristics are set by pavement design requirements. Such approach will permit the
development of an "integrated mixture selection- pavement design methodology". This
study quantified the beneficial strength properties of small volume (less than 0.5%)
polypropylene fiber reinforced concrete (FRC) as an airfield pavement to meet both
military and civilian aviation needs. Polypropylene fiber reinforcement in small volumes
displays none of the historical problems of poor workability, or excessive pavement
deflections associated with fiber-concrete composites in larger volumes. Through
laboratory testing of material properties such as fatigue, toughness and flexural strength
and computer modeling this composite showed a consistent improvement in those
strength properties that would increase the life of the pavement structure under repetitive
aircraft traffic. Perhaps, the most unique property of this composite is its ability to
continue to absorb energy after first crack, ductile properties not typically associated with
a brittle material like concrete. This increase in toughness is significant to the military in
mitigating heaved pavement around bomb damaged runway craters during rapid runway
repair. Analogues to safety glass, FRC will mitigate radial fracturing of airfield pavement
located around the crater impact area reducing time to repair heaved pavement, an
important criteria to air base survivability. This dissertation serves as a blueprint to
comprehensively evaluate both design and performance of any fiber concrete composite.

-
DEVELOPMENT OF A PERFORMANCE BASED, INTEGRATED
DESIGN/SELECTION MIXTURE METHODOLOGY
FOR FIBER REINFORCED CONCRETE AIRFIELD PAVEMENTS
by
Stewart David Bennie
Dissertation submitted to the Faculty of the Graduate School of theUniversity of Maryland, College Park in partial fulfillment
of the requirements for the degree ofDoctor of Philosophy
2004
Advisory Committee:
Dr. Dimitrios G. Goulias, Chair Dr. M. Sherif Aggour Dr. Deborah J. Goodings
Dr. Sung Lee Dr. Charles W. Schwartz


-
ii
PREFACE
As a retired United States Air Force Civil Engineer, I spent much time with a
team of other engineers replacing asphalt airfields in Europe and Turkey with concrete
pavements. This was due to high sortie damage from military aircraft, causing subgrade
rutting and surface raveling on asphalt surfaces. As a military engineer on the
Headquarters staff, I also worked extensively with new technologies to expedite Rapid
Runway Repair under battle damage scenarios. Time to repair and pavement toughness
being important criterion to the Air Force; repair time dominated by the need to remove
heaved concrete runway pavement around bomb damage craters due to fracturing. At the
University of Maryland, I enjoyed working on polypropylene fiber research as it pertains
to rigid pavements, as I have recognized its potential to solve problems in increasing a
pavement’s life. Improvements, both in terms of strength (fatigue and flexural), shrinkage
(cracking) and toughness due to fiber’s unique ability to retard fracturing and absorb
energy. Important material properties not only unique to military rigid pavements, but
beneficial for general aviation use.
Beginning June 2001, extensive laboratory testing was conducted over a 13-
month period at the University of Maryland quantifying the properties of polypropylene
fiber reinforced concrete (FRC) as a pavement structure. The success of this testing is in
large part due to the efforts of my laboratory partner, Haejin Kim, who has recently
immigrated to America with his wife, Seonmi and their daughter, Monica. Haejin and his
family epitomize the immigrant spirit of America, welcoming the best and brightest
people who become a vital part of the continuous building of this great nation.

-
iii
TABLE OF CONTENTS
PageList of Tables vi
List of Figures viii
List of Abbreviations xi
Chapter 1. Introduction
Introduction 1
Background 4
Research Objectives 8
Organization of the Report 12
Chapter 2. Literature Review
Introduction 13
Material Behavior Characteristics 14
Analytical Models 43
Conclusions 48
Chapter 3. Development of an Integrated Concrete Design/Selection
Methodology for Fiber Reinforced Concrete
Introduction 51
Limitations of the Current Design Methods 53
A Better Design Methodology 55
Step 1. Evaluate and Select New Material 59
Step 2. Laboratory Performance Predictions 60

-
iv
Step 3. Design Thickness Analysis 66
Step 4. Heaved Pavement Prediction 73
Step 5. Mix Design Selection and Field Testing 75
FRC Design and Selection Criteria 78
Conclusion 83
Chapter 4. Laboratory Testing and Results
Introduction 86
Mix Design and Workability 87
Strength and Energy Absorption 94
Fatigue Strength Testing 107
Compressive Strength Testing and Ductility Observations 115
Shrinkage Testing 119
Chapter 5. Analytical Evaluation and Modeling
Introduction 128
FRC Design Thickness Predictions 129
FRC Thermal Stress and Deflection 167
Fracture Modeling for Heaved Pavement Reduction 173

-
v
Chapter 6. Case Study Analysis of the Integrated Design Methodology
for FRC Airfields
Introduction 185
Case Study 186
Chapter 7. Summary, Conclusions and Future Recommendations
Summary 208
Conclusions 210
Recommendations 215
References 218

-
vi
LIST OF TABLES
1. Table1.1: Allowable Fibrous Concrete Airfield Deflection (inches). 6
2. Table 2.1:Recommended Fiber Lengths. 14
3. Table 2.2: Fiber Tensile Strength Values. 25
4. Table 2.3: Polypropylene Fiber Concrete Properties. 29
5. Table 2.4: 0.10 % Fiber Strength Values. 31
6. Table 2.5: 0.15 % Fiber Strength Values. 31
7. Table 2.6: Impact Data; ACI 544.2R. 33
8. Table 2.7: Concrete Restrained Shrinkage Cracking. 38
9. Table 2.8: Surface Scaling Rating. 40
10.Table 2.9; Von Water Mitigation Test Method. 42
11.Table 2.10: Polypropylene Fiber Properties. 43
12.Table 3.1: FRC Design Thickness Table. 84
13.Table 3.2: FRC Mix Design Acceptance Criteria. 85
14.Table 4.1: Mix Design Matrix. 88
15.Table 4.2: Workability Matrix. 92
16.Table 4.3:Workability Results. 92
17.Table 4.4: FRC Specimen Fracture Observations. 101
18.Table 4.5: Toughness Mix Design (0.3% & 0.4% Fiber). 105
19.Table 4.6: Compressive Strength Values at Failure. 117
20.Table 5.1: Thickness Reduction for Boeing 777 Aircraft; MD-7 Mix. 142
21. Table 5.2: Thickness Edge Stress Results-Boeing 777 Aircraft. 143
-
vii
22. Table 5.3: KenSlabs Edge Stress Results; Boeing 777 Aircraft. 147
23. Table 5.4: KenSlabs Edge Stress Results; Boeing 747 Aircraft. 151
24. Table 5.5: KenSlabs Edge Stress Results; F-16 Aircraft. 155
25. Table 5.6: KenSlabs Edge Stress Results; C-141 Aircraft. 160
26. Table 5.7: KenSlabs Edge Stress Results; C-17 Aircraft. 160
27. Table 5.8: Design Thickness Reduction Value (C-17A Aircraft). 163
28. Table 5.9: LEDFAA Multi-Aircraft Design Thickness Results. 165
29. Table 5.10: Single/Multi-Aircraft FRC Design Thickness Results. 166
30. Table 5.11: Curling Stresses; 25’x 25’Slab (∆20°F). 168
31. Table 5.12: Thermal Stress Values on 25’x 12’ Slab (∆10°F). 169
32. Table 5.13: Thermal Stress Values on 25’x 12’ Slab (∆20°F). 170
33. Table 5.14: Thermal Stress Values on 25’x 12’ Slab (∆30°F). 170
34. Table 5.15: FRC Corner Deflection; 25’x 25’Slab. 172
35. Table 5.16: Corner Deflection Subgrade Effect. 172
36. Table 5.17: Laboratory and Calculated Material Properties. 178
37. Table 5.18: Heaved Pavement Reduction Summary. 184
38. Table 6.1:Polypropylene Fiber Concrete Properties. 189
39. Table 6.2: Single/Multi-Aircraft Design Thickness. 200
40. Table 6.3: KenSlabs Thermal Stress Results. 201
41. Table 6.4: Agency Cost Matrix -Mix Design # 7. 202
42. Table 6.5: FRC Selection based on HPAC Performance Results. 207
43. Table 7.1: Thermal Stress Values;25’X 12’ slab (∆ 20˚F). 215

-
viii
LIST OF FIGURES
1. Figure 2.1: Maximum Fatigue Strength. 16
2. Figure 2.2: Fatigue Strength. 21
3. Figure 2.3: ACI FRC Flexural Stress Comparisons. 22
4. Figure 2.4: ASTM 1018;Load Deflection Curve. 27
5. Figure 2.5: Toughness Indices. 29
6. Figure 2.6: Steel Ring Test. 37
7. Figure 2.7; Restrained Shrinkage Cracking. 39
8. Figure 2.8: KenSlabs Schematic. 47
9. Figure 2.9: Endurance Limits. 49
10.Figure 3.1: Measure of Energy Absorption; Toughness (I). 64
11.Figure 3.2: Measurement of Distress Cracking. 66
12.Figure 3.3: Measure of FRC Design Thickness Reduction. 71
13.Figure 3.4: Measure of FRC Thermal Stress Reduction. 71
14.Figure 3.5: Measure of Agency Costs. 72
15.Figure 3 6: Heaved Pavement Reduction. 75
16.Figure 3 7: System Engineering Phases and Components. 80
17.Figure 3.8: Performance Based Mix Design and Selection Methodology. 81
18.Figure 3.9: Performance Based Mix Design and Field Test Methodology. 82
19.Figure 4.1: Inverted Slump Cone Test for FRC. 90
20.Figure 4.2: FRC Beam after Fracture (fibers visible). 93
21.Figure 4.3: ASTM C 78 Static Flexural Strength Testing. 96

-
ix
22.Figure 4.4: Flexural Strength Graph. 98
23.Figure 4.5; Typical FRC Beam Fracture. 98
24.Figure 4.6; Flexural Strength Results. 99
25.Figure 4.7: ACI FRC Flexural Strength Indices.. 101
26.Figure 4.8: ASTM C 1018 Toughness Testing. 104
27.Figure 4.9: Laboratory Toughness Indices. 105
28.Figure 4.10: First Crack and Toughness. 106
29.Figure 4.11: Material Testing System (MTS) machine. 109
30.Figure 4.12: FRC Fatigue Test Failure. 109
31.Figure 4.13: Casting Beam Specimen. 111
32.Figure 4.14: Cyclic Fatigue Loading of FRC. 113
33.Figure 4.15: Fatigue Stress/ Load Cycles to Failure Plot. 114
34.Figure 4.16: Fatigue Beam Specimens. 114
35.Figure 4.17:Compressive Strength Test Results. 118
36.Figure 4.18: Ductile Cylinder Specimens. . 118
37.Figure 4.19: Steel Ring Test. 119
38.Figure 4.20:Free Shrinkage Beam Curing. 122
39.Figure 4.21: Free Shrinkage Measurements with Extensometer. 122
40.Figure 4.22: Concrete Ring Sonotube Form. 124
41.Figure 4.23: Concrete Ring Specimen Curing. 124
42.Figure 4.24: Plain (0% fiber) Free Shrinkage Test Results 127
43.Figure 4.25: FRC Free Shrinkage Test Results 127
44.Figure 5.1: Typical PCC Airfield Pavement. 139

-
x
45.Figure 5.2: Boeing 777 Design Thickness (MD-7 Mix Design). 143
46.Figure 5.3: Boeing 777 Design Thickness (3,000,000 Passes). 143
47.Figure 5.4: Tridem Gear Configuration (Boeing 777). 145
48.Figure 5.5: Boeing 777 Aircraft Design Thickness Graph. 146
49.Figure 5.6: Boeing 747 Design Thickness Graph. 150
50.Figure 5.7: The F-16 Fighting Falcon. 153
51.Figure 5.8: F-16 Aircraft Design Thickness Graph. 154
52.Figure 5.9: Lockheed Martin C-141 Starlifter. 158
53.Figure 5.10: Boeing C-17 Globemaster III. 159
54.Figure 5.11: KenSlabs Edge Stress Results; C-141 Aircraft. 160
55.Figure 5.12: KenSlabs Edge Stress Results; C-17 Aircraft. 160
56.Figure 5.13: Curling Stress. 168
57.Figure 5.14: Bomb Damage Repair; Airfield Concrete Runway. 173
58.Figure 5.15: Toughness. 176
59.Figure 5.16: Heaved Pavement Fracturing Schematic. 178
60.Figure 5.17: Heaved Pavement Reduction Toughness Results. 184
61.Figure 6.1: Fracture Reduction Observation. 193
62.Figure 6.2: Cylinder Specimen Failure. 193
63.Figure 6.3: Restrained Shrinkage Cracking. 195
64.Figure 6.3; Specimen Fracture Reduction 250
65.Figure 6.4; Ductile Cylinder Specimens. 251

-
xi
LIST OF ABBREVIATIONS
1. AASHTO American Association of State Highway and Transportation Officials
2. ACI American Concrete Institute
3. AFM Air Force Manuel
4. ANFO Ammonia-Nitrite/Fuel Oil
5. ASTM American Society of Testing Materials
6. C.Y. Cubic Yard
7. E. Modulus of Elasticity
8. FEM Finite Element Method
9. FOD Foreign Object Debris
10. F.R.C. Fiber Reinforced Concrete
11. fmax maximum fatigue strength
12. FPP Fibrillated polypropylene
13. fv maximum fiber fatigue strength
14. g gravity
15. HPC High-Performance concrete
16. HPFRC High Performance Fiber Reinforced Concrete
17. HRWR High Range Water Reducer
18. I Toughness Indices
19. ksi Kips per square inch
20. L/df Length/ Fiber diameter(aspect ratio)
21. LEDFAA Layered Elastic Design; Federal Aviation Administration

-
xii
22. LVDT Linear Variable Differential Transformers
23. MD Maryland
24. MDOT Maryland Department of Transportation
25. M.O.R. Modulus of Rupture
26. MTS Material Test System
27. Nf Loads to Failure
28. PCA Portland Cement Association
29. R Residual strength values
30. RD Diameter of Ruptured Pavement
31. RRR Rapid Runway Repair
32. S-N Stress to Loads to failure
33. T.M. Technical Manual
34. U.S./U.S.A. United States of America
35. Vc stress wave velocity
36. Vf Volume of Fiber
37. w/c water/cement ratio
38. W.W.M. welded wire mesh

1
CHAPTER 1. INTRODUCTION
INTRODUCTION
Although concrete is one of man’s most common building materials, relatively
lit tle is known about damage accumulation to concrete structures subjected to large
numbers of load applications during their design life. Concrete deteriorates both in
strength and stiffness under repeated load applications especially if it is stressed well
beyond half it’s rupture modulus in tension (stress ratio > 0.5). Referenced research in
Chapter 2 on plain and polypropylene fiber reinforced concrete (FRC) suggests that at
fiber contents less than 0.5% and at stress levels below 0.75, Miner’s Rule is applicable.
Miner’s Rule presumes a linear accumulation of damage of materials like concrete until
failure (cracking). Beyond stress ratios of 0.75 and fiber contents greater than 0.5%,
damage accumulates in concrete in a pronounced, non-linear fashion and energy
absorption capacity decreases almost exponentially1.
If Miner’s Rule of linear damage accumulation is applicable for plain and
polypropylene fiber reinforced concrete (FRC) at stress ratio’s below 0.75, it is
reasonable to assume that a relationship exists between aircraft passes to failure (N) and
stress level. In order to determine a airfield thickness for a no failure condition due to
loading, the following input parameters should be considered, aircraft gear geometry,
applied aircraft's tire contact pressure and Modulus of Rupture (MOR) of varying
volumes of low fiber content (<0.5%) concrete. The no failure condition being the
minimum pavement thickness, in which the stress ratio is low enough that the pavement

-
2
will not fail in fatigue typically defined as the endurance limit. Such a relationships could
be expressed mathematically in the form of a design thickness to stress level equation to
establish minimum criteria for rigid airfield pavements subjected to a specific repetitive
aircraft loading for a stated design life. For example, the Portland Cement Association
(PCA) has established similar equations in predicting vehicle loads to pavement failure
(Nf) under a stated design wheel load for a given highway pavement’s static flexural
strength2.
Minimal volumes of polypropylene fiber (less than 0.5%) in concrete can provide
important benefits to the performance of rigid airfield pavements. Current research
studies document increased flexural, toughness and fatigue resistance properties as well
as an ability to minimize crack propagation and reduce crack widths. Polypropylene
fibers increase the flexural and fatigue strength of concrete, which is an important
property in reducing the design thickness and increasing the serviceability (design life) of
concrete airfields. Polypropylene fiber’s ability to absorb energy (toughness) is an
important property to the military in reducing heaved pavement from explosive cratering.
Minimizing crack propagation and reducing crack widths also reduces Foreign Object
Debris (FOD) damage to high performance jet aircraft intakes and loss of subgrade fines
through slab pumping by heavy lift aircraft. However, these very elastic properties of
polypropylene fiber that are beneficial at small volumes begin to cause concerns with
rigid pavement deflections, lower compressive strengths, higher creep strains and poor
workability at higher fiber volumes. Considerable research has already been done on
polypropylene fiber concrete and is discussed in the literature review chapter of this

-
3
dissertation. Current literature research and preliminary finite element method (FEM)
modeling on polypropylene fiber reinforced concrete highway pavements optimizes fiber
content at 0.20 % for crack control and 0.25% for serviceability (fatigue resistance) when
considering a 20 year design life. Therefore, the focus of this research was to quantify
FRC material strength (static flexural, fatigue, energy absorption) and shrinkage
(cracking) properties in the laboratory and use that data with established computer
models, such as KenSlabs, in order to yield performance models predicting load, thermal
stresses and rigid airfield pavement life as a function of thickness. Laboratory testing in
this research was undertaken on fiber contents of 0%, 0.1%, 0.2%, 0.3% and 0.4% by
volume of a concrete using Mix Design (MD) # 7 for highway pavements as the control
mix with number 57 aggregate as defined by the Maryland Department of Transportation
(MDOT) 3. Tests for static flexural strength, fatigue resistance (endurance limit),
compressive strength, toughness, shrinkage (plastic and unrestrained), and workability
were conducted in an attempt to optimize fibrillated polypropylene fiber content to
airfield performance properties.
Regarding airfield rigid pavement design methodology, a systems engineering
approach is proposed to comprehensively evaluate all facets of this FRC composite to
ensure optimization of its material properties in line with the unique survivability
requirements of the military. This dissertation proposes a comprehensive, systematic
methodology to quantify the benefits of using low volume (less than 0.5%)
polypropylene fiber reinforced concrete (FRC) in an airfield pavement to meet both
military and civilian aviation needs. There is a real need for a comprehensive, long-term,

-
4
iterative approach to pavement research, design and performance management and a need
to establish judgement criteria for selecting this methodology. Current pavement research
generally does not systematically test and evaluate the wide spectrum of properties of a
new material so as to determine the synergetic effect of loads, environment, survivability
and constructabilty. Current pavement design is typically based on a single criterion of
thickness determination under aircraft loading, derived from empirical data. The variables
in designing a pavement structure are complex, making them difficult to evaluate without
the use of systems engineering. The main effort of this dissertation was to develop an
"integrated mix selection / design " methodology for airfield concrete considering
specific aircraft, laboratory data on mixture properties and airfield pavement analysis and
design requirements. From the Military's perspective, this methodology must be generic
enough for worldwide austere location application based on limited material testing data,
such as the modulus of rupture (MOR) of a local concrete mix and minimal aircraft
loading data, such as tire pressure for a given aircraft to be useful.
BACKGROUND
Fiber-reinforced concrete (FRC) in the context of this research is conventionally
mixed concrete containing discontinuous fibers that initially are randomly orientated in
three dimensions in the mixture4. Although there has been continued interest and research
in the use of fiber-reinforced concrete (FRC), there have been few major innovations in
proportioning or production of high performance fiber reinforced concrete (HPFRC)
since the last state-of-the-art Report 5. In addition, while past research in FRC has

-
5
examined the influence of modifications of existing steel fibers, fibers with larger aspect
ratios and higher fiber volumes, there is now a growing interest in non-metallic fibers
such as polypropylene.
Regarding airfield rigid pavement design, most of this experience centered on the
use of steel fibers in the late 1980’s by the U.S. Army Corps of Engineers6 at relatively
larger fiber contents of 0.5 to 2.0 percent by volume. Because of fibrous concrete’s
increased flexural strength and the bridging of fibers across cracks that develop in the
fibrous concrete, the thickness of airfield pavements could be significantly reduced. The
military saw the advantage in steel fiber concrete, particularly in potential war zones
where they construct only unrienforced concrete airfields for rapid bomb damage repair
of runway craters. Fibers’ ability to absorb energy dynamically loaded is a valuable
property in terms of the amount of heaved pavement that needs to be removed from a
bomb-damaged airfield, damaged pavement which is twice the apparent diameter of the
crater. The U.S. Army Corps of Engineers discovered that the addition of 0.5 % or
greater volume of fibers to concrete resulted in a composite with increased ductility and
impact resistance7. However, this composite with large volumes of fiber also resulted in a
thinner, more flexible runway structure which caused an increase in vertical deflections
and densification or shear failures in the foundation, as well as, pumping of the subgrade
material and joint deterioration. To protect against these undesirable factors, the military
added limiting vertical deflection criteria to steel fiber FRC airfield design as illustrated
in the following table (Table1.1). Additionally, the United States Air Force was
concerned regarding potential damage to high performance fighter aircraft from the

-
6
ingestion of steel fibers into engine intakes, so research of steel fiber airfields was
abandoned. The failure of this concrete composite research study had as much to do with
the “single criteria” approach to material evaluation as with the composite itself.
Current advances in polymer technology makes fibrous (non-metallic) concrete
composites a relatively new but viable material for airfield pavement application.
However, polymer based composites lack a long-term performance history and their is
little empirical data or studies on FRC response under vehicle or aircraft loading. An
example would be the lack of fatigue coefficients for FRC, similar to those used by the
Portland Cement Association (PCA) to model thickness design of plain concrete.
Table 1.1:Allowable Fibrous Concrete Airfield Deflection (inches).(Source; Figure 4-19/Figure 4-20 TM 5-825-3/AFM 88-6).
Aircraft/Airfield Type
1,000 AircraftPasses
10,000 Aircraft Passes
100,000 Aircraft Passes
1,000,000 Aircraft Passes
F-15 Fighter 0.12 0.07 0.06 0.05C-141 Cargo 0.10 0.06 0.05 0.05B-52 Bomber 0.08 0.06 0.05 0.05B-1 Bomber 0.10 0.06 0.05 0.05C-130 Cargo 0.11 0.07 0.05 0.05Class I Airfield 0.13 0.08 0.05 0.05Class II Airfield 0.11 0.07 0.05 0.05Class III Airfield 0.11 0.07 0.05 0.05

-
7
The U.S. Army Corps of Engineers first used synthetic (non-metallic) fibers in
1965 in blast resistant vertical structures. In their analysis it was discovered that the
addition of even small quantities (0.5 percent by volume) of synthetic fibers to concrete
resulted in a composite with increased ductility and impact resistance. However, during
testing concerns surfaced regarding fiber balling during mixing which hindered uniform
fiber distribution, mix workability and abrasion resistance of the concrete surface. Glass
fibers were also studied and discarded because they quickly became brittle from the
alkalinity of the concrete. In contrast, during these tests, polypropylene fibers showed
improvements in flexural and tensile strength, significantly reduced bleeding and reduced
cracking8. Despite these early findings, to date relatively few studies have examined the
use of small volume (<0.5% fiber) concentrations of fiber and their effect on mix
workability, ductility, strength, impact resistance and abrasion as it pertains to airfields.
These synthetic fibers are man-made fibers resulting from relatively current
research and development in the petrochemical and textile industries. Polypropylene
fibers are extruded from olefin resin and today are being used extensively throughout the
U.S.A. and Canada in all types of concrete construction. They have proven to be an
effective method to better distribute cracking and reduce crack size7. Testing has also
showed superior fatigue strength, endurance limits (loads to failure) and toughness
properties associated with even small amounts of polypropylene fibers. Toughness is an
indication of the load carrying capabilities of the fibers within the concrete matrix after
first crack. Flexural strengths, toughness and endurance limits (fatigue) are important

-
8
design parameters, particularly in a airfield's pavement longevity (design life), because
these structures are subjected to repeated fatigue loading by aircraft.
RESEARCH OBJECTIVES
The major objectives of this research were to construct a step by step
methodology for comprehensively evaluating all facets of fiber-reinforced concrete's
(FRC) material’s behavior as it applies to improving the performance of the airfield
pavement as a system. Evaluate the benefits of using fiber reinforced concrete in terms of
pavement design thickness reduction, energy absorption and potential reduction in
pavement crater damage. To achieve these objectives the following steps were
undertaken.
Step 1. Conduct a literature review on the design behavior of fiber reinforced
concrete. The objective of this search is to determine those material properties that
enhance the performance of concrete as an airfield pavement. Once determined, the
criteria for “High-Performance Airfield Concrete (HPAC)”can be developed.
Step 2. Conduct laboratory testing for evaluating the behavior and performance of
fiber reinforced concrete as a HPAC. The results from the laboratory testing were used in
pavement analysis and design through finite element computer programs to develop
pavement thickness reduction equations.

-
9
Step 3. Through analytical modeling, establish relationships between fiber
concrete properties, specific aircraft gear geometry and wheel contact pressures to
develop predictive airfield design life equations.
Step 4. Develop equations to quantify the heaved pavement reduction potential of
fiber-concrete airfields due to explosive cratering.
Step 5. Propose an integrated concrete design selection methodology that includes
field testing for validating the assumptions and analysis of airfield pavement design based
on aircraft type and load configuration, environment, and fracture energy with actual
conditions in an iterative model improvement process.
In order to achieve the objectives of this research a variety of laboratory testing tasks
and mechanistic modeling were undertaken. In some cases, data was obtained from past
studies as well. These tasks were as follows:
(1) Examine the mix design and workability characteristics of low volume (<0.5 %)
polypropylene fiber reinforced concrete. The objective of this testing was to evaluate
workability of polypropylene fiber concrete at 0.1%, 0.2 %, 0.3%, 0.4% volumes as
compared to plain (0%) concrete. Slump was evaluated with ASTM C 995 by
monitoring the time of flow through the inverted cone test. The inverted cone test was
specifically developed to measure FRC workability and can be used to compare FRC
to conventional mixtures with similar slump values. For workability, the advantage of
the inverted slump cone test is that it takes into account the mobility and viscosity

-
10
characteristics of concrete, which comes about due to vibration.Plain concrete slump
was measured with the slump cone as outlined in ASTM C143.Thestandard ASTM
air content test equipment and procedures were used (ASTM C 138). Unit weight and
28-day compressive strength values were evaluated for each specimen and mixture.
(2) Evaluate the strength characteristics of polypropylene fiber reinforced concrete. The
objective of this testing was to evaluate the static flexural strength and fatigue
resistance of polypropylene fiber concrete at 0.1%, 0.2 %, 0.3%, 0.4% fiber volumes
as compared to plain (0%) concrete. The endurance limits (fatigue strength) in
dynamic flexural loading were determined as well. In this testing the third-point
loading was used as outlined in ASTM C 78.
(3) Examine the energy absorption capability of fiber reinforced concrete. ASTM C 1018
was used in toughness evaluation. ASTM C 39 Compressive Strength of Cylindrical
Concrete Specimens was used to study FRC ductility.Quantify, the energy absorption
capability of plain (0%), 0.1%, 0.2%, 0.3% and 0.4% polypropylene fiber concrete
from laboratory toughness testing analysis, compressive strength testing for ductility
and impact resistance literature research for polypropylene fiber concrete.
(4) Examine the shrinkage characteristics of low volume (<0.5%) polypropylene fiber
reinforced concrete with ASTM C 157 and the Steel Ring Test.

-
11
(5) Through Finite Element Modeling (FEM), establish pavement design requirements
for the concrete and relationships estimating pavement design thickness based on
specific aircraft wheel pressures and geometry. The fatigue models anticipate rigid
pavement design life for loading repetitions considering limiting pavement
deflections, and the material properties of concrete. Based on the above analysis,
establish pavement reduction values for FRC.
(6) Based on laboratory testing values of concrete specimens containing varying
amounts of polypropylene fiber up to 0.4%, create heaved pavement reduction
equations for airfield bomb damage crater analysis. These predictive equations were
used to quantify heaved pavement reduction based on material properties.

-
12
ORGANIZATION OF THE REPORT
The first chapter provides an overview of the need of an FRC composite for
airfield pavements, a brief historical review on the development of fiber-concrete
composites, the research objectives and a description of the organization of this
dissertation. Chapter two presents an extensive literature review of past research on
polypropylene fiber reinforced concrete, FRC material testing protocols and Finite
Element Method-Rigid Pavement programs. Chapter three presents the integrated mix
design methodology. The fourth chapter summarizes the extensive laboratory testing
quantifying the properties of polypropylene fiber reinforced concrete (FRC) as a
pavement material. Chapter five details the analytical evaluation and modeling used to
build the performance models quantifying the beneficial effects of FRC and includes the
fracture reduction model for explosive cratering so as to determine the reduction in
heaved pavement. Chapter six presents an example of the use of methodology for
quantifying the beneficial material properties of the polypropylene fiber reinforced
concrete composite for the C-17 aircraft using a concrete Design Mix #7. Finally,
Chapter seven presents the summary, conclusions and future recommendations.

-
13
CHAPTER 2. LITERATURE REVIEW
INTRODUCTION
The objective of this literature search was to review current research on
polypropylene fiber concrete and determine its material properties that will eventually
enhance the performance of concrete as an airfield pavement. These properties would be
used to develop the criteria for “high-performance airfield concrete (HPAC)”.According
to theFederal Highway Administration (FHWA), High Performance Concrete is defined
as concrete which meets special performance and uniformity requirements that cannot
always be achieved routinely by using only conventional materials and normal mixing,
placing, and curing practices5. In short, any concrete that satisfies certain criteria
proposed to overcome limitations of conventional concretes may be called high-
performance concrete (HPC). The requirements may involve enhancements of
characteristics such as placement and compaction without segregation, long-term
mechanical properties, early-age strength, toughness, volume stability, or service life in
severe environments. In the case of airfields, performance characteristics that enhance
concrete's ability to withstand higher stresses imposed by aircraft tire pressures, but less
loading repetitions as compared to highways. Performance characteristics that retard
surface deterioration (cracking) and improve impact resistance of runways due to the
unique operating environment of military aircraft.

-
14
MATERIAL BEHAVIOR CHARACTERISTICS
Polypropylene fiber is hydrophobic, meaning it does not absorb water and is
alkaline resistant.Polypropylene fibers do not bond chemically in the concrete mix, but
bonding has been shown to occur by mechanical interaction. Mechanical bonding
properties of the polypropylene fiber were found to be greater for twisted collated
fibrillated polypropylene fibers or for fibers with buttons (enlargements) added to the
fiber ends. Improved mechanical bonding is a direct result of the cement matrix
penetrating the fibrillated fiber network that anchors the fiber in the matrix. This
anchoring feature is called pegging7. Recommended fiber length in the concrete matrix is
usually a function of mix aggregate size (Table 2.1). Additionally, concrete workability
and abrasion resistance is satisfactorily maintained with admixtures and minimum mix
proportion adjustments5.
Table 2.1: Recommended Fiber Lengths (ref. Ozyildirim, Moen 1996).Aggregate Top Size Fiber Length
1/4 inch(6 mm) 3/4 inch(19 mm)1/2 inch(13 mm) 1 1/2 inch(38 mm)3/4 inch(19 mm) 2 1/4 inch(54 mm)1 inch(25 mm) 2 1/2 inch(60 mm)

-
15
Fatigue Strength of Polypropylene Fiber Reinforced Concrete
According to the ACI 544.1 R-96 “ Fiber Reinforced Concrete” American
Concrete Institute Report7, flexural fatigue strengths and endurance limit are important
design parameters, particularly in pavements, because these structures are subjected to
fatigue load cycles. ACI defines failure (fatigue) strength as the maximum flexural
fatigue stress at which a beam can withstand two million cycles of non-reversed fatigue
loading. The endurance limit of concrete is defined as the flexural fatigue stress at which
the beam could withstand two million cycles of non-reversed fatigue loading, expressed
as a percentage of the modulus of rupture of plain concrete. According to ACI, in slab-
on-grade applications with collated fibrillated polypropylene fiber contents up to 0.3
percent by volume, the fatigue strength was increased dramatically. The addition of
polypropylene fibers, even in small amounts, had increased the flexural fatigue strength.
Using the same mixture proportions, the flexural fatigue strength was determined for 0.1,
0.2, 0.3 percent fiber volumes and it was shown that the endurance limit was increased by
15 to 18 percent as compared to plain concrete. In another test, as polypropylene fiber
content increased 0.1%, 0.5%, 1.0% by volume at two million cycles the flexural fatigue
strength increased by 16%, 18%, and 38% respectively in comparison to plain concrete.
As stated by the ACI, there is a trend of increasing fatigue strength as polypropylene fiber
content is increased.
In a study by Nagabhushanam, Ramakrishnan, and Vondran9, fatigue strength
increased when fibrillated polypropylene fibers were added to the concretes. Fatigue
strength for plain concrete was 395 psi. Fatigue strength of 386 psi, 500 psi and 521 psi

-
16
were observed for 0.1%, 0.5% and 1% fiber concrete mixes respectively. These values
show a decrease of 2% for the 0.1% fiber concrete mix and an increase of 27% and 32%
for the 0.5% and 1% fiber concrete mixes. The endurance limit for the mixes with 0%
(plain), 0.1%, 0.5%, and 1% fiber contents were 50%, 58%, 59%, and 69% respectively
when expressed as a percentage of their own MOR by fiber case and not just as the
percentage of the modulus of rupture for plain concrete. Endurance improved with fiber
content, thus showing an improvement in the fatigue performance of FRC. Figure 2.1
shows fatigue strength values of 2.72 Mpa for plain concrete, 2.6 Mpa for 0.1% fiber, and
3.45 Mpa for 0.5% fiber and 3.56 Mpa for 1.0% fiber content. When the endurance limit
is expressed as the percentage of the modulus of rupture for plain concrete, the endurance
limit for 0.1%, 0.5% and 1.0% fiber contents were 116%, 118% and 138% respectively.
Thus fibrillated polypropylene (FPP) fiber reinforcement improves concrete's fatigue
strength properties and endurance limits, which translate to added years of pavement
longevity.
00.5
11.5
22.5
33.5
4
f max. MPa
Plain 0.1%fiber 0.5%fiber 1.0%fiber
Maximum Fatigue Strength
Figure 2.1: Maximum Fatigue Strength (ref. Nagabhushanam 1989).

-
17
Flexural fatigue strength of fibrillated polypropylene fiber-reinforced concrete
was also investigated by Nagabhushanam in 1989 9. Nagabhushanam’s paper presents the
results of an experimental investigation to determine the flexural fatigue strength of
concrete reinforced with three different concentrations of fibrillated polypropylene fibers.
The properties and performance of fresh and hardened concrete with and without fibers
are compared. The test program included the evaluation of 1) flexural fatigue strength
and endurance limit 2) hardened concrete properties, such as compressive strength, static
modulus, pulse velocity, modulus of rupture, and toughness indexes and 3) fresh concrete
properties, including slump, vebe time, inverted cone time, air content, and concrete
temperature. The test results indicated an appreciable increase in post-crack energy
absorption capacity and ductility due to the addition of fibers. When compared with plain
concrete, the flexural fatigue strength and the endurance limit at two million cycles
significantly increased. The static flexural strength of the specimens also increased after
being subjected to repetitive loading at a stress level below fatigue strength.
In the paper by Vondran, G.L., Nagabhushanam, M., Ramakrishnam, V. “ Fatigue
Strength of Polypropylene Fiber Reinforced Concretes” 31 of flexural fatigue strength of
concrete reinforced with three different concentrations of fibrillated polypropylene fibers
are presented. In this study it was observed that there was an appreciable increase in post-
crack energy absorption capacity and ductility due to the addition of fibers. When
compared to plain concrete, there was a significant increase in flexural fatigue strength
and the endurance limit for two million cycles. The main thrust of the investigation was
to determine the endurance limit in fatigue loading. The two million cycles were chosen

-
18
to approximate the life span of a structure that may typically be subjected to fatigue
loading, such as a bridge deck or highway pavement.
Interestingly, two million cycle fatigue loading testing at stress levels below the
endurance limit did not lead to a decrease in static flexural strength when the specimens
were later re-tested. In most cases, the flexural strength increased slightly, especially
when the stress to which the specimen was subjected earlier was lower than the fatigue
stress at the endurance limit. This may or may not be attributed to specimen aging.
According to these researchers, a significant advantage of polypropylene under dynamic
loads is its relatively low elastic modulus at slow rates of loading, which increases
because the effect of time-dependent visco-elastic behavior is eliminated. ACI 544.1R-49
reports similar results, that polypropylene fiber reinforced concrete subjected to fatigue
stress loading below the endurance limit show increased static flexural strength. The
implications of increased modulus of rupture values over time, under vehicle or aircraft
loading conditions below the endurance limit would be significant.
Yin, W. S. and Hsu, T. C 10 studied fatigue behavior of fiber reinforced concrete
under uni-axial and bi-axial loading. The stress ratio (S) to load cycles to failure (N)
curves and the cyclic deformations of fiber concrete were compared to those of plain
concrete. It was found that the S-N curve of fiber concrete is a straight line from one to
one million cycles, rather than a curve. The addition of fibers to concrete increases the
fatigue life, while the failure mode remains the same.

-
19
Ramakrishnan, V. and Lokvik, B. J. 11 presented the results of an analytical
investigation to determine the flexural fatigue strength of fiber reinforced concretes
(FRC). Four different types of fibers were used: straight steel, corrugated steel, hooked
end steel, and polypropylene fibers. These fiber concretes were investigated for two
different fiber quantities (0.5% and 1.0% by volume), whereas the same basic mix
proportions had been used for all the concretes. More than 300 beams were subjected to
fatigue testing with third point loading at a frequency of 20 load cycles per second, in a
range of one to four million cycles and were then analyzed. For a better accuracy in
generating the S-N curves, statistical and probabilistic concepts are introduced to predict
the flexural fatigue model and the fatigue life expectancy of the composite. In this study,
it was also found that fiber reinforced concrete at it's endurance limit, fatigue strength
increased with fiber volume.
A study by Grzybowski and Meyer1 investigated damage accumulation in
concrete with and without fiber reinforcement. The study’s goal was the development of
a damage model that permits the prediction of remaining life of a material subjected to a
load history of known characteristics. The study underscores the important role of micro
cracking especially at stress levels (S) in excess of 75% of ultimate strength where crack
growth accelerates toward failure. In fiber reinforced concrete, well-dispersed and
distributed fibers retard the growth of micro-cracks. Furthermore, in FRC the
development of a large number of small cracks instead of a small number of large cracks
is observed, large cracks would normally cause failure.

-
20
In this same study, S-N curves for concrete with varying quantity content of
polypropylene and steel fibers were developed. A fiber content of 0.25% optimized
fatigue behavior. As an example, for a stress ratio of 0.8, the number of cycles to failure
for plain concrete was 1,000. If 0.25% of polypropylene fibers are added, the number of
cycles to failure is increased to over 10,000. The implication of increased fatigue
resistance for concrete highway or airfield pavements, subjected to high traffic volume, is
improved pavement longevity and lower maintenance and repair costs.
In the study by Grzybowski and Meyer1 energy dissipation as a measure of
damage accumulation in concrete was observed. One cycle per second (cps) fatigue test
results are shown in Figure 2.2. This test shows the number of cycles to failure as a
function of stress ratio and fiber volume. Fiber reinforcement has a clear beneficial effect
on the fatigue behavior of concrete as long as the fiber count is not much larger than 0.25
percent.At 0.25%, the beneficial effect of polypropylene on the total energy-absorption
capacity of concrete seems to peak, irrespective of the stress level. Beyond 0.5% percent
fiber volume, the effect is insignificant. Additionally, at higher stress ratios (S > 0.75)
polypropylene fiber’s energy absorption capacity decreases almost exponentially. The
experimental results confirmed the dual effect of fiber reinforcement on the cyclic
behavior of concrete. By bridging microcracks, fibers tend to retard their growth, thereby
causing a strength increase. Fibers also increase the pore and initial microcrack density,
thereby causing a strength decrease. The combination of these two effects is a net
increase in cyclic strength with increasing fiber volume up to 0.25%.

-
21
S-N Curve for Concrete Sample
0.60.650.7
0.750.8
0.850.9
0.951
0 1 10 100
1000
1000
0
1000
00
Number of Cycles to Failure(N)
Stress Level(S)
0.25% fiber0.5% fiberplain
Figure 2.2: Fatigue Strength (ref. Grzybowski, Meyer 1993).
Static Flexural Strength of Polypropylene Fiber Reinforced Concrete
There is no consensus in the published literature about the effect of adding
polypropylene fibers on flexural strength (modulus of rupture). Studies conducted have
reported that the modulus of rupture determined at 7 and 28 days was slightly greater for
fibrillated polypropylene FRC at fiber contents of 0.1 to 0.3% percent by volume. When
using the same basic mix proportion, decreases in compressive strength at higher fiber
contents (0.1% to 2%) suggests the direct flexural test may be misleading regarding FRC
comparisons. Figure 2.3 illustrates the effect of adding varying quantities of fibrillated
polypropylene fiber to a concrete mix for plain concrete. When normalized for the
compressive strength (√fc) for each fiber case, flexural strength results are more
pronounced at 0.1% to 0.5 % volumes. This suggests a need to adjust mix designs to
ensure similar compressive strengths for fiber flexural strength comparisions7.

-
22
Figure 2.3: ACI-FRC Flexural Stress Comparisons (ref. ACI 544.1R96 1997).
Alwahab and Sororushian reported significant improvements in polypropylene
fiber concrete's flexural strength in a Bayasi and Zeng study. Specifically at 0.3 %
percent fiber volumes, a strength of 900 psi was obtained as compared to a plain concrete
value of 700 psi and a 0.1% fiber strength value similar to plain. This was attributed to
the application of fibrillated polypropylene fiber, which could maintain a significant
portion of its flexural resistance at large deformations beyond peak load10.
According to the Bayasi and Zeng study10, there are a number of factors that
influence the behavior and strength of FRC in flexure. These include: type of fiber, fiber
length (L), aspect ratio (L/df) where df is the diameter of the fiber, the volume fraction of
the fiber (Vf), fiber orientation, fiber shape, and fiber bond characteristics (fiber
deformation). Although increasing aspect ratio (L/df) has long been recognized as a
positive influence on FRC performance, because of the improved resistance to pullout of
the fibers from the matrix, the effect of the aspect ratio was quite small compared with
Ratio of Modulus of Rupture to the Compressive strength square root
0
5
10
15
20
Fiber content
MO
R/ f
c sq
. ro
ot
MOR/ fc ratio
Plain0.1 to 0.5%
1%

-
23
that of the fiber content. Fiber content seems to be the parameter that is of primary
importance in determining the first-crack and ultimate strengths under static flexure
loading.
In a flexural test study by Tawfiq , Armaghani and Ruiz, collocated fibrillated
polypropylene fibers( FiberMesh) were subjected to static flexural testing (ASTM C 78)
and demonstrated a 10% average increase in strength as compared to the plain concrete
samples. In the plain concrete beams the strain measurements were 70 percent less than
the strain values from the fiber reinforced concrete beams at an applied stress of 500 psi.
This test result quantified the delay period in strain and crack development in fiber
reinforced concrete. Testing indicates that fiber reinforcement delays crack initiation by
about 18 percent, correcting an inherent weakness of concrete in tension due to the
mechanical bonding behavior of fibers in the concrete matrix11.
A significant flexural strength characteristic of fiber reinforced concrete is the
pseudo-strain hardening phenomena associated with dynamic fatigue loading of
specimens below their endurance limit. There is an increase in flexural strength for FRC
and some plain concrete beams after they were tested for fatigue. An increase in flexural
strength that is higher than can be attributed to the increase in age alone and appears to be
a function of the fatigue stress at which the specimens were originally loaded. The
Ramakrishnan study concluded that the increase in flexural strength of a beam after
fatigue loading was inversely proportional to the applied fatigue stress. When fiber
concrete is subjected to a fatigue stress below its endurance limit, there is an increase in

-
24
the flexural strength by as much as 35% for 0.50% fiber volumes. If a beam is subjected
to an applied stress lower than its fatigue stress, it may never fail in repetitive loading at
that stress level9. This has important implications for both highway and airfield
pavements, which are typically designed in this regard. This unique material
characteristic of FRC contributes to the improvement of fatigue strength over time.
Tensile Strength of Polypropylene Fiber Reinforced Concrete
According to Shah 12 analysis of tensile tests results done on concrete with glass,
polypropylene and steel fibers indicate that with such large volume (ranging up to 15
percent) of aligned fibers in concrete, there is substantial enhancement of the tensile load
carrying capacity of the matrix. In Splitting Tensile tests, the failure in tension of cement-
based matrices is rather brittle and the associated strains are relatively small in
magnitude. The addition of fibers to such matrices, whether in continuous or
discontinuous form, leads to a substantial improvement in the tensile properties of the
FRC in comparison with the properties of the un-reinforced matrix.
In his investigation of FRC for use in transportation structures, Celik Ozyildirim13
tabulated the results of varying volumes of fibrillated polypropylene fiber on spilt tensile
and compressive strength properties (Table 2.2). As fiber volume increased, there was an
increase in tensile strength.

-
25
Table 2.2: Fiber Tensile Strength Values (ref. Ozyildirim, Moen 1996).
Fiber Content Compressive StrengthMpa (psi)
Split Tensile StrengthMpa (psi)
0%(plain concrete) 41.7 (6,050) 4.26 (620)0.2% 46.6 (6,760) 4.44 (645)0.3% 42.0 (6,100) 4.56 (660)0.5% 45.5 (6,600) 4.80 (695)0.7% 39.7 (5,760) 4.70 (680)
Toughness Behavior of Polypropylene Fiber Reinforced Concrete
According to ASTM C 1018, there are three stages of the load-deflection response
of FRC mixtures tested; first crack, peak strength in flexure and toughness (Figure 2.4).
A relatively linear response up to point A is observed initially. The strengthening
mechanism in this portion of the behavior involves a transfer of stress from the concrete
matrix to the fibers by interfacial shear. The imposed stress is shared between the matrix
and fibers until the matrix cracks at what is termed as “first cracking strength”. Next there
is a transition nonlinear portion between point A and the maximum load capacity at
point B. After cracking, the stress in the matrix is progressively transferred to the fibers.
With increasing load, the fibers tend to gradually pull out from the matrix leading to a
nonlinear load–deflection response until the ultimate flexural load capacity at point B is
reached. This point is termed as “peak” strength. Finally, a post peak descending portion,
following the peak strength until complete failure of the composite. The load–deflection
response in this portion of behavior and the degree at which loss in strength is

-
26
encountered with increasing deformation is an important indication of the ability of the
fiber composite to absorb large amounts of energy after failure and is a characteristic that
distinguishes fiber-reinforced concrete from plain concrete. This characteristic is referred
to as toughness.
In terms of flexural toughness, the toughness index is an indication of the load
carrying capabilities of the fibers within the concrete matrix after the first crack. The
toughness index (I) is a measure of the capacity of fracture energy absorption and
ductility of the specimen. The toughness index is defined as the area under the load-
deflection curve up to a specific deflection divided by the area under curve up to the point
where concrete first cracks. Plain concrete fails immediately upon cracking, without
further load carrying capacity so I is always equal to 1.0 for plain concrete. However,
concrete beams reinforced with fiber continue to deflect in a ductile fashion. Regarding
the toughness index, the beams with higher fiber contents exhibited higher energy
absorption and improved ductility properties (Figure 2.5). According to ASTM C 1018,
there are three measured deflection points for toughness; I-5 (3 times the deflection at 1st
Crack), I-10 (5.5 times the deflection at 1st Crack), and I-30 (10.5 times the deflection at
1st Crack). Residual strength factors R 5-10 and R 10-20 represent the average level of
strength retained after first crack as a percentage of the first crack strength for the
deflection intervals14. Values of 100 correspond to perfectly plastic behavior and plain
concrete has a residual strength value of zero.

-
27
δ 3δ 5.5δ 10.5δFigure 2.4: ASTM C 1018; Load-Deflection Curve (ASTM Standards 2001).
.
According to ACI 544.1R-49, strength at first crack and at complete failure increased
significantly with the addition of polypropylene fiber compared to plain concrete.
Additionally, post crack reduction in load generally decreased as fiber content increased.
Fiber reinforced concrete’s ability to absorb elastic and plastic strain energy and to
transfer tensile stresses across cracks is an important performance factor for
serviceability.
A comparative evaluation of the static flexural strength for concretes with and
without four different types of fibers: hooked-end steel, straight steel, corrugated steel,
and polypropylene fibers was conducted by Ramakrishnan 15.The fibers were tested at
0.5, 1.0, 1.5 and 2.0% by volume. It was reported that maximum quantity of hooked-end
fibers that could be added without causing balling was limited to 1.0 percent by volume
DEFLECTION
LOAD
First Crack (A)
Post crack energy absorptionarea
Toughness Indices; ratio of
deflection areas as compared
to first crack area.
Plain concrete; I = 1.0
(B) (C)

-
28
and the same basic mix proportions were used for all concretes. Compared to plain
concrete, the addition of fibers increased the first cracking strength 15 to 90 percent and
static flexural strength 15 to 129 percent. Compared on equal basis of 1.0 percent by
volume, the hooked-end steel fiber contributed to the highest increase, and the
polypropylene fibers provided the least appreciable increase in the above mentioned
properties.
Johnston and Zemp5 investigated the flexural performance under static loads for
nine mixtures. The results of Johnston’s work indicated that increasing the fiber content
from 0.50 to 1.50% had a significant beneficial effect on the first crack and ultimate
strengths despite the negative influence of increasing water/cement ratio (w/c). The
increase in first crack strength was 31%, unadjusted for the differences in w/c.
With the adjustment in w/c, the increase is 63% over the value for 0.5% of the same
fibers.
Bayasi and Celik16 studied the flexural strength of synthetic fiber-reinforced
concrete. Two fiber types were used, fibrillated polypropylene fibers and polyethylene-
terphalate polyester fibers. Fiber volume fractions ranged from 0 to 0.60% and fiber
length were 12 mm (0.5 in.). Silica fume was used as partial replacement of Portland
cement on an equal mass basis at 0, 5, 10 and 25%. The results indicate that polyester
fiber and polypropylene fibers have an inconsistent effect on the flexural strength but
significantly increase the flexural toughness and the post-peak resistance of concrete.

-
29
0
5
10
15
20
Avg. Toughness Index
0.1% fiber 0.5%fiber 1.0%fiber
TOUGHNESS INDICES
I 5 SeriesI 10 Series
I 30 Series
Figure 2.5: Toughness Indices (ref. Bayasi, Celik 1993).
In a study by Celik Ozyildirim and Christopher Moen17 the strength properties of
polypropylene fiber at different volume contents were evaluated. First crack strength and
toughness values were determined in accordance with ASTM C-1018 and the results of
the laboratory investigation are tabulated in Table 2.3. The toughness of concrete
improved with increasing fiber content, and first crack strength reached a peak at a fiber
content of 0.20%.
Table 2.3: Polypropylene Fiber Concrete Properties (ref. Ozyildirim, Moen 1996).
Fiber Content
First CrackMpa (psi)
ToughnessIndices I-5
I-10 I-20 Residual FactorsR-5,10
R-10,20
0 % 4.95 (720) 1 1 1 0 00.2 % 5.40 (785) 1.7 2.4 3.9 14.9 14.80.3% 4.25 (615) 2.4 4.1 7.3 33.8 31.70.5% 5.05 (730) 2.8 5.0 9.2 44.3 42.50.7% 5.15 (745) 3.8 6.9 13 61 61

-
30
Compressive Strength of Polypropylene Fiber Reinforced Concrete
Compressive Strength of concrete is evaluated according to ASTM C 39 using 6
inch x 12 inch concrete cylinders. According to ACI 544.1 R-96 “ Fiber Reinforced
Concrete” 7 polypropylene fibers at different quantities have no effect on compressive
strength. However the fibers had a significant effect on the mode and mechanism of
failure of concrete cylinders in a compression test. The fiber cylinders failed in a more
ductile mode, particularly true for higher strength concrete where the cylinders endure
large deformations without shattering.
The “Damage Accumulation in Concrete with and without Fiber Reinforcement”
study by Grzybowski and Myer investigated damage accumulation in concrete with
varying volumes of fiber reinforcement1. Regarding the results of compressive tests,the
mean strength of plain concrete was very close to the target strength of 7000-psi (48.3
kN). The results further indicated that polypropylene fiber reinforcement has no
noticeable effect on the compressive strength of concrete. If anything, a slight reduction
due to the fiber’s low elastic modulus as compared to the concrete modulus. Other
researchers, Nakagawa5 conducted compressive strength tests of concrete with short
discrete fibers. The results indicated that compressive strength tends to decrease when the
fiber volume was increased. The effect of large volume of entrained air, due to the
increase of fiber volume, had a significant influence on this reduction of strength.

-
31
Three 10 ft x 10 ft x 0.5 ft concrete slabs were cast at the Wiss, Janney, Elstner
Associates laboratories. Oneslab plain, one slab with 0.10% polypropylene fiber
(FIBERMESH) and one slab with one layer of 6x6-W1.4 x W1.4 welded wire mesh
(W.W.M.). A standard 4,000 psi, one cubic yard concrete mix for all slabs; Type I
Portland cement, non air entrained, #6 gravel, #2 sand and use of a water reducing
retarder. The plain, welded wire mesh and FIBERMESH slabs failed at 16,000 lb, the
flexural capacity of FIBERMESH was 2% higher and in compression, 8% higher than
plain concrete. Compressive and flexural strength tests are summarized in Table 2.4.
FIBERMESH is considered a suitable substitute for W.W.M. The following engineering
values were provided from their report (Table 2.5).
Table 2.4: 0.10% Fiber Strength Values (ref. Wiss, Janney, Elstner Associates).
CONCRETE SLAB(28 days) Compressive Strength Flexural StrengthPlain 5,930 psi
( 41.51 N/mm(mm))750psi(5.25 N/mm(mm))
FIBERMESH(0.10 %) fiber 6,260 psi(43.82 N/mm(mm))
755 psi(5.28 N/mm(mm))
W.W.M. Not given Not given
Table 2.5: 0.15% Fiber Strength Values (ref. Wiss, Janney, Elstner Associates).
CONCRETE SLAB(28 days)
Compressive Flexural Splitti ng Tensile
Plain 3,905psi( 27.33 N/mm(mm))
385psi(2.51 N/mm(mm))
275psi(1.93 N/mm(mm))
FIBERMESH(0.075 %)fiber
4,240 psi(29.68 N/mm(mm))
390psi(2.73 N/mm(mm))
290psi(2.03 N/mm(mm))
FIBERMESH (0.15%) 4,345psi(30.42 N/mm(mm))

-
32
Impact Resistanceof Polypropylene Fiber Reinforced Concrete
Impact resistance in the Nagabhushanam, Ramakrishnan, and Vondran study9
reported blows to failure for plain concrete specimens were very low; for specimens
reinforced with polypropylene fibers the blows to failure increased tremendously. For all
fiber concretes (0.1%, 0.5%, 1%) the number of blows to first crack and final failure was
higher than that of plain concrete. Blows to first crack using the drop-weight test were 10,
30, 20 and 50 and full failure at 20, 50, 75 and 100 for plain, 0.1%, 0.5%, and 1% fiber
volumes. Fiber concrete has excellent impact resistance, which increases with an increase
in fiber content.
According to the ACI committee Report 544.2R4, impact strength at first crack
and complete failure increased significantly with the addition of polypropylene fiber at
0.1% to 2% by volume with improvements in fracture energy between 33% and 1,000 %.
At 0.5% fiber volumes, impact fracture energy was twofold for 6,000 psi concrete and
tenfold for 12,000 psi concrete. In Ramakrishnan, Wu and Hosalli’s paper18, a
comparative evaluation of concrete properties with and without four types of fibers
(hooked-end steel, straight steel, corrugated steel, and polypropylene) at two different
quantities (0.5 and 1.0% by volume), using the same basic mixture proportions are
presented. The impact strength was increased substantially as compared to plain concrete.
by the addition of all four types of fibers. The ¾” polypropylene fiber composites showed
an improvement in the drop-weight test of blows to failure of 200, 250, and 225 for 0.1%,
0.5% and 1% fiber contents.

-
33
In the “Investigation of Fiber-Reinforced Concrete for Use in Transportation
Structures”17the results for impact resistance indicated the number of blows to first crack
and ultimate failure increases with increasing fiber volume and length as tabulated in
Table 2.6.
Table 2.6: Impact Data ;ACI 544.2R(ref. Ozyildirim, Moen 1996).
Fiber Content Blows to First Crack Blows to FailurePlain Concrete (0%) 65 68
0.2% 60 690.3% 56 690.5% 79 940.7% 111 131

-
34
Creep Behavior of Fiber-Reinforced Concrete
ASTM C 512; Creep of Concrete in Compression measures creep of molded
6 inch x 12-inch concrete cylinders subjected to a sustained longitudinal load by a
spring–loaded creep frame14. Balaguru and Ramakrishnan conducted creep tests in
accordance with ASTM C 512 on fiber reinforced concrete19. The 0.6% fiber content
specimens (Vf = 0.6%) with a length to fiber diameter ratio (L/df = 100) were subjected to
a sustained load between 19% and 25% of their compression strength (stress to strength
ratio; 0.19 to 0.25). Tests showed that the creep strains were consistently higher for FRC
as compared to plain concrete. Creep tests conducted by Houde5 on polypropylene and
steel fibers also showed that the addition of fibers increases the creep strains of the fiber
composite by about 20% to 30% in comparison with the un-reinforced matrix. Mangat
and Azari reported reductions in the creep strains with FRC in comparison with plain
concrete at greater fiber volumes5. For instance, at 3% by volume of fibers and at stress to
strength ratio of 0.30, a reduction of about 25 % in creep strain compared to plain
concrete. However, it was observed that the fibers were less effective in restraining creep
at high stress to strength ratios of 0.55. The low effectiveness of fibers in decreasing the
creep strains at large stress to strength ratio was attributed to the reduced interfacial bond
characteristics of the fibers under creep. A large stress to strength ratio increases the
lateral strains and hence decreases the interfacial pressure between the fibers and the
surrounding concrete. This in effect reduces the restraint to sliding action between the
fibers and the concrete matrix and results in larger creep strains.

-
35
Shrinkage Cracking of Polypropylene Fiber-Reinforced Concrete Slabs
Any potential shrinkage may lead to complications, externally because of
structural interaction with other components or internally when the concrete is reinforced.
There may even be distress if either the cement paste or the aggregate changes
dimension, with tensile stresses set up in one component and compressive stresses in
another. Cracks may be produced when the relatively low tensile strength of the concrete
or its constituent materials is exceeded. Cracking not only impairs the ability of a
structure to carry its design load but may also affect its durability and damages its
appearance.
In airfield pavements, crack propagation is a potential source of Foreign Object
Debris (FOD) with dislodged aggregates damaging high performance fighter aircraft as
they are sucked into jet engine intakes. Pumping occurs under slabs subjected to repeated
passes of heavy lift transport aircraft like the C-141/C-5 aircraft. During pumping, these
cracks transport fine-grained subsurface soils onto the pavement surface, leaving large
subgrade voids under the slab.
ACI 544.1 R-96 cited that several reports have shown that low denier fiber and
high fiber counts reduced the effects of restrained shrinkage cracking. The addition of
fiber also reduced the average crack width significantly as compared to plain concrete.
Plastic shrinkage reductions of 12 to 25% have been reported for 0.1% to 0.3% fiber

-
36
volumes. ACI also reported reductions in drying shrinkage (volume changes) using
polypropylene fibers at 0.1% by volume in unrestrained concrete specimens. Using
accelerated drying conditions, under variable conditions, early age specimen
measurements showed a 18%, 59%, and 10% reduction in shrinkage for 0.1%, 0.2%, and
0.3% fiber volumes as compared to plain concrete.
Soroushian, Mirza, and Alhozaimy investigated the effects of polypropylene
fibers during construction operations on the plastic shrinkage cracking of concrete
slabs20. Polypropylene fibers, at relatively low fiber volume fractions, were observed to
reduce substantially the total area and maximum crack width of slab surfaces subjected to
restrained plastic shrinkage movements. The rate of screeding (finishing) of the fresh
concrete surface was also a critical factor, particularly in plain concrete. Slower screeding
rates led to reduced plastic shrinkage cracking.
Plastic shrinkage cracking occurs in fresh concrete within a few hours after
placement. The principal cause of this type of cracking is an excessively rapid
evaporation of water from the concrete surface21. In a study by Johnston22, results
obtained by forced air testing over a polypropylene fiber reinforced slab at fiber contents
of 0.05, 0.1 and 0.2 % by volume and fiber lengths of 13, 19 and 51 mm indicate that
plastic shrinkage cracking can be reduced from 20 to 90%. The best results were obtained
at a fiber content of 0.2%, fiber lengths of 19 mm and 51 mm, water-cement ratio of 0.48,
40 % relative humidity and at 35 °C.

-
37
In a paper by Balaguru23, results indicate that both steel and synthetic fibers make
a definite contribution to shrinkage crack reduction during the initial and final setting
periods. According to Shah and Grzybowski24, the effect of fibers in restraining the free
drying shrinkage strains was found to be insignificant. The primary advantage of fibers in
relation to shrinkage is their effect in reducing the width of shrinkage cracks.
The American Society of Testing Materials standard test for shrinkage is for free
shrinkage (ASTM C 157) which describes the method for measuring the length change
(using a comparator dial) of hardened concrete at any age due to causes other than
externally applied forces and temperature changes25. Another important test to evaluate
the performance of fiber reinforced concrete as compared to plain would be the steel ring
test (Figure 2.6) to evaluate restrained shrinkage. Restrained shrinkage has been
monitored using the steel ring to measure crack width, and crack development7.
Figure 2.6: Steel Ring Test (ref. ACI 544.1R96 1997).
Cracks
Steel Ring Concrete

-
38
In a study by Miroslaw Grzybowski and Surendra P. Shah24the steel ring test was
used to measure restrained shrinkage cracking of concrete with collated, fibrillated
polypropylene fiber contents of 0.1 to 1% by volume. The results of the test showed that
small amounts of fibers (0.25%) could substantially reduce crack width. The average
crack width of the specimen reinforced with 0.25% polypropylene fiber was 0.5mm
(0.016 inches), or about one-half the value of plain (0% fiber) concrete after six weeks
(Table 2.7). However, at 0.1% fiber content, polypropylene fiber did not influence
observed crack width as compared to plain concrete.
The ACI 7 has not declared a standard test for restrained plastic shrinkage
evaluation of FRC, however the test being studied involves fan-forced air over the
surface of a new concrete slab to induce plastic shrinkage and then a count is made of
crack width and lengths over a specified area. Recent FRC results, using this test indicate
a 20%-90% reduction in shrinkage cracking as compared to a plain matrix (Figure 2.7).
Table 2.7: Concrete Restrained Shrinkage Cracking (ref. Grzybowski, Shah 1990).
Fiber Content 0% 0.1% 0.25% 0.5% 1%Number of Cracks 1 1 1 1 2Crack Width (mm) 0.900 0.875 0.480 0.230 0.150

-
39
Figure 2.7: Restrained Shrinkage Cracking (ref. ACI 544.1R96 1997).
Freeze-Thaw and Surface Deterioration Resistance of Polypropylene Fiber Reinforced Concrete
As pointed out by ACI Committee 5445, the addition of fibers themselves has no
significant effect on the freezing and thawing resistance of concrete. That is, concretes
that are not resistant to freezing and thawing will not have their resistance improved by
the addition of fibers. The well known practices for achieving durable concrete and the
same air entrainment criteria for plain concrete should be used also for fiber reinforced
concrete. The test standard for scaling resistance of concrete pavements is ASTM C 672;
Scaling Resistance of Concrete Surfaces Exposed to Deicing Chemicals.After 250
freeze-thaw cycles, the sample is observed visually and subjectively rated as follows
(Table 2.8).
0
0.2
0.4
0.6
0.8
1
0 fiber 0.5% fiber 1% fiber 1.5% fiberPolyproplene
E = 4.8 Gpa
Fiber Volume
Crack Width (mm)
CRACK DEVELOPEMENT

-
40
Table 2.8: Surface Scaling Rating (ref. ASTM Standards).
Rating Surface Condition0 No scaling1 Slight scaling(1/8 inch); no visible aggregate2 Slight to Moderate Scaling3 Moderate scaling(some coarse aggregate visible)4 Moderate to Severe Scaling5 Severe Scaling(surface coarse aggregate visible)
In a study by Nanni and Johari26, the results indicated some beneficial effects of
fibers on scaling prevention of existing pavements. Most studies point to low
water/cement (w/c) ratios as the significant factor in resistance to deicing27.. In another
study by Langan and Ward28, the salt scaling of non air-entrained concrete at different
w/c was tested according to ASTM 672. No scaling was found in the concrete and
concrete showed that w/c was the most important factor in evaluating scaling resistance
of these concrete’s at the w/c of 0.24 and 0.27.
The addition of polypropylene fiber to a concrete mix with adequate curing
enhances the deterioration resistance of concrete surfaces subjected to cyclic wet/dry
seawater exposure as reported by Al-Tayyib and Al-Zahrani29. Tests were carried out on
30 concrete slab specimens made with and without polypropylene fibers. Some
specimens were cured under laboratory-controlled conditions and were subjected to the
wet/dry cycles for 85 weeks, while others were cured under field conditions and were
subjected to the same cycles for 50 weeks. The results indicate that addition of
polypropylene fibers effectively retard the deterioration process of the surface skin of the
concrete specimens cured in hot weather environment.

-
41
Abrasion tests by Nanni26 in accordance with ASTM C 799, procedure C on
field–cut and laboratory–made specimens showed no significant difference between the
abrasion resistance of plain concrete and steel or synthetic fiber-reinforced concrete.
Klieger and Lamond studies4 reported consistently higher abrasion losses of fiber
reinforced concrete as determined by ASTM C1138 testing over a wide range of water-
cement ratios and compressive strengths. Losses generally due to less coarse aggregate
per unit volume of concrete as compared to plain concrete.
Permeability of Polypropylene Fiber Reinforced Concrete
Permeability refers to the amount of water migration through concrete when the
water is under pressure, and also to the ability of concrete to resist penetration of any
substance, be it liquid, gas, or chloride ion. AASHTO T 277 and ASTM C 1202-91 Rapid
Chloride Permeability Test were developed because of a need to rapidly measure
permeability of concrete to chloride ions. The testing procedure includes factors such as
temperature, AC impedance, initial DC current, charge passed, and chloride ion profiles
during polarization of concretes. Al-Tayyib and Al-Zahrani’s research results of electrical
resistively, water absorption, and permeability tests do not show any significant
improvement due to the inclusion of polypropylene fibers30. Using the Von water
migration test method for 6"X 6" X12" concrete cylinders, the specimens containing
polypropylene fiber (Durafiber) showed a definite reduction in permeability when
compared to the control specimens (Table 2.9).

-
42
Table 2.9: Von Water Migration Test Method (ref. AASHTO Durafiber Study).
Water Migration(Mls)
2 Days 7 Days 21 Days 28 Days Total Migration(% )
Control(0% fiber) Concrete
0 1.0 1.7 2.6 5.3 100
Durafiber 0 0 0.4 1.6 2.0 38
Workability of Polypropylene Fiber Reinforced Concrete
According to ACI 544.1 R-96 7 satisfactory workability has been maintained even
with a relatively high fiber content (2.0 percent by volume) with the addition of an
appropriate amount of high range water reducer to maintain equal strength and water-
cement ratio. In a study by Vondran, Nagabhushanam, Ramakrishnam31satisfactory
workability was maintained even with a relatively high fiber content and there was no
balling or tangling of fibers during mixing and placing. This was achieved by adjusting
the amount of superplasticizer or water-cement ratios to maintain the same strength.
Elastic Modulus, Poisson’s Ratio and Coefficient of Thermal Expansion of FRC
According to ACI 544.1 R-967, the addition of fibrillated polypropylene fibers to
concrete had no effect on the static modulus of elasticity. The properties of polypropylene
fibers used in this study are shown in Table 2.10. According to FHWA-RD-97-030 State-
of-Art Report5 by Zia, Shuaib, Ahmad, and Leming, the authors are not aware of any
investigation dealing with the thermal expansion or poisson’s ratio of fiber-reinforced
concrete.

-
43
Table 2.10: Polypropylene Fiber Properties (ref. ACI 544.1R96 1997).
Fiber Type
Specific Gravity
Tensile Strength(ksi)
Elastic modulus(ksi)
Ultimate elongation ( percent)
Ignition temp.(degrees F)
MeltTemp.(deg. F)
Water Absorption
Poly-propylene
0.9-0.91 20-100 500-700 15 100 330 Nil.
ANALYTICAL MODELS
For the analytical evaluation of this research, two finite element method (F.E.M.)
programs were selected. These programs were used to predict airfield pavement
performance over a 20-year design life as specified by the Federal Aviation
Administration (FAA) or military standards. The laboratory testing data for flexural and
fatigue strength of plain and fiber reinforced concrete in Chapter four was used to
calculate pavement thickness for a specified aircraft and design mixture. Comparisons
between FRC and plain concrete were made to determine pavement reduction values.
Yang H. Huang, Professor of Civil Engineering, developed the Finite Element
Program KenSlabs at the University of Kentucky. KenSlabs is based on a finite element
program in which a concrete pavement slab is divided into rectangular finite elements
with a large number of nodes. Both wheel loads and subgrade values are applied to the
slab as vertical concentrated forces at certain nodes. Each slab can have a maximum of 15
nodes in both the x and y direction. Foundation assumptions are based on Westergaards’
theory (liquid layer/winkler spring), the solid foundation theory (Boussinesq) or the layer
theory (Burmister). For Damage Analysis, the program is capable of dividing the year

-
44
into 24 periods (seasons) and can evaluate up to 24 vehicle load groups. Seasonal
variations are accounted for by a factor applied to the modulus of subgrade reaction (K)
so as to vary foundation conditions. Damage is based on fatigue cracking only, which is
the significant failure characteristic of fiber reinforced concrete. Specifically, through the
following fatigue model in this program which is mathematically expressed as:
Log N = f î – f (σ/ Sć) (2.1)
Where N is the allowable number of vehicle loads to failure, σ is the tensile
stress of the slab and Sć the concrete modulus of rupture. The f values are PCA fatigue
coefficients, which define a chosen fatigue strength failure probability line for plain
concrete based on empirical data from past studies. As example, default coefficients of
17.61 define the 50% probability of fatigue failure line between stress ratio and loads to
failure (N) from a number of different concrete specimen fatigue tests presented by
Haung2.
KenSlabs is an excellent tool for evaluating fiber’s unique material properties and
could be used in support of laboratory testing on high performance airfield concrete
(HPAC). The program places no constraints on material values such as modulus of
rupture or modulus of elasticity. No constraints on aircraft geometry, tire pressures, loads
to failure, pavement deflections or minimum thickness as other programs do.
As example, KenSlabs is capable of evaluating repetitive loading of airfield pavements
with high tire pressure aircraft. Test programs were successfully run using Boeing 747
and 777 aircraft with 204 psi and 182 psi tire pressures values on dual and tridem gear
configurations and at load repetitions of 4,000 and 10,000 passes per year. Figure 2.8

-
45
illustrates the KenSlabs computer analysis footprint, showing the location of the Boeing
777 and 747 aircraft on a 20-foot by 20-foot concrete slab and the location of the nodes
used for the analysis. KenSlabs’ versatility for input data is adaptable in analyzing the
military’s minimum standards for fiber concrete airfield design in accordance with the
joint use U.S. Army Technical Manual ™ 5-825-3/ Air Force Manual (AFM) 88-6; Rigid
Pavements for Airfields. As example, minimum military standards for fibrous concrete
pavement thickness design are established at four inches, maximum allowable deflections
at 0.06 inches (shoulder design), and maximum flexural strength for plain concrete (0%
fiber) of 900 psi. Values that are less stringent than the design standards of other
agencies like FAA and input parameters of other FEM programs like LEDFAA.
LEDFAA v 1.2. FAA’s (Layered Elastic Design-Federal Aviation Administration,
version 1.2) program, was originally developed by the Corps of Engineers, and is the
only approved FEM program for pavement thickness design for the Boeing 777
aircraft32. This computer program was developed and calibrated specifically to analyze a
mixture of up to 20 different aircraft. Design information is entered by means of two
graphical screens, one for the pavement structure and one for traffic. The core of the
program is JULEA, a layered elastic computational program implemented as a
WINDOWS™ FORTRAN application. Dr. Jacob Uzan, Technion at Haifa, Israel
developed JULEA. Pavement design from the user’s perspective is that the “design
aircraft” concept has been replaced by the pavement design failure concept expressed in
terms of a “cumulative damage factor” (CDF) using Miner’s rule. When the cumulative
damage factor sums to a value of 1.0, the design conditions of fatigue failure has been
reached. The design process considers one mode of failure for rigid pavement, cracking
-
46
of the concrete slab. Limiting horizontal stress at the bottom surface of the concrete
guards against failure by cracking of the surface layer. Thickness, elastic modulus and
poisson’s ratio are the major pavement material properties inputted in the program for
analysis.
One of the limitations of the program is that the maximum allowable flexural
strength input value for concrete is 800 psi, a value much less than exhibited by
polypropylene fiber reinforced concrete. However, the program provides excellent
modeling for multi-aircraft traffic and its impact on rigid pavement airfield thickness
design for plain (0% fiber) concrete in accordance with current FAA standards. LEDFAA
provides the conventional airfield design thickness value based on a given mix of aircraft,
loading conditions and design life, as well as pavement, base course and sub-base
material properties. The LEDFAA design thickness for airfield pavement is then reduced
by FRC pavement design thickness reduction values. Design thickness reduction values
are derived from KenSlabs, considering the differences in pavement thickness due to
FRC’s enhanced flexural and fatigue characteristics as compared to plain concrete.
KenSlabs places no limitations on material input values, such as exhibited by FRC so it is
used to derive the pavement reduction values (PRV) from the laboratory tests. LEDFAA
incorporates all the FAA standards governing civilian airfields, so it is the design
standard for aircraft rigid pavement thickness in this regard.

-
47
Figure 2.8; KenSlabs Schematic.
Y Axis Symmetry
Node 1
Node 11
Node 111
Node 121
20 feet
Node 61
Node 25
Node 5
Boeing 747 & 777 dual and tridem footprint forKenSlabs Analysis.
Concrete Airfield Pavement Slab
10 foot slab section

-
48
CONCLUSIONS
Literature research validated polypropylene FRC as a viable composite for
HPAC. Tests showed superior flexural, fatigue strength, endurance limits and toughness
and ductility properties associated with even small amounts of polypropylene fibers.
The material behavior of polypropylene reinforced concrete pavement in terms of
strength could be examined in terms of its performance before and after “first crack”. In
terms of static flexural, fatigue and tensile strength, fiber content had an influence on
increasing strength and the tensile load carrying capacity of the matrix. Polypropylene
fiber concrete shows an increase in flexural and tensile strength with increasing fiber
content. Flexural fatigue strength and endurance limits are important design parameters,
particularly in pavements, because these structures are subjected to fatigue load cycles.
Research studies reinforce the above conclusion. In the study by Nagabhushanam,
Ramakarishnan, and Vondran9 a fatigue strength increase of 27 % for 0.5 %
polypropylene fiber content as compared to plain concrete. Most studies conclude that
any improvement in fatigue strength in polypropylene FRC occurs in small volumes.
Above 0.5% fiber content, there is no improvement in strength. The damage
accumulation in concrete study by Grzybowski and Myer1 showed the number of cycles
to failure as a function of stress ratio and fiber volume. In this study, fiber reinforcement
had a clear beneficial effect on the fatigue behavior of concrete as long as the fiber
content is about 0.25 percent.At 0.25%, the beneficial effect of polypropylene on the
total energy-absorption capacity of concrete seems to peak, irrespective of the stress
level. Beyond 0.5% percent fiber volume, the effect is insignificant and at higher stress

-
49
ratios (S > 0.75) polypropylene fiber’s energy absorption capacity decreases almost
exponentially. The endurance limit was also increasedwith the addition of fibrillated
polypropylene fibers due to FRC’s increased fatigue strength9 (Figure 2.9). Such an
effect would substantially extend pavement design life.
Regarding toughness, the load carrying capability of fibers within concrete after
“first crack”, increasing fiber content significantly increased toughness. In the Ozyildirim
and Moen study 17, they evaluated the strength properties of polypropylene fiber at
different volumes. The toughness of concrete improves with increases in fiber volume
and first crack strength peaked at a fiber content around 0.2%. Regarding ductility, fibers
had a significant effect on the mode and mechanism of failure of concrete cylinders in the
compression test. The fibers failed in a more ductile mode, particularly true for higher
strength concrete where the cylinders endure large deformations without shattering.
Figure 2.9: Endurance Limits (ref. Nagabhushanam, Ramakrishnam 1989).
Plain Concrete0.1% fiber 0.5% fiber
1% fiber
0%
10%
20%
30%
40%
50%
60%
70%
PlainConcrete
0.1% fiber 0.5% fiber 1% fiber
Endurance Limit(fatiguestrength/staticflexural strength)

-
50
Regarding impact resistance, in the Nagabhushanam, Ramakrishnan, and Vondran
study9 fiber concrete has excellent impact resistance, which increases with an increase in
fiber content. The results for impact resistance indicated the number of blows to first
crack and ultimate failure increases with increasing fiber volume and length17.
The report prepared by the ACI Committee 544, May 1997 states that cast in
place concrete will accommodate up to 0.4 percent by volume of polypropylene fibers
with minimal mix proportion adjustments7. Good workability can be maintained in
polypropylene fiber reinforced concrete (FRC) by adding an appropriate amount of
admixtures.
The addition of low volumes of fiber reduced the effects of shrinkage cracking by
12 to 25% and also reduced the average crack width significantly as compared to plain
concrete. According to Johnston, the best results were obtained at a fiber content of 0.2%
and fiber lengths of 19 mm and 51 mm22. Steel Ringresults reported by Grzybowski and
Shah24 showed that small amounts of fiber could substantially reduce cracks. The average
crack width of the specimen reinforced with 0.25% polypropylene fiber was 0.5 mm
(0.016 inches) or one half the value of plain concrete after six weeks.
-
51
CHAPTER 3. DEVELOPMENT OF AN INTEGRATED CONCRETE
DESIGN/SELECTION METHODOLOGY FOR FIBER REINFORCED
CONCRETE.
INTRODUCTION
There is a need for a systematic approach to couple material selection with rigid
airfield pavement design, so as to improve mix design and pavement performance and
consider all possible variables affecting them. Using a Systems Engineering approach
essentially examines all aspects of a system, not just individual components, to synthesize
solutions to a stated problem. The system's analysis considers alternative strategies,
establishes ordered set of choices and develops a methodology of optimizing alternate
strategies. Systems Engineering also includes design implementation and follow up on
the performance evaluation as part of the problem solution, or evaluation of the chosen
strategy to meet an objective in a continuos improvement process.34 Such a system will
improve both the quality of analysis, information, and decision making when faced with
such a complex set of variables. The intention is to construct a rational framework for
comprehensively evaluating and integrating all facets of the material’s behavior and
airfield pavement design as it applies to improving the performance of the airfield
pavement as a system. The United States Air Force and the United States Army Corps of
Engineers historically, have amassed a considerable database of information on aircraft-
airfield pavement interface, material strength properties of soils, concrete and asphalt as
they pertain to airfield performance worldwide. Pavement performance data under a wide

-
52
variety of aircraft loading and environmental conditions. The data is considerable, but not
necessarily scientific in its approach to pavement design and material properties as it is a
compilation of information developed primarily from engineering experience and field
observations. With the advent of high-speed computers, creation of numerous finite
element rigid pavement programs, and programmable material testing machines for
repetitive load testing, it is possible to conduct iterative calculations and dynamic load
testing to better predict airfield pavement performance. Much of the Military’s current
rigid pavement design methodology focuses on structural thickness determination, a
single criteria approach to pavement design. A Systems Engineering approach aids in
optimizing a fiber-concrete mix selection by flexural and fatigue strength for a specific
aircraft traffic, but also considers other properties like shrinkage potential (cracking),
workability, and energy absorption potential. Since the United States Air Force operates
worldwide, some FRC composite material criteria may vary regionally. As example, in
Europe, durability criteria may dominate versus fatigue strength needed at major air
cargo hubs in the United States. Similarly, in the Middle East or Asia, survivability may
be the predominant parameter for fiber-concrete material selection. Such criteria will be
reflected in the development of regional contract specifications, drawings and
construction standards from tabular data in technical manuals. Tabular data based on
fiber response from laboratory or analytical testing methodology detailed in this
dissertation. This approach couples material selection and mix design with pavement
design criteria to improve airfield pavement performance based on mission needs and
regional climatic conditions.

-
53
LIMITATIONS OF THE CURRENT DESIGN METHODS
Great strides forward have been made by the United States Military in evolving
the rigid pavement design criteria from empirical "design curves" towards a mechanistic,
computer based, flexural strength thickness model. Historically, the design charts had
served the Military well by establishing a way to design airfields based on past pavement
performance. However, these charts were mainly based on field observations and actual
aircraft-airfield interface, encompassing an array of different loading and environmental
variables to construct a "one size fits all" approach to design. As example, material
properties such as the Modulus of Elasticity (E) were assumed in all cases to be
4,000,000 psi and Poisson's ratio of 0.15. Calculation of new airfield slab design on
existing rigid pavements required adaptation of concrete overlay formulas to approximate
a principal of thickness reduction.35 Design “rules of thumb” such as an assumed 25 %
reduction in edge stress due to doweling are used. Determining joint depths based on slab
thickness, different joint spacing criteria per agency (Air Force or Army), and designing
dowel diameter, spacing and length based on pavement thickness alone. To date,
unchanging design details, in spite of different aircraft weight and gear geometry,
differing environmental temperature or moisture conditions for a particular airfield
location35. Consideration needs to be given to a more systematic approach to airfield
thickness design considering specific material properties and related thermal stresses,
durability and shrinkage as a function of actual site environmental conditions. Tests that
replicate extreme environmental conditions, such as temperature- restrained shrinkage
also lack standards. ASTM has yet to standardize testing protocols for concrete restrained

-
54
shrinkage testing. Some tests and analytical methods do exist, such as ASTM C-157;
Standard Test Method for Length Change of Hardened Hydraulic-Cement Mortar and
Concrete14 and joint spacing calculations based on temperature differential through a slab
as offered by Huang. Scientific approaches, moving away from the "rule of thumb"
approach of PCC joint design2 or material behavior.
There are many challenges and unknown variables that complicate incorporation
of a new material into design. As example, fiber-concrete composites for airfield
pavements lack a long-term performance history, which form the basis of much of the
empirical design methodologies used in Civil Engineering. In a larger sense, new material
analysis should include repetitive loading for fatigue testing of concrete specimens to
better approximate actual dynamic aircraft loading when evaluating airfield concrete
strength properties. However, material laboratory testing, such as dynamic fatigue tests
that replicate moving aircraft loads on concrete pavements are as yet to be standardized
by ASTM. Additionally, laboratory-testing results on the behavior of a new material
provides at best an incomplete picture of its properties, particularly when evaluating fiber
volumes in small amounts. Technology itself further complicates this process by rapidly
fielding heavier aircraft with different gear geometry that increase pavement stress, as
well as, creation of new fiber-concrete materials with greater potential strengths. This
dissertation is about developing a systems engineering based methodology integrating
mixture design with pavement design criteria for defining a performance based
methodology for evaluating fiber-concrete composite materials. In this case

-
55
polypropylene fiber, however such a methodology can eventually be expanded to other
concrete materials.
A BETTER DESIGN METHODOLOGY
Despite the long tradition within the Department of Defense to support ongoing
research and development of weapon systems, no standing research methodology has
been established for airfieldpavement systems to analysis emerging fiber-concrete
materials to improve this weapon system platform. As such, one has been presented in
this document as a blueprint.The objective of this system engineering methodology is to
establish a rational set of procedures (steps) in developing a FRC mix design approach
based on pavement performance criteria for military and FAA airfields. As aircraft
traffic, loading and gear geometry continue to impose greater stresses on airfields and
technology produces superior composite materials with unknown performance
characteristics, a systematic approach to evaluating mix designs is needed. Concrete mix
design is often based on a balance of several parameters such as stiffness and strength to
prevent excessive deflection, flexibility for fatigue and fracture resistance (cracking)
under increasingly higher stresses and harsh environmental conditions. Mix designs
should be evaluated based on output performance and pavement design criteria, and
validated by both field and laboratory testing. In this case, the polypropylene fiber
concrete composite needs to improve the fatigue strength and fracture resistance of rigid
pavement airfields. Initial studies on polypropylene fiber reinforcement in small volume
displays several advantages in fatigue, toughness, and flexural strength. Analysis showed

-
56
an increase in those strength properties that would increase the life of the pavement
structure under repetitive aircraft traffic. Stated differently, this improvement in strength
could reduce required pavement design thickness by ¼ inch to ½ inch for a fixed aircraft
traffic loading and design life. In terms of economics, if you consider constructing an
entire airfield the implications are significant. Perhaps, one of the most unique
characteristics of this composite is its ability to continue to absorb energy after first
crack, ductile properties not typically associated with a brittle material like concrete. This
fourfold increase in toughness associated with this composite as compared to
conventional concrete not only increases pavement life, but is significant to the military
in mitigating heaved pavement around bomb damaged runway craters during rapid
runway repair. Time to repair heaved pavement is the single most important criteria to air
base survivability.
A Systems Engineering methodology is needed to provide a rational framework for
organizing and integrating both existing and new fiber concrete research into airfield
design to improve pavement performance4. The models presented here and related to
pavement thickness design, heaved pavement reduction were intentionally structured to
be generic in nature so as to generalize a research-design- test methodology to be used for
any concrete composites.

-
57
Defining the System Methodology
Establishing the need and value of any new civil engineering system within the
Department of Defense, such as a new composite material evaluation methodology for
airfield pavements, requires that the research address vulnerability or threat reduction.
Getting the approval authority to “buy into” an innovative concrete mixture and
pavement design approach requires assurances that the system will quantifiably show a
reduction in threat or vulnerability to a weapons system platform such as an airfield in
terms of performance. Equally important is reliability, in that the methodology can
consistently measure the performance of FRC composites. Also, is the research
methodology flexible, adaptable to other studies of new and better emerging technology,
such as introduction of a superior fiber concrete composite. Research and Development
is an integral part of the Defense institution and invested research costs. This is
particularly true for new airfield material research and design approaches, which are
considered low cost studies and expenditures in comparison to the aircraft they support.
The judgment criterion for adopting a new FRC airfield materials research and
design methodology is performance, reliability, and flexibility in that order. In terms of a
stochastic system, weighted values for performance, reliability, and flexibility may be
45%, 30% and 25% respectively. In regards toperformance, can mechanistic models and
field-testing quantifiably measure differences in performance, such as fatigue strength
improvements (design thickness reduction) of varying fiber content in an FRC composite
under actual repetitive aircraft loading? Is energy absorption (reduction of heaved
-
58
pavement) of FRC composites quantifiable under actual explosive testing using both
ANFO (ammonia-nitrite/fuel oil) ground shot blasting and ground penetration munitions
testing due to differences in explosive weight and velocity of the blast? Does the
methodology include field testing to quantifiably measure surface cracking under actual
environmental conditions? In regards to reliability, can the design-engineering model
optimize fiber content in concrete as it pertains to fatigue strength, energy absorption,
cracking and constructability of a military and civilian airfield? How well does a
mechanistic predictive model compare to actual field-testing under actual aircraft
loading? Can the analytically derived models be modified by feedback from field testing
to better predict performance? In flexibility, is the pavement design models flexible
enough to be adapted to consider other mixtures or fiber types in airfield concrete as a
composite material? It is recognized that FRC research testing is an ongoing, iterative
process requiring years of evaluation. It is also recognized that the pace of material
composite technology is the fastest growing catalyst to change in civil engineering
building systems. It is expected, that continued advances in polymer technology would
continue to yield fibers that enhance the desired material characteristics for airfield
pavements far beyond polypropylene.The system developed in this study is shown in
figures 3.7 and figure 3.8 and the steps of the methodology are described in detail next.

-
59
STEP 1. EVALUATE AND SELECT NEW MATERIAL
Polymers such as polypropylene fiber are now the industry standard for numerous
engineering applications and are available worldwide through a host of vendors.
Polymers of known engineering properties, locally available are important new material
selection capability for worldwide airfield construction. As example, both industry and
researchers now recognize the benefits of polypropylene fiber reinforced concrete in
reducing temperature and shrinkage cracking and crack widths, which is an important
distress criteria in airfield pavements. However, little attention has been given to the use
of high tensile strength polypropylene as a structural component of concrete in structures
like pavements. Development of cost effective optimized composite applications and
design parameters for all FRC is an ACI stated research need. Continued technological
advances in non-metallic fiber development, particularly in the field of polymers, will
continue to present “breakthrough performance” opportunities for traditional building
materials such as concrete to enhance targeted properties. In this first step, three actions
would be taken. 1) A comprehensive review of existing literature to identify fiber-
concrete composite as potential candidates for airfields based on known beneficial
material performance. 2) Identify ingredients and mixtures to consider as HPAC. 3)
Determine appropriate testing to evaluate the above beneficial properties.
Targeted material properties of a FRC composite that would be characteristic of a
high performance airfield concrete (HPAC) mixture would be the ones that:

-
60
• Reduce deflections, stresses and strains reflected through the FRC composite
to underling pavement materials produced from aircraft gear geometry,
repetitive loading and environmental factors. Furthermore, composites that
can reduce design thickness.
• Material properties that reduce pavement surface deterioration and foreign
object debris (FOD) through reduction of concrete shrinkage, cracking and
scaling due to construction, maintenance, traffic abrasion or thermal effects.
• Composites that enhance energy absorption characteristics of the airfield
concrete such as toughness, ductility, and impact resistance to high-energy
stress waves generated by explosive catering and dynamic loading.
• Composites that improve constructability of airfield pavements in terms of
placement (workability) of the composite, thus reducing construction time and
cost.
STEP 2. LABORATORY PERFORMANCE PREDICTIONS
This research included the following laboratory testing tasks of identified HPAC
material properties from Step one and Chapter two. In addition, data from past studies
were considered in the analysis to complement laboratory test results.
Mix design and workability characteristics of low volume (<0.5 %) polypropylene
fiber reinforced concrete for pavements were examined. The objective of this testing was
to evaluate workability of polypropylene fiber concrete at 0.1%, 0.2 %, 0.3%, 0.4%
volumes as compared to plain (0%) concrete.

-
61
• Workability. ASTM C143, American Society of Testing Materials’ standard
laboratory test to determine slump of plain concrete. This test defines the relative ease
of placement and finish of a mix design.
• ASTM C995, Slump evaluation through time of flow through inverted cone test. The
inverted cone test was specifically developed to measure FRC workability and can be
used to compare FRC to conventional mixtures with similar slump values.
• Air Content. ASTM C 138, American Society of Testing Materials’ standard air
content test equipment and procedures for conventional concrete were used. Unit
weight and 28-day compressive strength values was also evaluated for each specimen
of a specified mix.
The strength characteristics of low volume (<0.5%) polypropylene fiber
reinforced concrete mixtures were examined as well. The objective of this testing is to
establish the static flexural and fatigue strength values of polypropylene fiber concrete at
0.1%, 0.2 %, 0.3%, 0.4% volumes as compared to plain (0%) concrete.
• ASTM C 78; American Society of Testing Materials’ standard laboratory test to
determine the peak fiber stress in tension under third point loading. The stress at
which the beam breaks is known as the Modulus of Rupture (MOR) and is a critical
material property input data value in pavement design calculations.

-
62
• Fatigue strength testing. Non standard test of cyclic loading of a concrete beam under
third point loading at a stress level below its MOR. The important data value is the
breaking fatigue stress of a beam at 2,000,000 load cycles, which is known as the
endurance limit and is a better indicator of the fiber-concrete’s strength under
repetitive loading.
To examine the energy absorption capability of low volume (<0.5%) polypropylene
fiber reinforced concrete, toughness can be measured using ASTM C 1018. The objective
of this test is to quantify the energy absorption of plain (0%), 0.1%, 0.2%, 0.3% and 0.4%
polypropylene fiber concrete from laboratory toughness testing analysis through indices'
values. Compressive strength ductility can be examined usingASTM C 39;
"Compressive Strength of Cylindrical Concrete Specimens". The objective of this test is
to observe the ductility characteristics of FRC in function of fiber design mix.
• ASTM C1018; American Society of Testing Materials’ standard laboratory test to
determine the energy absorption capability of fiber-concrete composites after first
crack as expressed in terms of Toughness Indices.
• ASTM C39; American Society of Testing Materials’ standard laboratory test to
determine compressive strength of concrete cylinders. Regarding fiber-concrete
composites, the ductile mode of failure of the cylinder is obsererved.

-
63
Toughness, ductility, and fracture resistance are manifestations of the energy
absorption capabilities of fiber reinforced concrete. Laboratory testing will generate the
following alternative strategies in comparing and quantifying the improvement of FRC
composite as a high performance airfield concrete (HPAC) pavement as compared to
plain (0% fiber) concrete. Increases in I-5, I-10, I-20 Toughness Indices are the desired
objective values (Figure 3.1). Increases in fracture and impact resistance are the desired
objective values. Qualitatively, observation during laboratory testing of fractured stress
and strain controlled loaded specimens failed in compression, flexure, fatigue and
toughness tests can be evaluated for remaining structural integrity after first crack. As an
example, fiber content (0%, 0.1%, 0.2%, 0.3%, 0.4%) specimens with greater fracture
free cross-sections after 1st crack is the value objective. Energy absorption is an important
characteristic of polypropylene fiber reinforced concrete in the reduction of heaved
pavement around airfield craters created by bomb damage. Fracture resistant concrete
reduces the amount of pavement that needs to be removed after an attack. Thus, the
following tests were considered:
• Determination of concrete toughness using ASTM C1018 toughness indices and post
1st crack specimen observations for 0.1%, 0.2%, 0.3% and 0.4% polypropylene fiber
concrete as compared to plain (0%fiber) concrete.
• Determination of impact resistance values from past studies for 0.1%, 0.2%, 0.3%
and 0.4% polypropylene fiber concrete as compared to plain (0%fiber) concrete.

-
64
• Determination of concrete's ductility using ASTM C 39 observations for 0.1%, 0.2%,
0.3% and 0.4% polypropylene fiber concrete as compared to plain (0%fiber) concrete.
• Monitoring of concrete's post 1st crack behavior using ASTM C 78 specimen
observations for 0.1%, 0.2%, 0.3% and 0.4% polypropylene fiber concrete as
compared to plain (0%fiber) concrete.
• Monitoring of concrete's post 1st crack behavior using fatigue test specimen
observations for 0.1%, 0.2%, 0.3% and 0.4% polypropylene fiber concrete as
compared to plain (0%fiber) concrete.
Figure 3.1: Measure of Energy Absorption; Toughness Index (I).
T o u g h n e s s
0
1
2
3
4
5
Pla in A B C D
FRC M ix
Ind
ice
I-5, 10, 20 Index values; Y Axis
Desired FRC >I
I=1 (0%fiber) min. acceptable

-
65
Shrinkage characteristics of low volume (<0.5%) polypropylene fiber reinforced
concrete are a HPAC property to be examined. The objective of this testing is to evaluate
cracking and volume change of polypropylene fiber concrete at 0.1%, 0.2 %, 0.3%, 0.4%
volumes as compared to plain (0%) concrete. ACI and ASTM have not declared a
standard test for restrained plastic shrinkage evaluation of FRC.
• Unrestrained Shrinkage using ASTM C 157, Length Change of Hardened Hydraulic-
Cement Mortar and Concrete. The objective of the test is to determine the volumetric
change (shrinkage) of concrete as it hydrates and hardens.
• Restrained Shrinkage using the Steel Ring Test. Non standard research test method of
measuring the tensile stresses induced in concrete by allowing concrete to harden
around a steel ring. Measures the crack resistant capability of fiber-concrete
composites.
Past studies indicate that crack widths in plain (0% fiber) concrete containing small
volumes of polypropylene fiber (<0.5%) could substantially be reduced. Plain concrete
crack widths after six weeks were typically 0.035 inches. As cracking in concrete is a
significant source of Foreign Object Debris damage for high performance jet aircraft
intakes, the performance standard should be cracking less than plain concrete. The fiber
mixture that provides the maximum crack width reduction is the value objective (Figure
3.2).

-
66
Figure 3.2: Measure of Distress Cracking.
STEP 3. DESIGN THICKNESS ANALYSIS
Two finite element method (F.E.M.) programs were selected for the pavement
analysis of the performance of polypropylene fiber concrete. These programs were used
to determine airfield pavement design thickness for a 20-year design life as specified by
the Federal Aviation Administration (FAA) or the United States Military using single or
muti-aircraft traffic, and generating alternative design strategies. Data from the laboratory
testing for flexural and fatigue strength of plain concrete and mixes containing 0.1%, 0.2
%, 0.3%, 0.4% of polypropylene fiber reinforcement were inputted to calculate pavement
thickness for the specified aircraft(s). The operational characteristics of these computer
programs are contained in Chapter two. These programs are:
Plain A B C D0
0.0050.01
0.0150.02
0.0250.03
0.035
FRC MIX
Distress Cracking
Desired objective values; least crack width FRC (inches)
Maximum Acceptable 0.035 “ (Plain)
Crack Width (inches)

-
67
1. KenSlabs is a finite element method rigid pavement computer program. KenSlabs
calculates the tensile stress at the base of concrete pavements subjected to various
loads, traffic, and tire contact pressures. The program considers various concrete
material parameters like Modulus of Rupture (MOR), Modulus of Elasticity,
Poisson’s ratio, can limit slab deflections, calculate design thickness and the impact
of thermal stresses on slabs due to temperature changes. KenSlabs damage analysis
and design life predictions are based on Miners rule for damage accumulation.
2. Layered Elastic Design, Federal Aviation Administration (LEDFAA) is a visual
basic, rigid pavement FEM program for multi-aircraft, airfield design thickness
analysis. LEDFAA is the only program approved by the FAA for the Boeing 777
aircraft and is used to determine conventional design thickness requirements for
civilian airfields.
The objective of the finite element modeling was to establish relationships
estimating design pavement thickness based on specific aircraft wheel pressures and
geometry and FRC material properties. The flexural and fatigue properties of the
mixtures are used in the analysis for calculating rigid pavement design thickness for
specified loading repetitions. There are five principal input variables for the mechanistic
analysis.

-
68
1. Aircraft Geometry. Essentially the gear and tire footprint of a mix of military and
civilian aircraft are used which are considered critical contributors to airfield pavement
damage due to their high tire pressure and gear geometry. Selected aircraft: Boeing 777,
Boeing 747, Boeing C17, Lockheed Martin C141, and Lockheed Martin F-16 aircraft.
2. Load Variables. The range of applied stress values based on specific aircraft gear
geometry requiring an increase in design thickness to maintain an acceptable tensile
stress at the base of a given rigid pavement slab. In this analysis, the relationship between
stress level (contact area stress/MOR) and pavement thickness for a given composite
FRC material is determined.
3. Traffic. A fixed number of aircraft passes are considered, in this case a minimum of
2,000,000 passes to determine pavement thickness of a FRC material at its endurance
limit.
4. Material Properties. Essentially the Modulus of Rupture (MOR), Modulus of Elasticity
(E) and fatigue strength (fmax) values at each FRC mix endurance limit is used. FRC
material properties as determined from laboratory testing of plain, 0.1%, 0.2%, 0.3% and
0.4% polypropylene fiber mixtures were used.
5. Environmental factors. Adjustments (% reductions) to a standard set of assumed
subgrade strength values are used representing environmental conditions such as spring
thaw. KenSlabs also considers the temperature differential between base and top of

-
69
concrete airfield slabs along with the thermal coefficient of concrete for calculating
curling stress.
The outputs from the mechanistic analysis are.
1. Through the finite element method modeling, the equations predicting airfield design
thickness for FRC pavements at fiber contents of 0%, 0.1%, 0.2%, 0.3% and 0.4% and
at stress levels of less than 0.7(0.29,0.39. 0.49,0.59,0.69) for a given aircraft wheel
loads are obtained. The design thickness and stress level relationship when graphed,
yield a linear equation that will establish coefficients for minimum thickness for
airfield design life (L) and limit pavement deflection (D) so as to prevent subgrade
failure from pumping. These equations are used to predict a 20 year design life
pavement thickness value based on a specific aircraft gear geometry and wheel loads
(contact stress), using laboratory derived values for flexural, and fatigue strength at the
endurance limit of FRC composites of varying fiber content.
For a design aircraft, two design equations were defined; one for static loading
conditions and one for repetitive (dynamic) loading conditions. The FRC with the
minimum design thickness, for a given aircraft for 2,000,000 passes is the desired
mixture. Airfield pavement thickness prediction using KenSlabs by single aircraft
geometry; Boeing 777, Boeing 747, Boeing C17, Lockheed Martin C141, and Lockheed
Martin F-16 aircraft were determined. The differences in pavement thickness by fiber
case were used to determine pavement reduction values (PRV) as a quantifiable measure

-
70
of the improvement in strength of FRC as compared to plain concrete. PRV were
determined by:
• Determination of pavement thickness using KenSlabs and the Modulus of Rupture
value for 0.1%, 0.2%, 0.3% and 0.4% polypropylene fiber concrete as compared to
plain (0%fiber) concrete. Determine flexural PRVs.
• Determination of pavement thickness using KenSlabs and maximum fatigue strength
(fmax) of 0.1%, 0.2%, 0.3% and 0.4% polypropylene fiber concrete as compared to
plain (0%fiber) concrete. Determine fatigue PRVs.
Determination of pavement reduction values generates two alternative strategies for
determining design thickness (Figure 3.3). Single and Multi-Aircraft model comparisons
will be made to quantify the improvement of FRC composite strength as a function of
pavement thickness reduction as compared to plain (0% fiber) concrete.
• Single Aircraft Model. Using KenSlabs, determination of design thickness by single
aircraft using Military standards for plain concrete. Modeling considers the Boeing
C-17, Lockheed Martin C-141 and F-16 aircraft and then subtracts the appropriate
PRV by fiber case.
• Multi -Aircraft Model. Determination of FRC pavement thickness meeting FAA
standards using LEDFAA. Modeling considers a mix of aircraft; Boeing 777, Boeing
747, Boeing C-17, Lockheed Martin C-141 then subtracts the appropriate PRV by
fiber case.

-
71
Figure 3.3: Measure of FRC Design Thickness Reduction.
2. Determine the effect of pavement thickness and fiber content on pavement curling
stresses and corner deflections. Quantify the reduction in curling stresses under different
temperature differentials as a function of FRC mixture pavement thickness and modulus
values as compared to plain (0% fiber) concrete (Figure 3.4). Consider any reduction in
corner deflection due to pavement thickness reduction under a given aircraft wheel load.
Figure 3.4: Measure of FRC Thermal Stress Reduction.
FRC Design Thickness Reduction
7.5
8
8.5
9
9.5
Plain A B C D
FRC Mixtures
Des
ign
Th
ickn
ess
(in
ches
)
Desired FRC
Thermal Stress Reduction
0
100
200
300
0 1 2 3 4 5 6
FRC Mix
Cu
rlin
g S
tres
s (p
si) Desired FRC
Plain 0.1% 0.2% 0.3% 0.4%

-
72
3. Construction cost reduction as a function of pavement thickness values for 0.1%,
0.2%, 0.3% and 0.4% polypropylene fiber concrete as compared to plain (0%fiber)
concrete (Figure 3.5). Reduction in pavement thickness due to the FRC characteristic
of increased strength results in a reduction in construction time and concrete
materials. The value objective is reduction in concrete material costs due to the
reduced pavement cross-section. Reduced thickness by fiber case is a quantifiable
indicator of reduction of agency costs.
Figure 3.5: Measure of Agency Costs; Construction Time and Materials.
Agency Costs
0
200
400
600
Plain A B C D
FRC Mixture
Co
st R
edu
ctio
n(
$100
0)
Maximum acceptable cost; same as plainconcrete
Desired objective value; leastcost FRC

-
73
STEP 4. HEAVED PAVEMENT PREDICTIONS
Energy absorption is an important characteristic of polypropylene fiber reinforced
concrete in the reduction of heaved pavement around airfield craters, created by bomb
damage. Fracture resistant concrete reduces the amount of pavement that needs to be
removed after an attack. Toughness, ductility, and impact resistance are manifestations of
the energy absorption capabilities of fiber reinforced concrete that can be quantitatively
and qualitatively measured by laboratory testing. Analytically, predicting the
mechanism of blast fractures of concrete has to do with kinetic energy and stress wave
theory and is discussed in Chapter five. The relationship of detonation velocity to wave
propagation velocity through concrete is a function of concrete’s material properties, as
well as distance from the crater center.
A considerable database of information already exists in the literature on the
material properties of plain and polypropylene fiber reinforced concrete.However,
information regarding current military munitions capabilities such as explosive weight,
detonation velocity and depth are classified and varied between munitions. The United
States Air Force Manual; AFMAN 10-219 states that pavement upheaval typically
continues up to 25 feet beyond the crater lip of a 50-foot diameter crater36and that stress
wave velocity (Vc) through a given linear-elastic material is a function of that materials
properties such as Modulus of Elasticity and unit weight and mathematically expressed as
Vc =√ E plain concrete/ γ plain concrete/gravity (g) where γ / g = the material’s density (ρ).37

-
74
In general, the diameter of radial fracturing from a bomb-damaged airfield is twice the
crater diameter considering the material properties of plain concrete (0.0% fiber).
Normalized for fiber reinforcement material properties, and considering wave
propagation theory, the relationship of fracture diameter (RD) to crater diameter (D) in
feet could be expressed as:
RD = 2D [√ E fiber concrete/ γ fiber concrete/(g)] (3.1) [√ E plain concrete/ γ plain concrete/(g)]
This relationship will be used toquantify the fracture and heaved pavement
reduction capability of low volume (<0.5%) polypropylene fiber reinforced concrete
pavements. Heaved pavement reduction modeling can be used to quantify the radial
fracturing of 0.1%, 0.2%, 0.3% and 0.4% polypropylene fiber concrete as compared to
plain (0%fiber) concrete (Figure 3.6). Literature research of impact resistance, ductility
and toughness characteristics can be analyzed and is considered in Step two.
Quantitatively, the energy absorption capability of plain (0%), 0.1%, 0.2%, 0.3% and
0.4% polypropylene fiber concrete was measured from laboratory toughness testing
analysis (Figure 3.3). Qualitatively, compressive strength ductility observations can be
made by fiber case.

-
75
Figure 3.6: Heaved Pavement Reduction.
STEP 5. MIX DESIGN SELECTION AND FIELD TESTING
The idea behind a systematic methodology for mix design of fiber-reinforced
concrete for airfield pavements is to improve both the quality of information and decision
making when faced with a complex set of variables requiring analysis. A successful
system yields quantifiable data enabling decision-makers to select the optimum fiber-
concrete composite based on structural, environmental and survivability criteria.After
literature review, analytical analysis and laboratory testing as shown in Figure 3.8,
performance prediction models are validated under actual aircraft loading and
environmental conditions (Figure 3.9). In this step, the models and acceptance criteria
Minimum acceptablestandard (Plain).
Heaved Pavement Reduction
85
90
95
100
105
Plain A B C D
Fiber Reinforced Concete Mix
Hea
ved
Pav
emen
t D
iam
eter
(fee
t)
Desired FRC; least fracture

-
76
identified are used to select the concrete mixture in an iterative process until the optimum
performance by fiber mix is determined. Such effort is beyond the scope of this
dissertation to undertake except as a methodology discussion. Laboratory testing is at
best an indirect indicator of performance of actual aircraft loading conditions. For
example, static flexural testing of concrete is not indicative of actual static aircraft wheel
loading nor is fatigue testing at 20 Hertz repetitive loading of concrete specimens
indicative of actual aircraft wheel loading repetitions. Similarly, toughness-testing indices
provide a measure of energy absorption properties of concrete and is not a direct
measurement of an FRC composite's performance in this regard.
Implementation (test pad construction) of optimized FRC material composite
slabs for actual field-testing is the next logical step after analytical and laboratory
performance evaluation. Data obtained from field-testing becomes the new input data for
an iterative system analysis. The iterative process provides feedback for improving the
analysis and better predicts the pavement’s life and response based on single and multi-
aircraft loads. Feedback (revised inputs) are returned to the system from actual field
testing to validate or modify laboratory or computer program simulations of actual
loading and environmental conditions and to improve the accuracy and reliability of the
performance models as a credible tool for use by decision makers at all levels. Field data
acquisition yields improvements in test methods, data collection and interpretation of
laboratory results, as well as performance and deterioration modeling.

-
77
• Aircraft Loading. Control (0% fiber) and FRC slabs should be constructed on an
airfield for actual load testing by design aircraft. Measures of deflection and strain in
function of FRC's material properties should be collected.
• Environmental testing. Control (0%fiber) and FRC slabs should be constructed by the
airfield for shrinkage testing. Record cracking (PCI visual method), and conduct
pulse velocity testing to determine deterioration. Thermal changes through slab
measurements and volumetric changes using the deflectometer should be examined.
Install thermocouples, determine FRC’s coefficient of thermal expansion (α), then
calculate thermal stresses using KenSlabs.
• Explosive testing.Control (0%fiber) and FRC slabs should be constructed for
Ammonium Nitrate-Fuel Oil (ANFO) explosive testing. The reduction in radial
fractured FRC pavement from the charge should be monitored and the relationship
between explosive type/net explosive weight, bore hole diameter and radial distance
of heaved pavement from crater center should be examined. Heaved pavement is
defined as the pavement with greater than ¼ inch vertical displacement (USAF
Repair Quality Criteria; RQC).

-
78
FRC DESIGN AND SELECTION CRITERIA
Figures 3.8 and 3.9 provide a step by step flow chart in achieving the objectives
detailed in Chapter one. Each step is detailed in this Chapter. Once an FRC composite
has been identified for laboratory and analytical evaluation from the literature, the
following protocol for decision making may apply. Regarding values and decision rules,
the following priority for ranking selected HPAC performance criteria is as follows. The
priority may be changed based on mission requirements, or local environmental
conditions and threats (Figure 3.7).
1. Greatest reduction in pavement thickness and thermal stresses.
2. Greatest increase in the energy absorption potential of the FRC material.
3. Greatest reduction in pavement distress (cracking).
4. Greatest reduction in agency costs.
The protocol for decision making within HPAC performance criteria is as
follows. Optimization occurs by selection of the fiber mixture possessing the greatest
beneficial behavior by fiber content. In the generation and optimization of alternatives the
following analysis should be taken for evaluating the impact on pavement performance
by:
1. Greatest reduction in pavement thickness by fiber mixture using:
• Single Aircraft Fatigue approach.
• Single Aircraft Flexural approach.
• Multi -aircraft Fatigue approach.

-
79
2. Greatest increase in energy absorption potential by fiber mixture considering.
• Explosive fracture/ heaved pavement analysis.
• Toughness indices and first crack strength.
• Impact resistance analysis.
• Visual observation of ductility failure in compression, fracture reduction of fatigue
and flexural specimens after failure.
3. Greatest reduction in pavement distress; crack width, cracking and thermal stresses by
fiber mixture.
• Restrained Shrinkage.
• Free Shrinkage.
• Thermal stress analysis from FEM.
4. Greatest reduction in Agency costs from alternative mixtures.
• Savings from pavement thickness reduction in construction time and materials.
• Costs related to workability (man-hours, construction time).

-
80
Figure 3.7: System Engineering Phases and Componets.
Inputs• Aircraft • Geometry(footprint)• Load Variables• Traffic• Material Properties• Seasonal adjustment
Testing and Initial Analysis• Literature Research• Laboratory Testing
• ASTM C78 (flexural strength)• ASTM C39 (ductility)• ASTM C1018(toughness test)• ASTM C157 (free shrinkage)• Workability• Steel Ring• Fatigue/ Endurance limit
• KenSlabs • LEDFAA• Engineer Experience Response
• Stress• Strain• Deflection• Disintegration
Outputs• Structural Capacity (pavement
thickness)• Structural Capacity (pavement
toughness)• Surface distress (Cracking/FOD).• Agency Costs (construction time &
materials)Constraints• Deflection• MOR• Laboratory Testing• Variability• Indirect conditions from actual
Decision Criteria• Smallest X-section• Greatest toughness• Least cracking• Least cost• Least construction
timeAnalysis/Results• Single Aircraft Models• Multi -Aircraft Models• Energy Absorption Model• Crack Analysis• Agency Costs
Comparative Analysis and Optimization
ImplementActual Field Testing and Performance. Aircraft Loading, Environmental and Explosive Testing.
Feedback

-
81
Step 1. Evaluate and Select New Materials
Step 2. Laboratory Performance Prediction
Step 3. Analytical Evaluation; Design Thickness Reduction
Step 4. Analytical Evaluation; Heaved Pavement Reduction
Figure 3.8: Performance based Mix Design and Selection Methodology.
Conduct literature search on non-metallic, synthetic fiber for fiber reinforced concrete (FRC). Select fiber for High Performance Airfield Concrete and characterize material behavior. Select Pavement FEM programs.
Determine Mechanistic Model Inputs, Outputs. Conduct Finite Element Modeling using laboratory values (Figure 3.7). Select FRC with greatest thickness reduction (Figure 3.3), thermal stress reduction (Figure 3.4), reduce Agency costs (Figure 3.5).
Fatigue Flexural Toughness (Figure 3.1)CompressiveImpact Resistance
Workability Free shrinkage Restrained shrinkage (Figure 3.2)
Strength Properties Agency Costs Distress
Calculate greatest reduction in heaved pavement based on FRC material properties (Figure 3.6).

-
82
Step 5. Mix Design Selection and Implementation
Figure 3.9: Performance based Mix Design and Field Testing Methodology.
Select FRC Mix Design; plain, FRC- A, B, C, D (Table 3.2)
• Acceptance Criteria ( Table 3.3)
• Conduct FieldEvaluation
• Evaluate and Compare Performance
Modify FRC Design Mix
• Refine Performance Models• Develop Selection Tables
• Final Mix Design• Quantify Benefits

-
83
CONCLUSION
There is a real need and opportunity to consider all properties of a new fiber
concrete composite and optimize those properties into an integrated, material selection-
design approach to improve pavement performance. The information age and the Internet
have provided unprecedented opportunities to evaluate new material research in real time
to select targeted HPAC composites. Advances in polymers have improved concrete's
strength, energy absorption and shrinkage properties, which are important to the
survivability of military airfields. Finite Element Modeling continues to advance,
providing greater accuracy in predicting pavement design thickness as a function of a
specific aircraft and mix design. Refining predictive analytical equations and laboratory
values with field testing better couples analytical modeling with actual performance in a
more scientific, less empirical pavement design approach. Regarding acceptance criteria,
flexibility in prioritizing and selecting desired FRC material properties in airfield design
is also needed. Since the United States Air Force operates worldwide, important mix
design criteria may vary regionally requiring different fiber concrete designs to enhance
specific characteristics required at a location. Considering both the U.S. Military’s and
commercial aviation’s global reach, concrete mixture and rigid pavement design criteria
may be regionally specified based on local desired performance requirements due to
mission, environment and threat, as well as a consideration of local material properties.
Based on local conditions, development of regional contract specifications, drawings and
construction standards could be derived fromtabular data like Table 3.1. Considering

-
84
laboratory and analytical analyses as in Table 3.2, fiber mix selection would bebased on
local acceptance criteria. As example, in wet weather Europe, FRC enhanced crack
reduction criteria may dominate as compared to airfield fatigue strength improvement
needed at major air cargo hubs in the United States. In the Middle East or Asia,
survivability (energy absorption) may be the desired airfield fiber-concrete material
property.
Table 3.1: FRC Design Thickness Table.
Traffic Annual Departures
Military StandardsKenslabs Design Thickness
LED-FAA Design Thickness
FRC pavementthickness reduction value (PRV.)
Boeing 777Boeing 747C-141
33,00033,00033,000
19.44 inches(MOR;800psi)
0.1%/0.3”reduction0.2%/0.2” reduction0.3%/0.4” reduction0.4%/0.2” reduction
Boeing 777Boeing 747C-141C-17A
25,00025,00025,00025,000
19.22 inches(MOR;800psi)
0.1%/0.3”reduction0.2%/0.2” reduction0.3%/0.4” reduction0.4%/0.2” reduction
Boeing 777 100,000 10.5 inchesA/B Traffic Areas8.3 inchesC Traffic Areas
0.1%/0.4”reduction0.2%/0.2” reduction0.3%/0.4” reduction0.4%/0.2” reduction
C-141 100,000 10.5 inchesA/B Traffic Areas9.5 inchesC Traffic Areas
0.1%/no reduction0.2%/0.1” reduction0.3%/0.3” reduction0.4%/no reduction
C-17A 100,000 10.5 inchesA/B Traffic Areas8.7 inchesC Traffic Areas
0.1%/0.4” reduction0.2%/0.2” reduction0.3%/0.4” reduction0.4%/0.2” reduction
Select Design Standard; Military or FAA
Select FRC Mixture and reduce thickness
Select Aircraft and Passes

-
85
Table 3.2: FRC Mix Design Acceptance Criteria.
Performance Criteria(Models)
PlainConcrete
0.1% FRC 0.2% FRC 0.3% FRC 0.4% FRC
Fatigue Strength(Design-thickness reduction)
Optimum Optimum
Flexural Strength(thickness reduction)
Optimum
Energy Absorption(heaved-pavement )
Optimumreduction
Curling Stress Optimumreduction
Crack Reduction OptimumWorkability OptimumUser Costs Optimum

-
86
CHAPTER 4. LABORATORY TESTING AND RESULTS
INTRODUCTION
Extensive laboratory testing was conducted over a 12-month period at the University
of Maryland quantifying the properties of polypropylene fiber reinforced concrete (FRC)
for pavement structures.Advances in polymer technology are creating new opportunities
for traditional building materials like concrete, potentially improving fatigue, energy
absorption and shrinkage properties, which are important to improving the serviceability
of civilian airfields and survivability of military airfields. However, there are challenges
and unknowns that complicate the understanding of this composite. As example, fiber-
concrete composites are a new material lacking a long-term performance history as a
structural element, which form the basis of much of the empirical design methodologies
used in Civil Engineering. Also, recommended FRC tests are a stated research need
identified by ACI. Regarding material laboratory testing such as dynamic fatigue tests
that replicate moving aircraft loads on concrete pavements, are as yet to be standardized
by ASTM. Tests that replicate extreme environmental conditions, such as temperature-
restrained shrinkage also lack standardization. ACI 544.2R-89 “Measurement of
Properties of Fiber Reinforced Concrete”4 provides some recommended tests for
polymeric fiber reinforced concrete pavements. An objective of this Chapter is to
recommendlaboratory tests for FRC as a HPAC and obtain data values.Tests
recommended for fiber reinforced concrete (FRC) were conducted in the University of
Maryland’s Materials Testing Laboratory and are summarized in this Chapter.

-
87
MIX DESIGN AND WORKABILITY
Materials and Mixtures
The materials used consisted of ASTM C-150 Type I/II Portland cement, ground
blast furnace slag from Sparrows Point Maryland, natural sand as the fine aggregate with
a fineness modulus of 2.57 and #57 coarse aggregate with a gradation as shown in Table
4.1. Fibermesh, a homopolymer-fibrillated polypropleyene fiber made from olefin resins,
¾” long was used and applied at four quantities; 0.1%, 0.2%, 0.3% and 0.4%. Daravair,
an air –entraining admixture meeting the requirements of ASTM C260 was used to
maintain air content. WRDA 35 mid range water-reducer admixture and ADVA
superplasticizer were used to maintain plasticity and slump at the designated water
cement ratios (w/c) of 0.40 and 0.44. The synergistic effect of these admixtures produced
concretes using 0.0%-0.4% reinforced fibers with enhanced finishing characteristics
while maintaining proper air-entrainment for freeze-thaw protection and slump with low
water-cement ratios. Grace construction products, in Cambridge Maine, manufactures the
above mentioned admixtures. Detailed mix design results for all test samples are
presented in Table 4.2.

-
88
Table 4.1: Mix Design Matrix .
MIX NO. MD 7 7 MD MD 7 MD 7 MD 7AGGRE-
GATE TYPE
#57 ASTM(control)
#57ASTM(Fatigue
Resistant)
#57ASTM(Fatigue
Resistant)
#57ASTM(Fatigue
Resistant)
#57ASTM(Fatigue
Resistant))SIEVE SIZE
2-1/2 “2 “
1-1/2 “ 100 100 100 100 1001” 95-100 95-100 95-100 95-100 95-100
3/4”1/2” 25-60 25-60 25-60 25-60 25-603/8”No. 4 0-10 0-10 0-10 0-10 0-10No. 8 0-5 0-5 0-5 0-5 0-5 No. 10No. 16No. 30No. 40No. 50No. 100No. 200
W/C 0.44 0.44 0.44 0.44 0.44Min.
CementType I
580 lb./cy345 kg./m3
580 lb./cy345 kg./m3
580 lb./cy345 kg./m3
580 lb./cy345 kg./m3
580 lb./cy345 kg./m3
Air Content 6.5% 6.5% 6.5% 6.5% 6.5%Slump 1-1/2” to 3” 1-1/2” to 3”
8-30 sec.1-1/2” to 3”
8-30 sec.1-1/2” to 3”
8-30 sec.1-1/2” to 3”
8-30 sec.Concrete
Temp.70°F 70°F 70°F 70°F 70°F
Fiber Content
(1/2 to 1 1/2 inch)
0% 1.5 lb./cy(0.1%)
3.00lb./cy(0.2%)
4.5 lb./cy(0.3%)
6 lb./cy(0.4%)
Air Entrainment
1.7oz/100Lb 1.9oz/100Lb 1.9oz/100Lb 1.9oz/100Lb 1.9oz/100Lb
Water Reducer
5 oz/100Lbs 5 oz/100Lbs 5 oz/100Lbs 5.5oz/100Lb 6 oz/100Lbs

-
89
Mix Batching Proportions and Procedures
Proportionally, each mix contained 377 Lbs./Cy Cement, 203 Lb./Cy. Slag, 1,898
Lb./Cy. Aggregate, 1,176 Lbs./Cy. Sand and 255 Lbs./Cy of tap water. Coarse and fine
aggregate were mixed with two-thirds of the required water for 90 seconds to allow for
water absorption. Then cement, slag, fibers and the remaining water were added and
mixed for three minutes. The mix was allowed to rest for two minutes and additional
mixing for three minutes in accordance with ASTM C 192 procedures. An additional
minute was added to the final mixing time to enhance fiber dispersion in the matrix.
Immediately after mixing, the concrete was transferred to the wheelbarrow and slump,
unit weight and air content was measured. Specimens were then molded and allowed to
cure for 28 days in water at 73° F prior to testing. Fiber reinforced concrete samples were
externally vibrated and plain samples rodded in accordance with ASTM standards. Tests
were conducted during the summer, where slump and air content loss was more rapid for
both plain and fiber reinforced concrete when the temperature range was above 80° F.
Mix Design and Workability Results
Pavement mix designs are often the compromise of stiffness for strength to
prevent excessive deflection and flexibility for fatigue and fracture (cracking) resistance
under increasingly higher stresses imposed and harsh environmental conditions. Mix
designs should be evaluated based on output performance criteria, unique to the user and
validated by both field and laboratory testing. In this case, polypropylene fiber concrete

-
90
needs to improve the fatigue strength and fracture resistance of rigid military airfields.
Air content and slump values provide an indication of workability of a concrete mix.
Regarding air content, standard ASTM air content test equipment and procedures for
conventional concrete was used (ASTM C 138). However, FRC samples were
consolidated using internal/external vibration, not rodding. For FRC specimens, Slump
(ASTM C 995) Time of flow through Inverted Cone test was used. The inverted cone
test was specifically developed to measure FRC workability and can be used to compare
FRC to conventional mixtures with similar slump values. The inverted cone time
increases with a corresponding decrease in slump. For workability, the advantage of the
inverted slump cone test is that it takes into account the mobility of the concrete and
viscosity, which comes about due to vibration. Satisfactory workability is achieved if the
FRC mix passes through the cone between 8 and 30 seconds. Plain concrete slump was
measured with the slump cone in the conventional manner outlined in ASTM C143.
FRC
30-Liter Unit Weight Bucket
Start of Test End of Test
Figure 4.1: Inverted Slump Cone Test for FRC.
Slump ConeVibrator
Threaded rods with locking nuts welded to bucket
Measure time of FRC through cone

-
91
Similar to the results reported by the American Concrete Institute (ACI) Report7,
cast in place concrete will accommodate up to 0.4 percent by volume of polypropylene
fibers with minimal mix proportion adjustments. Good workability can be maintained in
polypropylene fiber reinforced concrete (FRC) by adding an appropriate amount of
admixtures. Slump and air content values provide an indication of workability of a
concrete mix. Given a limited slump range (1–1/2 to 3 inches) and fixed air content of
6.5%, adequate mix design was maintained using water reducers and air entraining
admixture (Table 4.2). The synergistic effect of these admixturesproduces concretes
(0.0%-0. 4% fiber reinforced) with enhanced finishing characteristics while maintaining
proper slump and air-entrainment for freeze-thaw protection in concretes with low water-
cement ratios.However, for a given water–cement ratio, the trend was that as fiber
content increased, slump and air content decreased requiring additional admixtures
(Table 4.3). Finishing became more difficult as fiber content increased, but still
manageable at 0.4 % volumes. Surface finish, quality of the molds and compactionwere
a function of vibration, superior with external vibration as compared to rodding.
However, excessive vibration (> 20 seconds) would cause segregation of the fibers from
the concrete matrix resulting in fiber balling or migration of fibers to the base of the
specimen (Figure 4.2).

-
92
Table 4.2: Workability Matrix.
Specimen Slump Air Content Unit Weight
Compressive Strength(28 days)
Plain Concrete 1 3.5 inches 6.6% 142.8 lb/cf 5,377 psiPlain Concrete 2 3.5 inches 6.6% 142.8 lb/cf 4,217 psiPlain Concrete 3 4.3 inches 6.6% 142.8 lb/cf 5,624 psi
0.1Fiber Concrete 1.9 inch/8.5 sec. 4.6% 147.8 lb/cf 6,296 psi0.1Fiber Concrete 1.9 inch/8.5 sec. 4.6% 147.8 lb/cf 5,854 psi0.1Fiber Concrete 1.9 inch/8.5 sec. 4.6% 147.8 lb/cf 6,403 psi0.2Fiber Concrete 2.3 inch/8.0 sec. 6.6% 143.8 lb/cf 5,341 psi0.2Fiber Concrete 2.3 inch/8.0 sec 6.6% 143.8 lb/cf 5,235 psi0.2Fiber Concrete 2.3 inch/8.0 sec 6.6% 143.8 lb/cf 5,607 psi0.3Fiber Concrete 2.5 inch/8.0 sec 7.0% 143.8 lb/cf 4,584 psi0.3Fiber Concrete 2.5 inch/8.0 sec 7.0% 143.8 lb/cf 4,439 psi0.3Fiber Concrete 2.5 inch/8.0 sec 7.0% 143.8 lb/cf 4,606 psi0.4Fiber Concrete 0.5 inch/13 sec 5.8% 141.8 lb/cf 5,320 psi0.4Fiber Concrete 0.5 inch/13 sec 5.8% 141.8 lb/cf 5,041 psi0.4Fiber Concrete 0.5 inch/13 sec 5.8% 141.8 lb/cf 4,245 psi
Table 4.3: Workability Results.FRC Water/Cement
(w/c) RatioDaravAIR(oz/100lbs.)
WaterReducer(oz/100lbs.)
Slump(inches)
Air Content(%)
0% Fiber 0.40 2 2.7(high range)
2.75 6.4
0% Fiber 0.44 1.7 5.0
(medium)
3.12 6.1
0.1% Fiber 0.44 1.9 5.0 5.5 inch(6 sec)
7.0
0.2% Fiber 0.44 1.9 5.0 1.5 inch(12 sec)
6.0
0.3% Fiber 0.44 1.9 5.5 0.25 inch
(17 sec)
5.0
0.4 % Fiber 0.44 1.9 6.0 1 inch(19 sec)
5.5
Increased DaravairIncreased WaterReducer

-
93
Figure 4.2: FRC Beam after Fracture (fibers visible).
Figure removed due to file size (see hardcopy)

-
94
STRENGTH AND ENERGY ABSORPTION
Flexural Strength and Toughness
The preferred flexural testing of FRC is under third-point loading; ASTM C 78 or
C 1018. ASTM C 78 provides maximum static flexural or peak fiber stress in tension
strength. The stress at which the beam breaks is known as the Modulus of Rupture
(MOR) and is a critical material property input data value in pavement design
calculations. Additionally, in practice, static flexural strength is used to determine
construction compliance with specifications of slabs and pavements and the calculation
of the Modulus of Rupture (MOR) value is critical in establishing acceptance criteria.
Essentially, the MOR replicates the tensile stress at the bottom of a concrete slab at
failure due to loading. In Finite Element Models, such as KenSlabs or LEDFAA, the
MOR is the input concrete strength value in determining traffic loads to failure (N) in
calculating airfields’ design life.
ASTM C 1018 should be used if toughness or load deflection behavior is of
interest. Specimen width and depth should be three times the fiber length or maximum
aggregates size. The preferred specimen size for toughness testing is a 4 x 4 x 14 inch
beam. Toughness testing provides for the determination of ratios called Toughness
Indices that identify the pattern of material behavior of FRC up to a selected deflection.
Residual strength factors, which are derived from the indices, characterize the level of
strength retained by FRC after first crack. Toughness Indices and residual strength factors
determined by this test method reflect the post crack behavior of fiber reinforced concrete

-
95
and qualitatively contribute to our understanding of the energy absorption capability of
varying volumes of fibers in concrete. This manifestation of toughness or energy
absorption capability is relevant in such engineering applications as the reduction of
heaved pavement from explosive cratering or further serviceability of an airfield after
fatigue cracking. Consider toughness, where preservation of FRC structural integrity even
after severe damage is of primary concern.
Standards.
1. ASTM C-78; Flexural Strength of Concrete using SimpleBeam with Third-Point
Loading (Figure 4.3).
2. ASTM C1018; Flexural Toughness and First-Crack Strength of Fiber-Reinforced
Concrete using Beam with Third-Point Loading (Figure 4.8).
3. ASTM C 192; Making and Curing Concrete Test Specimens in the Laboratory.
Three specimens will be made for each test age and test condition.
Specimen width and depth should be three times the fiber length or maximum
aggregate sizes (preferred specimen size 4 x 4 x 14 inches).
Aging Period. Tests are conducted at 28 days after casting the concrete.
Aging Temperature. Mixing and Curing temperature (73.4°).
Polypropylene Fiber Content. 0%, 0.1%, 0.2%, 0.3%, 0.4%
Aggregate Gradations. #57, #357 (avg. three replicates).
Slump. ASTM C 143; Slump of Hydraulic Cement Concrete. However, ASTM C 995
should also test FRC samples; Time of flow through Inverted Cone test.
Air Content. ASTM C 138. However, FRC samples should be consolidated using
external vibration.

-
96
Figure 4.3: ASTM C 78 Static Flexural Strength Testing.
Summary of Results: Static Flexural Testing
Twenty-nine, 6 inch X 6 inch X 21 inch concrete beams were tested, evaluating
varying volumes of polypropylene fiber; plain (0%), 0.1%, 0.2%, 0.3%, 0.4% at normal
strength (0.44 w/c) mix, using a #57 aggregate gradation. Two sets of low shrinkage
concrete beams were also cast, one set using a higher strength water-cement ratio (0.4
w/c) mix and the other set using a different aggregate gradation, #357. Over a range of
curing times; 28 to 39 days, on average the Modulus of Rupture (MOR) for 0%, 0.1%,
0.2%, 0.3% and 0.4% fiber reinforced concrete specimens was 768 psi, 725 psi, 877 psi,
877 psi and 883 psi respectively (Figure 4.4). Modulus values for fiber beams with 0.2%
to 0.4% fiber were higher,compared to plain and 0.1% fiber concrete and equivalentto

-
97
the MOR for high strength (0.4 water-cement) plain concrete. Failure occurred at an
average deflection of 0.0033”, 0.0031”, 0.0036”, 0.0037” and 0.0036” for 0% (plain),
0.1%, 0.2%, 0.3% and 0.4% fiber normal strength beams. Deflection to first crack
increased with increased fiber content. Additionally, compared to plain concrete, the
addition of 0.2% to 0.4% fiber to concrete increased the static flexural strength by 15 %.
Static flexural testing of 6” X 6” X 21” concrete beams more than seven months old
yielded different results (Figure 4.6). The average Modulus of Rupture (MOR) for plain
concrete, 0.1%, 0.2%, 0.3% and 0.4% fiber reinforced concrete was 725 psi, 692 psi, 731
psi, 757 psi and 728 psi respectively. The MOR for high strength (0.4 water-cement)
plain concrete was 788 psi. Compared to plain concrete, the addition of 0.3% and 0.4%
fiber volumes to matured concrete increased the static flexural strength by only 5 % but
retarded cracking by 15%+ at 0.4 % fiber content (Figure 4.5). Fiber concrete’s ability to
retard cracking and continue to absorb energy (carry load) after first crack is best
quantified in the toughness test, but is also observed during flexural and fatigue testing.
Within the flexural beam testing protocol (ASTM C78) as fiber content increased, a
greater percentage of each beam remained uncracked at failure (Table 4.4).

-
98
Figure 4.4: Flexural Strength Graph.
ASTM C78; Sample 3MFa-PL (plain conc. W/C =. 44).
ASTM C78; Sample 3MFa-.4F (0.4 % Fiber conc. W/C =. 44).
Figure 4.5: Typical FRC Beam Fracture.
2 8d a ys
3 0d a ys
3 3d a y s
3 3d a ys
3 3d a ys
3 5d a ys
3 5d a y s
3 5d a ys
3 7d a ys
3 7d a ys
3 9d a ys
0 .1 f ib e r
0 .3 f ib e rp la in # 5 7
H ig h S trg h
0
1 0 0
2 0 0
3 0 0
4 0 0
5 0 0
6 0 0
7 0 0
8 0 0
9 0 0
1 0 0 0
M O R (p s i)
C u rin g T im e
F R C F L E X U R A L S T R E N G T H
0 .1 f ib e r 0 .2 f ib e r 0 .3 f ib e r 0 .4 f ib e r p la in # 5 7 p la in # 3 5 7 H ig h S trg h
Fracture pattern was a middle third span section 100 % fracture.
Fracture pattern was a middle third span section 80 % bottom to top fracture

-
99
Figure 4.6:Flexural Strength Results.
Static flexural strength of 4”X 4”X14” specimens prepared for fatigue testing
yielded Modulus of Rupture values for plain, 0.1%, 0.2%, 0.3% and 0.4% fiber
reinforced concrete of 868 psi, 970 psi, 981 psi, 1,017 psi and 980 psi respectively.
Compared to plain concrete, laboratory testing indicated the addition of 0.2% to 0.4%
fiber volumes to concrete increased the static flexural strength by 15 %. Some researches
reported only slight changes in static flexural strength at low volumes (<0.5% fiber) of
polypropylene FRC where fatigue resistance, not static flexure was the focus of their
research. However, vendors such as FORTA Corporation claim flexural strength
ASTM C 78
0
100
200
300
400
500
600
700
800
900
1000
FRC FLE
XURALSTRENGTH(3
MONTH)
Plain
0.1%
fiber
0.2%
fiber
0.3%
fiber
0.4%
fiber
Composite
Mo
du
lus
of
Ru
ptu
re(p
si)

-
100
increases of 17% (ASTM C-78) for 4” x 4 “ x 14” beams similar to our results.FORTA's
Ultra-Net is a polypropylene, collated fibrillated alkali resistant, non-corrosive 3/4-inch
to 2 1/2-inch fiber. Recommended application rate is 1.6 lbs. (0.1% fiber content) per
cubic yard of concrete.
Regarding variability, ACI 544 has questioned the relevancy of flexural strength
testing comparisons of polypropylene fiber volumes in concrete specimens without
adjusting mix design to maintain equivalent compressive strength values at higher fiber
volumes (see Chapter 2). Compressive strength testing (ASTM C39) is used as an
indicator of mix design control in terms of concrete's strength. Compressive strengths
decrease by as much as 10% for 0.3% and 0.4% fiber volumes in concrete as compared to
0% fiber concrete (Table 4.6). Using the compressive strength values in Table 4.6 to
normalize the MOR values for 6" X 6" X 21" beams, would decrease the flexural strength
values for 0.1%, 0.2% and 0.4% fiber volume FRC's and increase the Modulus value for
0.3% cases (Figure 4.7).

-
101
Table 4.4: FRC Specimen Fracture Observations.
FatigueSpecimen
MOR Fracture(%) Water/CementW/C
Fiber Content
AGE(days)
Plain Conc. 855 psi 100 .44 0% 93Plain Conc. 868 psi 100 .44 0% 43Plain Conc. 869 psi 100 .45 0% 49Plain Conc. 683 psi 100 .44 0% 1070.1% Fiber 973 psi 100 .44 0.1% 720.1% Fiber 970 psi 100 .44 0.1% 410.1% Fiber 947 psi 100 .44 0.1% 1070.2% Fiber 860 psi 80 .44 0.2% 860.2% Fiber 981 psi 100 .44 0.2% 400.2% Fiber 973 psi 100 .44 0.2% 1070.3% Fiber 1,061 psi 80 .44 0.3% 790.3% Fiber 1,017psi 98 .44 0.3% 280.3% Fiber 813 psi 80 .44 0.3% 1070.4% Fiber 980 psi 80 .44 0.4% 650.4% Fiber 980 psi 80 .44 0.4% 290.4% Fiber 934 psi 80 .44 0.4% 107
Figure 4.7: ACI FRC Flexural Strength Indices.
Ratio of Modulus of Rupture to the Compressive strength square root
0
5
10
15
1 2 3 4 5
Fiber Content
Ind
ice
MOR/ f'c sq. rootratio
0.2%Plain 0.4%0.1% 0.3%

-
102
Summary of Results; Toughness
The low tensile strength and brittle failure tendency of concrete airfield
pavements are a major design concern in increasing the service life and minimizing slab
failure. Concrete's tensile strength is typically only 275 psi, and the USAF considers slab
failure as 100% thickness cracking of a 20 foot by 20 foot slab into four sections; defined
as a shattered slab. Fiber reinforced concrete can increase concrete ductility and energy
absorption of the slab as the high tensile strength of fiber (60 ksi) in the matrix can carry
the load imposed on the pavement after the concrete fails by fibers bridging the crack
after failure. Toughness testing was conducted on 12 FRC samples with at an average
curing age of 95 days. Flexural strength at 1st Crack (MOR) and post first crack energy
absorption (toughness) optimized in the 0.3% fiber beams (Figure 4.9) with toughness
improving with increased fiber content at 0.4%, but at a descending MOR value. First
crack occurred at an average deflection of 0.007”, 0.01”, 0.01” and 0.012” for 0.1%,
0.2%, 0.3% and 0.4% fiber content in 4” X 4” X 14 “ concrete beams showing an
increase in ductility. Descending flexural strength (MOR) was not the result of increased
air voids or reduced compaction associated with increasing fiber content as reported by
other researchers, as both our 0.3% and 0.4% fiber maintained a 6% design air void
content (Table 4.5; Toughness Mix Design). Reduced Elastic Modulus values associated
with fiber (600 ksi) as compared to plain concrete (3,000+ksi) likely contributed to this
descending first crack strength trend at higher fiber contents.

-
103
The toughness index (I) is a measure of the capacity of fracture energy absorption
and ductility of the specimen. The toughness index is defined as the area under the load-
deflection curve up to a specific deflection divided by the area under curve up to the point
where concrete first cracks. Plain concrete fails immediately upon cracking, without
further load carrying capacity so I is always equal to 1.0 for plain concrete. However,
concrete beams reinforced with fiber continue to deflect in a ductile fashion (Figure 4.9).
The beams with higher fiber contents exhibited higher energy absorption and ductility
properties. Indices represent a ratio of remaining energy (load-deflection areas expressed
in Foot. Lbs.-inch) at 3, 5.5 and 10.5 time’s first crack deflection as compared to the
energy triangle at first crack. As example, plain concrete's (0 % fiber) have I –5,10,20
values of one.
Post crack load drop is defined as the difference between the maximum load and
the load recorded at a deflection equal to three times the deflection measured at first
crack9. Laboratory derived load drops, expressed as a percentage of maximum loads, are
98 %, 97 %, 89 % and 81 % for 0.1 %, 0.2%, 0.3% and 0.4% fiber volumes respectively.
The post crack load drop trend decreases with increasing fiber content indicating
increased stored post crack energy in higher fiber volume concrete composites (Figure
4.10).
Laboratory derived Toughness Indices compared favorable with current research
but residual strength values showed little perfect plastic behavior (R=100) of this
composite at large deflections. Indices represent a ratio of remaining energy, and
laboratory derived Toughness Indices at 0.3% fiber content were 3.17, 3.63 and 4.5 for

-
104
I-5, 10, 20 respectively indicating a fourfold ability of the FRC composite to absorb
energy as compared to plain concrete (Figure 4.9). Fibers’ ability to absorb energy in
concrete is a valuable capability to the military in terms of the amount of heaved
pavement that needs to be removed from a bomb-damaged airfield. Polypropylene fiber
reinforced concrete's (FRC) increased toughness can reduce the amount of heaved
pavement that needs to be removed and replaced, saving invaluable time to aircraft sortie
generation after an airfield attack.
Figure 4.8: ASTM C 1018 Toughness Testing.

-
105
Table 4.5: Toughness Mix Design (0.3% & 0.4 % Fiber).
W/C Ratio 0.44 0.44 0.44Darav Air (ml.) 1.9 oz./100 lbs. 1.9 oz./100 lbs. 1.9 oz./100 lbs.WRDA (ml.) (M) 5.5 oz./100 lbs.(M) 5.5 oz./100 lbs.(M) 5.5 oz./100 lbs.Fiber (%) 0.3 0.3 0.3Slump (in./sec.) 1 / 12sec 1 / 12sec 1 / 12secAir Content (%) 6.1 6.1 6.1Unit Wet. (lb./ft^3) 141.82 141.82 141.82Temp(Celsius). 20 20 20Curing from. 26-Oct 26-Oct 26-Oct
W/C Ratio 0.44 0.44 0.44Darav Air (ml.) 1.9 oz./100 lbs. 1.9 oz./100 lbs. 1.9 oz./100 lbs.WRDA (ml.) (M) 6 oz./100 lbs. (M) 6 oz./100 lbs. (M) 6 oz./100 lbs.Fiber (%) 0.4 0.4 0.4Slump (in./sec.) 18sec 18sec 18secAir Content (%) 6.0 6.0 6.0Unit Wet. (lb./ft^3) 142.82 142.82 142.82Temp(Celsius). 26 26 26Curing from. 26-Oct 26-Oct 26-Oct
Figure 4.9: Laboratory Toughness Indices.
I-5 IN D E X
I-10 IN D E X
I-20 IN D E X
3 .5 8 3 .6 3
4 .5
5 .7 6
3 .12 3 .1 43 .63
4 .41
2 .9 7 3 3 .1 73 .4 3
0
1
2
3
4
5
6
TO U G H N E S S IN D IC E S
I-5 IN D E X I-10 IN D E X I-20 IN D E X
0 .1% F ib er
0 .4% F ib er
0 .2% F ib e r
0 .3 % F ib er

-
106
Figure 4.10: First Crack and Toughness.
12
34
5 0.1% fiber0.2% fiber
0.3% fiber0.4% fiber
0
4043
850725
4460
4591
380443
356
0
4039
13 207178
0
3485
63157
155
0
500
1000
1500
2000
2500
3000
3500
4000
4500
5000
Deflection(0.02 inch) Load(Lbs.)
FRC Toughness(ASTM 1018)
0.1% fiber
0.2% fiber
0.3% fiber
0.4% fiber
First Crack
Remaining Strength

-
107
FATIGUE STRENGTH TESTING
Concrete as an airfield pavement structure is a low cost, locally available building
material found anywhere in the world. However, concrete’s low tensile strength and
brittle nature are problematic pavement design characteristics, particularly in terms of
fatigue strength and endurance limit as these structures are subject to repetitive load
cycles which produce compressive transverse tensile stresses which cause concrete to
crack and fail. Fibrillated polypropylene fiber has unique properties such as high tensile
strength and when dispersed through the concrete matrix, retard the growth of
microcracks resulting in the development of a large number of small cracks instead of a
small number of large cracks which would lead to pavement failure. Theoretically, an
FRC pavement that increases fatigue strength with a higher endurance limit would result
in a concrete airfield with a longer life span, higher aircraft load carrying capacity or a
reduced design thickness criteria as compared to a plain (0% fiber) concrete airfield
pavement. Accordingly, a comparative evaluation of fatigue properties of concrete with
four different volumes of fiber (0.1%, 0.2%, 0.3% and 0.4%) was undertaken to
determine fatigue strength and endurance limits as compared to plain (0% fiber) concrete.
By definition, fatigue strength (fmax) is the maximum flexural fatigue stress at
which a concrete beam can withstand two million cycles of repetitive loading. The
2,000,000-cycle limit is typically used to approximate the life span of a structure in
concrete highway pavement fatigue testing. In terms of comparative evaluations,
Endurance limit is defined as the maximum flexural fatigue stress of a beam attwo

-
108
million cycles of loading, expressed as a percentage of the modulus of rupture (MOR) of
the plain concrete control specimen.
The objective of this testing is to determine fatigue strength and endurance limits
of concrete with varying fiber volume (0%, 0.1%, 0.2%, 0.3% and 0.4%) subjected to
2,000,000 loading cycles at different loading stress ratios of 0.49, 0.59, 0.69 of each
beam’s MOR. If the beam failed before 2,000,000 cycles, then the next specimen would
be tested at a lower stress ratio (Figure 4.12). All beams that survived the 2,000,000
cycles were later tested for static flexural strength to determine if microcracks had
developed causing strength degradation in the concrete due to the fatigue loading. The
frequency of loading was 20 Hertz (cycles per second) on a Material Test System (MTS)
machine with a maximum load cell of 5,500 Lbs. (Figure 4.11). Loading was stress
controlled and a sine wave frequency was selected to replicate real world pavement
loading behavior. The specimens were cast in wood molds immediately after mixing the
concrete, covered with plastic and cured at room temperature for 24 hours (Figure 4.13).
The specimens were then removed from the wood molds and stored in water (100%
humidity/73º F) for 28 days or longer prior to fatigue testing. Summary graphs are
presented in Figure 4.15, showing the relationship between number of cycles (N) to
failure and fatigue strengths as well as a relative comparison of endurance limits of
varying volumes of FRC as compared to plain (0.0% fiber) concrete.

-
109
Figure 4.11: Material Testing System (MTS) Machine.
Figure 4.12: FRC Fatigue Test Failure.
Figure removed due to file size(see hardcopy)

-
110
Standards.
1. ASTM C 192; Making and Curing Concrete Test Specimens in the Laboratory.
Three specimens will be made for each test age and test condition.
Beam specimen width and depth should be three times the fiber length or maximum
aggregate sizes (preferred size 4 x 4 x 14 inches).
2. Cyclic Load Testing; 5,500-lb MTS (25-kN) testing machine, stress controlled.
Endurance Limit; 2 million cycles at 20 cycles per second loading (Figure 4.14).
Aging Period.
1. Tests are conducted at 28 days after casting the concrete.
Aging Temperature.
1. Mixing and Curing temperature (73.4°).
Polypropylene Fiber Content. 0%, 0.1%, 0.2%, 0.3%, 0.4%
Aggregate Gradations. #57
Stress Ratio. 0.69, 0.59,0.49

-
111
Figure 4.13: Casting Beam Specimen.
Figure removed due to file size(see hardcopy)

-
112
Summary of Results
Laboratory conclusions complemented literature research studies regarding
increases in concrete’s fatigue strength and endurance limit with increasing fiber content,
when expressed as a percentage of plain concrete’s modulus of rupture. Over 70, 4-inch x
4-inch x 14-inch concrete beam specimens were tested at the University of Maryland
(Figure 4.16). Fatigue strength increased when fibrillated polypropylene was added to
concrete. The average fatigue strength was 521 psi for plain concrete, 570 psi for 0.1%
FRC and 525 psi, 567 psi and 513 psi for 0.2%, 0.3% and 0.4% FRC respectively (Figure
4.15). Fiber reinforcement clearly had a beneficial effect on fatigue strength at 0.1% and
0.3% fiber volume with an increase in strength of 6 %.
In terms of endurance limit, there was an increase of 66%, 60%, 65% and 59% for
0.1%, 0.2%, 0.3%, 0.4% fiber volumes respectively as compared to plain concrete of
60%. The endurance limit (2,000,000 cycles) was increased with the addition of fiber,
which if used in airfield pavements would extend their service life. Additionally, the
energy absorption capacity of fiber seem to peak at 0.1 % and 0.3%, beyond that
increased fiber content resulted in a decline in strength. Polypropylene fiber strength
behavior appears to also decrease rapidly with increasing stress ratio. However, testing
data confirms the beneficial effect of high tensile strength ¾ inch fibrillated
polypropylene fibers in bridging microcracks and improving the ability of concrete to
resist repetitive cyclic loading. Of the fatigue beams that survived the 2,000,000-cycle
fatigue loading, static flexural testing indicate an increase in flexural strength for FRC

-
113
which may or may not be attributed to increased cure time. What can be said, is that
fatigue loading below the endurance limit stress ratio does not degrade the flexural
strength of FRC and the beam will not fail in fatigue.
Figure 4.14: Cyclic Fatigue Loading of FRC.

-
114
Figure 4.15: FRC Fatigue Stress/ Load Cycles to Failure Plot.
Figure 4.16: Fatigue Beam Specimens.
FRC S-N CURVES
0
100
200
300
400
500
600
700
800
0 500,000 1,000,000
1,500,000
2,000,000
2,500,000
3,000,000
3,500,000
Cycles(loads) to failure(N)
Str
ess(
psi)
0.4% f iber
0.3% f iber
0.2% f iber
0.1% f iber
Plain(0%)
Linear (0.3% f iber)
Linear (0.2% f iber)
Linear (Plain(0%))
Linear (0.4% f iber)
Linear (0.1% f iber)

-
115
COMPRESSIVE STRENGTH TESTING AND DUCTILITY OBSERVATIONS
ASTM C 39; Compressive Strength of Cylindrical Concrete Specimens
determines the compressive strength of 6 inch x 12 inch concrete cylinders and is
applicable to FRC. The results of this test are typically used as a basis for quality control
of concrete proportioning, mixing, admixtures and placing ensuring compliance with
specifications. Compressive strength is not an intrinsic property of concrete made of
given materials, as it’s strength value will depend on specimen size, mix proportions,
temperature and curing. Therefore, interpretation of compressive strength results should
be considered with limited significance14.
Regarding FRC ductility, ACI 544.1 R-96 “ Fiber Reinforced Concrete” American
Concrete Institute Report by ACI Committee 544, May 1997; Chapter 4- Synthetic Fiber
Reinforced Concrete (SNFRC) makes the following comments. Regarding compressive
strength, polypropylene fibers at different quantities have no effect on compressive
strength. However the fibers had a significant effect on the mode and mechanism of
failure of concrete cylinders in a compression test. The fibers failed in a more ductile
mode, particularly true for higher strength concrete where the cylinders endure large
deformations without shattering7.

-
116
Standards.
1. ASTM C 39; Compressive Strength of Cylindrical Concrete Specimens determines the
compressive strength of 6 inch x 12 inch concrete cylinders by applying a continuously
increasing axial load to the specimen until failure occurs.ASTM compressive strength
equipment and procedures (ASTM C31, C39, and C192) used for conventional concrete
can be used for FRC. However, FRC cylinders should be made using external vibration.
2. ASTM C 192; Making and Curing Concrete Test Specimens in the Laboratory.
Three specimens will be made for each test age and test condition. Specimen diameter
should be three times the fiber length or maximum aggregate size.
Aging Period. Tests are conducted at 28 days after casting the concrete.
Aging Temperature. Mixing and Curing temperature (73.4°F).
Polypropylene Fiber Content. 0%, 0.1%, 0.2%, 0.3%, 0.4%
Aggregate Gradations. #57, #357
Slump. (ASTM C 143) Slump of Hydraulic Cement Concrete. However, FRC samples
should also be tested by ASTM C 995; Time of flow through Inverted Cone test.
Air Content (ASTM C 138). However, FRC samples should be consolidated using
external vibration.

-
117
Summary of Results.
Compressive strength testing was undertaken on twenty-five, 6 inch X 6 inch X
12 inch concrete cylinders evaluating not only varying volumes of polypropylene fiber
(0.1%. 0.2%, 0.3%, 0.4%) but the effects of varying water-cement ratio (high
strength/normal strength), different aggregate gradation (#357/#57) and curing times; 28
to 37 days (Figure 4.17). On average, the compressive strength for 0.1%, 0.2%, 0.3% and
0.4% fiber reinforced concrete was 6,075 psi, 5,394 psi, 4,543 psi and 4,869 psi
respectively. As compared to plain concrete strength of 5,339psi, and high strength (0.4
water-cement) plain concrete; 5,446 psi (Table 4.6). The addition of fiber content beyond
0.2%, resulted in a corresponding decrease in compressive strength by 10% at 0.4 % fiber
volume. A reduction likely due to the fiber’s low elastic modulus (600 ksi) as compared
to the concrete modulus (4,000 ksi). Also, the mode of cylinder failure was more ductile
with increasing fiber content, crushing samples rather than failing them in shear.FRC
cylinders endure large deformations without shattering, and composites with 0.4%
polypropylene fiber content showed the greatest ductile behavior (Figure 4.18).
Table 4.6: Compressive Strength Values at Failure.
Cure Time 0.1 fiber 0.2 fiber 0.3 fiber 0.4fiber plain #57 High Strength
19 days28 days 5,854 5,235 6,137 5,80128 days 6,296 5,341 4,217 4,98428 days 5,62428 days 5,37733 days 5,607 4,606 5,32033 days 4,439 5,04133 days 4,584 4,24537 days 5,554Strength 6,075 psi 5,394 psi 4,543 psi 4,869 psi 5,339 psi 5,446 psi

-
118
Figure 4.17: FRC Compressive Strength Test Results.
Figure 4.18: Ductile Cylinder Specimens.
19days
28days
28days
28days
28days
33days
33days
33days
37days
0.1
fiber
0.2
fiber
0.3
fiber
0.4f
iber
plai
n #5
7
plai
n #3
57
Hig
h S
trgh
plai
n(H
RW
R)0
1000
2000
3000
4000
5000
6000
7000
Strength(psi)
Curing Time
FRC Com pressive Strength
0.1 fiber 0.2 fiber 0.3 fiber 0.4fiber plain #57 plain #357 High Strgh plain(HRW R)
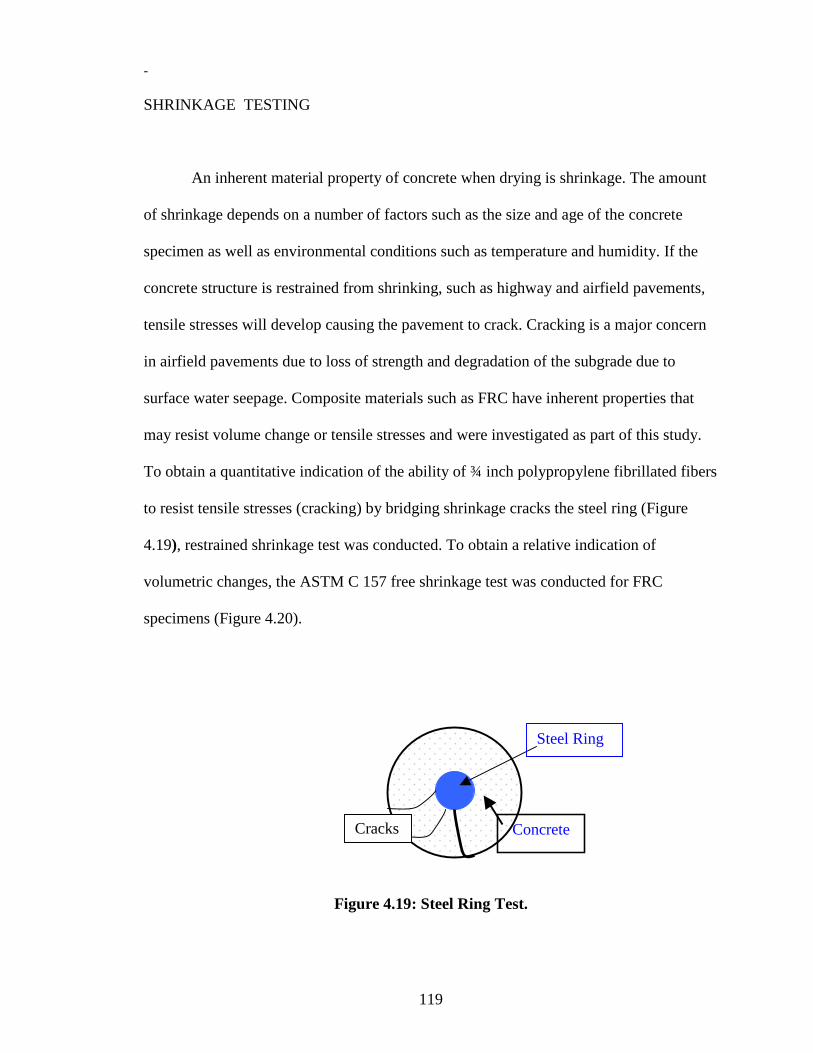
-
119
SHRINKAGE TESTING
An inherent material property of concrete when drying is shrinkage. The amount
of shrinkage depends on a number of factors such as the size and age of the concrete
specimen as well as environmental conditions such as temperature and humidity. If the
concrete structure is restrained from shrinking, such as highway and airfield pavements,
tensile stresses will develop causing the pavement to crack. Cracking is a major concern
in airfield pavements due to loss of strength and degradation of the subgrade due to
surface water seepage. Composite materials such as FRC have inherent properties that
may resist volume change or tensile stresses and were investigated as part of this study.
To obtain a quantitative indication of the ability of ¾ inch polypropylene fibrillated fibers
to resist tensile stresses (cracking) by bridging shrinkage cracks the steel ring (Figure
4.19), restrained shrinkage test was conducted. To obtain a relative indication of
volumetric changes, the ASTM C 157 free shrinkage test was conducted for FRC
specimens (Figure 4.20).
Figure 4.19: Steel Ring Test.
Steel Ring
ConcreteCracks

-
120
Standards.
1. Unrestrained Shrinkage: ASTM C 157; Length Change of Hardened Hydraulic-
Cement Mortar and Concrete.
2. Restrained Shrinkage. ACI has not declared a standard test for restrained shrinkage
evaluation of FRC. The steel ring test can be used to monitor shrinkage and associated
cracking that can occur within a few hours of placement. To ensure restraint cracking,
specimen thickness should be 35 to 75 mm (3 inches or less) thick. Measure the number,
width, location and spacing of cracks during the drying process.
Aging Period.
1. Store in the lime saturated bath for 28 days and measure length change. Additional
measurements are taken at 24 hours, 8 weeks, then 16, 32, and 64 weeks for specimen
water storage procedure.
2. For specimen air storage, measure length change at 24 hours, 4, 7,14 and 28 days.
Additional measurements are then taken at 8 weeks, then 16, 32, and 64 week.
Aging Temperature. Temperature for curing specimens will be maintained at 73.4°F and
at a relative humidity of 50 %.
Polypropylene Fiber Content. 0%, 0.1%, 0.2%, 0.3%, 0.4%
Aggregate Gradations. #57, # 357

-
121
Free Shrinkage
ASTM C157/C 157M-99; Length Change of Hardened Hydraulic-Cement Mortar
and Concrete permits assessment of potential volumetric expansion or contraction of
concrete due to causes other than applied forces or temperature change. It is particularly
useful in comparative evaluation of length changes in composites such as FRC under
controlled laboratory conditions of temperature and humidity14. In our study we prepared
twenty-seven, 6 inch X 6 inch X 21 inch concrete beams of varying fiber content
0%(plain), 0.1%, 0.2%. 0.3% and 0.4% using # 57 aggregate at a water-cement ratio of
0.44 and two sets (3 beams to a set) of 0.0%(plain) fiber beams using # 57 aggregate at a
water-cement ratio of 0.4(high strength-low shrinkage) and at a different gradation (MD
# 357) at 0.44 water-cement ratio. Beams were cured in water (100% humidity) for 28
days and then stored in a controlled 50 % humidity environment for an additional 28 days
(Figure 4.20). Free shrinkage measurements were taken with a dial gage extensometer
with a 10-inch gage length (comparator) on embedded brass studs in each beam (Figure
4.21). Measurements were taken in accordance with ASTM C 157 and free shrinkage was
calculated on the basis of length change. It is assumed that the length of the specimen is
much larger than the cross section dimensions, then shrinkage takes place only in one
direction. These measurements of change in length with time are detailed and
summarized in the following charts (Figures 4.24, 4.25). They provide a snapshot in time
measure of one-dimensional shrinkage of this composite as compared to plain (0% fiber)
concrete.

-
122
Figure 4.20: Free Shrinkage Beam Curing.
Figure 4.21: Free Shrinkage Measurements with Extensometer.

-
123
Restrained Shrinkage
There is presently no standardized procedure for quantifying the effects of
polypropylene, or any other synthetic fiber, on plastic or drying shrinkage or on cracking
that results from volume change under restrained shrinkage7. When concrete shrinks
without being able to move, tensile stresses will arise. When the stresses cause the
concrete to strain, cracking will occur. In principle, the steel ring test can be used to
monitor the plastic shrinkage and associated cracking that sometimes occurs within a few
hours of placement under adverse conditions of temperature, humidity, and wind speed
causing high surface evaporation4. It can be assumed that the concrete ring is subject to
approximately uniaxial stresses, when the steel ring restrains the shrinkage of the
concrete annulus7. Twenty-one steel ring tests were conducted on plain and 0.1%. 0.2%,
0.3% and 0.4% fiber reinforced concrete samples. The steel ring was obtained by cutting
a 12 inch steel pipe and the outer mold was a 16 inch cardboard Sonotube, which are
typically used for column formwork in construction (Figure 4.22). Since the largest size
aggregate in #57 gradation is 1 inch, the concrete ring was cast at 1.8 inch thick (< 2
inches) between the incompressible steel ring and the cardboard. Ring height was 5.5
inches, maintaining a 3 to1 ratio of ring height to thickness. The cardboard outer mold
was stripped off 24 hours after casting the concrete ring and cured for 7 days in water
(100% humidity). After the ring was removed from the water bath, the top surface of the
concrete ring was sealed with plastic wrap and plumbers clay to promote drying in one
direction only, the outer ring surface (Figure 4.23). The rings were air dried for six weeks
at 35% relative humidity and a variable temperature of 80°F and cracking was monitored
on the surface of the rings.

-
124
Figure 4.22: Concrete Ring Sonotube Form.
Figure 4.23: Concrete Ring Specimen Curing.

-
125
Summary of Results
In free shrinkage, the additions of polypropylene fibers do not significantly alter
drying shrinkage as shown in the following charts (Figures 4.24/4.25). Grzybowski and
Shah reported similar results and concluded that the primary advantage of fibers in
relation to shrinkage is their effect in reducing the adverse width of shrinkage cracks24.
Free shrinkage was lower for the high strength concrete due to the lower amount of water
and more dense structure of the material, as most shrinkage is likely due to the loss of
water during hydration. However, longer term studies (600 days) reported shrinkage
strains were generally smaller for fiber (steel fiber) reinforced concrete as compared to
plain concrete and shrinkage stopped at 500 days for fiber reinforced concrete whereas it
continued to 600 days for plain concrete19. Long term, this may or may not also be true
for polypropylene fiber.
The effectiveness of fibers under restrained shrinkage was observed. After the
rings were air dried for six weeks at 35% relative humidity and a variable temperature of
80°F, no cracking was monitored on the surface of the rings. In order to induce cracking,
we subjected the rings to a variable outside air temperature ranging from 32°F to 72°F at
35% to 40 % humidity for eight weeks with no visible sign of cracking in any samples.
To induce cracking, plain and 0.2% fiber samples were then low temperature tested for
seven days to –30 °Celsius, then 23° Celsius room temperature. Again no cracks were
observed in any samples even after five months from casting. Indeterminate results for
this test are attributed to the high strength of the concrete mix (low water-cement ratio)
and size of aggregate (#357 aggregate) requiring up three inch thick concrete rings.

-
126
Steel Ring results reported by Grzybowski and Shah24,showed that small
amounts of fiber could substantially reduce cracks and no cracking was observed during
our testing. In the study, the average crack width of the specimen reinforced with 0.25%
polypropylene fiber was 0.5 mm (0.016 inches) or one half the value of plain concrete,
after six weeks. Additionally, the addition of very small volumes of fiber (0.1%) did not
show any significant reduction in crack width or numbers of cracks. The reduction in
cracking and crack width is significant in terms of the reducing the potential of FOD to
high performance jet aircraft, due to deterioration of airfield surfaces, as well as loss of
subgrade through cracks due to slab pumping from heavy lift cargo aircraft.

-
127
Figure 4.24: Plain (0% fiber) Free Shrinkage Test Results.(Charts courtesy of Haejin Kim)
Figure 4.25: FRC (0.1%, 0.2%, 0.3%, 0.4%,) Free Shrinkage Test Results.
-0 .100
-0 .090
-0 .080
-0 .070
-0 .060
-0 .050
-0 .040
-0 .030
-0 .020
-0 .010
0 .00 0
0 5 10 15 20 25 30
D A Y S
SH
RIN
KA
GE
%
57P L-A V
357LS -A V
57LS -A V
-0.100
-0.090
-0.080
-0.070
-0.060
-0.050
-0.040
-0.030
-0.020
-0.010
0.0000 5 10 15 20 25 30 35 40
D AYS
SH
RIN
KA
GE
%
1F-AV
2F-AV
3F-AV
4F-AV

-
128
CHAPTER 5. ANALYTICAL EVALUATION AND MODELING
INTRODUCTION
Although concrete is one of man’s most common building materials, relatively
little is known about damage accumulation to structures subjected to large numbers of
load applications during their design life. Concrete deteriorates both in strength and
stiffness under repeated load applications, especially if it is stressed well beyond half it’s
rupture modulus in tension (stress ratio > 0.5). Current research on plain and
polypropylene fiber reinforced concrete (FRC) suggests that at fiber contents less than
0.5% and at stress ratios below 0.75, Miner’s Rule is applicable. Miner’s Rule presumes a
linear accumulation of damage of materials like concrete until failure (cracking). Beyond
stress ratios of 0.75 and fiber contents greater than 0.5%, damage accumulates in concrete
in a pronounced, non-linear fashion and energy absorption capacity decreases almost
exponentially1.
Finite element analysis and performance modeling are detailed in this chapter for
FRC pavement design thickness, corner deflections, thermal stresses, and explosive
fracturing (heaved pavement). KenSlabs and LEDFAA computer programs can be used
to build performance models to predict FRC material behavior and to establish minimum
thickness criteria for rigid airfield pavements subjected to a specific aircraft loading for a
stated design life. Through literature review and laboratory testing, material properties of
-
129
varying volumes of low fiber content (<0.5%) concrete, such as Modulus of Elasticity
(E), values for Modulus of Rupture (MOR), fatigue and toughness (1st crack strength) can
be quantified to determine strength, thermal stresses, and fracture resistance
characteristics of this composite. The objective of this chapter is to build performance
models to evaluate FRC composites for strength, thermal stress and energy absorption at
stress levels below 0.75.
FRC DESIGN THICKNESS PREDICTIONS
Conventional design (thickness) of concrete airfield pavement is based upon
concrete’s maximum flexural stress, the thickness and modulus of elasticity of base and
subgrade soils, the aircraft’s gross weight (with the load either parallel or normal to the
edge of the slab), the volume of aircraft traffic, type of traffic area (runway, taxiway,
apron) and allowable vertical slab deflection. Because of fiber reinforced concrete’s
increased fatigue strength, due to the bridging of fibers across cracks that develop, the
thickness of concrete airfields can be significantly reduced. However, this results in a
more flexible structure, which causes an increase in vertical deflections and potential for
densification and/or shear failures in the foundation and pumping of the subgrade
material. To protect against these factors, limiting deflection criteria must be applied. If
the computed deflection is less than the allowable deflection, the airfield’s thickness
design is acceptable. If the computed deflection is larger than the allowable deflection,
the thickness design for concrete must be increased or a modified value for the concrete’s
flexural strength or base/ subgrade modulus must be used. During this study, deflection

-
130
and material property parameters are in accordance with TM 5-825-3/AFM 88-6 Chapter
3. Allowable vertical deflection of an airfield pavement section will not be greater than
0.05 inches and concrete’s design flexural strength will be less than 900 psi for plain
concrete. This ensures adequate pavement thickness to preclude subgrade pumping and
design using average strength concrete mix values.
If Miner’s Rule of linear damage accumulation is applicable for plain and
polypropylene fiber reinforced concrete (FRC) at stress ratios below 0.75. It is reasonable
to assume that a relationship exists between aircraft passes to failure (N) and the stress
level as defined as the ratio of applied stress (tire contact pressure) and the static flexural
strength of the concrete, the Modulus of Rupture (M.O.R.). The pavement stress level
between an applied aircraft's tire contact pressure and between varying volumes of low
fiber content (<0.5%) concrete, and their respective values for Modulus of Rupture
(MOR) is the important input values for KenSlabs or any FEM pavement design
modeling. Typically in pavement design, the applied stress value (tire contact stress) and
the concrete's MOR is used to determine thickness for a specific aircraft or mix of
aircraft. Such a relationships could be expressed mathematically in the form of a
thickness to stress level equation to establish minimum thickness criteria for rigid airfield
pavements subjected to a specific repetitive aircraft loading for a stated design life. Since
damage accumulates in a linear fashion below stress ratios of 0.75, as mentioned
previously, pavement failure (Nf) under a stated design wheel load (tp) for a given
pavement’s static flexural strength (Sc), will show a linear relationship for pavement life
prediction (tp/ Sc < 0.7 stress levels).2

-
131
General Form of the Derived Equation for FRC Design Thickness
Through static flexural and fatigue testing and Finite Element Method computer
modeling, mathematical relationships were established to determine airfield design
thickness criteria for FRC pavements at fiber contents of 0%, 0.1%, 0.2%, 0.3% and
0.4% and at stress levels of less than 0.7 for given aircraft wheel loads (see Figure 5.5).
The equations were derived by using the KenSlabs’ damage analysis program, inputting
aircraft gear geometry, loading stress (contact pressures) at five different stress levels
(0.29,0.39, 0.49,0.59,0.69) as a function of the modulus of rupture (MOR) of plain (0%
fiber) concrete for a given mix (Table 4.1). Chapter two of this dissertation explains the
root operating equation for the KenSlabs Damage Analysis program. The relationship of
loads to failure (N), the tensile stress imposed at the base of the slab at failure and the
Modulus of Rupture of the FRC material being evaluated and is expressed
mathematically as equation 5.1. Similar fatigue equations and coefficients (f, f î) values
have been developed by the Portland Cement Association (PCA) showing a relationship
between stress ratio (σ/ Sć) and vehicle passes to failure (N)2.Additionally, these fatigue
values and models are used by researchers, such as the PCA and the Corps of Engineers
to establish a relationship between the maximum loading stress (σmax) to the modulus of
rupture which they define as the stress level (S) as derived from the Wholer equation
(Equation 5.2). Where a and b are experimental coefficients that vary with loading
conditions, compression, tension, or flexure, to predict the fatigue life of pavements38.
Log N = f î – f (σ/ Sć) (5.1)
S= σmax/MOR = a-b log (N) (5.2)

-
132
Using KenSlabs, similar a-b coefficients can be derived for a given aircraft based
on its unique pavement loading characteristic in order to predict the fatigue life of a given
concrete pavement based on its material properties. Essentially this is done by
manipulating the KenSlabs damage analysis program by holding the failure tensile stress
(σ) and loads to failure (N) values constant and determining new coefficients from
modeling reflecting each aircraft's unique gear geometry and tire pressure loading similar
to the Wholer equation. The output value then becomes pavement design thickness (Tc)
based on aircraft gear and tire pressure as a function of the material properties (MOR,
fatigue strength (fv)) of an FRC pavement (Figure 5.5). Through modeling of five
different aircraft, through 80 different KenSlabs modeling runs, pavement thickness to
stress level charts were developed and are presented in this chapter defining a common
linear relation of stress level (0.29,0.39, 0.49,0.59,0.69) to pavement thickness properties
for each given aircraft at concrete's endurance limit ( Nf > 2,000,000). This is
determined through iterative KenSlabs fatigue damage design thickness modeling to
determine the optimum rigid pavement thickness (Tc) that will produce a tensile strength
at the base of the slab to achieve 2,000,000 passes of a given aircraft. If the airfield
thickness is to small, the tensile stress will be to great and the stress ratio (Sr) to high so
the endurance limit will not be reached. If the Tc is to large, the stress ratio will be to low
and the aircraft loading enters a no failure condition (Nf = unlimited) indicating
overdesign. This process is illustrated in Figures 5.8 and 5.12 and the resulting equations
can be used to quantify pavement design thickness reduction values for any given aircraft
gear geometry and tire pressure as a function of the difference in flexural strength (MOR)
of any given FRC material (0.1%, 0.2%,0.3%,0.4% fiber content). Additionally, the

-
133
framework of the equation can support integration of laboratory derived endurance limit
(fatigue strength/MOR plain concrete) values from 2,000,000 cycle FRC laboratory
specimen fatigue testing to determine Pavement Reduction Values (PRV) using fatigue
strength Indices [(f max/ fv max]½ to the general thickness equation for plain concrete
presented in this Chapter. In this case, the general equation considers the actual tire
contract stress and MOR for plain concrete to determine the stress level to calculate
pavement thickness (Equation 5. 8). This thickness is then reduced by the fatigue strength
Indices, and the PRV is then determined by comparing the results from each fiber case to
plain concrete design thickness.
The value of these predictive design thickness (Tc) equations is to quantify in a
rational sense the relative benefits of varying volumes (0%, 0.1%, 0.2%, 0.3%, 0.4%) of
fiber reinforcement in terms of pavement thickness reduction (PRV) values under a given
critical aircraft loading. This tells us the difference in pavement thickness due to fiber's
contribution at a stress ratio at the endurance limit (Nf > 2,000,000) for later use in
determination of an airfield design thickness for a no pavement failure condition due to
aircraft loading. These derived design thickness equations (Tc) are not intended to be
pavement design equations in the conventional sense, but allow development of FRC-
PRV values that can then be used with any concrete pavement thickness design to reduce
that design thickness. The FRC-PRV values give design thickness reduction credit for the
fibers enhanced flexural and fatigue strength characteristics exhibited by fiber concrete
composites as compared to plain (0% fiber) concrete. Examples of the FRC- PRV design

-
134
thickness reduction methodology are presented in this Chapter and a case study in FRC-
PRV thickness reduction for the C-17 Aircraft is contained in Chapter Six.
Constraints were placed on the KenSlab damage analysis program limiting
pavement deflection to 0.05 inches and demanding a minimum of 2,000,000 aircraft
passes. To determine the deflection criteria (0.05 inches) used in the above mentioned
computer program, the joint use U.S. Army Technical Manuel ™ 5-825-3/ Air Force
Manuel (AFM) 88-6 Rigid Pavements for Airfields 6, was consulted. Specifically,
Chapter 4; Fibrous Concrete Pavement Design using the aircraft design charts and
deflection tables as shown in Table 1.1. A minimum of two million aircraft passes were
selected to match FEM modeling results with laboratory testing protocols for fatigue
testing values at the endurance limit. Resulting design thickness for each stress level was
graphed (Figure 5.5) yielding the predictive linear equation on pavement thickness as a
function of a fiber-concrete composite’s material properties and specific aircraft loading.
Such equations establish minimum thickness ( Tc) for no failure pavement design life
and to limit pavement deflections that prevents subgrade failure, such as pumping. The
coefficients that emerged were defined as L and D coefficients, L due to its association
with the stress level design life (tp/ Sc) variable of the pavement equation and the
constant was called D as the value for deflection control. These equations account for the
effect of fiber reinforcement bridging microcracks in concrete under cyclic loading
causing a strength increase, and the fiber’s effect in increasing pore and microcrack
density causing a strength decrease. This fiber effect was established as the difference
between the maximum FRC composite fatigue strength (defined as fv) and the maximum

-
135
concrete fatigue strength (defined as fmax) of plain (0%fiber) concrete. The ratio's
obtained, as a percentage of the Modulus of Rupture (fv/Sc) is better known as the
endurance limit, normalized in terms of the strength of plain concrete. Based on
laboratory derived static flexural and fatigue strength values, FAA’s LEDFAA v1.2 and
KenSlabs finite element computer programs for rigid pavements were run to calculate
thickness criteria to support a 20-year design life (Nf > 2,000,000) for different mix of
aircraft. Thickness values using polypropylene fiber concrete at 0.1%, 0.2 %, 0.3%, 0.4%
volumes and plain concrete were computed. The linear equation when graphed by aircraft
becomesEquation 5.3. A design thickness equation defining the relationship for a given
aircraft's gear geometry and tire pressure as it pertains to the material properties of an
FRC composite (MOR, fatigue strength (fv)) in terms of stress level to rigid airfield
pavement thickness at the endurance limit. The purpose of the thickness equation was to
create FRC pavement reduction values (PRV), not to create a new rigid pavement design
equation in the conventional sense.
T (concrete) = [L (tp/ Sc) +D] (5.3)
Derivation of the laboratory fatigue pavement reduction values; [(f max/ fv max]½
has it's root from ASTM C-78 Modulus of Rupture equation (Equation 5.4) and the
rectangular section modulus of a beam defined by the term Z = bd²/6 in calculations for
bending moment (Equation 5.5) to failure in a testing machine as it pertains to maximum
flexural stress (fmax ) obeying Hooke's law39. The maximum flexural stress (fmax ) can
be expressed as 6M/bd², or Equation 5.6 where M = PL/4 . Equation 5.6 then defines the
specimen thickness d, equal to √6PL/4b (fmax ). Since flexural stress varies directly with
the distance of the section from the neutral axis, in this case the equation can be

-
136
expressed as by the term ∆ d = √6PL/4b[(1/f max)½ - (1 /fv) ½ ] or Equation 5.7 when
considering the improvement in fatigue strength due to FRC material properties.
Substituting d from beam analysis for Tc from Equation 5.3, the equation then becomes
Equation 5.8 for quantifying the reduction in pavement thickness for a given aircraft due
to the improved material properties of a fiber-reinforced composite. Both applications of
the equation, flexural and fatigue then yield design thickness values that quantify the
beneficial properties of FRC under static and dynamic loading conditions relative to the
design thickness for plain (0% fiber) concrete.
Determine the maximum fiber stress for third point loading
MOR= PL/bd² or (fmax ) = M/Z (5.4)
Determine bending moment for a rectangular section
M= PL/4 where Z = bd²/6 (5.5)
Determine maximum bending stress
(fmax ) = 6M/bd² = 6PL/4 bd² (5.6)
Determine the difference in thickness due to fiber's enhanced fatigue strength yields
∆ d = √6PL/4b(fmax) [1- f max/fv] ½ (5.7)
Apply the thickness reduction indices as a ratio of fatigue stress values (plain/fiber case)
T (concrete) = [L (tp/ Sc) +D ] [(f max/ fv max]½ (5.8)
KenSlabs Damage Analysis Input and Output Values for Design Thickness Equation.
To determine the most critical loading case for airfield concrete slabs, three
different loading positions (interior, corner and edge loading) were considered in

-
137
accordance with Westergaard’s analytical solutions for stresses and deflection prior to
KenSlabs modeling. Fatigue damage based on edge stress (Figure 5.1), between the
transverse joints was selected as the most critical location for tensile stress. The critical
deflection occurs at the slab corner when the aircraft load is applied at that location2.
A typical rigid airfield pavement profile for KenSlabs modeling consists of a
concrete slab, treated base, stabilized granular subbase and the natural soil. Typically, the
standard concrete airfield slab is 25 feet by 25 feet by 17 inches thick with a Young’s
Modulus (E) set at 4,000 ksi and a Poisson’s Ratio of 0.15. An 8-inch Stabilized base
with a Young’s Modulus (E) set at 500 ksi and a Poisson’s Ratio of 0.2 and an infinite
subgrade with a Young’s Modulus (E) set at 4,500 psi and a Poisson’s Ratio of 0.35.
Minimum values established by the Federal Aviation Administration (FAA) include a 20-
year rigid pavement design life, a minimum six inch thick concrete surface with a base
thickness of four inches40. According to Huang, PCA claims that freeze-thaw conditions
have little significance in reducing the subgrade modulus and rigid pavement damage due
to spring thaw 2, so the base thickness will be kept at eight inches. This will ensure that
an adequate capillary barrier is maintained under the slab when using a seasonal
adjustment factor in the KenSlab model of 0.8 or less (less than 20% damage to subgrade
from spring thaw)2. A description of each KenSlabs model input and output parameters
were discussed in Chapter 3. A description of the KenSlabs damage analysis program
operating characteristics is contained in Chapter 2. In the analysis, the following input
values were considered.

-
138
1. Aircraft Gear Geometry. After slab dimensions coordinates and critical nodes are
inputted into the slab grid, aircraft gear and tire pressure values are superimposed.
The slab size is 24'X24', with symmetry about the Y-axis. Aircraft with high tire
pressure loading were considered; Boeing 777, Boeing 747, Boeing C17, Lockheed
Martin C141, and Lockheed Martin F-16 aircraft.
2. Load variables. Applied contact stress values inputted as tire pressure values,
calculated to produce stress levels 0.69,0.59.0.49,0.39,0.29 of the inputted modulus of
rupture values for plain concrete from laboratory testing (MOR= 868 psi). PCA
default fatigue coefficients of 17.61 for plain concrete are used in KenSlabs which
defines the 50% probability of fatigue failure line between stress ratio and loads to
failure (N) from a wide spectrum of concrete specimen fatigue test data2.
3. Traffic. In the analysis, minimums of 2,000,000 aircraft passes were selected to match
endurance limit values for fatigue strength as determined in the laboratory. Allowable
pavement deflection was set at 0.05 inches in accordance with Table 1.1, Chapter 1.
4. Material Properties. The following properties were considered. Average concrete
Modulus of Elasticity (E) of 4,000,000 psi, Poisson ratio, 0.15, MOR of 868 psi for
plain concrete, thermal expansion 0.000005 inch/inch, Base modulus; 500,000 ksi ,
Base Poisson ratio, 0.2.
5. Environmental Adjustment factor. A 15% seasonal reduction in base/subbase strength
due to spring thaw was considered.
6. Iterative KenSlabs damage analysis output runs are made until a design thickness is
found that allows at least 2,000,000 aircraft passes for a given gear geometry, and at
five different applied contact stress values for a given tensile stress ratio. Resulting

-
139
values are graphed and tabled (Figure 5.5 /Table 5.3) to determine the equation for
predicting pavement design thickness reduction values under varying material
properties (MOR, fatigue strength) and aircraft tire pressures by fiber case.Output
summary of the design thickness Figures, Tables and corresponding T (concrete) = [L
(tp/ Sc) +D] equations and L/D coefficients are as follows for each aircraft.
• Critical aircraft: Boeing 777 (Figure 5.5 / Table 5.3)
T (concrete) = [16.7 ”(tp/ Sc) +4.4”]
• Boeing 747 (Figure 5.6 /Table 5.4 ) T c = [16.5”(tp/ Sc) + 4.5”]
• Lockheed Martin F-16 aircraft (Figure 5.8 /Table 5.5 )Tc = [13.6”(tp/ Sc) +4.6”]
• Lockheed Martin C-141 (Figure 5.11 /Table 5.6 ) Tc = [17”(tp/ Sc) +5”]
• Boeing C-17 (Figure 5.12 /Table 5.6) T c = [17.7”(tp/ Sc) +5.9”]
Figure 5.1: Typical PCC Airfield Pavement.
Edge LoadingCritical
Corner LoadingCritical
25 feet
17 inch PCC
8 inch baseSubgrade
25 feet

-
140
The general form of the derived equation for FRC design thickness is then.
T (concrete) = [ L(tp/ Sc) +D ] [(f max/ fv max]½ (5.8)
For tp/ Sc < 0.7 stress levels [stress ratio <0.50]
Where; T (concrete) = Rigid airfield pavement design thickness(inches).
L(tp/ Sc) +D = minimum pavement thickness(inches) to control design life (L) & deflection (D) in plain concrete(0% fiber).
tp= Aircraft tire pressure in psi. Sc= Modulus of Rupture plain concrete (psi).
fv = fiber volume (0.1%, 0.2%, 0.3%, 0.4%) laboratory derived maximum fatigue strength (psi) at 2,000,000 cycles. fmax = laboratory derived maximum fatigue strength (psi) at 2,000,000 cycles for plain concrete.
Constraints on the Proposed Design Thickness Equation
Fiber reinforced concrete as a structural element in airfield pavements lacks a
long-term performance history. Unlike conventional plain concrete, fatigue coefficients
have not evolved like those proposed by Haung and the Portland Cement Association
(PCA) for fiber composites based on a wide range of differing mix designs. Additionally,
fatigue coefficients are at best an approximation of concrete’s failure probability due to
loads to failure at different stress ratios from empirically derived data. Chapter five
presents aircraft specific thickness equations used to determine average pavement
thickness reduction values (PRV) at various fiber contents, derived using the concrete
fatigue coefficients of 17.61 as recommended by Haung for KenSlabs. Additionally,
material properties such as differing Modulus of Elasticity values for varying fiber

-
141
volumes were averaged, as the objective was to propose generic PRVs that could be
tabulated for use at any military or civilian airfield location, based on laboratory test data
typically available to engineers such as modulus of rupture of a given mix design. The
goal was to develop PRVs for each fiber case that could be applied to any conventional,
airfield design thickness program like LEDFAA. Using only data typically available to
engineers, such as an aircraft’s tire pressure and gear geometry as well as a concrete’s
Modulus of Rupture value based on mix, pavement thickness reduction credit could be
given to any conventional concrete design based on fiber volume selected.
Tables 5.1 was constructed using design mix MD-7 specific material property
values to demonstrate that the above generic, average value approach produces PRVs that
are conservative in estimating design thickness reduction due to fiber. The corrected FRC
fatigue coefficients in these tables are based on data from only one design mix strength
and do not represent a broad spectrum of mix designs and fatigue strengths as used by
Huang for KenSlabs. FRC researchers (Grzybowski and Meyer1) do not consider it
proper to use such fiber fatigue coefficients if they are based on limited test data; fatigue
data from just one mix design. FRC Modulus of Elasticity and Rupture (MOR) values
presented are also mix and specimen size dependent. During KenSlabs modeling, it was
noted that changes in elasticity and fatigue coefficient values between fiber cases do not
have the effect on design thickness as does differing values for the MOR between
composites. As such, with each aircraft specific fatigue thickness equation presented in
this chapter, a comparison of results is made with flexural strength values by fiber case
(Equation. 5.12 through 5.26).

-
142
Haung also concludes that loads to failure (Nf) at stress ratios (S) below a given
value is infinite (ie pavement failure is not affected by additional aircraft passes).
According to Haung, the Portland Cement Association states that for a stress ratio
(S) < 0.45 the allowable number of load repetitions are unlimited (Nf > 2,000,000). Even
at stress ratios of S < 0.50, no limit to loads to failure (Nf) were found to 10-20 million
cycles under third point loading2. The results presented in Table 5.2 are at S < 0.46 (403
psi /868 psi) which implies a no failure loading condition for the pavement is expected
beyond 2,000,000 aircraft passes. As can be seen in Table 5.2, there is little impact on
pavement thickness at higher load repetitions, such as three million cycles, or deviation in
the slope of the pavement thickness – material behavior line (Figure 5.2, Figure 5.3).
Table 5.1: Thickness Reduction for Boeing 777; MD-7 Mix.
FRC beams4"x 4"x14" (MD-7 mix)
MOR Modulus of Elasticity(psi)
FRC MD-7 FatigueCoefficients( f 1/ f 2)
777 Design Thickness at 182 psi Tire Pressure(Kenslabs)
Design Thickness Reduction
Plain 868 psi 4,158,817 10.24 / 6.6 7.06” --------------0.1 % Fiber 970 psi 4,382,465 8.76 / 4.2 6.30 ” 0.76 inch0.2 % Fiber 981 psi 4,179,904 13.05 / 11.57 6.15” 0.9 inch0.3% Fiber 1,017 psi 3,735,295 8.88 / 5.15 < 6.0” 1.0 inch0.4% Fiber 980 psi 3,830,317 10.97/ 8.2 6.0” 1.0 inch

-
143
Table 5.2: Thickness Edge Stress Results - Boeing 777 Aircraft.
Stress Level(MOR = 868
psi)
Contact Stress
(σmax)(Applied Stress)
Tensile stress at failure(σ)
( 1 st Crack Failure)
KenslabsComputed
Design Thickness(2 Million Cycles)
KenSlabs Computed
Design Thickness(3 Million Cycles)
0.69 608 psi 403 psi Tc= 15.86 inches Tc= 15.93 inches0.59 512 psi 403 psi Tc= 14.29 inches Tc= 14.50 inches0.49 425 psi 402 psi Tc= 12.81 inches Tc= 13.05 inches0.39 338 psi 402 psi Tc= 11.08 inches Tc= 11.15 inches0.29 252 psi 402 psi Tc= 8.92 inches Tc= 8.99 inches
Figure 5.2: Boeing 777 Design Thickness (MD-7 Mix Design).
Figure 5.3: Boeing 777 Design Thickness (3,000,000 passes).
777 Aircraft (2 ,000,000 passes)y = 16.734x + 4 .3588
0
5
10
15
20
0 0.2 0.4 0 .6 0.8
Stress Level
Pav
emen
t T
hic
knes
s
7 7 7 A irc ra ft (3 ,0 0 0 ,0 0 0 p a s s e s )y = 1 6 .8 6 3 x + 4 .4 2 7 6
0
5
1 0
1 5
2 0
0 0 .2 0 .4 0 .6 0 .8
S tre s s L e v e l
Pav
emen
t T
hic
knes
s

-
144
FRC Predictive Pavement Thickness Equations; Boeing 777 and 747 Aircraft
The main landing gear of the Boeing 777 aircraft is unique, with two sets of six
wheels arranged in a tridem (3 pairs of wheels in a row) configuration. The spacing
between each wheel in the tridem is 57 inches. The spacing between the two-tridem rows
is 55 inches. Gross aircraft weight can be 537,000 lbs, typically each wheel load equals
42,500 lbs. with a tire pressure of 182 psi and a tire contact radius area of 8.62 inches. In
terms of aircraft passes, 100,000 annual departures were considered for 20 years.
KenSlabs pavement responses are for a single wheel, however the principle of
superposition (Figure 5.4) was utilized to determine pavement responses corresponding
to the tridem gear configuration.
The main landing gear of the Boeing 747 aircraft is a four, dual tandem gear (2
pairs of wheels in a row) configuration. The spacing between each wheel in the tandem
is 44 inches. The spacing between the two tandem rows is 54 inches. Dual tandem wheels
were assigned a tire pressure of 189 psi, with each wheel load of 44,000 lbs. applied over
a tire contact radius area of 8.62 inches41.42 The principle of superposition was utilized to
determine pavement responses corresponding to the tandem gear configuration.

-
145
Figure 5.4: Tridem Gear Configuration (Boeing 777).
Analysis for Boeing 777 Aircraft
KenSlabs analysis confirmed a linear relationship between stress level and rigid
pavement thickness subjected to the Boeing 777 aircraft footprint for edge loading for a
maximum slab base tensile stress of 403 psi (Table 5.3). When graphed (Figure 5.5),
yielded a design thickness to stress level trend line equation of y= 16.734x + 4.3588.
Specifically, in compliance with FAA’s six-inch minimum pavement thickness, adequate
deflection control (< 0.05 inches) was maintained. Additionally, the design life
thickness/minimum deflection L-D coefficients were defined (Figure 5.5) as 16.7 inches
and 4.4 inches respectively (T = 16.734(tp/ Sc) + 4.3588) for the Boeing 777 aircraft.
This equation also allows determination of airfield pavement thickness as afunction of
modulus of rupture value by fiber case, which is the current methodology used by most
114 inches
55 inches
Aircraft Footprint (superposition).

-
146
finite element programs or performance model building using laboratory derived fatigue
strength testing results. Therefore, for predicting a 20-year design life for a rigid airfield
pavement (0% fiber) for this aircraft, the equation becomes;
T (concrete) = [16.7 ”(tp/ Sc) +4.4”] [ f max/ fv max)]½ (5.9)
for tp/ Sc < 0.7 stress levels [stress ratio <0.50]
Figure 5.5: Boeing 777 Aircraft Design Thickness Graph.
Boeing 777 Aircraft (Limit Deflection; D-Constant)
y = 16.734x + 4.3588
0
5
10
15
20
0 0.2 0.4 0.6 0.8
Stress Level
Pav
emen
t T
hic
knes
s (i
nch
es)
Tc min. = 6 inches for deflection control

-
147
Table 5.3: KenSlabs Edge Stress Results; Boeing 777 Aircraft.
Stress Level
(σmax/MOR)
Contact Stress(σmax)
Tensile stress at failure(σ)
Modulus of Rupture(0% fiber
Concrete)
KenSlab ComputedDesign Thickness
0.69 608 psi 403 psi 868 psi Tc= 15.75 inches0.59 512 psi 403 psi 868 psi Tc= 14.29 inches0.49 425 psi 402 psi 868 psi Tc= 12.81 inches0.39 338 psi 402 psi 868 psi Tc= 11.25 inches0.29 252 psi 402 psi 868 psi Tc= 9.25 inches
Pavement Thickness in Function of the Static FRC Flexural Strength
This equation allows determination of airfield pavement thickness as a function of
static flexural strength (Sc). The equation for the Boeing 777 Aircraft simply becomes;
T (concrete) = [16.7”(tp/ Sc) +4.4”];for plain (0% fiber) concrete (inches). (5.10)
And for fiber reinforced concrete;
T (concrete) = [16.7”(tp/ Sc-fiber) +4.4”]; (5.11)Sc- fiber = fiber volume (0.1%, 0.2%, 0.3%, 0.4%) MOR (psi).
As example, using ASTM C-78 laboratory testing results the static flexural
strength of 0%, 0.1%, 0.2%, 0.3%, 0.4% fiber reinforced concrete in 4”X4”X14”
concrete specimen beams was established as 868 psi, 970 psi, 981 psi, 1,017 psi and 980
psi respectively. Based on KenSlabs analysis, airfield pavement thickness for edge
loading of a Boeing 777 aircraft for 2,000,000 passes is as follows:

-
148
T (plain concrete) = [16.7”(182 psi/ 868 psi) +4.4”] = 7.9 inches(5.12)
T (0.1% fiber concrete) = [16.7”(182 psi/ 970 psi) +4.4”] = 7.5 inches(5.13)
T (0.2% fiber concrete) = [16.7”(182 psi/ 981psi) +4.4”] = 7.5 inches (5.14)
T (0.3% fiber concrete) = [16.7”(182 psi/ 1,017 psi) +4.4”] = 7.4 inches(5.15)
T (0.4% fiber concrete) = [16.7”(182 psi/ 980 psi) +4.4”] = 7.5 inches(5.16)
Other laboratory testing results for static flexural strength of 0%, 0.1%, 0.2%, 0.3%,
0.4% fiber reinforced concrete in 6”X6”X21” concrete specimen beams was established
as 725 psi, 692 psi, 731 psi, 757 psi and 728 psi respectively. In this case, airfield
pavement thickness for the Boeing 777 aircraft would be.
T (plain concrete) = [16.7”(182 psi/ 725 psi) +4.4”] = 8.6 inches (5.17)
T (0.1% fiber concrete) = [16.7”(182 psi/ 692 psi) +4.4”] = 8.8 inches(5.18)
T (0.2% fiber concrete) = [16.7”(182 psi/ 731psi) +4.4”] = 8.6 inches (5.19)
T (0.3% fiber concrete) = [16.7”(182 psi/ 757 psi) +4.4”] = 8.4 inches (5.20)
T (0.4% fiber concrete) = [16.7”(182 psi/ 728 psi) +4.4”] = 8.6 inches(5.21)
Analysis has shown up to a ½ inch reduction in airfield pavement thickness by
use of 0.3% polypropylene fiber as compared to plain (0%) concrete (Equation 5.15). In
construction of a 10,000 foot- 300-foot wide runway, this equates to a reduction in 4,630
cubic yards of concrete for a 20-year design life rigid pavement for this aircraft. In terms
of present economics, $ 694,444 savings in construction costs using a $150/ Cubic Yard
(CY) unit cost.

-
149
Pavement Thickness in Function of FRC Fatigue Strength (fv max)
As example, repetitive load testing established the fatigue strength of 0%, 0.1%,
0.2%, 0.3%, 0.4% fiber reinforced concrete in 4”X4”X14” concrete specimen beams as
521 psi, 570 psi, 525 psi, 567 psi and 513 psi respectively at 2,000,000 cycles. Based on
the KenSlabs analysis, airfield pavement thickness for edge loading of a Boeing 777
aircraft for 2,000,000 passes is as follows:
T (plain concrete) = [16.7 ”(182 psi/ 868 psi) + 4.4”][521/ 521psi)] ½ = 7.9” (5.22)
T (0.1% fiber conc.) =[16.7 ”(182 psi/ 868 psi) + 4.4”] [521/ 570psi)] ½ = 7.5”(5.23)
T (0.2% fiber conc.) = [16.7 ”(182 psi/ 868 psi) +4.4”] [521/ 525psi)] ½ = 7.9” (5.24)
T (0.3% fiber conc.) = [16.7 ”(182 psi/ 868 psi) + 4.4”] [521/ 567psi)] ½ = 7.6”(5.25)
T (0.4% fiber conc.) = [16.7 ”(182 psi/ 868 psi) + 4.4”] [521/ 513psi)] ½ = 8.0”(5.26)
Dynamic loading has shown a 0.4-inch reduction in airfield pavement thickness
for the 0.1% polypropylene FRC and a 0.3-inch reduction at 0.3% fiber content in
concrete. Over a 10,000 foot- 300-foot wide runway alone, reductions of 3,241 cubic
yards of concrete for construction of a 20-year design life rigid pavement for this aircraft.
In terms of present economics, $ 486,111 savings in construction costs.

-
150
Analysis for Boeing 747 Aircraft
Kenslabs modeling defined the relationship between stress level and rigid
pavement thickness subjected to the Boeing 747 aircraft footprint for edge loading (Table
5. 4). The L-D coefficients were defined (Figure 5.6) as 16.5 inches and 4.5 inches
respectively (T = 16.45(tp/ Sc) + 4.5434) with FAA’s six inch minimum pavement
thickness deflection control (< 0.05 inches) being maintained. Therefore, for predicting a
20-year design life for a rigid airfield pavement (0% fiber) for this aircraft, the equation
is:
T (concrete) = [16.5”(tp/ Sc) +4.5”] [ f max/ fv max]½ (5.27)
Figure 5.6: Boeing 747 Design Thickness Graph.
747 Aircraft D-Constant
y = 16.45x + 4.5434
0
5
10
15
20
0 0.2 0.4 0.6 0.8
Stress Level (S)
Pav
emen
t T
hic
knes
s (T
c-in
ches
)

-
151
Table 5.4: KenSlabs Edge Stress Results; Boeing 747 Aircraft.
Stress Level(σmax/MOR)
Contact Stress
(σmax)
Tensile stress at failure(σ)
Modulus of Rupture
(0% fiber Concrete)
KenSlab Computed Design Thickness
0.69 599 psi 404 psi 868 psi Tc =15.65 inch.0.59 512 psi 403 psi 868 psi Tc =14.32 inch.0.49 425 psi 402 psi 868 psi Tc =12.84 inch.0.39 338 psi 403 psi 868 psi Tc =11.25 inch.0.29 252 psi 403 psi 868 psi Tc = 8.96 inch.
Pavement Thickness in Function of the Static FRC Flexural Strength
T (plain concrete) = [16.5”(189 psi/ 868 psi) +4.5”] = 8.1 inches(5.28)
T (0.1% fiber concrete) = [16.5”(189 psi/ 970 psi) +4.5”] = 7.7 inches(5.29)
T (0.2% fiber concrete) = [16.5”(189 psi/ 981psi) + 4.5”] = 7.7 inches(5.30)
T (0.3% fiber concrete) = [16.5”(189 psi/ 1,017 psi) + 4.5”] = 7.6 inches(5.31)
T (0.4% fiber concrete) = [16.5”(189 psi/ 980 psi) + 4.5”] = 7.7 inches(5.32)
Analysis has shown a ½ inch reduction in airfield pavement thickness by use of
0.3% polypropylene fiber for Boeing 747 operations. For a 10,000 foot- 300-foot wide
runway alone, this equates to a reduction of 4,630 cubic yards of concrete. In terms of
present economics, $ 694,444 savings in construction costs. Similar results as the Boeing
777 aircraft analysis, a 0.4-inch decrease in pavement thickness across all fiber concrete
samples. But greater design thickness due to the different gear configuration and slight
difference in the T ~ σmax/ Sc relationship.

-
152
Pavement Thickness in Function of Fatigue Strength (fv max)
T (plain concrete) = [16.5”(189 psi/ 868 psi) + 4.5”] [521/ 521 psi] ½ = 8.1” (5.33)
T (0.1% fiber conc.) = [16.5”(189 psi/ 868 psi) + 4.5”] [521/ 570 psi] ½ = 7.7”(5.34)
T (0.2% fiber conc.) = [16.5”(189 psi/ 868 psi) + 4.5”] [521/ 525 psi] ½ = 8.1” (5.35)
T (0.3% fiber conc.) = [16.5”(189 psi/ 868 psi) + 4.5”] [521/ 567 psi] ½ = 7.7”(5.36)
T (0.4% fiber conc.) = [16.5”(189 psi/ 868 psi) + 4.5”] [521/ 513 psi] ½ = 8.2”(5.37)
KenSlabs has shown a 0.4 inch reduction in airfield pavement thickness by use of
0.1% and 0.3% polypropylene fiber concrete under dynamic loading. Constructing a
10,000 foot- 300-foot wide runway alone, this equates to a reduction of 3,704 cubic yards
of concrete, a $ 555,600 cost savings.
FRC Predictive Pavement Thickness Equations; Military Aircraft F-16
Analysis for F-16 Aircraft.
The Lockheed Martin F-16 military aircraft is a unique, single wheel, high tire
pressure-landing gear system arranged in a triangular (tricycle) gear configuration (Figure
5. 7). Dimensionally, the aircraft is only 49’ 5” long and has a wingspan of 32’. The
spacing between each wing wheel is less than ten feet (120 inches). Gross aircraft weight
can be as much as 42,300-lbs (Block 25 model), with each wing wheel load equal to
21,150 lbs. on takeoff, with a tire pressure of 200 psi and a tire contact radius area of only

-
153
5.8 inches43. In terms of aircraft passes, 100,000 annual departures were considered.
KenSlabs pavement responses are for a single wheel, however the principle of
superposition was utilized to determine pavement responses corresponding to the F-16
gear configuration.
Figure 5.7: The F-16 Fighting Falcon.

-
154
Kenslabs analysis confirmed a linear relationship between stress level and rigid
pavement thickness subjected to the Lockheed-Martin F-16 aircraft footprint for edge
loading (Table 5.5). Specifically, in compliance with FAA’s six inch minimum pavement
thickness adequate deflection control (< 0.05 inches) was maintained. Additionally, the
L-D coefficient were defined as 13.6 inches and 4.6 inches respectively (T = 13.576 (tp/
Sc) + 4.6041) for the F-16 aircraft (Figure 5.8). Therefore for predicting a 20-year design
life for a rigid airfield pavement (0% fiber) for this aircraft, the equation becomes:
T (concrete) = [13.6”(tp/ Sc) + 4.6”] [(f max/ fv max)] ½ (5.38)
Figure 5.8: F-16 Aircraft Design Thickness Graph.
F 16 Aircraft D-Constant
y = 13.576x + 4.6041
0
5
10
15
20
0 0.5 1 1.5
Stress Level (S)
Pav
emen
t T
hic
knes
s (T
c-in
ches
)
Tc=12"Sr= .45Nf= Unlimited
Tc=10"Sr= .59Nf= 27,000
Tc=11.7"Sr= .48Nf= 2000,000

-
155
Table 5.5: KenSlabs Edge Stress Results; F-16 Aircraft.
Stress Level(σmax/MOR)
Contact Stress
(σmax)
Tensile stress at failure(σ)
Modulus of Rupture
(0% fiber Concrete)
KenSlab Computed Design Thickness
0.69 599 psi 416 psi 868 psi Tc =14.35 inch.0.59 512 psi 415 psi 868 psi Tc =13.10 inch.0.49 425 psi 413 psi 868 psi Tc =11.68 inch.0.39 338 psi 417 psi 868 psi Tc = 9.98 inch.0.29 252 psi 414 psi 868 psi Tc = 7.72 inch.
Pavement Thickness in Function of Static FRC Flexural Strength
Based on Kenslabs, airfield pavement thickness for edge loading of an F-16
military aircraft for a minimum of 2,000,000 passes is as follows:
T (concrete) = [13.6”(tp/ Sc) + 4.6”] (5.39)Sc= maximum static flexural strength 0% fiber (plain) concrete. tp = Aircraft tire contact stress (psi)
T (concrete) = [13.6”(tp/ Sc-fiber) + 4.6”] (5.40)Sc-fiber = fiber volume (0.1%, 0.2%, 0.3%, 0.4%) MOR ( psi).
T (plain concrete) = [13.6”(200 psi/ 868 psi) + 4.6”] = 7.7 inches(5.41)
T (0.1% fiber concrete) = [13.6”(200 psi/ 970 psi) + 4.6”] = 7.4 inches(5.42)
T (0.2% fiber concrete) = [13.6”(200 psi/ 981psi) + 4.6”] = 7.4 inches (5.43)
T (0.3% fiber concrete) = [13.6”(200 psi/ 1,017 psi) + 4.6”] = 7.3 inches(5.44)
T (0.4% fiber concrete) = [13.6”(200 psi/ 980 psi) + 4.6”] = 7.4 inches(5.45)

-
156
Analysis has shown a 3/8-inch reduction in airfield pavement thickness by use of
0.3% polypropylene fiber under static flexural loading. Over a 10,000 foot- 300-foot
wide runway alone, this equates to a reduction of 3,704 cubic yards of concrete in
construction of a 20-year design life rigid pavement for this aircraft. In terms of present
economics, $ 555,556 savings in construction costs. As compared to the Boeing 777/747
aircraft analysis, a 0.3 inch pavement thickness reduction across all fiber concrete
samples due to the increased tire pressure but smaller contact area and a different aircraft
gear geometry resulting in the different T ~ σmax/ Sc linear relationship.
Pavement Thickness in Function of FRC Fatigue Strength (fv max)
As example, laboratory testing (Chapter 4) of concrete specimen beams
established the flexural fatigue strength of 0%, 0.1%, 0.2%, 0.3%, 0.4% fiber reinforced
concrete at 2,000,000 load cycles as 521 psi, 570 psi, 525 psi, 567 psi and 513 psi
respectively. Based on KenSlabs modeling, airfield pavement thickness for edge loading
of a F-16 fighter aircraft for 2,000,000 passes is as follows.
T (plain conc) = [13.6”(200psi/ 868 psi) + 4.6”][521/ 521 psi)] ½= 7.7” (5.46)
T (0.1% fiber conc.) =[13.6”(200 psi/ 868 psi) + 4.6”] [521/ 570 psi)] ½= 7.4”(5.47)
T (0.2% fiber conc.) = [13.6”(200 psi/ 868 psi) + 4.6”] [521/ 525 psi)] ½= 7.7”(5.48)
T (0.3% fiber conc.) = [13.6”(200psi/ 868 psi) + 4.6”] [521/ 567 psi)] ½= 7.4”(5.49)
T (0.4% fiber conc.) = [13.6”(200 psi/ 868 psi) + 4.6”] [521/ 513 psi)] ½= 7.8”(5.50)

-
157
KenSlabs has shown a 0.3-inch reduction in airfield pavement thickness by use of
0.1% or 0.3% polypropylene fiber. Over a 10,000 foot- 300-foot wide runway, this
equates to a reduction of 2,778 cubic yards of concrete in construction of a 20-year
design life rigid pavement for this aircraft. Twice that figure, if you considered follow-on
taxiway and apron construction. In terms of present economics, $ 416,667
savings in construction costs considering a $150/CY unit cost.
FRC Predictive Pavement Thickness Equations; C141 Starlifter and C-17
Globemaster Military Airlift Aircraft
Kenslabs modeling confirmed a linear relationship between stress level and rigid
pavement thickness subjected to the Lockheed-Martin C141 and C-17 aircraft footprint
for edge loading. FAA’s six inch minimum pavement thickness, adequate deflection
control (< 0.05 inches) was maintained (Table 5.6). The L-D coefficients were defined as
17 inches and 5 inches respectively (T = 17 (tp/ Sc) + 5) for the C141 aircraft (Figure
5.11). The L-D coefficients were defined as 17.73 inches and 5.9 inches respectively (T =
17.7 (tp/ Sc) + 5.9 ) for the C-17 aircraft (Figure 5.12). Therefore for predicting a 20-year
design life for a rigid airfield pavement (0% fiber) for these aircraft, the equation
becomes:
C-141 AircraftT (concrete) = [17”(tp/ Sc) + 5”][f max/ fv max)] ½ (5.51)
C-17AircraftT (concrete) = [17.7”(tp/ Sc) +5.9”] [f max/ fv max)] ½ (5.52)

-
158
The Lockheed Martin C141 Starlifter (Figure 5.9) is the “workhorse” of the Air
Mobility Command. The Starlifter fulfills the vast spectrum of airlift requirements
through its ability to airlift combat forces over long distances, deliver those forces and
their equipment either by air, land or airdrop, resupply forces and transport the sick and
wounded from the hostile area to advanced medical facilities. Deliveries can be made
through the side paratroop doors or via the rear-loading ramp. The C-141 can also carry
medical patients and supplies, and several have been outfitted to transport ballistic
missiles. Dimensionally, it’s wingspan is 48.74 meters (159 feet, 11 inches), length:
51.29 meters (168 feet, 4 inches), 11.96 meters (39 feet, 3 inches) in height with a
maximum weight of 155,582 kilograms (343,100 pounds). Gear configuration is tandem,
dual wheels with tandem spacing of 48 inches and 32.5 inch spacing between dual tires.
Tire pressure is 190 psi44.
Figure 5.9: Lockheed Martin C141 Starlifter.

-
159
The C-17 Globemaster III (Figure 5.10) is the newest, most flexible cargo aircraft
to enter the military airlift force. The C-17 is capable of rapid strategic delivery of troops
and all types of cargo to main operating bases or directly to forward bases in the
deployment area. The aircraft is also capable of performing tactical airlift and airdrop
missions when required45. The C-17 is a high-wing, four-engine, T-tailed cargo aircraft
with a rear-loading ramp. It is 174 feet in length, has a height of 55.08 feet and a
wingspan of 169.75 feet. Maximum takeoff gross weight is 585,000 pounds, maximum
payload is 169,000 pounds. With a payload of 160,000 pounds, the C-17 can take off
from a 7,600-foot airfield, fly 2,400 nautical miles and land on a small, austere airfield in
3,000 feet or less. Gear configuration is tandem, dual wheels with tandem spacing of 97
inches and 41.5 inch spacing between dual tires. Tire pressure is 138 psi.
Figure 5.10: Boeing C-17 Globemaster III.

-
160
Figure 5.11: KenSlabs Edge Stress Results; C-141 Aircraft.
Figure 5.12: KenSlabs Edge Stress Results; C-17 Aircraft.
Table 5.6: KenSlabs Edge Stress Results; C-141/C-17 Aircraft.
Contact Stress
(σmax)
Tensile stress at
failure(σ)
Modulus of Rupture
(0% fiber Concrete)
KenSlab (C-141) Computed Design
Thickness
KenSlab (C-17) Computed Design
Thickness599 psi 404 psi 868 psi Tc =16.57 inch. Tc =17.90 inch.512 psi 405 psi 868 psi Tc =15.15 inch. Tc =16.45 inch.425 psi 403 psi 868 psi Tc =13.65 inch. Tc =14.83 inch.338 psi 401 psi 868 psi Tc = 11.87 inch. Tc = 12.98 inch.252 psi 399 psi 868 psi Tc = 9.71 inch. Tc = 10.77 inch.
C 141 Aircraft D-Constanty = 17.049x + 5.0399
0
5
10
15
20
0 0.1 0.2 0.3 0.4 0.5 0.6 0.7 0.8
Stress Level (S)
Pav
emen
t T
hic
knes
s (T
c)
C 17 Aircraft D-Constant
y = 17.725x + 5.8983
0
5
10
15
20
0 0.1 0.2 0.3 0.4 0.5 0.6 0.7 0.8
Stress Level (S)
Pav
emen
t T
hic
knes
s (T
c)
Tc=13"Sr= .46Nf= 2000,000
Tc=13.3"Sr= .44Nf= Unlimited
Tc=10"Sr= .68Nf= 1,000

-
161
Pavement Thickness in Function of the Static FRC Flexural Strength; C-141 Aircraft
T (concrete) = [17 ”(tp/ Sc) +5 ”] for 0% fiber (plain) concrete. (5.53)
T (concrete) = [17 ”(tp/ Sc-fiber) +5 ”] (5.54) Sc-fiber = fiber volume (0.1%, 0.2%, 0.3%, 0.4%) MOR (psi).
As example, ASTM C-78 laboratory testing established the static flexural strength
of 0%, 0.1%, 0.2%, 0.3%, 0.4% fiber reinforced concrete in 6”X 6”X21” concrete beams
as 725 psi, 692 psi, 731 psi, 757 psi and 728 psi respectively. Based on KenSlabs
analysis, airfield pavement thickness for edge loading of a C141 military aircraft for
2,000,000 passes is as follows:
T (plain concrete) = [17 ”(190 psi/ 725 psi) + 5 ”] = 9.5 inches (5.55)
T (0.1% fiber concrete) = [17 ”(190 psi/ 692 psi) + 5”] = 9.7 inches (5.56)
T (0.2% fiber concrete) = [17 ”(190 psi/ 731 psi) + 5”] = 9.4 inches (5.57)
T (0.3% fiber concrete) = [17 ”(190 psi/ 757 psi) + 5”] = 9.25 inches (5.58)
T (0.4% fiber concrete) = [17 ”(190 psi/ 728 psi) + 5”] = 9.5 inches (5.59)
Using ASTM C-78 laboratory testing values of 868 psi, 970 psi, 981 psi, 1,017 psi
and 980 psi for static flexural strength of 0%, 0.1%, 0.2%, 0.3%, 0.4% fiber reinforced
concrete in 4”X 4”X14” concrete beams respectively, airfield pavement thickness for a
C141 military aircraft is;

-
162
T (plain concrete) = [17 ”(190 psi/ 868 psi) + 5 ”] = 8.7 inches (5.60)
T (0.1% fiber concrete) = [17 ”(190 psi/ 970 psi) + 5”] = 8.3 inches (5.61)
T (0.2% fiber concrete) = [17 ”(190 psi/ 981 psi) + 5”] = 8.3 inches (5.62)
T (0.3% fiber concrete) = [17 ”(190 psi/ 1,017 psi) + 5”] = 8.2 inches (5.63)
T (0.4% fiber concrete) = [17 ”(190 psi/ 980 psi) + 5”] = 8.3 inches (5.64)
Calculations have shown a 1/4-inch reduction in airfield pavement thickness by use of
0.3% polypropylene fiber using different laboratory testing data for flexural strength
(Equation 5.58). This equates to a reduction of 2,315 cubic yards of concrete in
construction of rigid airfield pavement for this aircraft. In terms of present economics, $
347,222 savings in construction costs.
Determination of Pavement Thickness in Function of FRC Fatigue Strength; C-141
Aircraft
As example, over 70, 4-inch x 4-inch x 14-inch concrete beam specimens were tested
at the University of Maryland for fatigue strength. Fatigue strength at the endurance limit
increased when fibrillated polypropylene was added to concrete. The average fatigue
strength was 521 psi for plain concrete, 570 psi for 0.1% FRC and 525 psi, 567 psi and
513 psi for 0.2%, 0.3% and 0.4% FRC respectively. Analysis has shown a 0.4 inch
reduction in airfield pavement thickness by use of 0.1% or 0.3% polypropylene fiber.
Over a 10,000 foot- 300-foot wide runway alone, this equates to a reduction of 3,704,
cubic yards of concrete in construction of a 20-year design life rigid pavement for this
aircraft. In terms of present economics, $ 555,555 savings in construction costs.

-
163
T (plain concrete) = [17 ”(190 psi/ 868 psi) + 5”] [521/ 521psi] ½ = 8.7" (5.65)
T (0.1% fiber concrete) = [17 ”(190 psi/ 868 psi) + 5”] [521/ 570 psi] ½ =8.3" (5.66)
T (0.2% fiber concrete) = [17 ”(190 psi/ 868psi) + 5”] [521/ 525 psi] ½ = 8.7"(5.67)
T (0.3% fiber concrete) =[17 ”(190 psi/ 868 psi) + 5”] [521/ 567 psi] ½ = 8.3" (5.68)
T (0.4% fiber concrete = [17 ”(190 psi/ 868 psi) + 5”] [521/ 513 psi] ½ = 8.8" (5.69)
Tabulation and Use of FRC Pavement Reduction Values in Thickness Design
In Chapter 6, a case study and calculations are presented deriving pavement
thickness reduction values for fiber reinforced concrete under C-17A aircraft loading
using the methodology presented in this chapter. Based on these thickness calculations,
FRC Composite Pavement Thickness Reduction Values (PRV) are summarized in Table
5.8. The pavement thickness reduction values quantify the increase in concrete pavement
strength, due to fiber reinforcement, as it pertains to specific aircraft.
Table 5.8: Design Thickness Reduction Values (C-17A Aircraft ).
FRC CompositeC-17 Aircraft
Pavement Design Thickness; Flexural Strength
Pavement Design Thickness; Fatigue Strength
Design Thickness Reduction Value as Compared to plain (0%) fiber concrete
Plain(0%) fiber Concrete
8.7 inches 8.7 inches ------------------
0.1% Fiber Concrete8. 4 inches 8.3 inches 3/8 inch
0.2% Fiber Concrete8. 4 inches 8.7 inches 1/8 inch
0.3% Fiber Concrete8.3 inches 8.4 inches 3/8 inch
0.4% Fiber Concrete8. 4 inches 8.8 inches 1/8 inch

-
164
Conventional airfield design thickness results from LEDFAA multi-aircraft
analysis meeting FAA criteria are presented in Table 5.9. KenSlabs and LEDFAA
pavement design thickness results and PRV's are shown in Table 5.10. Table 5.10 could
be used to reduce an airfield pavement design thickness based on the fiber content and
the known properties of a given fiber concrete composite mix. As example, to meet
FAA’s 20 year design thickness criteria for a Boeing 777, Boeing 747, C-141, C-17A
airfield traffic mix, when a 0.3% FRC is used, the airfield would have to be 19.22”-
0.4”(PRV) or 18.82” thick as compared to 19.22” for plain concrete. To meet the
Military's requirement for C-141 operations, the airfield would have to be 8.7" -
0.4"(PRV) or 8.3" thick. If the design mix with the 725 psi MOR were used, the airfield
thickness would have to be 9.5" -0.3"(PRV) or 9.2" thick for class C traffic areas. TM 5-
825-3/AFM 88-6 for Fibrous Concrete Pavement Design requires FRC airfield design
thickness for Traffic Area A and B surfaces to be 10.5 inches in order to maintain an
allowable deflection (0.05 inches) and design life for a heavy lift C-141military aircraft6.
Therefore, the airfield design thickness for the C-141 aircraft would be 10.5 "- 0.4"
(PRV) or 10.1".

-
165
Table 5.9: LEDFAA Multi -Aircraft Design Thickness Results.
Traffic Annual Departures
Modulus ofElasticity
PCC Design Thickness
Poisson’s ratio
Subbase Thickness & ESubgrade E
Boeing 777Boeing 747
50,00050,000
4,000,000 psi 19.85 inches 0.15 8 inches500,000 psi4,500 psi
Boeing 777Boeing 747C-141
33,00033,00033,000
4,000,000 psi 19.44 inches 0.15 8 inches500,000 psi4,500 psi
Boeing 777Boeing 747C-141C-17A
25,00025,00025,00025,000
4,000,000 psi 19.22 inches 0.15 8 inches500,000 psi4,500 psi
Boeing 777Boeing 747C-141C-17A
25,00025,00025,00025,000
4,000,000 psi 17.80 inches 0.15 16 inches500,000 psi4,500 psi
Boeing 777Boeing 747C-141C-17A
25,00025,00025,00025,000
4,000,000 psi 14.26 inches 0.15 16 inches500,000 psi13,500 psi

-
166
Table 5.10: Single/ Multi -Aircraft FRC Design Thickness Results.
Traffic Annual Departures
Military Standard(KenSlabs) Design
LED-FAA Design Thickness
Fiber Content/thickness reduction values.
Boeing 777Boeing 747
50,00050,000
19.85 inches(MOR;800psi)
0.1%/0.4”reduction0.2%/0.2” reduction0.3%/0.5” reduction0.4%/0.2” reduction
Boeing 777Boeing 747C-141
33,00033,00033,000
19.44 inches(MOR;800psi)
0.1%/0.3”reduction0.2%/0.2” reduction0.3%/0.4” reduction0.4%/0.2” reduction
Boeing 777Boeing 747C-141C-17A
25,00025,00025,00025,000
19.22 inches(MOR;800psi)
0.1%/0.3”reduction0.2%/0.2” reduction0.3%/0.4” reduction0.4%/0.2” reduction
Boeing 777 100,000 8.3 inchesthickness(MOR;868 psi)
0.1%/0.4”reduction0.2%/0.2” reduction0.3%/0.4” reduction0.4%/0.2” reduction
Boeing 747 100,000 8.1 inchesthickness(MOR;868 psi)
0.1%/0.4”reduction0.2%/0.2” reduction0.3%/0.5” reduction0.4%/0.2” reduction
C-141 100,000 8.7 inchesthickness(MOR;868 psi)
0.1%/0.4” reduction0.2%/0.2” reduction0.3%/0.4” reduction0.4%/0.2” reduction
C-141 100,000 9.5 inchesthickness(MOR;725 psi)
0.1%/no reduction0.2%/0.1” reduction0.3%/0.3” reduction0.4%/no reduction
C-17A 100,000 8.7 inchesthickness(MOR;868 psi)
0.1%/0.4” reduction0.2%/0.2” reduction0.3%/0.4” reduction0.4%/0.2” reduction
F-16 100,000 7.7 inchesthickness(MOR;868 psi)
0.1%/0.3”reduction0.2%/0.2” reduction0.3%/0.3” reduction0.4%/0.1” reduction

-
167
FRC THERMAL STRESS AND DEFLECTION
FRC Modeling with Respect to Rigid Slab Temperature Curling
Stresses are induced in large dimensional slabs by the temperature differential
between the top and bottom of the slab due to climate. Typical temperature gradient
changes can be as much as 3.5º F per inch of slab thickness. During the day these stresses
are in addition to the aircraft load as the slab curls down due to the longer dimension of
the warmed surface as compared to the base of the slab. There is debate whether these
stresses should be added to the aircraft load stresses during damage analysis, typically
these stresses are evaluated separately 2. To evaluate the impact of FRC pavements to
curling stresses, a four-slab arrangement with doweled joints, with dowels placed every
12 inches (on centers) was considered (Figure 5.13). The thermal coefficient of expansion
(α), as recommend by PCA, that was used was 0.0005”, and a temperature difference of
20˚F was assumed in each KenSlab run between the top and bottom of the slab. The same
foundation conditions were used as in the damage analysis model (Figure 5.1). Based on
the calculated pavement thickness for fatigue cracking at 2,000,000 cycles for each fiber
case, the unit weight and Modulus of Elasticity of 0%, 0.1%, 0.2%, 0.3% and 0.4% fiber
concrete as derived from compressive strength tests46, the curling stresses were
determined (Table 5.11). Quantifiably, at a temperature differential of 20˚F, a reduction
of 17.4 psi of temperature related stresses at 0.3% fiber concrete as compared to plain
(0%fiber) concretes.

-
168
-20̊ F
Figure 5.13: Curling Stress.
Table 5.11: Curling Stresses; 25’X 25’ Slab (∆∆∆∆ 20̊ F).
Fiber Case
Modulus E (psi)
Unit wt. (pcf)
Fatigue Design Thickness
Curling Stress (psi)
Plain 4,177,328 142.82 9.0 inches 182.250.1% 4,663,892 147.82 8.7 inches 199.470.2% 4,180,341 143.82 8.6 inches 179.280.3% 3,836,315 143.82 8.5 inches 164.850.4% 3,888,886 141.82 8.6 inches 167.58
25 ft.
25 ft.
1.125” dowels12” O.C.
Evaluate Aircraft Corner Loading( KenSlab node 16)deflection.
Slab 2
Slab 1
Slab 4
Slab 3
Slab curling (Day)

-
169
Temperature curling stresses were also calculated using KenSlabs based on a
25’X12’ single slab analysis. Material properties from laboratory testing and temperature
curling stress results are tabulated below (Tables 5.12 to 5.14). The thermal coefficient of
expansion (α) used was 0.0005”, and three temperature differentials (10˚F, 20˚F, 30˚F)
were considered in each KenSlabs run between the top and bottom of the slab. Same
foundation conditions were used as in the damage analysis model (Figure 5.1). Analysis
showed that there is a decrease in temperature curling stresses with increasing fiber
volume, a function of decreasing Modulus value and fiber related slab thickness, which
reduces total slab stresses (loading and thermal) during daylight aircraft operations.
Quantifiably, at a temperature differential of 20˚F, a reduction of 26.3 psi was observed
at 0.3 % fiber concrete (Table 5.13) to a reduction of 39.4 psi of curling stresses between
plain and 0.3 % fiber concrete (Table 5.14) at a temperature differential of 30˚F.
Table 5.12: Thermal Stress Values on 25’X 12’ Slab (∆∆∆∆ 10̊ F).
Fiber Case
Modulus E(psi)
Unit wt. (pcf)
Fatigue Design Thickness
Curling Stress (psi)Slab edge
Curling Stress (psi)Slab interior(center)
Plain 4,158,817 143.8 9 inches 113.5 psi 125.1 psi0.1% fiber
4,482,465 144.8 8 inches 120.7 psi 135.5 psi
0.2% fiber
4,179,904 143.8 8 inches 112.1 psi 126.4 psi
0.3% fiber
3,735,295 141.8 8.4 inches 100.4 psi 112.9psi
0.4% fiber
3,830,317 142.8 8.8 inches 103.8 psi 115.5 psi

-
170
Table 5.13: Thermal Stress Values; 25’X 12’ slab (∆∆∆∆ 20̊ F).
Fiber Case
Modulus E(psi)
Unit wt. (pcf)
Fatigue Design Thickness
Curling Stress (psi)Slab edge
Curling Stress (psi)Slab interior(center)
Plain 4,158,817 143.8 9 inches 227 psi 250.1 psi0.1% fiber
4,482,465 144.8 8 inches 241.4 psi 270.9 psi
0.2% fiber
4,179,904 143.8 8 inches 224.2 psi 252.9 psi
0.3% fiber
3,735,295 141.8 8.4 inches 200.7 psi 225.9 psi
0.4% fiber
3,830,317 142.8 8.8 inches 207.6 psi 231.1 psi
Table 5.14: Thermal Stress Values; 25’X 12’ slab (∆∆∆∆ 30̊ F).
Fiber Case
Modulus E(psi)
Unit wt. (pcf)
Fatigue Design Thickness
Curling Stress (psi)Slab edge
Curling Stress (psi)Slab interior(center)
Plain 4,158,817 143.8 9 inches 340.5 psi 375.2 psi0.1% fiber
4,482,465 144.8 8 inches 362 psi 406.4 psi
0.2% fiber
4,179,904 143.8 8 inches 336.3 psi 379.3 psi
0.3% fiber
3,735,295 141.8 8.4 inches 301.1 psi 338.8 psi
0.4% fiber
3,830,317 142.8 8.8 inches 311.4 psi 346.6 psi

-
171
Corner Deflections and Slab Pumping Reduction
Corner deflection in airfield slabs under repetitive loading is always problematic
for aircraft parking aprons due to foundation soils pumping. Pumping being the ejection
of base/subgrade fine-grained soils at slab corners due to the dynamic nature of aircraft
wheel loading and excessive slab deflections. Typically, this results in a void under apron
slab corners due to loss of foundation material, eventually resulting in slab fracture. The
military design deflection criteria (AFM 88-6) for airfields are based on edge loading,
which simulates runway and taxiway travel lane conditions, not corner loading. KenSlabs
corner loading modeling using the most critical aircraft loading condition, the Boeing 777
and Boeing 747 aircraft on a 25 square foot concrete airfield slab yielded the results
shown in Table 5.15. KenSlabs analysis suggests that for these aircraft, apron corner
deflection can be significant, by as much as seven times the allowable edge loading
design deflection. KenSlabs analysis shows that foundation improvement, not slab
thickening is a better approach to reducing deflections, as slab thickening adds to the
deflection problem (Table 5.15). According to Huang, corner deflection is reduced by
50% if there is a threefold increase in subgrade modulus2 and KenSlabs analysis
suggests this (Table 5.16). Since publication of this AFM 88-6 in 1988, significant
advancements in polymer technology and geosynthetics engineering have occurred,
making foundation strength improvement achievable and cost effective. Installation of a
non-woven geotextile separator in the foundation soils and FRC would be a better
approach to eliminating pumping problems rather than the traditional approach of slab
thickening47 .

-
172
Corner Deflection was evaluated on the same four-slab system (Figure 5.13),
using laboratory derived FRC material properties under aircraft load but independent of
temperature curling. Worst case deflection condition was assumed by placing the Boeing
777 and Boeing 747-gear load over the doweled corner at node 16. Material properties,
design thickness and deflection results are shown in Tables 5.15 and 5.16. Corner
deflection decreases with a decrease in pavement thickness and Modulus value (Table
5.15) and an increase in subgrade value (Table 5.16). The inherent nature of fiber
reinforcement to contribute to reduction in the stiffness and thickness required of a
concrete airfield pavement also reduces the stress on the slab foundation and quantifiably
reduces corner deflection and the eventual detrimental effects of pumping.
Table 5.15: FRC Corner Deflections; 25’X 25’ Slab.Fiber Case
Modulus E (psi)
Unit wt. (pcf)
Flexural Design Thickness (inches)
Corner Deflection(inches)
Plain(0%) 4,177,328 142.82 24 0.477Plain(0%) 4,177,328 142.82 17 0.422Plain(0%) 4,177,328 142.82 9.0 0.360.1% 4,663,892 147.82 8.7 0.360.2% 4,180,341 143.82 8.6 0.3570.3% 3,836,315 143.82 8.5 0.3560.4% 3,888,886 141.82 8.6 0.356
Table 5.16: Corner Deflection Subgrade Effect.
Airfield Slab25’X 25’
Modulus E (psi)
Fatigue Design Thickness
Contact Pressure(psi)(aircraft tire)
Subgrade E(psi)
CornerDeflection;inch
Plain(0%) 4,177,328 24 inches 189psi 4,500 0.477Plain(0%) 4,177,328 24 inches 10psi(no load) 4,500 0.322Plain(0%) 4,177,328 24 inches 189psi 6,000 0.363Plain(0%) 4,177,328 24 inches 189psi 9,000 0.249Plain(0%) 4,177,328 9 inches 189psi 4,500 0.36Plain(0%) 4,177,328 9 inches 10psi(no load) 4,500 0.17Plain(0%) 4,177,328 9 inches 189psi 6,000 0.274Plain(0%) 4,177,328 9 inches 189psi 9,000 0.186

-
173
FRACTURE MODELING FOR HEAVED PAVEMENT REDUCTION
Polypropylene fiber possesses material properties that increase concrete’s
ductility and dynamic energy absorption capability, which are performance
characteristics desired by the military in reducing bomb damaged airfield pavement. A
significant concern by the United States Air Force is the time to repair battle damaged
airfields in which current criteria requires repair of three, 50 foot diameter craters within
4 hours36. A significant part of that repair effort is removal of heaved and fractured
pavement around the crater requiring removal and replacements of concrete twice the
crater’s diameter (Figure 5.14). Polypropylene fiber reinforced concrete's (FRC) ability to
absorb energy will reduce the amount of heaved pavement required to be removed,
saving invaluable time to aircraft sortie generation after an attack. Laboratory toughness
testing demonstrated that FRC has four times the energy absorption capability of plain
concrete, a significant characteristic suggesting the amount of heaved pavement needing
to be replaced can be reduced and that reduction is quantifiable.
Figure 5.14: Bomb Damage Repair; Airfield Concrete Runway.
Heaved pavement, twice crater diameter.
Crater

-
174
Predicting the mechanism of blast fractures of concrete has to do with stress wave
theory. In which the magnitude and shape of this rapidly moving wave depends on such
factors as the type of explosive (explosive weight and detonation velocity), blast depth,
relationship of detonation velocity to wave propagation velocity of concrete’s material
properties (unit weight-γ, Modulus of Elasticity-E), bore hole diameter, and the distance
from the hole where the stress measurement is taken. We know wave propagation is
faster in hard rock than soft rock and the majority of the fracturing produced in the rock
is radial from the hole and associated with the propagating stress wave. The fragmenting
process occurs in a relatively short time, five to 10 milliseconds with cracks forming at a
rate of 1,500 to 8,000 feet-per-second48. A considerable amount of laboratory data has
been collected on the material properties of plain and polypropylene fiber reinforced
concrete during laboratory testing (Table 5.17). However, information regarding current
military munition capabilities such as explosive weight, detonation velocity and depth are
classified and varied between munitions. According to AFMAN 10-219, pavement
upheaval continues up to 25 feet beyond the crater lip of a 50-foot diameter crater35 and
that stress wave velocity (Vc) through a given linear-elastic material is a function of that
materials properties (E, γ) and mathematically expressed as Vc =√ E plain concrete/ γ
plain concrete/gravity (g) where γ / g = the material’s density (ρ).37 Air Force Pamphlet
10-219 states the diameter of radial heaved pavement fracturing from a bomb-damaged
airfield is twice the 50-foot apparent crater diameter (Figure 5.16). The importance of this
relationship is not to estimate crater diameter from a given explosive. But to understand
the amount of heaved pavement that needs to be removed as a result of the cratering.
Normalized for fiber reinforcement material properties for materials with similar

-
175
Poisson's ratios 49 and considering the relationship of fracture diameter (RD) to crater
diameter (D) the equation could be expressed as:
RD = 2D [√ E fiber concrete/ γ fiber concrete/(g)] (5.70) [√ E plain concrete/ γ plain concrete/(g)]
In terms of Kinetic energy, any explosive energy (Q) as it travels through a
material (mass-m) at ever-greater distance (d) from its source will result in a loss of stress
wave (a) intensity. After the initial detonation pressure, the amplitude of the stress wave
will decay as it travels through the concrete and encounters more material mass. This
decrease in energy density with distance from the source is known as geometrical
damping37. According to the Dupont Blaster's Handbook, pressure-time recordings made
at different distances from blast centers during quarry operations of granite indicate an
average rate of decay of the compressive stress wave as 4,533 psi – 383.33psi(L feet)
from the explosive borehole48. Granite is a suitable material to compare to concrete in
this regard, due to their similar Poisson's ratios4.
We have a rational way of predicting the amount of energy a given FRC
composite must be able to absorb in order to resist heaving. When a material is tested in
toughness, a force is applied in order to deform the specimen. Force times distance is
work. Dividing the force by the cross-section of the specimen provides stress, divide the
deformation by the length of the specimen you have the strain. The resulting force-
displacement diagram is now a stress-strain diagram and the area under the stress-strain

-
176
diagram equals the work per unit volume of material required to deform or fracture the
material (see Figure 5.15)50. This quantifies the amount of energy any given FRC
composite can absorb based on its unique material properties (Toughness). The vertical
axis value (stress) on the diagram, at 1st crack is defined as the first crack strength (∝∝∝∝) of
a given material and is determined by using the modulus of rupture formula in ASTM
C7814. The amount of heaved pavement deformed, radiating from the crater center (L) is
the strain. The value (∝∝∝∝) was selected to define the “strength characteristic” of FRC as
used by other researchers in material property crater analysis52.
Figure 5.15: Toughness.
Stress; Force/area
Strain; deformation/Length (L)
Energy absorptionability
Fracture 1st
Crack Strength (∝∝∝∝)

-
177
Equation 5.71 can be used to predict the distance (L) from the crater center in
which the energy absorption capacity of a given FRC material will be greater than the
remaining energy in the decaying stress wave. This will be the limit of heaved pavement
damage. This L relationship is a function of material properties (1st crack strength,
volume of material for damping) for any given explosive energy and can be used to
compare the difference in energy absorption characteristics of different FRC material.
If we consider that the 1st Crack strength values from ASTM C1018 toughness
testing of plain, 0.1%, 0.2%, 0.3% and 0.4% fiber reinforced concrete specimens defines
the strength characteristic of each composite, and will determine the limit of the ruptured
pavement from a stress wave. Scaled to match a given cratering charge, we can
mathematically predict the amount of fracturing (L) from explosive catering for varying
amounts of polypropylene fiber reinforcement considering tensile stresses. Another
correction needs to be considered here, normalizing the p wave amplitude decay as a
function of distance (1/L) to that of a wave acting in the tensile direction (1 / √ L).These
geometrical damping relationships were derived from studies done by Ewing, Jardetzky
and Press in 196751. Calculation for heaved pavement reduction are presented in detail for
0.1%, 0.2%, 0.3%, and 0.4% polypropylene fiber concrete later in this chapter using
Equation 5.71 as a correction to Equation 5.70.
(∝∝∝∝)= 1st crack strength (toughness) (5.71)
(∝∝∝∝) =[4,533.33psi-383.33psi(L feet)][√ E fiber concrete /γ fiber concrete/( g)][√W][1/√L] [√ E granite/γ granite /(g) ] 2 [1/L]

-
178
Table 5.17: Laboratory and Calculated Material Properties.
Material M.O.R. Unit Weight Modulus E.Granite N/a 170 #/cf 8,249,224 psiPlain Concrete 868 psi 143.82 #/cf 4,158,817 psi0.1% FRC 970 psi 144.82 #/cf 4,382,465 psi0.2% FRC 981 psi 143.82 #/cf 4,179,904 psi0.3% FRC 1,017 psi 141.82 #/cf 3,735,295 psi0.4% FRC 980 psi 142.82 #/cf 3,830,317 psi
Figure 5.16: FRC Heaved Pavement Fracturing Schematic.
Explosive crater and original bomb entry hole
L
RD
D
Elastic Zone
Heaved Pavement
Concrete AirfieldPavement

-
179
Calculations; The following example is provided to illustrate the use of the
aforementioned equations to determine the reduction in heaved concrete that needs to be
removed around a runway crater due to the improvement in the energy absorption
characteristics of low volume polypropylene fiber in airfield concrete. Material values
were taken from laboratory testing of polypropylene fiber-concrete specimens at 0.1%,
0.2%, 0.3 % and 0.4% mix volumes. Values for other materials were taken from DuPont
de Nemour's Blaster's Handbook based on accumulated empirical data regarding
explosive testing in quarry operations.
Given the 100' diameter of heaved pavement surrounding a 50' crater on a plain concrete runway with a 1st crack strength =868 psi. If we added fiber to the mix during construction, could we reduce the amount of heaved pavement?
Known material properties
RD = 100’(0% fiber) plain concrete for 50’ crater; ∝∝∝∝= 868psi; (5.72) E= 4,158,817 [email protected]#/cf. (g= 32.2 ft./sec-sec) E granite = 8,249,224 psi@170 #/cf. (g= 32.2 ft./sec-sec)
Determine the stress wave decay for plain concrete. (5.73)
868 psi = (4,533 psi –383.33 psi L)[ √ 4,158,817 psi/ 143.82 #/cf/g ] L [ √ 8,249,224psi /170#/cf/g]
L² - 11.83 L + 2.93 =0 (Quadratic Equation) (5.74)
L = 11.58'(stress wave decay for a given 4 # explosive weight).
Use of the Square root scaling rule for 50' crater charge (√W) where d is the distance from blast center.53 √4 Lbs.
L (scaled) = (11.58')(11.73) < 135.83' [Limit of pavement cracking] (5.75)
1. 0.1% fiber case; ∝∝∝∝ = 970 psi ; E= 4,482,465 psi @ 144.82 #/cf.
Determine heaved pavement limit based on fiber case.
RD = 2 (50’)[ √ 4,482,465psi/ 144.82 #/cf/g] = 103.45’ (5.76) [ √ 4,158,817psi/ 143.82#/cf/g]

-
180
Determine the stress wave decay for 0.1 % fiber concrete. (5.77)
970 psi = (4,533 psi- 383.33 psi L)[ √ 4,482,465psi/ 144.82#/cf/g]L [ √ 8,249,224psi /170#/cf/g]
L² - 11.83 L + 3.17 =0 (Quadratic Equation) (5.78)
L = 11.56’ (stress wave decay for a given explosive weight).
L (scaled) = (11.56')(11.73) < 135.6' (5.79)
∆L (pl.-0.1%)= 135.83' -135.6' =0.23’(difference in wave decay between materials)
Determine 0.1 % FRC heaved pavement diameter around crater. (5.80)
RD = 2 (50’)[ √ 4,482,465psi/ 144.82 #/cf/g] = 103.45’- 2(∆L) = 103’ [ √ 4,158,817psi/ 143.82#/cf/g]
Area RD (plain) – Area RD (0.1% fiber); Reduction in fractured pavement =-478 sq.ft (< 0 %) with 0.1% fiber concrete as compared to plain concrete. Not recommended.
2. 0.2% fiber case; ∝∝∝∝ =981 psi ; E= 4,179,904 psi @ 143.82 #/cf.
Determine heaved pavement limit based on fiber case. (5.81)
RD = 2 (50’)[ √ 4,179,904 psi/ 143.82 #/cf/g] = 100.25’ [ √ 4,158,817 psi/ 143.82#/cf/g]
Determine the stress wave decay for 0.2 % fiber concrete. (5.82)
981 psi = (4,533 psi- 383.33 psi L)[ √ 4,179,904 psi/ 143.82#/cf/g] L[ √ 8,249,224psi /170#/cf/g]
L² - 11.83 L +3.31 =0 (Quadratic Equation) (5.83)
L= 11.54’ (stress wave decay for a given explosive weight).
L (scaled) = (11.54')(11.73) < 135.36' (5.84)
∆L (pl.-0.2%)= 135.83'-135.36' =0.47’(difference in wave decay between materials).
Determine 0.2 % FRC heaved pavement diameter around crater. (5.85)
RD = 2 (50’)[ √ 4,179,904 psi/ 143.82 #/cf/g] = 100.25’- 2(∆L) = 99.32’ [ √ 4,158,817 psi/ 143.82#/cf/g]

-
181
Area RD (plain) – Area RD (0.2% fiber); Reduction in fractured pavement = 106.6 sq.ft (1.4 %) with 0.2% fiber concrete as compared to plain concrete. Similar to plain concrete.
3. 0.3% fiber case; ∝∝∝∝ =1,017 psi ; E= 3,735,295 psi @ 141.82 #/cf.
Determine heaved pavement limit based on fiber case. (5.86)
RD = 2 (50’)[ √ 3,735,295 psi/ 141.82 #/cf/g] = 95.44’- 2(∆L) = 94.04’ [ √ 4,158,817 psi/ 143.82#/cf/g]
Determine the stress wave decay for 0.3 % fiber concrete. (5.87)
1,017 psi = (4,533 psi- 383.33 psi L)[ √ 3,735,295 psi/ 141.82#/cf/g] L[ √ 8,249,224psi /170#/cf/g]
L² - 11.83 L + 3.6 =0 (Quadratic Equation) (5.88)
L= 11.52' (stress wave decay for a given explosive weight). L (scaled) = (11.52')(11.73) < 135.13'
∆L (pl.-0.3%)= 135.83'-135.13'=0.7’(difference in wave decay between materials).
Determine 0.3 % FRC heaved pavement diameter around crater. (5.89)
RD = 2 (50’)[ √ 3,735,295 psi/ 141.82 #/cf/g] = 95.44’- 2(∆L) = 94.04’ [ √ 4,158,817 psi/ 143.82#/cf/g]
Area RD (plain) – Area RD (0.3% fiber); Reduction in fractured pavement = 908.31sq.ft (11.56 %) with 0.3% fiber concrete as compared to plain concrete. Recommended.
4. 0.4% fiber case; ∝∝∝∝ =980 psi ; E= 3,830,317 psi @ 142.82 #/cf.
Determine heaved pavement limit based on fiber case. (5.90)
980 psi = (4,533 psi- 383.33 psi L)[ √ 3,830,317 psi/ 142.82#/cf/g] L[ √ 8,249,224psi /170#/cf/g]
Determine the stress wave decay for 0.4 % fiber concrete.
L² - 11.83L + 3.44 =0 (Quadratic Equation) (5.91)
L = 11.52’ (stress wave decay for a given explosive weight). L (scaled) = (11.52')(11.73) < 135.13' (5.92)
∆L (pl.-0.4%)= 135.83'-135.13'=0.7’ (difference in wave decay between materials).

-
182
Determine 0.4% FRC heaved pavement diameter around crater. (5.93)
RD = 2 (50’)[ √ 3,830,317 psi/ 142.82 #/cf/g] = 96.3’- 2(∆L) = 94.9’ [ √ 4,158,817 psi/ 143.82#/cf/g]
Area RD (plain) – Area RD (0.4% fiber); Reduction in fractured pavement = 780.7 sq.ft (10 %) with 0.4% fiber concrete as compared to plain concrete. Recommended.
Calculations comparing FRC material behavior as a function of a shear (Sh) wave
without considering stress wave decay are also presented and tabulated for comparison to
p wave calculations (Table5.14). Material property comparison from the perspective of a
shear (S) wave without considering wave decay; Vs =√ G plain concrete/ γ plain
concrete/gravity (g) where γ / g = the material’s density (ρ) 37. G (Shear Modulus)= E/
2(1 + .15), where Poisson's ratio is assumed as 0.15 for concrete49.
0.1% Fiber Concrete. (5.94)RD=2(50’)[ √ 4,482,465psi/ 2.3/ 144.82 #/cf/g]= 103.5’(no reduction; heaved pavement)
[ √ 4,158,817psi/2.3 /143.82#/cf/g]
0.2% Fiber Concrete. (5.95)RD=2(50’)[ √ 4,179,904 psi/ 2.3/ 143.82 #/cf/g]= 100.2’(no reduction; heaved pavement)
[ √ 4,158,817psi/2.3 /143.82#/cf/g]
0.3% Fiber Concrete. (5.96)RD=2(50’)[ √ 3,735,295psi/ 2.3/ 141.82 #/cf/g]= 95.4’(9% reduction; heaved pavement)
[ √ 4,158,817psi/2.3 /143.82#/cf/g]
0.4% Fiber Concrete. (5.97)RD=2(50’)[ √ 3,830,317psi/ 2.3/ 142.82 #/cf/g]= 96.3’(7% reduction; heaved pavement)
[ √ 4,158,817psi/2.3 /143.82#/cf/g]

-
183
Explosive Fracture Modeling Summary.
Fracture energy reduction under high-speed transit motion waves (explosives)
improved as a result of fibers tendency to reduce the stiffness and density of concrete.
Fiber concrete is better able to resist fracturing with an increase in fiber content due to a
lower Modulus of Elasticity value and increased energy absorption capacity through
damping. Improved damping and increased toughness properties, such as an increased 1st
crack strength value exhibited by polypropylene fiber even in small volumes (<0.5%) in
concrete, demonstrates an ability to reduce pavement heave up to 11.6 %(Figure 5.17).
Reduction in heaved pavement is an important material property capability for the U.S.
Military in Rapid Runway Repair of Airfields. The presented calculations are applicable
for any fiber-concrete composite material, as it evaluates the composite’s response (based
on its unique material properties) to any given detonation. In terms of its contribution to
quantifying reduction in heaved pavement, FRC damping (less stiffness due to reduction
in Modulus of Elasticity) is the dominate factor, as compared to reductions contributed by
fiber-concrete's other material property, 1st crack strength (Table 5.18). However, the
precedence of considering the strength of a material to resist cratering from wave energy
exists with the empirically derived, Maxwell Z model used by NASA engineers from
impact crater observations.The Maxwell Z model is defined with a dimensionless
"strength characteristic" value (∝) =V (velocity of the mass) R³ (crater radius)/t (time) 52.
The results regarding heaved pavement reduction aresimilar, and match well with the
laboratory testing values for toughness (Figure 5.17).

-
184
Table 5.18: Heaved Pavement Reduction Summary.
Fiber Content
Material (p wave)Properties
Stress wave Decay(1st Crack Strength)
Sum of Material and Decay Values
Shear(Sh)Wave
Plain No reduction No reduction No reduction No reduction0.1% No reduction No reduction No reduction No reduction0.2% No reduction 1.4 % reduction 1.4 % reduction No reduction0.3% 8.9% reduction 2.7 % reduction 11.56 % reduction 9 % reduction0.4% 7.3% reduction 2.7% reduction 10 % reduction 7% reduction
Figure 5.17: Heaved Pavement Reduction Toughness Results.
0.3% fiberOptimum
0 .0 0 %2 .0 0 %4 .0 0 %6 .0 0 %8 .0 0 %
1 0 .0 0 %1 2 .0 0 %
H e a v e d P a v e m e n t
R e d u c t io n f r o m P la in C o n c r e te
0.1%
FR
C
0.2%
FR
C
0.3%
FR
C
0.4%
FR
CM a te r ia l
E x p lo s iv e F r a c tu r e E n e r g y R e d u c t io n
12
34
5 0.1% fiber0.2% fiber
0.3% fiber0.4% fiber
0
4043
850725
4460
4591
380443
356
0
4039
13 207178
0
3485
63157
155
0
500
1000
1500
2000
2500
3000
3500
4000
4500
5000
Deflection(0.02 inch) Load(Lbs.)
0.1% fiber
0.2% fiber
0.3% fiber
0.4% fiber

-
185
CHAPTER 6. CASE STUDY ANALYSIS OF THE INTEGRATED DESIGN AND
SELECTION METHODOLOGY FOR FRC AIRFIELDS.
INTRODUCTION
A case study is presented in this chapter for demonstrating the different steps and
analysis of this methodology. Consider a foreign policy scenario not unlike the Berlin
Airlift after World War II. A democratic, landlocked sub-Saharan nation is in conflict
with its neighbors who have closed off their borders to all commerce including food to a
now starving population. This now starving democratic nation has asked the United
States for help and a marginal amount of food is being flown in on C-130 cargo aircraft
due to the limited number of short asphalt airstrips located throughout this impoverished
nation. United States military engineers have been sent to the capital of this nation to
consider the feasibility in building a 3,000-foot concrete runway for C-17A operations.
Sustained airlift operations with the C-17A aircraft, to replace the C-130 Aircraft, can
provide the needed logistics to avert a famine crisis occurring in this nation prior to a
settlement of this conflict, which will take at least a year. The engineers have determined
that there is a ready source of sand, aggregate and cement for concrete production
meeting MD-7 specifications. Engineering units and equipment are now in country to
begin construction, with a 30 day tasking to complete the runway and another 30 days to
construct parking aprons and taxiways. After construction, the runway will be expanded
for civilian aircraft. At this time, there is a threat of air strikes with conventional
munitions from hostile military aircraft.

-
186
CASE STUDY
Step 1. Evaluate and Select New Fiber Material.
In this step fiber reinforced concrete selection should meet four targeted properties
of High Performance Airfield Concrete (HPAC) outlined in Chapter three.
1. Reduce deflections, compressive stresses and horizontal strains reflected through the
FRC composite to underling pavement surfaces due to aircraft gear geometry and
repetitive loading. Accomplish this through optimized FRC material strength
properties such as MOR and fatigue strength.
2. Reduce airfield pavement surface deterioration and minimize foreign object debris
(FOD) damage. Accomplish this through FRC material properties that reduce
pavement shrinkage, cracking and scaling potential due to construction, maintenance,
traffic abrasion and thermal stresses.
3. Enhance energy absorption characteristics of the composite such as toughness,
ductility, and impact resistance to minimize heaved pavement damage generated by
explosive catering.

-
187
4. Enhance constructability of rigid airfield pavements in terms of ease of placement
(workability), and thickness reduction. Optimize FRC material properties to reduce
design thickness, yet maintain workability to reduce construction time and cost.
As concluded in the literature research detailed in Chapter two, there is significant
indication from past studies that less than 0.5% by volume polypropylene fiber enhances
the fatigue and flexural strength of rigid airfield pavements without excessive deflections.
Fatigue strength and flexural strength are the dominant material characteristics in
achieving a 20-year pavement design life as specified by the FAA and the military. The
goal of this selected fiber is that at optimized polypropylene fiber content, concrete
airfields designed for a specified aircraft mix and design life can have a smaller
equivalent thickness as compared to plain (0.0% fiber) concrete pavement. The high
tensile strength of polypropylene and its ability to bridge microcracks results in higher
fatigue endurance limits for concrete. This composite pavement will also have a smaller
Modulus of Elasticity value, which will contribute to a reduction in thermal stresses due
to a less stiff, thinner rigid pavement section. At volumes of less than 0.5%, historical
problems associated with fiber concrete at greater volumes, 0.5 to 2.0 percent by volume
such as excess deflection, creep, workability and durability becomes insignificant6. If you
consider a 10,000-foot long, 300-foot wide military runway, whose design thickness can
be reduced by even one half inch by use of this composite, the economics are significant.
In terms of material costs and construction time, in the magnitude of 4,650 Cy at $150/Cy
or $697,500. Additionally, this composite exhibits superior crack control characteristics,
which in military and civilian airfields not only enhances pavement longevity and surface

-
188
serviceability, but also reduces foreign object debris (FOD) damage to high performance
aircraft engines. Polypropylene also possesses material properties that increase concrete’s
ductility and dynamic energy absorption capability (toughness), which are performance
characteristics desired by the military in reducing bomb damaged airfield pavement.
Polypropylene fiber reinforced concrete (FRC) increased toughness can reduce the
amount of heaved pavement required to be removed and replaced, saving invaluable time
to aircraft sortie generation after an attack. Literature review and laboratory testing
suggests that FRC has four times the energy absorption capability of plain concrete and
the impact is significant. Under these conditions, the amount of heaved pavement needing
to be replaced can be reduced, and the reduction is quantifiable.

-
189
Table 6.1 summarizes material properties of low volume (< 0.5%) polypropylene
fiber reinforced concrete as compared to plain (0% fiber) concrete, as determined through
extensive literature search in Chapter two. Table 6.1 also identifies HPAC properties
(highlighted) governing airfield pavement performance that are selected for further
evaluation.
Table 6.1:Polypropylene Fiber Concrete Properties.
Material Property/Behavior Polypropylene reinforced concrete; average values
Plain (unreinforced) concrete; average values
Static flexural strength Increase (< 15%) 720 psi
Tensile strength Increase ( <10%) 620 psi
Dynamic fatigue strength Significant (18%+ increase) 450 psi
Endurance limit Significant (18% + increase)
2 million cycles
Flexural Toughness Significant (I = 4.1) I = 1(first crack)
Compressive strength Ductile failure/6,100 psi Shatter failure/6,050 psi
Creep strain Increase (+10%) Stress /strength ratio > 0.55
Plastic/ shrinkage cracking Reduced crack width/cracking
12%+ more cracked surface
Freeze-thaw resistance Function of air entrainment 80% weight/ 1000 cycles
Impact resistance ¼ - ½ inch fibers/ Increase at Failure
65 blows (ACI 544)
Permeability Silica fume additive/increase
2.6% water migration
Abrasion Resistance Same Same(ASTM C 944/C799)
Workability Superplasticizers/ same Better workability
Elastic modulus Matrix same/fiber (500 ksi) E > 3.5 x 10^6 psi
Poisson’s Ratio No research 0.2
Thermal expansion No research 0.0000055 per °F

-
190
Step 2. HPAC Laboratory Testing.
Targeted material properties of a FRC composite that would be characteristic of a
High Performance Airfield Concrete (HPAC) would be those properties that reduce
pavement surface deterioration and foreign object debris (FOD) damage to aircraft. Also,
material properties that enhance constructability, such as workability and reduce design
thickness and subsequently reduce agency costs, such as construction time and materials.
Most importantly for the military, material properties that enhance survivability such as
toughness and impact resistance are considered in HPAC. The material properties
identified for HPAC in Step one would be selected for laboratory testing as in Chapter
four and evaluated for their potential contribution to pavement performance.
Quantify the workability characteristics of 0.1%, 0.2%, 0.3% and 0.4%
polypropylene fiber concrete as compared to plain (0%fiber) concrete through optimized
mix design, slump cone and air content testing using concrete mix design MD-7
(Table 4.1).
Laboratory testing in Chapter four confirmed cast in place concrete will
accommodate up to 0.4 percent by volume of polypropylene fibers with minimal mix
proportion adjustments. Good workability can be maintained in polypropylene fiber
reinforced concrete (FRC) by adding an appropriate amount of admixtures. Slump and air
content values provide an indication of workability of a concrete mix. Given a limited

-
191
slump range; 1 –1/2 to 3 inches and fixed air content of 6.5%, adequate mix design was
maintained using water reducers and air entraining admixture (Tables 4.2, 4.3).
Quantify the energy absorption characteristics of 0.1%, 0.2%, 0.3% and 0.4%
polypropylene fiber concrete as compared to plain (0%fiber) concrete through toughness,
ductility and impact resistance testing.
Toughness testing provides for the determination of ratios called Toughness
Indices that identify the pattern of material behavior of FRC up to a selected deflection.
Indices represent a ratio of remaining energy (load-deflection areas expressed in Foot.
Lbs.-inch) at 3, 5.5 and 10.5 times first crack deflection as compared to the energy
triangle at first crack. As example, plain concrete has I –5,10, 20 values of one. This
manifestation of toughness or energy absorption capability is relevant in such engineering
applications as the reduction of heaved pavement from explosive cratering, where
preservation of structural integrity even after severe damage is of primary concern.
Toughness testing was conducted on 12 FRC samples at the University of Maryland and
is detailed in Chapter 4. Toughness Indices compared favorable with current research, but
residual strength values showed little perfect plastic behavior of these composite at large
deflections. Laboratory Toughness Indices at 0.3% fiber content were 3.17, 3.63 and 4.5
for I-5, 10, 20 respectively. Indicating a fourfold ability of the FRC composite to absorb
energy as compared to plain concrete after cracking (Figure 4.9). The toughness of
concrete improves with increases in fiber volume, and first crack strength optimized at a
fiber content of 0.3% (Figure 4.10).

-
192
In the “Investigation of Fiber-Reinforced Concrete for Use in Transportation
Structures” 13 the results for impact resistance indicated the number of blows to first
crack and ultimate failure increases with increasing fiber volume as tabulated in Table
2.6.
ASTM C 39; Compressive Strength of Cylindrical Concrete Specimens determines
the compressive strength of 6 inch x 12 inch concrete cylinders by applying a
continuously increasing axial load to the specimen until failure occurs. We tested twenty-
five, 6 inch X 6 inch X 12 inch concrete cylinders as discussed in Chapter four,
evaluating varying volumes of polypropylene fiber. On average, the compressive strength
for plain, 0.1%, 0.2%, 0.3% and 0.4% fiber reinforced concrete was 5,339 psi, 6,075 psi,
5,394 psi, 4,543 psi and 4,869 psi respectively. The addition of fiber beyond 0.2%
resulted in a corresponding decrease in compressive strength by 10% at 0.4 % fiber
content. However, the fibers had a significant effect on the mode and mechanism of
failure of concrete cylinders in the compression test. The mode of failure was more
ductile, crushing samples rather than failing them in shear, where the cylinders endure
large deformations without shattering (Figure 4.18). Evaluation and observation of all
flexural, fatigue, compressive and toughness specimens showed an increase in energy
absorption and ductility of concrete possessing greater volumes of polypropylene fiber as
compared to plain concrete (Figures 6.1, 6.2).

-
193
Fatigue Beam Specimen (0.4 % FRC-w/c = 0.44).
Figure 6.1: Fracture Reduction Observation.
Fracture pattern columnar at 4,869 psi . Fracture pattern cone and shear at 5,339 psi.
Figure 6.2: Cylinder Specimen Failure.
Shrinkage Prediction.
Quantify the shrinkage characteristics of 0.1%, 0.2%, 0.3% and 0.4% polypropylene fiber
concrete as compared to plain (0%fiber) concrete through restrained and free shrinkage
testing.
Characterize surface distress (cracking).
• Evaluate unrestrained shrinkage (ASTM 157) for 0.1%, 0.2%, 0.3% and 0.4%
polypropylene fiber concrete as compared to plain (0%fiber) concrete.
Fracture pattern was a middle third span section 80 % bottom to top fracture
Plain Concrete0.4%FRC

-
194
• Evaluate restrained cracking (Steel Ring test) for 0.1%, 0.2%, 0.3% and 0.4%
polypropylene fiber concrete as compared to plain (0%fiber) concrete.
An inherent material property of concrete when drying is shrinkage. The amount
of shrinkage depends on a number of factors such as the size and age of the concrete
sample as well as environmental conditions such as temperature and humidity. If the
concrete structure is restrained from shrinking, such as highway and airfield pavements,
tensile stresses will develop causing the pavement to crack. Cracking is a major concern
in airfield pavements due to FOD generation, loss of strength, durability and degradation
of the subgrade through pumping.
Laboratory testing at the University of Maryland was conducted on twenty-seven,
6 inch X 6 inch X 21 inch free shrinkage concrete beams of varying fiber content
0%(plain), 0.1%, 0.2%. 0.3% and 0.4%. Results indicated the additions of polypropylene
fibers do not significantly alter drying shrinkage (Figures 4.24, 4.25). Grzybowski and
Shah reported similar results and concluded that the primary advantage of fibers in
relation to shrinkage is their effect in reducing the adverse width of shrinkage cracks.24
The ACI has not declared a standard test for plastic or restrained shrinkage evaluation of
FRC. However, FRC results using the steel ring test indicate a 20%-90% reduction in
cracking and crack width as compared to a plain concrete (Figure 6.3). No cracking was
observed in laboratory steel ring tests over a temperature range of -30 to 23 degrees
Celsius.

-
195
Figure 6.3: Restrained Shrinkage Cracking (ref. Grzybowski, Shah 1990).
Step 3. FRC Design Thickness Predictions. For carrying out the analysis, a finite
element method using KenSlabs was selected. KenSlabs has great versatility in validating
improvements in FRC strength through design thickness reduction and reduction in
thermal stresses by evaluating the material properties for different mixtures. The inputs to
consider in the analysis are:
1. Aircraft Geometry. The gear and tire footprint of a specific military aircraft, which is
considered the critical contributor to airfield pavement damage. In this case, the
Boeing C-17 Globemaster III aircraft.
00.20.40.60.8
1
0 fiber 0.5% fiber 1% fiber 1.5% fiberPolyproplene
E = 4.8 Gpa
Fiber Volume
Crack Width (mm)
CRACK DEVELOPEMENT

-
196
Example; Design Aircraft. The C-17 is capable of rapid strategic delivery of
troops and all types of cargo directly to forward bases into the deployment area outlined
by this scenario. The aircraft is also capable of performing tactical airlift and airdrop
missions when required45. Maximum takeoff gross weight is 585,000 pounds with a
maximum payload of 169,000 pounds. With a payload of 160,000 pounds, the C-17 can
take off from a 7,600-foot airfield, fly 2,400 nautical miles and land on a small, austere
airfield of 3,000 feet or less in length. Gear configuration is tandem, dual wheels with
tandem spacing of 97 inches and 41.5 inch spacing between dual tires. The tire pressure
is 138 psi.
2. Traffic. A fixed number of aircraft takeoffs and landings. In this case, at least
2,000,000 passes in this analysis.
3. Material Properties. Essentially, the Modulus of Rupture values, Modulus of Elasticity
values, Poisson's ratio and maximum flexural strength (fmax) values as determined from
literature review or laboratory testing of plain, 0.1%, 0.2%, 0.3% and 0.4%
polypropylene fiber content are considered. Moduli of Rupture values for FRC from
Chapter four are 868 psi, 970 psi, 981 psi, 1,017 psi and 980 psi respectively. Flexural
strength (fmax) values are 521 psi, 570 psi, 525 psi, 567 psi and 513 psi. An average
Poisson’s Ratio value of 0.15 and an average Modulus of Elasticity value of 4,000,000
psi is selected.

-
197
4. Seasonal adjustment factors. Adjustments (15 % reduction) to a standard set of
subgrade strength values due to environmental conditions such as spring thaw. The
selected subgrade strength values are a Young's Modulus of 5,000 psi, and a Poisson's
ratio 0.2.
5. Load Variables. Generally an increasing range of contact tire pressure stress values per
aircraft, that determines the relationship between stress levels and pavement thickness for
a given FRC material for a given aircraft, the C-17 (Table 5.6).
As shown in Chapter five, KenSlabs analysis provided a linear relationship
between stress level and rigid pavement thickness for the Boeing C-17 aircraft footprint
and for edge loading conditions at a slab tensile stress of 405 psi (Table 5.6). When
graphed, the relationship yielded a design thickness to stress level equation of y = 17.73x
+ 5.898 (Figure 5.12, Constant D C-17A Aircraft). In compliance with the Military and
FAA's six-inch minimum pavement thickness, adequate deflection control (< 0.05 inches)
was maintained. The L-D constants were defined as 17.73 inches and 5.90 inches
respectively. As indicated previously, this equation allows determination of airfield
pavement thickness as a function of static flexural strength. Therefore for predicting the
20-year design life for a rigid airfield pavement for this aircraft the equation becomes:
T (concrete) = [17.7”(tp/ Sc) +5.9”] ; Sc for plain concrete. (6.1)
T (concrete) = [17.7”(tp/ Sc-fiber) +5.9”] ; Sc- fiber = fiber volume (0.1%, 0.2%, 0.3%, 0.4%) MOR ( psi).

-
198
T (plain concrete) = [17.7”(138 psi/ 868 psi) +5.9 ”] = 8.7 inches (6.2)
T (0.1% fiber concrete) = [17.7”(138 psi/ 970psi) +5.9 ”] = 8.4 inches (6.3)
T (0.2% fiber concrete) = [17.7”(138 psi/ 981psi) +5.9 ”] = 8.4 inches (6.4)
T (0.3% fiber concrete) = [17.7”(138 psi/ 1017 psi) +5.9 ”] = 8.3 inches (6.5)
T (0.4% fiber concrete) = [17.7”(138 psi/ 980 psi) +5.9 ”] = 8.4 inches (6.6)
This equation also allows determination of pavement thickness as a function of
fatigue strength. Based on KenSlabs analysis, airfield pavement thickness for edge
loading of a C-17 military aircraft for 2,000,000 passes is as follows.
T (concrete) = [17.7 ”(tp/ Sc) +5.9”] [ f max/ fv max]½ (6.7)for tp/ Sc < 0.7 stress levels[S < 0.5 stress ratio]
Where: T (concrete) = Rigid airfield pavement design thickness (inch).
L(tp/ Sc) +D = minimum pavement thickness(inches) for plain concrete. tp = Aircraft tire pressure in psi. Sc = Modulus of Rupture of 0% fiber (plain)Concrete (psi).
fv = Fatigue strength (psi) at 2,000,000 cycles for FRC. fmax = Fatigue strength ( psi) at 2,000,000 cycles for plain concrete.
T (plain concrete) = [17.7 ”(138 psi/ 868 psi) +5.9”] [521/ 521psi)] ½ = 8.7" (6.8)
T (0.1% fiber concrete) = [17.7”(138 psi/ 868 psi) +5.9”] [521/ 570 psi)] ½ = 8.3 inches (6.9)
T (0.2% fiber concrete) = [17.7”(138 psi/ 868psi) +5.9”] [521/ 525 psi)] ½ = 8.7 inches (6.10)
T (0.3% fiber concrete) = [17.7”(138 psi/ 868 psi) +5.9”] [521/ 567 psi)] ½ = 8.4 inches (6.11)
T (0.4% fiber concrete) =[17.7”(138 psi/ 868 psi) +5.9”] [521/ 513 psi)] ½ = 8.8 inches (6.12)

-
199
KenSlabs showed a quantifiable improvement in FRC pavement strength by a
reduction in design thickness. In this case, 0.3 inch reduction for 0.1 % -0. 4% FRC as
compared to plain concrete in the flexural strength. Fatigue strength at 2,000,000 cycles
increased when fibrillated polypropylene was added to concrete. In this case, 0.4-inch
reduction for 0.1% and, 0.3 inch reduction for 0.3% FRC in design thickness as compared
to plain concrete.
Conventional airfield design thickness is computed for plain concrete and then
reduced by the appropriate PRV listed in Table 6.2.Boeing 777, Boeing 747, Boeing
C-17, Lockheed Martin C-141 design thickness values were determined in Chapter five
based on LED-FAA standards or military standards by traffic area using KenSlabs and
are tabulated (Table 6.2). In this case, enter Table 6.2 at the C-17A aircraft, select the
appropriate design thickness traffic area. As example, for runways (traffic area A) the
minimum design thickness is 10.5”. Subtract the PRV for 0.1% or 0.3% fiber content
which is 0.4”, then the final design thickness is 10.1” for an FRC military runway for the
C-17 aircraft operations.

-
200
Table 6.2: Single/Multi-Aircraft Design Thickness.
Aircraft Annual Departures
Mil.Std.(Kenslab) Design Thickness By Traffic Area
LED-FAA Design Thickness
Fiber Content/PRVthickness reduction value(avg.)
Boeing 777Boeing 747C-141
33,00033,00033,000
19.44 inches(MOR;800psi)
0.1%/0.3”reduction0.2%/0.2” reduction0.3%/0.4” reduction0.4%/0.2” reduction
Boeing 777Boeing 747C-141C-17A
25,00025,00025,00025,000
19.22 inches(MOR;800psi)
0.1%/0.3”reduction0.2%/0.2” reduction0.3%/0.4” reduction0.4%/0.2” reduction
Boeing 777 100,000 8.3 inches Class C traffic areas(MOR;868 psi)Class A/B traffic Areas; 10.5 inches
0.1%/0.4”reduction0.2%/0.2” reduction0.3%/0.4” reduction0.4%/0.2” reduction
C-141 100,000 8.7 inches Class C traffic areas(MOR;868 psi)Class A/B traffic Areas; 10.5 inches
0.1%/0.4” reduction0.2%/0.2” reduction0.3%/0.4” reduction0.4%/0.2” reduction
C-17A 100,000 8.7 inches Class C traffic areas(MOR;868 psi)Class A/B traffic Areas; 10.5 inches
0.1%/0.4” reduction 0.2%/0.2” reduction0.3%/0.4” reduction0.4%/0.2” reduction
Enter chart for Design Aircraft
Determine Design Thickness
Subtract FRC-PRV

-
201
Thermal Stress and Deflection Predictions.
KenSlabs modeling using the C-17 aircraft design thickness and a 20° F temperature
differential between the base and top of the 25 foot concrete airfield slab yielded the
following thermal stress results quantified in Table 6.3. There is a decrease in
temperature curling stresses with increasing fiber volume, which reduces total slab
stresses during typical daylight aircraft loading conditions. This appears to be a function
of decreasing Modulus value and thickness associated with FRC composites.
Quantifiably, a reduction of 19.8 psi of curling stresses between plain and 0.3% fiber
concrete. Based on Table 5.15, no significant reductions in corner deflection can be
expected in design thickness difference of 0.4 inches or less.
Table 6.3: KenSlabs Thermal Stress Results.
Fiber Case Modulus of Elasticity46
(psi)
Unit wt.
(pcf)
Fatigue Design Thickness
Curling Stress (psi)
Thermal Stress reduction;psi
Plain 4,177,328 142.82 8.7 inches 247.90 baseline0.1% 4,663,892 147.82 8.3 inches 276.80 --------0.2% 4,180,341 143.82 8.5 inches 248.30 --------0.3% 3,836,315 143.82 8.3 inches 228.10 19.8 psi0.4% 3,888,886 141.82 8.5 inches 231.10 16.8 psi

-
202
Agency Costs (Construction time and materials).
Adequate FRC workability for 0.1%, 0.2%, 0.3% and 0.4% polypropylene fiber
concrete as compared to plain (0%fiber) concrete can be maintained using admixtures.
Therefore, determination of reduction in agency costs by pavement thickness reduction
model is the only relevant cost criteria (Table 6.4).
Table 6.4:Agency Cost Matrix -Mix Design # 7.
Specimen C-17Aircraft Design Thickness
FRC PavementReductionValue (PRV)
Material savings; C.Y.s of Concrete150’x 3,000’runway
Material savings (dollars)
Plain Concrete 8.7 inches ------------ ------------ ------------0.1% FRC 8.3 inches 0.4 inches 556 cy $83,400.000.2% FRC 8.5 inches 0.2 inches 278 cy $41,667.000.3% FRC 8.3 inches 0.4 inches 556 cy $83,400.000.4% FRC 8.5 inches 0.2 inches 278 cy $41,667.00

-
203
Step 4. FRC Heaved Pavement Predictions.
Reduction in heaved pavement is an important material property capability for the
U.S. Military in Rapid Runway Repair of airfields. Thecalculation of reduction in heaved
pavement fracturing based on 0.3 % polypropylene fiber concrete as compared to plain
concrete are shown next. Chapter five provides modeling for all fiber cases, showing
reduction in heaved pavement crater diameter (RD) in function of FRC material
properties.
Given the 100' diameter of heaved pavement surrounding a 50' crater on a plain
concrete runway with a 1st crack strength =868 psi. If we added 0.3% fiber to the mix
during construction, could we reduce the amount of heaved pavement?
RD = 2D [√ E 0.3%fiber concrete/ γ fiber concrete/(g)]- 2(∆L) (6.13) [√ E plain concrete/ γ plain concrete/(g)]
RD = 100’(0% fiber) plain concrete for 50’ crater; 1st Crack = 868psi; E= 4,158,817 [email protected]#/cf. (g= 32.2 ft./sec-sec)
Determine the stress wave decay for plain concrete.
868 psi = (4,533 psi –383.33 psi L)[ √ 4,158,817 psi/ 143.82 #/cf/g ] L (6.14) [ √ 8,249,224psi /170#/cf/g]
E granite = 8,249,224 psi@170 #/cf. (g= 32.2 ft./sec-sec)
L² - 11.83 L + 2.93 =0 (Quadratic Equation) (6.15)L = 11.58’(stress wave decay for a given 4 # explosive weight).
Use of the Square root scaling rule for 50' crater charge (√W) where d is the distance from blast center.53 √4 Lbs.
L (scaled) = (11.58')(11.73) < 135.83' (6.16)

-
204
Determine heaved pavement limit based on fiber case.
0.3% fiber case; 1st Crack =1,017 psi ; E= 3,735,295 psi @ 141.82 #/cf.
RD = 2 (50’)[ √ 3,735,295 psi/ 141.82 #/cf/g] = 95.44’ (6.17) [ √ 4,158,817 psi/ 143.82#/cf/g]
Determine the stress wave decay for 0.3 % fiber concrete. (6.18)
1,017 psi = (4,533 psi- 383.33 psi L)[ √ 3,735,295 psi/ 141.82#/cf/g] L[ √ 8,249,224psi /170#/cf/g]
L² - 11.83 L + 3.6 =0 (Quadratic Equation) (6.19)
L= 11.52' (stress wave decay for a given 4 # explosive weight). L (scaled) = (11.52')(11.73) < 135.13' (6.20)
∆L (pl.-0.3%)= 135.83'-135.13’=0.7’ (difference in wave decay between materials)
Determine 0.3 % FRC heaved pavement diameter around crater.
RD = 2 (50’)[ √ 3,735,295 psi/ 141.82 #/cf/g] = 95.44’- 2(∆L) = 94.04’ (6.21) [ √ 4,158,817 psi/ 143.82#/cf/g]
Area RD (plain) – Area RD (0.3% fiber); Reduction in fractured pavement = 908.31 sq.ft (11.56 %) with 0.3% fiber concrete as compared to plain concrete.
As the calculations show, heaved pavement reduction is improved as a result of
fibers tendency to reduce the stiffness and density of concrete and in its increased
strength properties (Figure 5.17). Both reduced stiffness and increased strength properties
exhibited by polypropylene fiber, even in small volumes (<0.5%) in concrete,
demonstrates an ability to reduce pavement heave by 11 % as a result of explosive
cratering (Table 5.18). Also, this analysis methodology is iterative for any concrete
composite material, as it measures the composite’s response based on its unique material
properties to any given detonation.

-
205
Step 5. Field-Testing. Implementation (construction) of optimized FRC slabs for actual
field-testing. Feedback from field-testing becomes input data for iterative system
engineering analysis (Figure 3.9: System Engineering Schematic).Field data acquisition
yields improvements in test methods, data collection as well as deterioration modeling.
• Aircraft Loading . Control (0%fiber) and FRC slabs are constructed on an airfield for
actual load testing by passing aircraft. Measure deflection and strain under load and
determine FRC's actual material properties (Modulus value) from compressive
strength testing. Install horizontal strain gages and calculate horizontal tensile stress
using Hooke's law for specific aircraft passes. Calculate number of aircraft passes and
measure deflection and compare to analytically derived KenSlabs tensile stress of 405
psi for the C-17 aircraft at design thickness. Determine which FRC slab performs the
best under load for a specific aircraft.
• Environmental testing. Control (0%fiber) and FRC slabs are constructed by the
airfield for shrinkage testing; record cracking, thermal stresses and volumetric
changes. Record cracking using the pavement condition index (PCI) visual method.
Conduct pulse velocity testing to determine slab deterioration. Record thermal stress
induced slab measurements and using the deflectometer, record density changes due
to weathering and stresses (internal cracking). Install thermal couples and determine
FRC's actual material properties such as the coefficient of thermal expansion (α), then
calculate thermal stresses using KenSlabs. Determine which FRC slab performs the
best under a specific local environment.

-
206
• Explosive testing. Control (0%fiber) and FRC slabs should be constructed for
Ammonium Nitrate-Fuel Oil (ANFO) explosive testing. After explosive testing,
record the reduction in radial fractured FRC pavement from a given charge as
compared to plain concrete. Chart relationship between explosive type/net explosive
weight, bore hole diameter and radial distance of heaved pavement from crater center.
The United States Air Force (USAF) defines the Repair Quality Criteria (RQC) for
heaved pavement as a pavement with greater than ¼ inch vertical displacement.
Determine which FRC slab provides the greatest reduction in heaved pavement based
on its material properties.
Conclusion.
Considering both the U.S. Military’s and commercial aviation’s global reach, similar
to SuperPave, FRC rigid pavement design may be regionally specified based on local
desired performance criteria due to mission, environment and threat as well as local
material (design mix) properties. In our sub-Saharan construction scenario, expediency
and survivability are the critical mission requirements. Table 6.3 suggests that use of
0.3% fiber reinforced concrete will reduce over 556 cubic yards of concrete from our
initial construction of a 150’ wide, 3,000’ runway for initial C-17A operations, twice that
for follow on apron and taxiway construction. Using material costs as a metric, a savings
of over $83,000 (Table 6.4). Selection of the 0.3% fiber reinforcement also provides up to
11 % reduction in airfield heaved pavement, as a result of any air attack with
conventional munitions, as determined in the Step three calculations. From our literature

-
207
search summary in Step one, we can also expect good workability with superplasticiters
and good crack control, as 0.3 % fiber reinforcement reduces adverse crack width in half
(Table 2.7). Even though we expect the conflict to end in a year, long term benefits
offered by higher volumes of fiber content includes thermal stress reduction (Table 6.3),
enhanced toughness (Figure 4.9), ductility (Figure 4.18) and impact resistance (Table 2.6)
as characterized in step two and Chapter four laboratory testing. Final mixture selection is
both available material and scenario driven, but rapidly determined by thoughtful
research, analysis and building of planning tables like Table 6.5 ahead of time. As
example, if the U.S. Military were considering short term basing and airfield construction
in Eastern Europe’s predominately wet, but low air threat environment, a 0.1 %
polypropylene fiber mix might be considered due to lower costs.
Table 6.5: FRC Selection based on HPAC Performance Results.
HPAC Performance Criteria; C17Aircraft.(FRC Mix # 7)
PlainConcrete
0.1% FRC 0.2% FRC 0.3% FRC 0.4% FRC
Fatigue StrengthDesign thickness
------- 0.4 inchreduction
no reduction
0.3 inchreduction
--------
Flexural StrengthDesign thickness
------- 0.3 inchreduction
0.3 inch reduction
0.4 inchreduction
0.3 inchreduction
Thermal Stresses------- ------- ------- 19.8 psi reduction
16.8 psi reduction
Explosive ModelHeaved Pavement
------- no reduction
1.4% reduction
11.6% reduction
10 % reduction
Toughness I-5; 1.7 I-5; 2.4 I-5; 2.8Ductility OptimumImpact Resistance
Blows to failure; 68
Blows to failure; 68
Blows to failure; 69
Blows to failure; 69
Blows to failure; 94
Crack Reduction OptimumWorkability OptimumAgency Cost Least cost

-
208
CHAPTER 7. SUMMARY, CONCLUSIONS AND FUTURE
RECOMMENDATIONS
SUMMARY
The main objective of this research is development of an integrated concrete
material design/selection methodology for fiber reinforced concrete composite
pavements. The task was to quantify the structural and energy absorption potential of low
volume (<0.5%) polypropylene fiber reinforced concrete in structures such as rigid
airfield pavements. This was accomplished through concrete laboratory testing, literature
research and finite element modeling with specific airfield or pavement computer
programs that lead to the development of performance based design equations. The
function of these predictive equations is to quantify the effect of different volumes of
polypropylene fiber in reducing airfield pavement thickness or reducing the damage to a
pavement structure through dynamic loading, such as repetitive aircraft passes or
explosive bomb damage. Through the same venue, an offset study was conducted on
workability, durability, deflection, creep, thermal stresses, shrinkage and cracking to
ensure none of the historical problems associated with larger volumes (>0.5%) of fibers
in concrete composites occur. The end result of this study is a performance-based,
integrated mixture design/selection methodology coupled with pavement design
requirements. It is recognized that computer and performance modeling, laboratory
testing or any literature research can not capture the real life aircraft loading conditions or
replace explosive testing. These performance models or pavement thickness reduction
equations and values require further evaluation in the field under real world conditions.

-
209
Essentially, the objective proposed in this dissertation was to construct a rational
framework for comprehensively evaluating all facets of fiber-reinforced concrete's (FRC)
materials’ behavior and design as it applies to improving the performance of the airfield
pavement as a system. Much of the Military’s current rigid pavements design
methodology focuses on structural thickness determination, a single criteria approach to
design, independent of concrete mix properties and their behavior over a range of other
performance requirements.
Chapters three proposed an integrated mix design methodology for fiber
reinforced concrete (FRC) as a high-performance airfield concrete (HPAC) pavement. In
brief, the five steps of the methodology are:
Step 1. Conduct extensive literature research to determine the FRC material properties
for HPAC.
Step 2. Establish laboratory-testing protocols to evaluate desired HPAC-FRC material
behavior and obtain data values, which then could be analyzed to predict rigid airfield
pavement performance.
Step 3. Through finite element programs, establish prediction equations estimating design
pavement thickness reduction based on aircraft footprint and FRC material properties.
Step 4. Determine heaved pavement reduction based on the rheological properties of FRC
containing up to 0.4% by volume of polypropylene fiber concrete.
Step 5. Propose a process for field testing analytically derived airfield pavement
performance models with actual conditions in an iterative model improvement process.

-
210
CONCLUSIONS
To be significant, in terms of contribution to the engineering community, research
must be geared towards application otherwise it just serves itself. Innovation in pavement
design management has and will clearly involve the interaction of universities, industry
and public agencies such as the Defense Department to exploit future innovations in
pavement design research34. In addition to traditional academic sources of research such
as the Transportation Research Board (TRB) and American Concrete Institute (ACI), the
Internet is a powerful research tool on reviewing ongoing FRC research at other
universities and with polymer vendors. Most important, is the analysis of this data by
military engineers with the practical experience and academic acumen to sort through
tremendous amount of data on emerging composite material technology and recognize
the HPAC potential for selection of an FRC composite for further analytical evaluation.
Generic tabular data is important to the military in making engineering decisions in
remote locations with limited material testing data or available design time. Final mixture
selection is both available material and scenario driven, but rapidly determined by
thoughtful research, analysis and building of such planning tables ahead of time. Table
6.5 provides an example of its application and is proposed for use in determining and
tabulating identified high performance airfield concrete material characteristics for a
given aircraft, mix design and environment (location).

-
211
Through laboratory testing of material properties such as fatigue, toughness and
static flexural strength, polypropylene FRC showed a modest but consistent increase in
those tensile strength properties that would increase the life of the pavement structure
under repetitive aircraft traffic. Through computer modeling, this composite also showed
a reduction in thermal stresses due to lower modulus of elasticity values. This increase in
strength and reduction in stiffness could reduce required pavement design thickness by ¼
inch to ½ inch for a fixed aircraft traffic loading and design life. In terms of economics, if
you consider constructing an entire airfield the implications are significant, in the
magnitude of saving $ 700,000 for the runway construction alone if you can reduce the
runway's design thickness as stated. The increase in toughness of this composite as
compared to conventional concrete not only increases pavement life, but is significant to
the military in mitigating heaved pavement around bomb damaged runway craters during
Rapid Runway Repair (RRR). During Rapid Runway Repair, time to repair heaved
pavement being the single most important criteria to air base survivability by the United
States Military.
Essentially, there were six tasks supporting the stated research objective.
1. Characterize the workability of small volume (<0.5%)polypropylene FRC
composites.
• Laboratory testing confirmed that cast in place concrete will accommodate up to 0.4
percent by volume of polypropylene fibers with minimal mix proportion adjustments.
Good workability can be maintained inpolypropylene fiber reinforcedconcrete
(FRC) by adding an appropriate amount of admixtures.

-
212
2. Characterize the fatigue and static flexural strength of small volume (<0.5%)
polypropylene FRC composites.
• Research studies complemented our laboratory conclusions regarding increases in
concrete’s fatigue strength and endurance limit with increasing fiber, when expressed
as a percentage of plain concrete’s Modulus of Rupture. Fiber reinforcement has a
clear beneficial effect on the fatigue behavior of concrete as long as the fiber content
is not much larger than 0.3 percent.At 0.3 %, the beneficial effect of polypropylene
on the total energy-absorption capacity of concrete seems to peak, irrespective of the
stress level. The fatigue strength at the endurance limit (2,000,000 cycles) was
increased with the addition of 0.1% and 0.3% fiber, which if used in airfield
pavements would extend their service life or could reduce the pavement thickness.
• Compared to plain concrete, laboratory testing indicated the addition of 0.2% to 0.4%
fiber volumes to concrete increased the static flexural strength by 5 to 15 %.
3. Characterize the toughness, ductility and impact resistance of small volume (<0.5%)
polypropylene FRC composites. Qualitatively and quantitatively examine the energy
absorption capability of low volume (<0.5%) polypropylene fiber composites to resist
dynamic loading.
• Laboratory derived Toughness Indices at 0.3% fiber content were 3.17, 3.63 and 4.5
for I-5, 10, 20 respectively, indicating a fourfold ability of the FRC composite to
absorb energy as compared to plain concrete after cracking.
• In compressive strength testing of FRC composites, polypropylene fibers at different
quantities have an effect on compressive strength and a significant effect on the mode

-
213
and mechanism of failure of concrete cylinders. The fiber concrete composites failed
in a more ductile mode, particularly true for higher strength concrete where the
cylinders endure large deformations without shattering. As compared to plain
concrete, the addition of fiber beyond 0.2% resulted in a corresponding decrease in
compressive strength by 10% for 0.4 % fiber content.
• Fiber concrete has excellent impact resistance, which increases with an increase in
fiber content and fiber length. For all fiber concrete (0.1%, to 0.5%) the number of
blows to first crack and final failure was higher than that of plain concrete, by as
much as 20%.
4. Characterize the unrestrained shrinkage, restrained shrinkage and cracking stresses of
small volume (<0.5%)polypropylene FRC composites. Study the cracking and
thermal stresses associated with small volume (<0.5%)polypropylene FRC
composites.
• The results of our laboratory testing revealed additions of polypropylene fibers do not
significantly alter drying shrinkage.
• Steel Ringresults reported showed that small amounts of fiber could substantially
reduce cracks. The average crack width of the specimen reinforced with 0.25%
polypropylene fiber was 0.5 mm (0.016 inches) or one half the value of plain concrete
after six weeks. No cracking was observed during FRC Steel Ring laboratory testing.
• KenSlabs modeling confirmed there is a reduction in thermal stresses with increasing
fiber content due to decreases in slab thickness and stiffness (Table 7.1).

-
214
5. Quantify the fatigue and static flexural strength of small volume (<0.5%)
polypropylene FRC composites through pavement thickness reduction values by
predicting FRC design thickness at 0.1%, 0.2%, 0.3% and 0.4% polypropylene fiber
contents as compared to plain concrete.
• Through Finite Element Method computer modeling, this dissertation derived
equations to predict airfield design thickness criteria for FRC pavements at fiber
contents of 0%, 0.1%, 0.2%, 0.3% and 0.4% and at stress levels of less than 0.7
(0.29,0.39.0.49,0.59.0.69) for given aircraft wheel loads based on laboratory derived
fatigue strength values. These equations yielded aircraft specific performance models
that established minimum thickness (L-D coefficients) parameters for design life (L)
and to limit pavement deflection (D) to levels that prevents subgrade failure from
pumping. These equations allowed determination of FRC airfield pavement thickness
reduction values (PRV) as a function of static flexural strength, which is the current
methodology used by most finite element programs, as well as, fatigue strength
airfield pavement thickness reduction values.
6. Determine the reduction in heaved pavement around a bomb-damaged crater as a
result of FRC material properties.
• Fracture Energy reduction was improved as a result of fibers tendency to reduce the
stiffness of concrete and in it's increased strength properties. Both reduced stiffness
and increased fracture strength properties exhibited by polypropylene fiber, even in
small volumes (<0.5%) in concrete, demonstrates an ability to reduce pavement heave
by as much as 11 % as a result of explosive cratering.

-
215
Table 7.1: Thermal Stress Values;25’X 12’ slab (∆∆∆∆ 20̊ F).
Fiber Case Modulus E(psi)(stiffness)
Unit wt. (pcf)
Fatigue Design Thickness
Curling Stress (psi)Slab edge
Curling Stress (psi)Slab interior(center)
Plain 4,158,817 143.8 9 inches 227 psi 250.1 psi0.1% fiber 4,482,465 144.8 8 inches 241.4 psi 270.9 psi0.2% fiber 4,179,904 143.8 8 inches 224.2 psi 252.9 psi0.3% fiber 3,735,295 141.8 8.4 inches 200.7 psi 225.9 psi0.4% fiber 3,830,317 142.8 8.8 inches 207.6 psi 231.1 psi
FUTURE RECOMMANDATIONS
1. Identify range of criteria for acceptance of FRC mixtures.
• This dissertation focused on one type of fiber concrete composite, polypropylene
within a specific strength range, water/cement ratio of 0.40 to 0.44 (medium
strength). To be useful, tabular data would have to be compiled at both high and low
strength mix designs within this fiber group to determine a range of material
performance as an airfield pavement.
• When considering a new fiber group, detailed literature review of past research would
again have to be accomplished to determine those material properties that would
enhance the performance of an airfield pavement. Tabular data would first be
compiled by fiber concrete composite group, then by strength (low, medium, high).
2. Automate methodology with software development.
• The objective of this dissertation was development of anintegrated concrete material
design and selection methodology for airfield pavements. To be useful, a database of

-
216
material characteristics must be compiled by fiber group and by strength as it pertains
to airfield performance. That database would be considerable, requiring software
development across a range of fibers and strength to rapidly determine the best
composite for a given location, aircraft and mix design.
3. Improve and further develop pavement thickness reduction models.
• Continued refinement of the design thickness reduction model will require better
characterization of fiber concrete’s material properties across a spectrum of mix
designs and their compressive strengths. More ASTM C39 test data of low volume
(<0.5% fiber) fiber reinforced concrete’s strengths at different water/cement ratios
will need to be researched to arrive at an average compressive strength value for each
fiber case. That average strength value would allow determination of an average
Modulus of Elasticity value for fiber concrete in KenSlabs modeling.
• Continued refinement of the design thickness reduction model will require better
characterization of fiber concrete’s material properties across a spectrum of mix
designs and their fatigue strengths. More fatigue test data of low volume (<0.5%
fiber) fiber reinforced concrete’s strengths at different water/cement ratios will need
to be researched to establish a range of fatigue strength values for each fiber case. The
average fatigue value of this range of strength values would allow determination of
the fatigue line by fiber content and their respective coefficient values (f1, f2) for
fiber concrete in KenSlabs modeling.

-
217
4. Improve and further develop pavement-testing protocols.
• On–site test pad construction of optimized FRC composite slabs provides feedback
from field testing as revised data for iterative airfield design analysis. Considering
both the U.S. Military’s and commercial aviation’s global reach, similar to
SuperPave, FRC rigid pavement design may be regionally specified based on local
desired performance criteria due to mission, environment and threat as well as
available local materials (Mix Design) properties. Chapter three recommends those
field tests.
5. Expand methodology for any PCC materials and mix.
• There is a real need to institutionalize a system-engineering research methodology
within the Department of Defense to evaluate emerging fiber concrete composite
materials or any concrete for airfield pavement design. As example, fibers such as
Kevlar (Armid) are becoming commercially available, at less cost and have great
potential as they posses material properties, such as tensile strength many times that
of polypropylene.
• Judgment criteria for adopting a new FRC airfield materials research and design
methodology would have to be established. Those criteria should be performance,
reliability and flexibility in that weighted order. Chapter three recommends the
criteria of selecting such a methodology for new materials in rigid airfield pavement
design.

-
218
REFERENCES
1. Grzybowski, M. and Meyer, C., “Damage Accumulation in Concrete with and without Fiber Reinforcement” ACI Materials Journal, November-December 1993.
2. Yang H. Huang, 1993 “Pavement Analysis and Design” Prentice-Hall, Inc. Englewood Cliffs New Jersey.
3. Maryland Department of Transportation, State Highway Administration “Standard Specifications for Construction and Materials”, October 1993.
4. Klieger and Lamond "Concrete Making Materials" Chapter 51 "Fiber Reinforced Concrete", Article by Colin D. Johnston, Fredericksburg VA, 1991.
5. FHWA-RD-97-030 High- Performance Concretes; A State-of-Art Report (1989-1994) Paul Zia, Shuaib Ahmad, and Michael Leming.
6. TM 5-825-3/AFM 88-6 Rigid Pavements for Airfields; Chapter 4 Fibrous Concrete Pavement Design. US Army (Aug.1988).
7. ACI 544.1 R-96 “ Fiber Reinforced Concrete” American Concrete Institute Report by ACI Committee 544 May 1997. Chapter 4- Synthetic Fiber Reinforced Concrete (SNFRC).
8. EM 1110-2-2000 Standard Practice for Concrete for Civil Works Structures. U.S. ARMY Corps of Engineers (3 February 1994).
9.Nagabhushanam, M., Ramakrishnan, V., and Vondran, G. "Fatigue Strength of Fibrillated Polypropylene Fiber Reinforced Concretes," Transportation Research Record, 1989, No. 1226.
10. Yin, W. S. and Hsu, T. C; “Uni- and Bi-Axial Compressive Fatigue of Fiber Concrete”, Proceedings of the First Materials Engineering Congress, held Aug 13-15, 1990, Denver, CO.
11. Ramakrishnan, V. and Lokvik, B. J; “Flexural Fatigue Strength of Fiber Reinforcement Concretes in High Performance Fiber Reinforced Cement Composites", International Workshop held by RILEM, ACI and others, June 23-26, 1991, Mainz, Germany.
12. Shah, S. P. "Do Fibers Increase the Tensile Strength of Cement-Based Matrixes?" ACI Materials Journal, Nov-Dec 1991, Vol. 88, No. 6.
13. Ozyildirim, C., Moen, C., “ Investigation of Fiber-Reinforced Concrete for Use in TransportationStructures”Transportation Research Record, 1996 No. 1574.

-
219
14. 2001 Annual Book of ASTM Standards, Volume 04.02; Concrete and Aggregates, American Society for Testing & Materials. West Conshohocken, PA.
15. Ramakrishnan, V., Wu, G. Y., and Hosalli, G. "Flexural Behavior and Toughness of Fiber Reinforced Concretes" Transportation Research Record, 1989, No. 1226.
16. Bayasi, Z. and Zeng, J. "Properties of Polyproplyene Fiber Reinforced Concrete" ACI Materials Journal, Nov-Dec 1993, Vol. 90, No. 6.
17. Ozyildirim, C., Moen, C., “ Investigation of Fiber-Reinforced Concrete for Use inTransportation Structures” Transportation Research Record, 1996 No. 1574.
18. Ramakrishnan, V., Wu, G. Y., and Hosalli, G. "Flexural Fatigue Strength, Endurance Limit, and Impact Strength of Fiber Reinforced Concretes" Transportation Research Record, 1989, No. 1226.
19.Balaguru, P. and Ramakrishnam, V. “Properties of Fiber Reinforced Concrete: Workability, Behavior under Long-term Loading and Void Characteristics.” ACI Materials Journal, May-June 1988.
20. Soroushian, P., Mirza, F., and Alhozaimy, A. "Plastic Shrinkage Cracking of Polypropylene Fiber-Reinforced Concrete Slabs" Transportation Research Record, 1993.
21. Nanni, A., Ludwig, D., McGillis, M,. “ Plastic Shrinkage Cracking of RestrainedFiber-Reinforced Concrete” Transportation Research Record 1382.
22. Johnston, C. D., "Fiber-Reinforced Cement and Concrete" Advances in Concrete Technology, Canada Centre for Mining and Energy Technology, Ottawa, Canada, Jan. 1994.
23. Balaguru, P. N. “Contribution of Fibers to Crack Reduction of Cement Composites During the Initial and Final Setting Period”, ACI Materials Journal, May-Jun 1994, Vol. 91, No. 3.
24. Grzybowski, M. and Shah, S., “Shrinkage Cracking of Fiber Reinforced Concrete”ACI Materials Journal, March-April 1990.
25. 1991 Annual Book of ASTM Standards, Vol. 04.02 Philadelphia, PA.
26. Nanni and Johari "Application of Silica Fume in Synthetic Fiber-Reinforced Concrete" Transportation Research Record, 1993, No. 1382.
27.Gagne, R., Pigeon, M., and Aitcin, P-C. "Deicer Salt Scaling Resistance of High Strength Concretes made with Different Cements" in Durability of Concrete; Second International Conference, 1991, Montreal, Canada; Ed. by V. M. Malhotra; American Concrete Institute, Detroit, MI, 1991, Vol. 1.

-
220
28.Li, Y., Langan, B. W., and Ward, M. A. "Freezing and Thawing: Comparison Between Non-Air -Entrained and Air-Entrained High-Strength Concrete"Proceedings of ACI International Conference, held November 15-18, 1994, Singapore; Ed. by V. M. Malhotra; American Concrete Institute, Detroit, MI, 1994.
29. Al-Tayyib, A-H. J. and Al-Zahrani , M. M. "Use of Polypropylene Fibers to Enhance Deterioration Resistance of Concrete Surface Skin Subjected to Cyclic Wet/Dry Sea Water Exposure" ACI Materials Journal, Jul-Aug 1990, Vol. 87, No. 4.
30. Al-Tayyib, A-H. J., and Al-Zahrani, M. M. "Corrosion of Steel Reinforcement in Polyprolyene Fiber Reinforcement Concrete Structures" ACI Materials Journal, Mar-Apr 1990, Vol. 87, No. 2.
31. Vondran, G.L., Nagabhushanam, M., Ramakrisham, V. “ Fatigue Strength of Polyprolyne Fiber Reinforced Concretes” Abstract Tech. File No. 2032.
32. FAA Advisory Circular 150/5320-16; U.S. Department of Transportation dated 22 October 1995.
33. 10Bayasi, Z. and Zeng, J. "Properties of polypropylene fiber reinforced concrete"ACI Materials Journal, Nov-Dec 1993, Vol. 90.
34. Hass, Ralph; Hudson, W. Ronald; Zaniewski, John; “ Modern Pavement Management” Krieger Publishing Company Malabar, Florida 1994.
35. Army –Air Force Technical Manual "Rigid Pavements for Airfields", Departments of the Army and the Air Force, August 1988.
36. Air Force Pamphlet 10-219, Volume 4 “Rapid Runway Repair Operations”, HQ AFCESA/CEX 1 April 1997.
37. Aggour, M. Sherif. “Soil Dynamics” lecture, fall 2000. University of Maryland.
38. Shi, X.P., Fwa,T.F., Tan S.A., "Flexural Fatigue Strength of Plain Concrete" ACI Materials Journal, September-October 1993, Technical Paper Title no. 90-M46.
39. Singer, Ferdinand L., "Strength of Materials" 2Nd Edition, Harper & Row Publishers, New York 1962.
40. U.S. Department of Transportation “Federal Aviation Administration Advisory Circular (AC) # 150/5320-16 dated 10/22/1995.
41.Thompson, M.R. and Garg, N. “ Final Report Wheel Load Interaction: Critical Airport Pavement Responses” Federal Aviation Administration DOT 95-C-001, July 1999.

-
221
42. Garg, N. Tutumler, E. Thompson, M.R. “Structural Modeling Concepts for the Design of Airport Pavement for Heavy Aircraft” Department of Civil Engineering, University of Illinois.
43. United States Air Force Fact Sheet; “F-16 Fighting Falcon” Public Affairs Office; 115 Thompson St., Ste. 211; Langley Air Force Base, Va. 23665-1987.
44. USAF FACT SHEET “C141 Starlifter”; Air Mobility Command Public Affairs Office; 503 Ward Street, Suite 214; Scott AFB, IL 62225-5335.
45. USAF FACT SHEET “C-17 Globemaster”; Air Mobility Command Public Affairs Office; 503 Ward Street, Suite 214; Scott AFB, IL 62225-5335.
46. Goulias D., Schwartz C., “ High Performance Portland Cement Concrete Pavement” University of Maryland Draft Report, Feb 27,2002; Compressive Strength Test Results.
47. Holtz R., Barry C., Berg R., “Geosynthetic Engineering” BiTech Publishers Ltd., Richmond British Columbia, Canada.
48. E.I.Dupont de Nemours & Co. Technical Service Section, Explosive Products Division “Blasters Handbook” 175th Edition” Wilmington, Delaware 19898.
49. H. Kelsky "Stress Wave in Solids" Dover Publications Inc., New York 1963.
50. Mamlouk, Michael S. and Zaniewski, John P. “Materials for Civil and Construction Engineers”Addison Wesley Longman, Inc. 1999.
51. Richart, F.E; Hall, J.R; Woods R.D; "Vibrations of Soils and Foundations" Prentice-Hall International Series in Theoretical and Applied Mechanics.
52. Anderson, J.L.B, Schultz, P.H., Heineck, J.T.," Oblique Impact Ejecta Flow Fields; An Application of Maxwell's Z model." Geological Sciences, Brown University, Providence, R.I.., NASA Ames Research Center, Moffett Field, CA 94035.
53. Dowding, Charles H. "Construction Vibrations", Prentice Hall International Series in Civil Engineering Mechanics, 1996.
54. 11 Tawfiq, K., Armaghani, J., Ruiz, R. " Fatigue Cracking of Polypropylene Fiber Reinforced Concrete" ACI Materials Journal, March-April 1999, Technical Paper Title no. 96-M29.

-
222