abushaikha, ismail, salhieh, loay and towers, neil orcid ...eprints.glos.ac.uk/5801/1/5801 towers...
TRANSCRIPT

This is a peerreviewed, postprint (final draft postrefereeing) version of the following published document, This article is © Emerald Group Publishing and permission has been granted for this version to appear here http://eprints.glos.ac.uk/id/eprint/5801. Emerald does not grant permission for this article to be further copied/distributed or hosted elsewhere without the express permission from Emerald Group Publishing Limited. and is licensed under All Rights Reserved license:
Abushaikha, Ismail, Salhieh, Loay and Towers, Neil ORCID: 0000000225822241 (2018) Improving distribution and business performance through lean warehousing. International Journal of Retail and Distribution Management, 46 (8). pp. 780800. ISSN 09590552
Official URL: https://www.emeraldinsight.com/doi/full/10.1108/IJRDM0320180059DOI: http://dx.doi.org/10.1108/IJRDM0320180059EPrint URI: http://eprints.glos.ac.uk/id/eprint/5801
Disclaimer
The University of Gloucestershire has obtained warranties from all depositors as to their title in the material deposited and as to their right to deposit such material.
The University of Gloucestershire makes no representation or warranties of commercial utility, title, or fitness for a particular purpose or any other warranty, express or implied in respect of any material deposited.
The University of Gloucestershire makes no representation that the use of the materials will not infringe any patent, copyright, trademark or other property or proprietary rights.
The University of Gloucestershire accepts no liability for any infringement of intellectual property rights in any material deposited but will remove such material from public view pending investigation in the event of an allegation of any such infringement.
PLEASE SCROLL DOWN FOR TEXT.
1
Accepted for publication in International Journal of Retail & Distribution Management
All Rights Reserved
Improving distribution and business performance through lean warehousing
Ismail Abushaikha1, Loay Salhieh2, Neil Towers3
1. Ismail Abushaikha, Logistics Sciences Department, German-Jordanian
University, P. O. Box: 35247, Amman 11180, Jordan,
[email protected] (Corresponding Author)
2. Loay Salhieh, Graduate School of Business Administration, German-Jordanian
University, King Hussein Business Park, Amman, Jordan.
3. Neil Towers, University of Gloucestershire, Cheltenham, UK
2
Abstract
Purpose – Recent literature recognizes the role of warehouses in enhancing the overall
logistics performance. Thus, lean thinking has recently found its way in supporting
warehouse and distribution center operations. The purpose of this study is to examine
the relationships among warehouse waste reduction practices, warehouse operational
performance, distribution performance, and business performance.
Design/methodology/approach – A two-stage study was conducted. First, a Delphi
technique was adopted to develop a relevant questionnaire. Second, this questionnaire
was used to measure the degree of waste reduction in the different warehouse activities
and to test the developed research hypotheses. We test our hypotheses with a sample of
Middle Eastern warehouse operators.
Findings – There exists a positive relationship between warehouse waste reduction
level and both warehouse operational performance and distribution performance. There
was no direct relationship between warehouse waste reduction level and business
performance. However, results revealed that the relationship between warehouse waste
reduction level and business performance was mediated by warehouse operational
performance and distribution performance.
Practical implications – The developed instrument provides a guide for logistics
managers as to understand how to optimize waste in each warehousing activity. The
results also inform logistics managers of how distribution performance can be improved
through lean warehousing. The resulting performance improvements in the distribution
operations will ultimately be reflected in the logistics performance of downstream
retailers.
Originality/value – The study develops an original instrument for measuring waste
reduction in warehouses, and provides insights on the evolving lean warehousing
research area. This is the first scholarly work to uncover the relationships among
warehouse waste reduction practices, warehouse operational performance, distribution
performance and business performance.
Keywords: Lean, logistics, distribution, warehouse, performance, Delphi, Partial Least
Squares (PLS)
3
1. Introduction
Organizations have long strived to adopt effective managerial tools and techniques that
would improve the efficiency of their operations. This has largely been achieved
building on lean thinking and tools. Lean has been one of the most powerful managerial
philosophies in recent history (Womack and Jones, 1996; Womack and Jones, 2003;
Holweg, 2007; Villarreal et al., 2016; Shah and Khanzode, 2017). At the heart of
successful lean implementation is the concept of 'waste', which refers to the non-value
adding activities in a particular system. Waste can be defined as anything other than the
minimum activities and materials necessary to perform a particular process (Womack
and Jones, 1996). Although lean started as a production strategy, the Japanese
philosophy is now widely implemented in a wide range of industries. Lean principles
have been studied in production, operations, and business management literature
(Womack and Jones, 2003; Villarreal et al., 2009; Holweg, 2007; Shah and Khanzode,
2017). One research area in which waste reduction has been given a considerable
attention is within the field of logistics and supply chain management. For example,
within the particular area of logistics, scholars have carried out research on lean
transport (Salhieh et al., 2018), lean purchasing (Drake et al., 2013), and lean supply
chain (Drake et al., 2013; Myerson, 2012). However, coordinating warehouse
operations from a lean perspective have been given less attention than other logistics
functions (Gu et al., 2010; Bozer, 2012; Sharma and Shah, 2015; Shah and Khanzode,
2017). The importance of studying lean in warehousing and distribution operations is
that any performance improvement in the distribution operations will ultimately be
reflected in the logistics performance of downstream retailers (Pires et al., 2017;
Hübner et al., 2016) and the whole distribution channel (Satyam et al., 2017).
Warehouses can be viewed as a source of waste or non-value adding activities due to
the intensive operations they undertake (Gu et al., 2010; Battista et al., 2014). The
principles and managerial tools of lean philosophy have been "typically applied to
improve the internal logistics of the company and not the warehouse" (Dotoli et al.,
2015, p57). Thus, there is an opportunity to minimize non-value adding activities of
warehouses through identifying waste activities. We define warehouse waste reduction
practices as the set of activities undertaken by an organization to increase the overall
efficiency of the system. The few previous scholarly works on lean warehousing have
mostly aimed at discussing the opportunities of applying lean tools and applications in
4
the warehouse operations in order to reduce the time and cost of these operations.
However, literature still lacks a model to assess the level of waste reduction practices
in the warehouse environment. Therefore, developing an assessment tool is particularly
necessary, as the implementation of any lean warehousing activities should start by
evaluating the level of non-value adding activities in the current system (Sharma and
Shah, 2016). This research addresses this gap in literature and provides a model to
assess the level of waste reduction practices in warehouses. As such, the developed
instrument is expected to provide a guide to warehouse and logistics managers for
improving the level of waste reduction in the system. Achieving high efficiency levels
upstream in the warehousing function will lead to improved distribution and delivery
to retailers (Appelqvist et al., 2016; Pires et al., 2017; Hübner et al., 2016). Therefore,
the purpose of this study is to empirically test a research model identifying the
relationships among warehouse waste reduction practices, warehouse operational
performance, distribution performance, and business performance. This effort is
expected to advance existing research by investigating the links between these
relationships and integrating lean warehousing with distribution performance.
The next section presents the literature review, the proposed model and hypotheses.
The research methodology is described in the third section. The fourth section presents
the results of the empirical study and discusses the hypotheses. Conclusions are
discussed in Section 5. Finally, Section 6 presents the limitations and directions for
future research.
2. Literature review and research hypotheses
2.1 Lean warehousing
In recent years, there has been an increasing interest by supply chain management
scholars in the warehousing function as a research area within the field of logistics and
retail (Pires et al., 2017; Hübner et al., 2016). Warehouse management relates to
optimizing warehouse resources including inventory, material handling equipment,
loading/off-loading operations, staff, and ensuring innovative solutions are in place
(Rexhausen et al., 2012; Pires et al., 2017; Battista et al., 2014). The increasing need
to enhance supply chain performance has forced warehouses to focus on reducing non-
value adding activities (de Leeuw and Wiers, 2015; Faber et al., 2017; Salhieh and
5
Abushaikha, 2016). The term 'lean warehousing' is relatively new in literature (Sharma
and Shah, 2016). Analyzing the level of waste in the warehouse system is the first step
towards understanding leanness implementation in the organization (Womack and
Jones, 1996). Seeking perfection through reducing or eliminating waste is central to
lean philosophy and implementing lean principles and techniques (Villarreal et al.,
2016). Lean warehousing seeks to maximize the use of available warehouse resources
and activities through reducing or eliminating wastes in the logistics system. As a result,
this would lead to improve the quality of offered goods and services and optimize the
use of resources (Villarreal et al., 2016). Because of the unique characteristics of
service processes (Piercy and Rich, 2009), most service industries were reluctant to
borrow lean principles from manufacturing literature (Swank, 2003; Piercy and Rich,
2009). However, since companies started to recognize that competitive advantage in
service sectors can be attained through improved efficiencies, waste reduction practices
were adopted in the service industry (Douglas et al., 2015; Salhieh et al., 2018) and
distribution function (Villarreal et al., 2016). Because firms are seen as a collection of
processes, waste reduction practices were successfully adapted to and applied in the
service industry (Piercy and Rich, 2009).
Logistics and supply chain has been one of the areas in which waste reduction practices
were implemented successfully. In particular, warehousing and transportation
processes functions offer a good opportunity for reducing the wastes in the overall
logistics system (Villarreal et al., 2016; Sharma and Shah, 2016; Shah and Khanzode,
2017). Therefore, if the elimination of waste can be relevant to the service environment,
which differs significantly from a standard manufacturing environment, warehouse
operations should also be able to adopt the elimination of waste in its operations.
Several scholars (e.g. Hines et al., 2004; Gu et al., 2010; Bozer and Britten, 2012;
Gagliardi et al., 2012; Sharma and Shah, 2015; Sharma and Shah, 2016; Shah and
Khanzode, 2017) have discussed the importance of lean principles and their role in
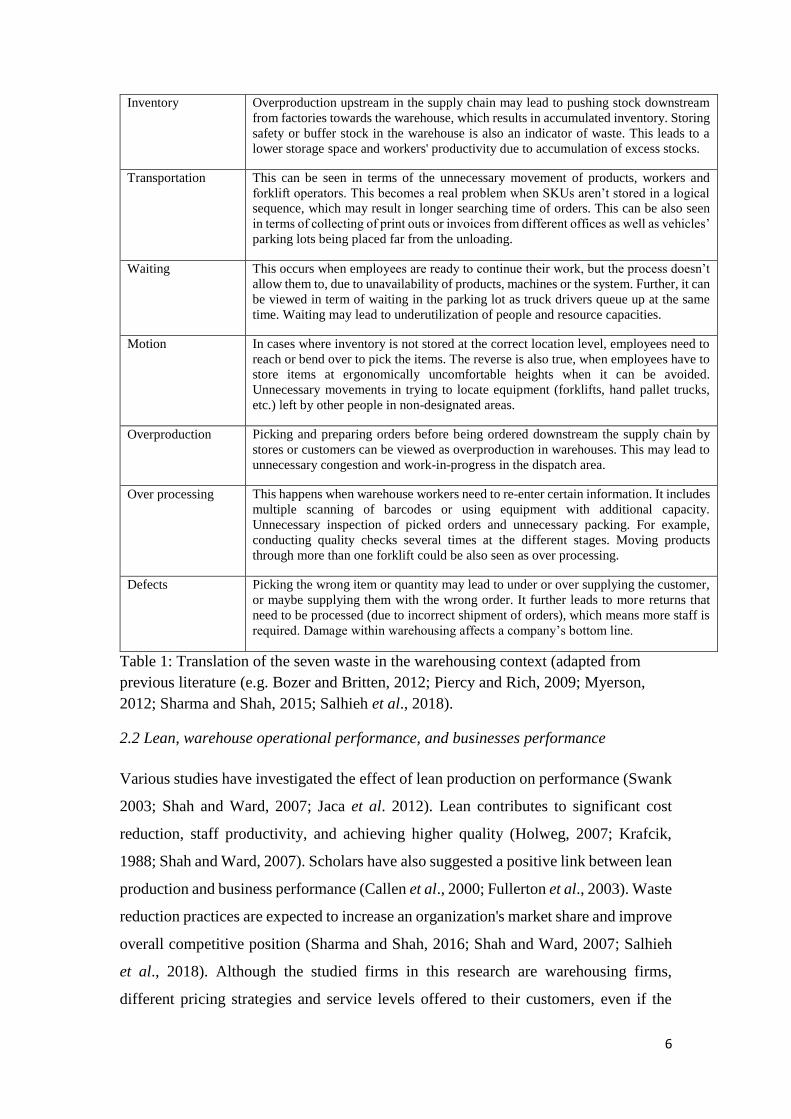
eliminating waste for warehouse operations. Bozer and Britten (2012) stated that the
most pertinent issues experienced by warehouses are known as the seven wastes, and
have related these wastes to lean principles as described in Table 1.
Original types of
waste identified by
lean manufacturing
Translation of waste in the warehouse environment
6
Inventory Overproduction upstream in the supply chain may lead to pushing stock downstream
from factories towards the warehouse, which results in accumulated inventory. Storing
safety or buffer stock in the warehouse is also an indicator of waste. This leads to a
lower storage space and workers' productivity due to accumulation of excess stocks.
Transportation This can be seen in terms of the unnecessary movement of products, workers and
forklift operators. This becomes a real problem when SKUs aren’t stored in a logical
sequence, which may result in longer searching time of orders. This can be also seen
in terms of collecting of print outs or invoices from different offices as well as vehicles’
parking lots being placed far from the unloading.
Waiting This occurs when employees are ready to continue their work, but the process doesn’t
allow them to, due to unavailability of products, machines or the system. Further, it can
be viewed in term of waiting in the parking lot as truck drivers queue up at the same
time. Waiting may lead to underutilization of people and resource capacities.
Motion In cases where inventory is not stored at the correct location level, employees need to
reach or bend over to pick the items. The reverse is also true, when employees have to
store items at ergonomically uncomfortable heights when it can be avoided.
Unnecessary movements in trying to locate equipment (forklifts, hand pallet trucks,
etc.) left by other people in non-designated areas.
Overproduction Picking and preparing orders before being ordered downstream the supply chain by
stores or customers can be viewed as overproduction in warehouses. This may lead to
unnecessary congestion and work-in-progress in the dispatch area.
Over processing This happens when warehouse workers need to re-enter certain information. It includes
multiple scanning of barcodes or using equipment with additional capacity.
Unnecessary inspection of picked orders and unnecessary packing. For example,
conducting quality checks several times at the different stages. Moving products
through more than one forklift could be also seen as over processing.
Defects Picking the wrong item or quantity may lead to under or over supplying the customer,
or maybe supplying them with the wrong order. It further leads to more returns that
need to be processed (due to incorrect shipment of orders), which means more staff is
required. Damage within warehousing affects a company’s bottom line.
Table 1: Translation of the seven waste in the warehousing context (adapted from
previous literature (e.g. Bozer and Britten, 2012; Piercy and Rich, 2009; Myerson,
2012; Sharma and Shah, 2015; Salhieh et al., 2018).
2.2 Lean, warehouse operational performance, and businesses performance
Various studies have investigated the effect of lean production on performance (Swank
2003; Shah and Ward, 2007; Jaca et al. 2012). Lean contributes to significant cost
reduction, staff productivity, and achieving higher quality (Holweg, 2007; Krafcik,
1988; Shah and Ward, 2007). Scholars have also suggested a positive link between lean
production and business performance (Callen et al., 2000; Fullerton et al., 2003). Waste
reduction practices are expected to increase an organization's market share and improve
overall competitive position (Sharma and Shah, 2016; Shah and Ward, 2007; Salhieh
et al., 2018). Although the studied firms in this research are warehousing firms,
different pricing strategies and service levels offered to their customers, even if the
7
warehouse is solely the firm’s business, may improve business performance. Therefore,
even if a warehouse as a business (e.g. warehouse operators) has a low level of waste
reduction practices, it might still have a greater level of business performance than its
rivalries who have high levels of waste practices in their warehouses. Hence, it
hypothesized that:
Hypothesis 1: Warehouse waste reduction practices have a positive relationship with
business performance
The effect of lean on performance has been traditionally studied with regard to lean
production (Swank, 2003; Shah and Ward, 2007; Jaca et al. 2012). There is a
predominant belief amongst scholars that lean contributes to improve operational
performance (Cua et al., 2001). This is viewed in terms of achieving significant cost
reduction, improved workforce productivity, quality and lead times (Holweg, 2007;
Shah and Ward, 2007). The link between lean production and operational performance
has been intensively researched and confirmed in literature (Crawford et al., 1988; Cua
et al., 2001; Laugen et al., 2005). Lean provides the warehousing operations with a
competitive edge by ensuring better stock control, improved picking accuracy, and
lower storage costs (Garcia, 2003; Sharma and Shah, 2016). Eliminating waste from
the warehouse activities may constitute a resource that enhances warehouse operational
performance. The assessment of warehouse waste reduction practices level will be
investigated in this study based on the flow of activities along the value stream in the
warehouse. In warehousing, the flow of activities can typically follow these steps:
Receiving – Offloading and inspection of goods to ensure correct quality and
quantity of delivered orders. (Frazelle, 2002; Garcia, 2003)
Put-away – Moving goods from the receiving area and storing them in the
suitable location for future picking orders. (Frazelle, 2002; Faber et al., 2013)
Picking – Once a customer has placed an order, the relevant goods are picked
and prepared for dispatch in an efficient and effective manner ((Frazelle, 2002;
Faber et al., 2013).
Despatch – As orders fulfilled, they are packed and made ready for delivery to
the customer. (Frazelle, 2002; Shah and Khanzode, 2017).
Capitalizing on the previous discussion, the second hypothesis has emerged:
8
Hypothesis 2: Warehouse waste reduction practices have a positive relationship with
warehouse operational performance
High levels of warehouse operational performance generally suggest that an
organization can have an efficient operation comparing to its competitors (Sharma and
Shah, 2016; Frazelle, 2002; Shah and Khanzode, 2017). This efficiency will in turn
enhance the organization's overall performance (Nawanir et al., 2013; Battista et al.,
2014; Salhieh et al., 2018; Shah and Khanzode, 2017; Appelqvist et al., 2016).
Warehouse operational performance can lead to high levels of economic performance,
thereby increasing profitability and market share (Garcia, 2003; Rexhausen et al., 2012;
Yang, 2016). The resource-based view (RBV) theory suggests that the ability of the
firm to coordinate internal resources efficiently can be a source of business competitive
advantage (Grant, 1991; Eng, 2016). Therefore, a positive relationship between
warehouse operational performance and business performance is proposed.
Hypothesis 3: Warehouse operational performance has a positive relationship with
business performance
2.3 The role of distribution function
Distribution is the logistics function, which is responsible for the physical movement
of goods and services downstream the supply chain towards retailers and end users
(Eng, 2016; Rexhausen et al., 2012; Satyam et al., 2017). Warehousing and distribution
functions have long been studied jointly due to their major role in the outbound logistics
operations and delivering goods to retail stores (Hübner et al., 2016; Rexhausen et al.,
2012; Von der Gracht and Darkow, 2010;). Firms can improve their distribution
performance through optimizing its warehouse design and operations (Rexhausen et
al., 2012; Shah and Khanzode, 2017; Hübner et al., 2016). Since companies started to
recognize that competitive advantage in logistics can be attained through improved
efficiencies, waste reduction practices were adopted in the field of logistics (Douglas
et al., 2015; Salhieh et al., 2018) and distribution function (Villarreal et al., 2016). The
importance of adopting lean principles for warehousing is that any performance
improvements in the warehouse operations will ultimately be reflected in the
performance of distributors, and retailers (Pires et al., 2017; Hübner et al., 2016).
Achieving efficiency in the coordination of internal resources (Grant, 1991), and
streamlining the different warehouse processes can contribute to improve the
9
performance in the customer-facing operations (Rexhausen et al., 2012; Shah and
Khanzode, 2017). Lean practices in the warehouse could improve the overall warehouse
performance in the context of distribution and retail (Shah and Khanzode, 2017).
Hence, the following two hypotheses are developed:
Hypothesis 4: Warehouse waste reduction practices have a positive relationship with
distribution performance
Hypothesis 5: Warehouse operational performance has a positive relationship with
distribution performance
Literature acknowledges the role of distribution in supporting other functions in the
organization and achieving higher customer satisfaction (Jaca et al. 2012; Rexhausen
et al., 2012; Towers and Xu, 2016; Villarreal et al., 2009; Pires et al., 2017; Shah and
Khanzode, 2017). A well-coordinated distribution channel enables firms to deliver
goods and services to end customers in a timely, efficient and effective way (Jaca et al.
2012; Towers and Xu, 2016; Appelqvist et al., 2016; Hübner et al., 2016; Satyam et
al., 2017). This largely relates to the efficient and effective management of transport
scheduling, deliveries, achieving a perfect order while maintaining an acceptable level
of service (Rexhausen et al., 2012; Villarreal et al., 2009). In addition, literature has
mounted an enormous effort to understand how capabilities may lead to improved
business performance. In line with the RBV, such capabilities are viewed in logistics
and supply chain management literature as a source of performance improvement
(Grant, 1991; Rexhausen et al., 2012, Eng, 2016). Leveraging distribution capabilities
may produce an improved performance for the organization (Eng, 2016; Yang, 2016)
by enabling timely and responsive deliveries. Building on this rationale and reviewing
the relevant literature, we formulate our sixth and last hypothesis:
Hypothesis 6: Distribution performance has a positive relationship with business
performance
10
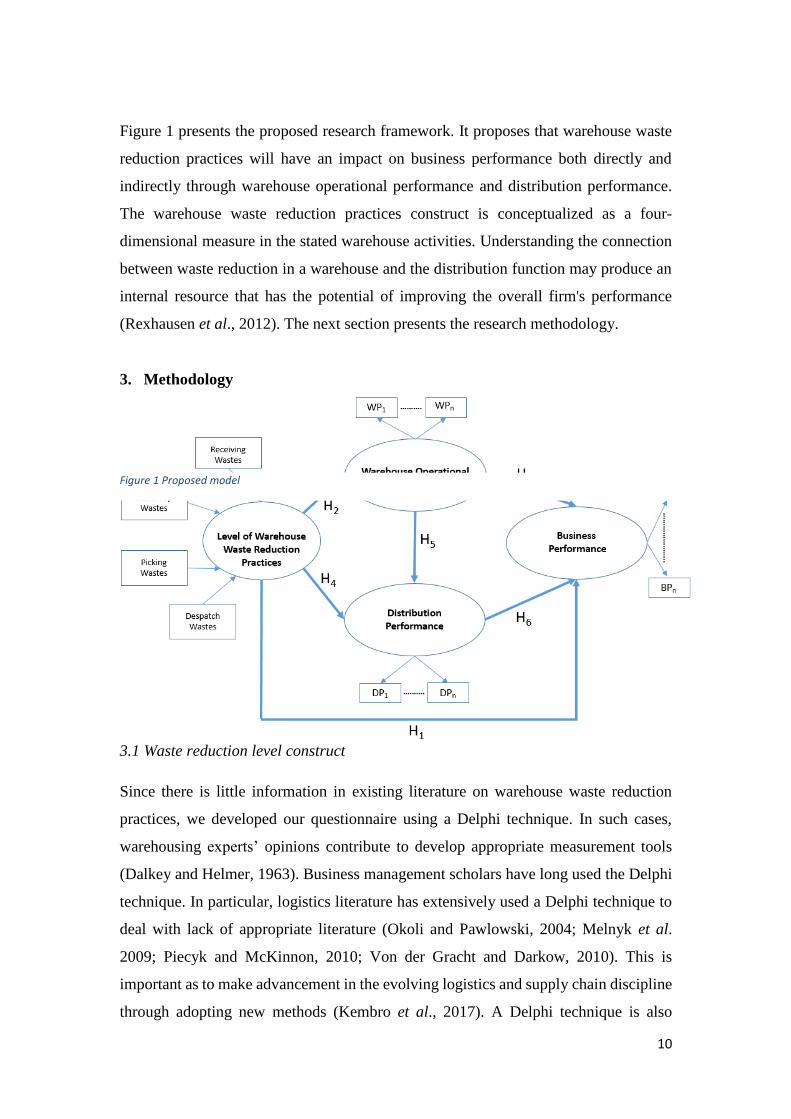
Figure 1 presents the proposed research framework. It proposes that warehouse waste
reduction practices will have an impact on business performance both directly and
indirectly through warehouse operational performance and distribution performance.
The warehouse waste reduction practices construct is conceptualized as a four-
dimensional measure in the stated warehouse activities. Understanding the connection
between waste reduction in a warehouse and the distribution function may produce an
internal resource that has the potential of improving the overall firm's performance
(Rexhausen et al., 2012). The next section presents the research methodology.
3. Methodology
3.1 Waste reduction level construct
Since there is little information in existing literature on warehouse waste reduction
practices, we developed our questionnaire using a Delphi technique. In such cases,
warehousing experts’ opinions contribute to develop appropriate measurement tools
(Dalkey and Helmer, 1963). Business management scholars have long used the Delphi
technique. In particular, logistics literature has extensively used a Delphi technique to
deal with lack of appropriate literature (Okoli and Pawlowski, 2004; Melnyk et al.
2009; Piecyk and McKinnon, 2010; Von der Gracht and Darkow, 2010). This is
important as to make advancement in the evolving logistics and supply chain discipline
through adopting new methods (Kembro et al., 2017). A Delphi technique is also
Figure 1 Proposed model
11
appropriate to develop the waste reduction construct due to the complexity of the
subject (Kembro et al., 2017), which requires the knowledge of the experts who
understand the different practices and activities that may generate waste within
warehouses. A Delphi technique is well suited as a method for consensus building by
using a series of questionnaires to gather qualitative data from experts (Dalkey and
Helmer, 1963; Kembro et al., 2017) in the field of warehousing and distribution. Okoli
and Pawlowski (2004) recommend adopting rigorous guidelines for selecting experts
to include in the study. In contrast, other researchers prefer to interpret the phrase
“expert panel” broadly as the individuals involved in the work. This study included
practitioners who had a minimum of five-year experience in managerial positions
related to warehouse and distribution management. For academicians, the panelists
were chosen for their experience in teaching warehousing and/or, their scholarly
publication history in lean thinking and logistics. The use of experienced and
knowledgeable participants in the subject area (i.e. warehousing and distribution
management) may help to improve content validity of the Delphi study (Dalkey and
Helmer, 1963; Okoli and Pawlowski (2004). In deciding whom to invite to join the
expert panel from the academic community, we utilized our network of German and
Jordanian lecturers in the logistics academic programs as well as German consultants
in the field of warehousing. In addition, two of the investigators of this paper had
previously worked in the logistics industry in Jordan and the Gulf Cooperation
Countries (GCC); thus, they were able to gain a good access to logistics experts and
major companies. The first investigator focused on collecting evidence from
international experts from Germany and GCC. He was also responsible for maintaining
a database of all necessary communication with participants. The second investigator
was able to collect evidence from the Jordanian panel members involved in the study.
He was also responsible for revising the updated experts' questionnaire and calculating
the Kendall’s coefficient of concordance shown below.
Okoli and Pawlowski (2004) recommended 10-18 participants on a Delphi panel. In
this current study, the expert panel size was 12 participants, of whom 6 practitioners
and 6 academicians. Although the number of participants is relatively small, the
purpose was only to gather qualitative information from the experts. Data was collected
from panel experts over 18-month period between 2016 and 2017. The Delphi process
was conducted repeatedly until consensus was determined to have been achieved
12
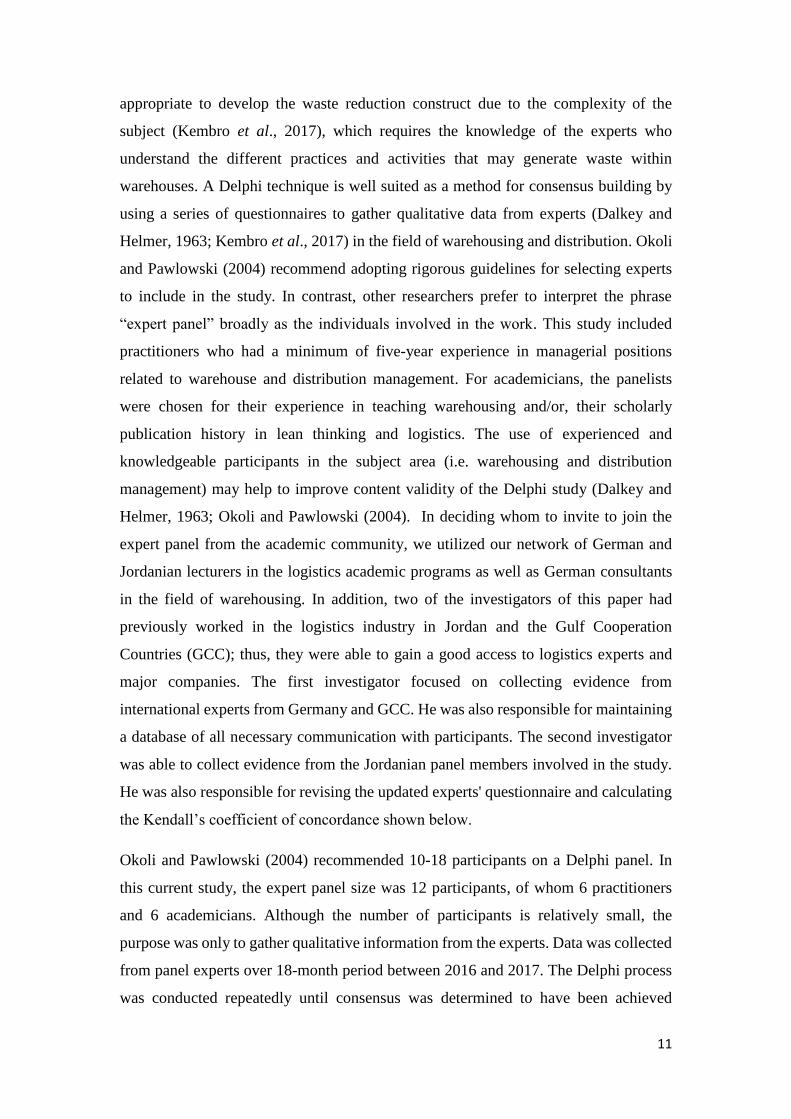
(Kembro et al., 2017). The first round was a brainstorming stage, in which participants
suggested a list of items of warehouse waste reduction practices. In the second round,
experts reviewed and rated the developed items as to their relevancy to the construct.
Although there was some comments concerned with the priorities of the factors,
depending on the warehouse types, the responses from this round suggested a strong
agreement on the constructs. In the final round, experts revised their input according to
the ratings produced in the previous stage, which resulted in the final instrument. Table
2 below details the data collection iterations of the Delphi study.
Round Purpose Description Output
Round 1
This is a brainstorming stage
in which panelists were
asked to respond to open-
ended questions
Questions were targeted to
identify as many as waste
reduction practices in receiving,
put-away, picking, and dispatch
activities.
This data collection stage resulted
in developing a structured
questionnaire based on the
panelists opinions.
Round 2
The developed structured
questionnaire was sent to
panelists during this stage of
data collection.
Panelists were asked to review the
questionnaire items, which were
developed after first stage. This is
to rate items as to their relevancy
and applicability in capturing
waste reduction practices in the
investigated warehouse activities
on a four-point Likert-type scale.
At this stage, areas of
disagreement and agreement are
identified and consensus started
to emerge.
Round 3
Each expert received a
questionnaire that included
the items and ratings
summarized by the authors in
the second round and were
asked to revise their
judgments.
Kendall’s coefficient of
concordance was used to estimate
the level of consensus between
among panelists.
The final items constitute the
waste-reduction construct. These
are used as our instrument to
measure the statistical significant
relationships among waste-
reduction practices in the
warehouse.
Table 2: A summary of Delphi technique used (following recommendations by
Ludwig (1997) and Schmidt (1997))
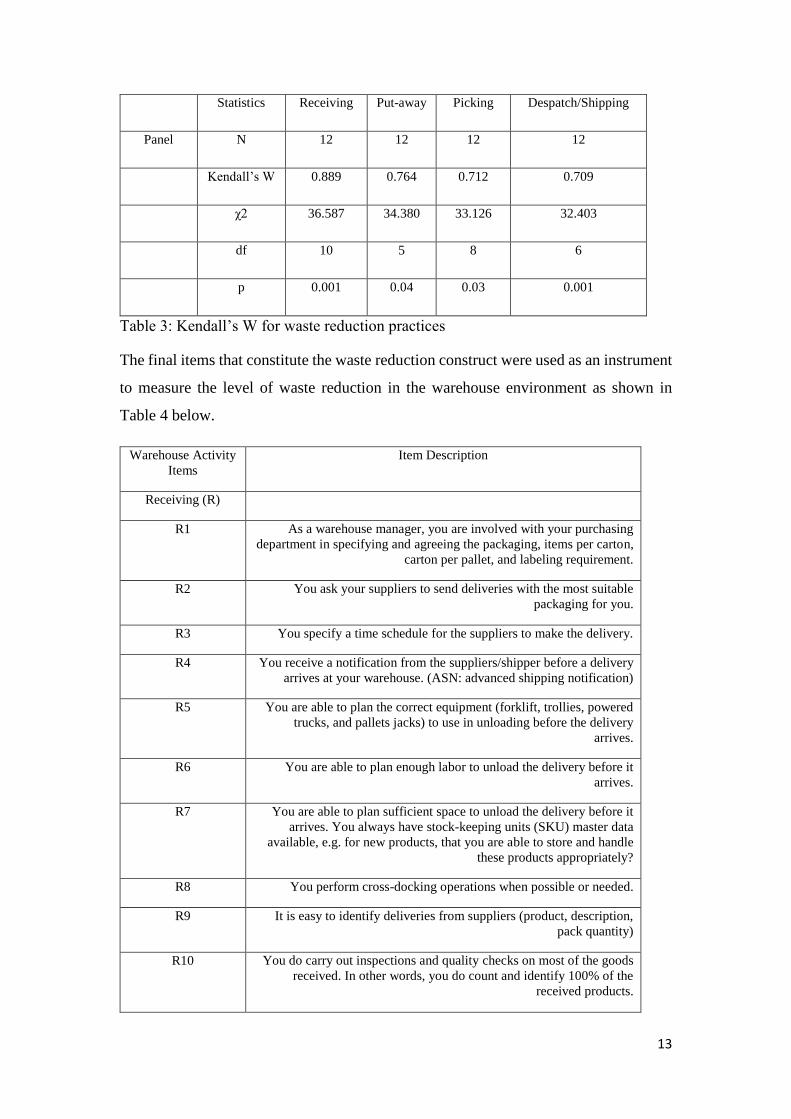
Table 3 below shows the result of Kendall’s coefficient of concordance. Kendall’s W
of 0.7 or higher is considered as strong agreement (Schmidt, 1997). This is important
as to estimate the level of consensus among the panel’s members.
13
Statistics Receiving Put-away Picking Despatch/Shipping
Panel N 12 12 12 12
Kendall’s W 0.889 0.764 0.712 0.709
χ2 36.587 34.380 33.126 32.403
df 10 5 8 6
p 0.001 0.04 0.03 0.001
Table 3: Kendall’s W for waste reduction practices
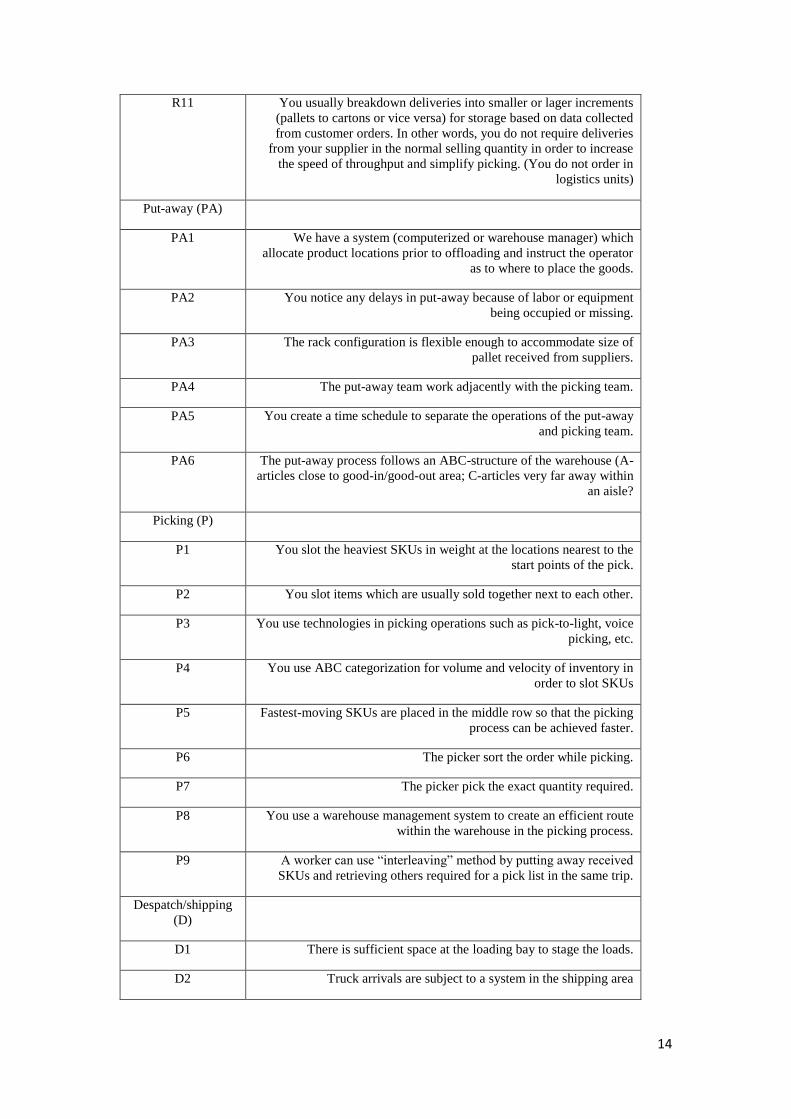
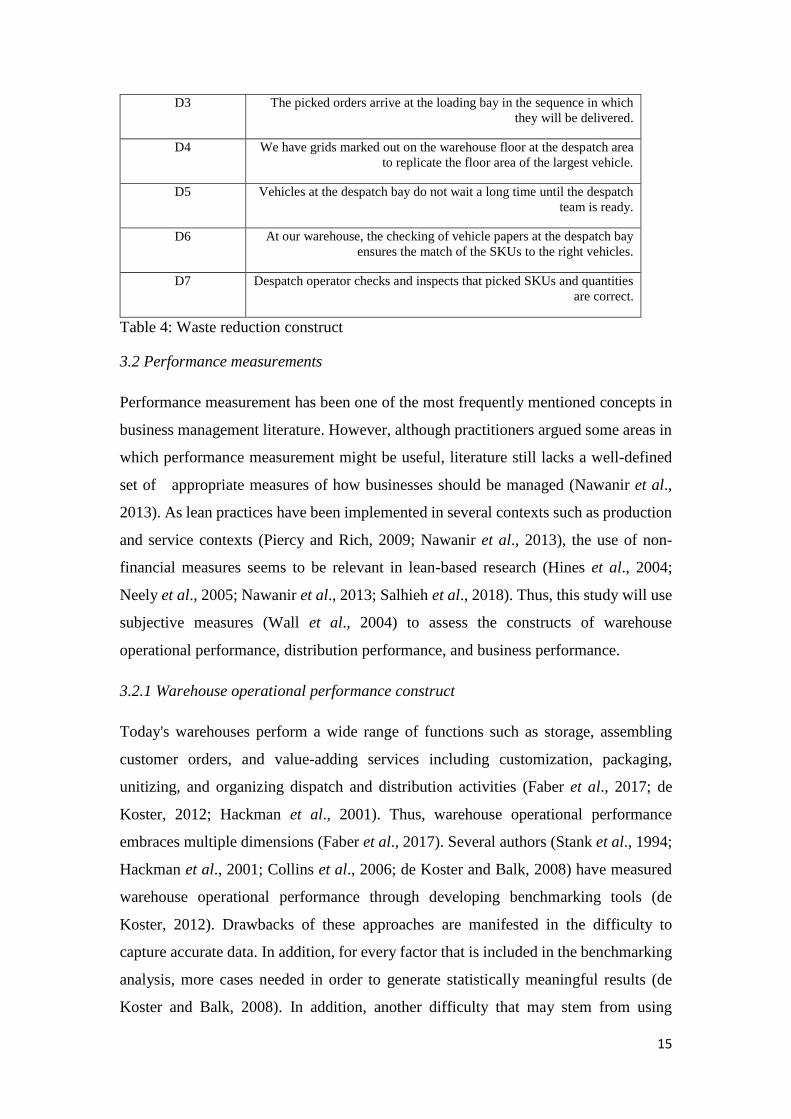
The final items that constitute the waste reduction construct were used as an instrument
to measure the level of waste reduction in the warehouse environment as shown in
Table 4 below.
Warehouse Activity
Items
Item Description
Receiving (R)
R1 As a warehouse manager, you are involved with your purchasing
department in specifying and agreeing the packaging, items per carton,
carton per pallet, and labeling requirement.
R2 You ask your suppliers to send deliveries with the most suitable
packaging for you.
R3 You specify a time schedule for the suppliers to make the delivery.
R4 You receive a notification from the suppliers/shipper before a delivery
arrives at your warehouse. (ASN: advanced shipping notification)
R5 You are able to plan the correct equipment (forklift, trollies, powered
trucks, and pallets jacks) to use in unloading before the delivery
arrives.
R6 You are able to plan enough labor to unload the delivery before it
arrives.
R7 You are able to plan sufficient space to unload the delivery before it
arrives. You always have stock-keeping units (SKU) master data
available, e.g. for new products, that you are able to store and handle
these products appropriately?
R8 You perform cross-docking operations when possible or needed.
R9 It is easy to identify deliveries from suppliers (product, description,
pack quantity)
R10 You do carry out inspections and quality checks on most of the goods
received. In other words, you do count and identify 100% of the
received products.
14
R11 You usually breakdown deliveries into smaller or lager increments
(pallets to cartons or vice versa) for storage based on data collected
from customer orders. In other words, you do not require deliveries
from your supplier in the normal selling quantity in order to increase
the speed of throughput and simplify picking. (You do not order in
logistics units)
Put-away (PA)
PA1 We have a system (computerized or warehouse manager) which
allocate product locations prior to offloading and instruct the operator
as to where to place the goods.
PA2 You notice any delays in put-away because of labor or equipment
being occupied or missing.
PA3 The rack configuration is flexible enough to accommodate size of
pallet received from suppliers.
PA4 The put-away team work adjacently with the picking team.
PA5 You create a time schedule to separate the operations of the put-away
and picking team.
PA6 The put-away process follows an ABC-structure of the warehouse (A-
articles close to good-in/good-out area; C-articles very far away within
an aisle?
Picking (P)
P1 You slot the heaviest SKUs in weight at the locations nearest to the
start points of the pick.
P2 You slot items which are usually sold together next to each other.
P3 You use technologies in picking operations such as pick-to-light, voice
picking, etc.
P4 You use ABC categorization for volume and velocity of inventory in
order to slot SKUs
P5 Fastest-moving SKUs are placed in the middle row so that the picking
process can be achieved faster.
P6 The picker sort the order while picking.
P7 The picker pick the exact quantity required.
P8 You use a warehouse management system to create an efficient route
within the warehouse in the picking process.
P9 A worker can use “interleaving” method by putting away received
SKUs and retrieving others required for a pick list in the same trip.
Despatch/shipping
(D)
D1 There is sufficient space at the loading bay to stage the loads.
D2 Truck arrivals are subject to a system in the shipping area
15
D3 The picked orders arrive at the loading bay in the sequence in which
they will be delivered.
D4 We have grids marked out on the warehouse floor at the despatch area
to replicate the floor area of the largest vehicle.
D5 Vehicles at the despatch bay do not wait a long time until the despatch
team is ready.
D6 At our warehouse, the checking of vehicle papers at the despatch bay
ensures the match of the SKUs to the right vehicles.
D7 Despatch operator checks and inspects that picked SKUs and quantities
are correct.
Table 4: Waste reduction construct
3.2 Performance measurements
Performance measurement has been one of the most frequently mentioned concepts in
business management literature. However, although practitioners argued some areas in
which performance measurement might be useful, literature still lacks a well-defined
set of appropriate measures of how businesses should be managed (Nawanir et al.,
2013). As lean practices have been implemented in several contexts such as production
and service contexts (Piercy and Rich, 2009; Nawanir et al., 2013), the use of non-
financial measures seems to be relevant in lean-based research (Hines et al., 2004;
Neely et al., 2005; Nawanir et al., 2013; Salhieh et al., 2018). Thus, this study will use
subjective measures (Wall et al., 2004) to assess the constructs of warehouse
operational performance, distribution performance, and business performance.
3.2.1 Warehouse operational performance construct
Today's warehouses perform a wide range of functions such as storage, assembling
customer orders, and value-adding services including customization, packaging,
unitizing, and organizing dispatch and distribution activities (Faber et al., 2017; de
Koster, 2012; Hackman et al., 2001). Thus, warehouse operational performance
embraces multiple dimensions (Faber et al., 2017). Several authors (Stank et al., 1994;
Hackman et al., 2001; Collins et al., 2006; de Koster and Balk, 2008) have measured
warehouse operational performance through developing benchmarking tools (de
Koster, 2012). Drawbacks of these approaches are manifested in the difficulty to
capture accurate data. In addition, for every factor that is included in the benchmarking
analysis, more cases needed in order to generate statistically meaningful results (de
Koster and Balk, 2008). In addition, another difficulty that may stem from using
16
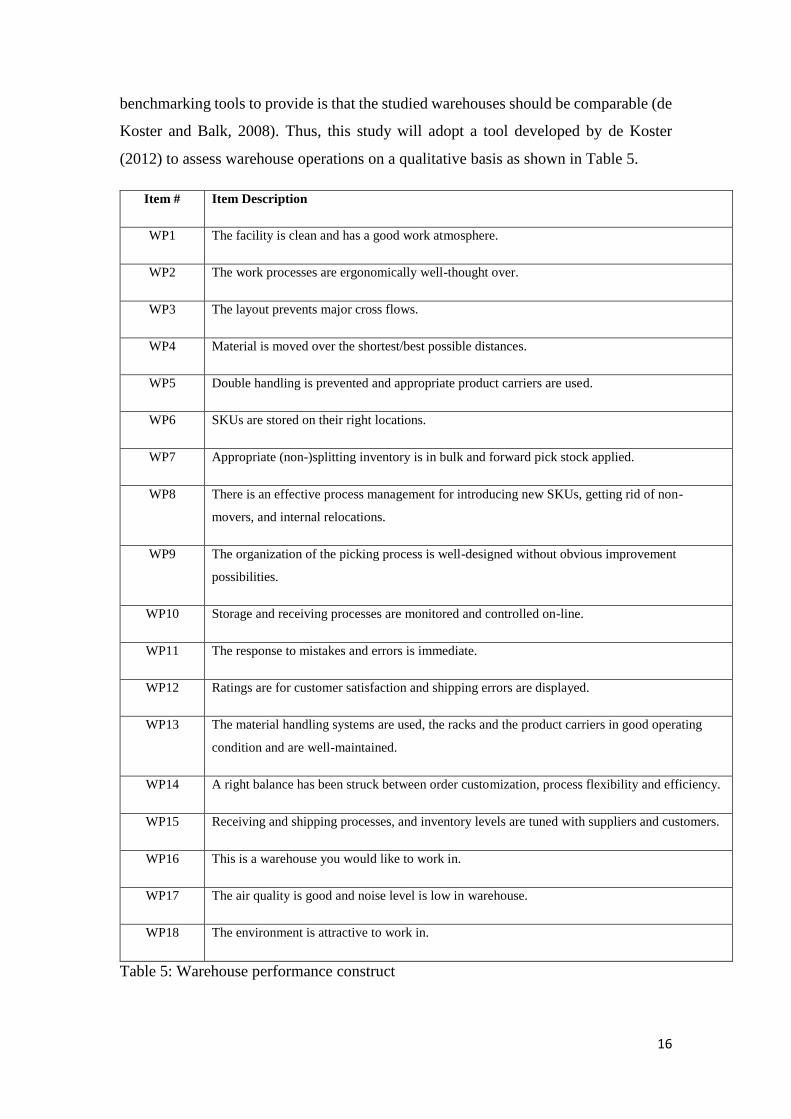
benchmarking tools to provide is that the studied warehouses should be comparable (de
Koster and Balk, 2008). Thus, this study will adopt a tool developed by de Koster
(2012) to assess warehouse operations on a qualitative basis as shown in Table 5.
Item # Item Description
WP1 The facility is clean and has a good work atmosphere.
WP2 The work processes are ergonomically well-thought over.
WP3 The layout prevents major cross flows.
WP4 Material is moved over the shortest/best possible distances.
WP5 Double handling is prevented and appropriate product carriers are used.
WP6 SKUs are stored on their right locations.
WP7 Appropriate (non-)splitting inventory is in bulk and forward pick stock applied.
WP8 There is an effective process management for introducing new SKUs, getting rid of non-
movers, and internal relocations.
WP9 The organization of the picking process is well-designed without obvious improvement
possibilities.
WP10 Storage and receiving processes are monitored and controlled on-line.
WP11 The response to mistakes and errors is immediate.
WP12 Ratings are for customer satisfaction and shipping errors are displayed.
WP13 The material handling systems are used, the racks and the product carriers in good operating
condition and are well-maintained.
WP14 A right balance has been struck between order customization, process flexibility and efficiency.
WP15 Receiving and shipping processes, and inventory levels are tuned with suppliers and customers.
WP16 This is a warehouse you would like to work in.
WP17 The air quality is good and noise level is low in warehouse.
WP18 The environment is attractive to work in.
Table 5: Warehouse performance construct
17
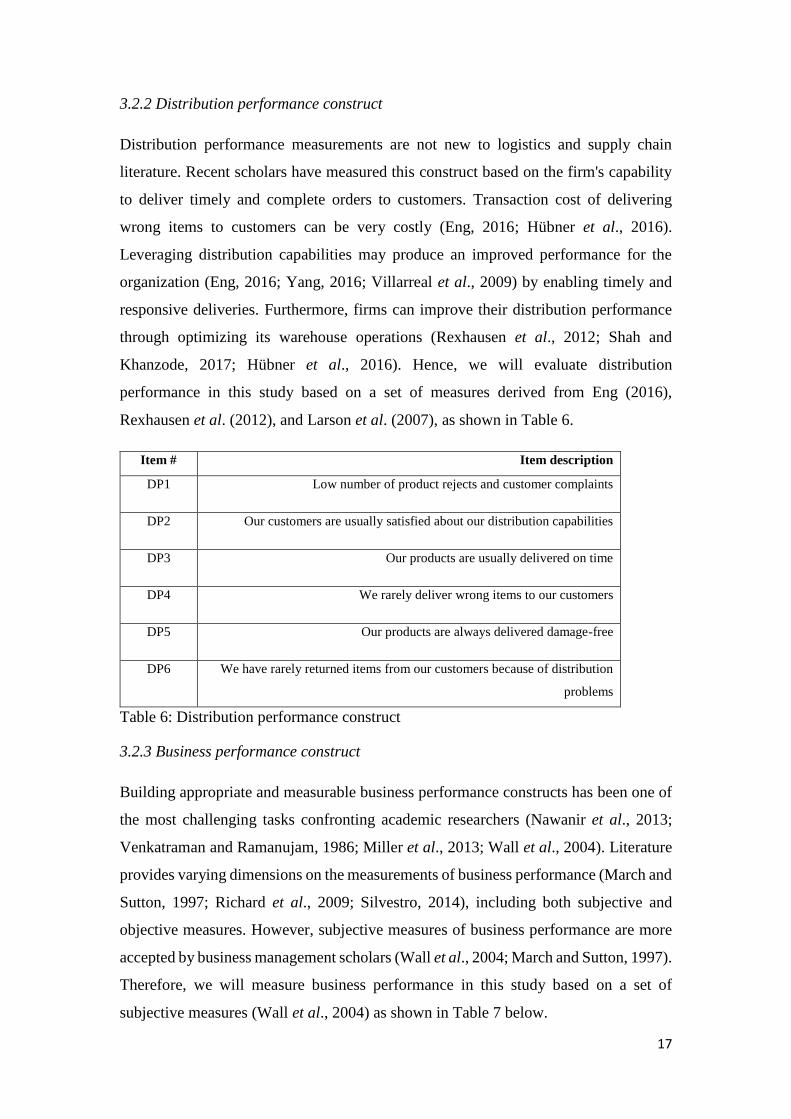
3.2.2 Distribution performance construct
Distribution performance measurements are not new to logistics and supply chain
literature. Recent scholars have measured this construct based on the firm's capability
to deliver timely and complete orders to customers. Transaction cost of delivering
wrong items to customers can be very costly (Eng, 2016; Hübner et al., 2016).
Leveraging distribution capabilities may produce an improved performance for the
organization (Eng, 2016; Yang, 2016; Villarreal et al., 2009) by enabling timely and
responsive deliveries. Furthermore, firms can improve their distribution performance
through optimizing its warehouse operations (Rexhausen et al., 2012; Shah and
Khanzode, 2017; Hübner et al., 2016). Hence, we will evaluate distribution
performance in this study based on a set of measures derived from Eng (2016),
Rexhausen et al. (2012), and Larson et al. (2007), as shown in Table 6.
Item # Item description
DP1 Low number of product rejects and customer complaints
DP2 Our customers are usually satisfied about our distribution capabilities
DP3 Our products are usually delivered on time
DP4 We rarely deliver wrong items to our customers
DP5 Our products are always delivered damage-free
DP6 We have rarely returned items from our customers because of distribution
problems
Table 6: Distribution performance construct
3.2.3 Business performance construct
Building appropriate and measurable business performance constructs has been one of
the most challenging tasks confronting academic researchers (Nawanir et al., 2013;
Venkatraman and Ramanujam, 1986; Miller et al., 2013; Wall et al., 2004). Literature
provides varying dimensions on the measurements of business performance (March and
Sutton, 1997; Richard et al., 2009; Silvestro, 2014), including both subjective and
objective measures. However, subjective measures of business performance are more
accepted by business management scholars (Wall et al., 2004; March and Sutton, 1997).
Therefore, we will measure business performance in this study based on a set of
subjective measures (Wall et al., 2004) as shown in Table 7 below.

18
Item # Item description
BP1 We have superior quality of service compared to our competitors.
BP2 Our profitability has exceeded our competitors.
BP3 Our revenue growth rate has exceeded our competitors.
BP4 Our market share growth has exceeded our competitors.
BP5 Our customers are satisfied with our company’s delivery lead-time
compared to our competitors.
BP6 Our overall competitive position is better than that of our competitors.
Table 7: Business performance construct
3.3 Research sample, measures and validation methods
The population of this study comprised warehouse operators, who owned and operated
at least one warehouse with distribution activities, from Jordan, Saudi Arabia, United
Arab Emirates (UAE), Oman, and Kuwait. Despite the various classifications of
warehouses (Pires et al., 2017), the essential difference between them is related to the
perspectives of the sources, management and users of the warehouses (Van den Berg
and Zijm, 1999; Frazelle, 2002). However, these warehouses are similar in terms of the
nature of operations and activities they carry out (Pires et al., 2017). This includes
receiving, storing, picking and despatching activities. The sampling frame consisted of
90 firms operating in the mentioned countries. Participants were purposively chosen
from a population of logistics, warehouse/distribution, and general managers. The
purposive sampling technique used was a homogeneous sampling. A homogeneous
sample is chosen when the research question answered is particular to the
characteristics of a certain group. In the case of this research, it is a group of warehouse
and distribution employees. Furthermore, purposive sampling also enables other
researchers to determine the generalization possibility of the research to other settings.
The developed survey tool is administered in three mailings following a modified
version of Dillman’s (1978) “Total design for survey research”. In the first e-mail, a
covering letter explaining the purpose of the study together with the survey
questionnaire was sent. Emails were sent four weeks later to remind and encourage non-
respondents to participate in the research. Follow ups were made through phone calls,
as two investigators had business with, or had some contacts at a number of the
surveyed companies. Seven weeks after the initial e-mailing, a second survey was
emailed to the rest of non-respondents. The resulting sample is made up of 270 usable
responses (related questionnaires were sent to logistics, warehouse/distribution, and
19
general managers), which constituted 90 firms. Therefore, responses on every measured
construct were aggregated for each firm. Early versus late respondents were compared
(Armstrong and Overton, 1997) and no statistically significant differences were found
on any of the study variables. As two of the investigators of this paper had previously
worked in the logistics industry in several countries in the Middle East, the research
team was able to gain high accessibility to warehouse operators from the studied
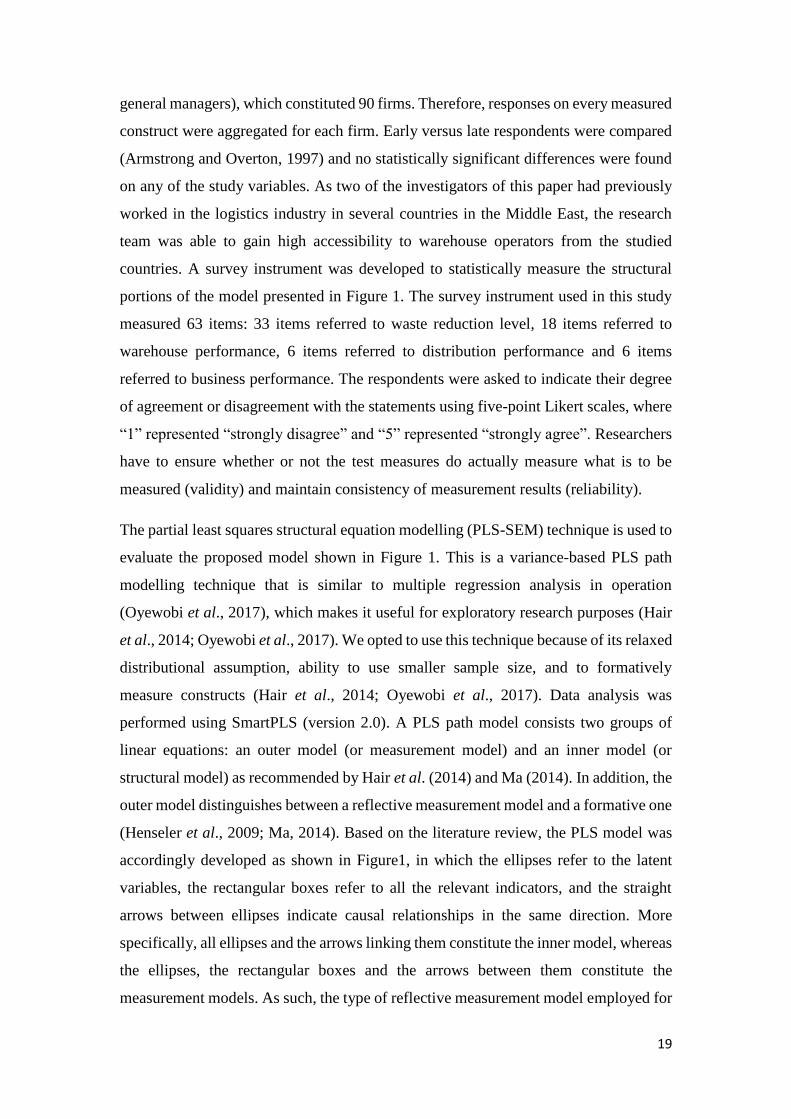
countries. A survey instrument was developed to statistically measure the structural
portions of the model presented in Figure 1. The survey instrument used in this study
measured 63 items: 33 items referred to waste reduction level, 18 items referred to
warehouse performance, 6 items referred to distribution performance and 6 items
referred to business performance. The respondents were asked to indicate their degree
of agreement or disagreement with the statements using five-point Likert scales, where
“1” represented “strongly disagree” and “5” represented “strongly agree”. Researchers
have to ensure whether or not the test measures do actually measure what is to be
measured (validity) and maintain consistency of measurement results (reliability).
The partial least squares structural equation modelling (PLS-SEM) technique is used to
evaluate the proposed model shown in Figure 1. This is a variance-based PLS path
modelling technique that is similar to multiple regression analysis in operation
(Oyewobi et al., 2017), which makes it useful for exploratory research purposes (Hair
et al., 2014; Oyewobi et al., 2017). We opted to use this technique because of its relaxed
distributional assumption, ability to use smaller sample size, and to formatively
measure constructs (Hair et al., 2014; Oyewobi et al., 2017). Data analysis was
performed using SmartPLS (version 2.0). A PLS path model consists two groups of
linear equations: an outer model (or measurement model) and an inner model (or
structural model) as recommended by Hair et al. (2014) and Ma (2014). In addition, the
outer model distinguishes between a reflective measurement model and a formative one
(Henseler et al., 2009; Ma, 2014). Based on the literature review, the PLS model was
accordingly developed as shown in Figure1, in which the ellipses refer to the latent
variables, the rectangular boxes refer to all the relevant indicators, and the straight
arrows between ellipses indicate causal relationships in the same direction. More
specifically, all ellipses and the arrows linking them constitute the inner model, whereas
the ellipses, the rectangular boxes and the arrows between them constitute the
measurement models. As such, the type of reflective measurement model employed for
20
latent variables of Warehouse Operational Performance, Distribution Performance and
Business Performance. Their reflective indicators measure the values of these
unobservable constructs, whereas the type of formative measurement model was used
to depict the relationships between latent variables (Level of Warehouse Waste
Reduction Practices) and related indicators (Ma, 2014; Hair et al., 2014). Hence, the
formative indicators will form the values of the latent variables. Therefore, the direction
of the arrows between the ellipses and relevant rectangular boxes expresses the type of
measurement model.
4. Results and discussions
The literature review in this paper suggested that warehouses are similar in terms of the
nature of operations and activities they perform regardless of their size. This includes
receiving, put-way, picking and despatching activities (Frazelle, 2002; Faber et al.,
2013; Faber et al., 2017). Thus, there was no control variables for the firm size.
However, we included the country as a control variable. In total, 13 per cent of the
sampled firms were from Jordan (12 firms), 32 per cent from Saudi Arabia (29 firms),
27 per cent from UAE (25 firms), 12 per cent from Oman (11 firms), and 14 per cent
from Kuwait (13 firms). The results show that country had no significant effect on
business performance (−0.00 at p > 0.05). Most Middle Eastern countries, in particular
Gulf Cooperation Countries (GCC), such as Oman, Saudi Arabia, Kuwait and UAE,
are similar in the way they run their operations and the overall business environment
(Belwal and Belwal, 2017). This applies also to most distribution channels in emerging
markets (Satyam et al., 2017). Moreover, recent research (e.g. Faber et al., 2017)
suggested that companies based in Western Europe are similar in terms of the nature of
warehousing and distribution activities they perform.
To evaluate the results of the PLS path model, a two-step process has been followed as
suggested by Chin (2010) and Ma (2014). The first step focuses on the assessment of
the measurement model by estimating reliability and validity of item measures used in
the conceptual model. The path coefficients are then assessed in the second step. In the
outer model, the reflective measurement model and formative measurement model
should be assessed. Reflective measurement models should be assessed in terms of
reliability, which includes internal consistency of latent variables and reliability of all
indicators, and validity, which includes convergent validity and discriminant validity
21
(Ma, 2014). The reliability assessment should meet the composite reliability (ρc) of at
least 0.7 (Chin, 2010; Oyewobi et al., 2017), and a latent variable should explain a
substantial part (at least 50%) of each indicator’s variance. Thus, the absolute
correlations, that is the absolute standardized outer loadings, between a construct and
each of its indicators must be greater than 0.7 so that all the indicators are reliable (Chin,
2010; Henseler et al., 2009). As for validity assessment, an average variance extracted
(AVE) value should be higher than 0.5, which means that a latent variable will be able
to explain at least 50% of the variance of the relative indicators on average (Henseler
et al., 2009; Ma, 2014). The AVE index is suggested to measure a reflective model’s
convergent validity. For discriminant validity, Fornell-Larcker criterion suggests that a
latent variable shares more variance with its assigned indicators than with any other
latent variable. The AVE of each latent variable must be greater than the latent
variable’s highest squared correlation with any other latent variable (Fornell and
Larcker, 1981; Hair et al., 2014; Henseler et al., 2009).
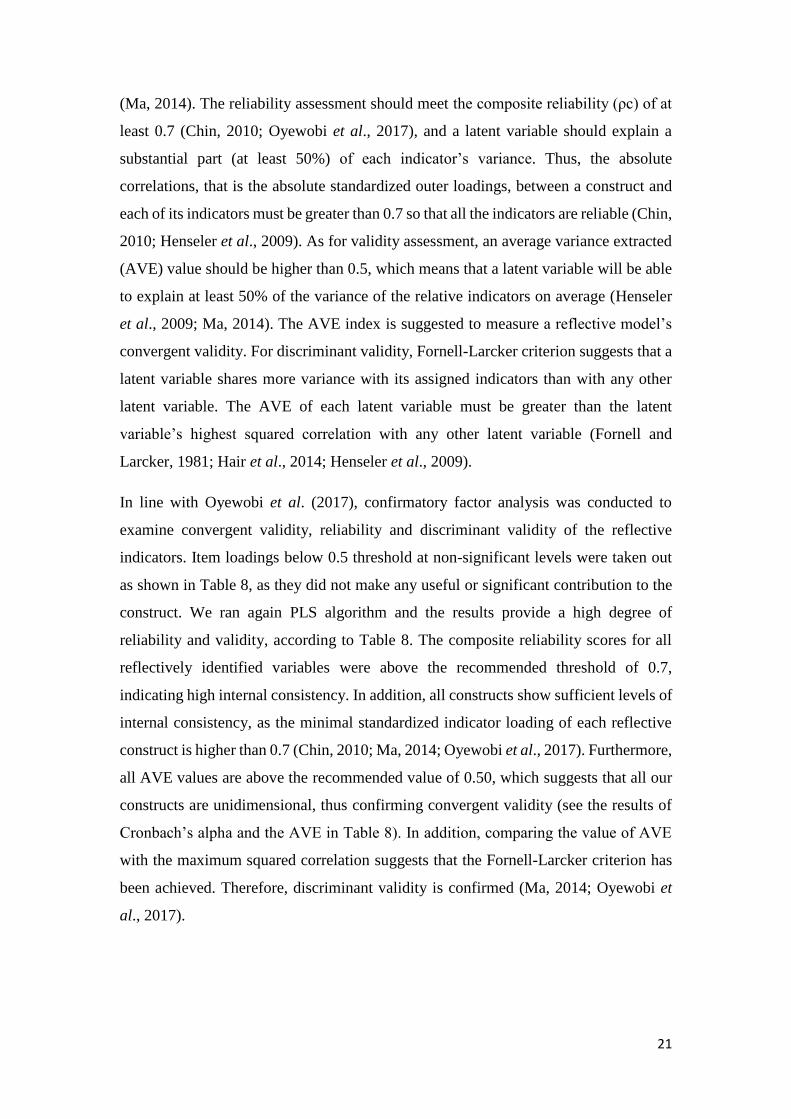
In line with Oyewobi et al. (2017), confirmatory factor analysis was conducted to
examine convergent validity, reliability and discriminant validity of the reflective
indicators. Item loadings below 0.5 threshold at non-significant levels were taken out
as shown in Table 8, as they did not make any useful or significant contribution to the
construct. We ran again PLS algorithm and the results provide a high degree of
reliability and validity, according to Table 8. The composite reliability scores for all
reflectively identified variables were above the recommended threshold of 0.7,
indicating high internal consistency. In addition, all constructs show sufficient levels of
internal consistency, as the minimal standardized indicator loading of each reflective
construct is higher than 0.7 (Chin, 2010; Ma, 2014; Oyewobi et al., 2017). Furthermore,
all AVE values are above the recommended value of 0.50, which suggests that all our
constructs are unidimensional, thus confirming convergent validity (see the results of
Cronbach’s alpha and the AVE in Table 8). In addition, comparing the value of AVE
with the maximum squared correlation suggests that the Fornell-Larcker criterion has
been achieved. Therefore, discriminant validity is confirmed (Ma, 2014; Oyewobi et
al., 2017).

22
Latent
variable
Deleted
Items
Composite
reliability
score
Min.
standardized
indicator
loading
AVE Cronbach’s
alpha
Max. squared
correlation
with
latent variables
Mean of
retained
items
WP (2,10,14,17) 0.885 0.717 0.671 0.783 0.391 3.47
DP (1) 0.871 0.746 0.701 0.799 0.212 3.12
BP (1) 0.901 0.8765 0.823 0.831 0.521 3.31
Table 8: Assessment of the reflective measurement model
Concerning the formative measurement model, reliability is an irrelevant criterion for
assessing measurement quality (Diamantopoulos, 2006). Conventional procedures used
to assess the validity and reliability of reflective indicators are not appropriate for
indexes with formative indicators (Diamantopoulos, 2006; Henseler et al., 2009). This
study used different steps and criteria to establish validity such as nomological validity
(Rossiter, 2002), and statistical analyses (Henseler et al., 2009). The Nomological
validity was considered using the Delphi method (Rossiter, 2002) presented in the
previous section. The results of the various statistical analysis is presented in Table 9
below. The non-parametric bootstrapping procedure (500 samples) produced t-values
indicating significance of the latent variable, and of most of the formative indicators
(Ma, 2014). Moreover, the variance inflation factors (VIF), calculated using the SPSS
linear regression function, do not indicate redundancy of any of the indicators
(Diamantopoulos, 2006). Moreover, researchers should not discard formative
indicators simply because of statistical outcomes, as this might lead to change the
content of the formative index (Henseler et al., 2009; Ma, 2014). Thus, as long as they
are conceptually justified, both significant and insignificant formative indicators should
remain in the measurement model.
23
Latent variable/indicator Bootstrap t-values VIF Mean of retained items
Level of Warehouse Waste
Reduction Practices
5.441 N/A 3.14
Receiving 6.131 1.021 3.54
Put-away 3.131 1.407 3.85
Picking 1.718 1.011 3.01
Despatch 4.767 1.435 2.15
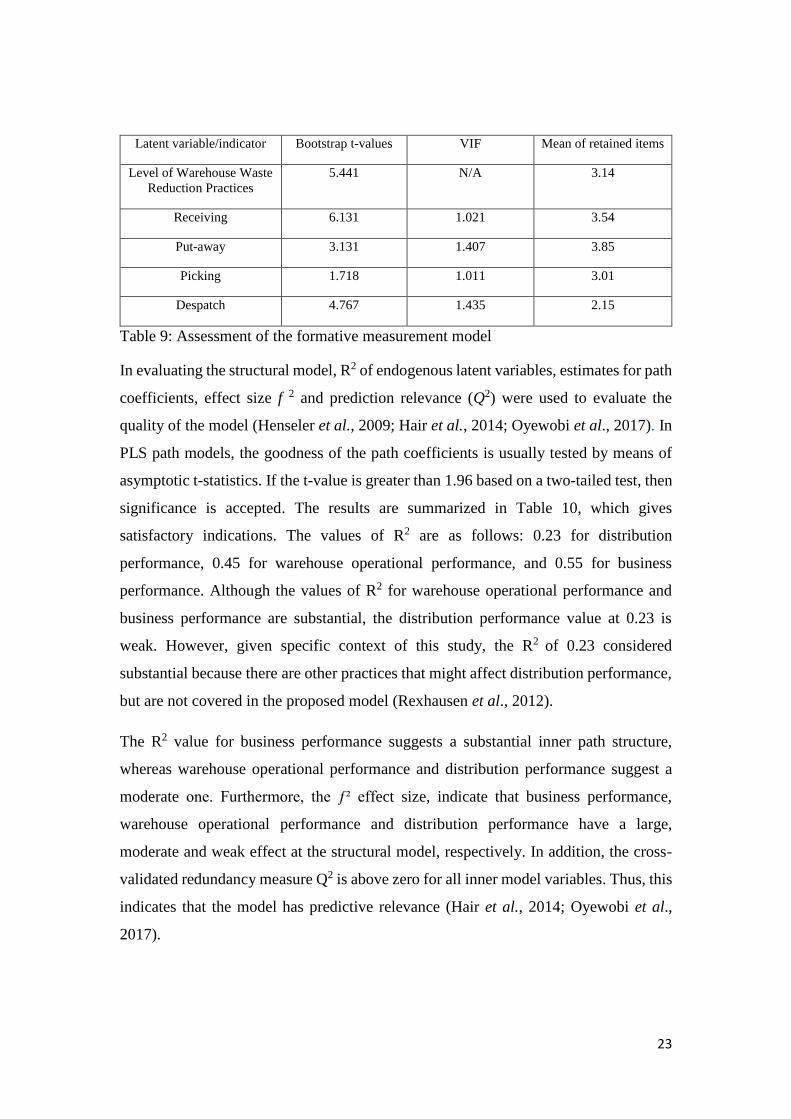
Table 9: Assessment of the formative measurement model
In evaluating the structural model, R2 of endogenous latent variables, estimates for path
coefficients, effect size f 2 and prediction relevance (Q2) were used to evaluate the
quality of the model (Henseler et al., 2009; Hair et al., 2014; Oyewobi et al., 2017). In
PLS path models, the goodness of the path coefficients is usually tested by means of
asymptotic t-statistics. If the t-value is greater than 1.96 based on a two-tailed test, then
significance is accepted. The results are summarized in Table 10, which gives
satisfactory indications. The values of R2 are as follows: 0.23 for distribution
performance, 0.45 for warehouse operational performance, and 0.55 for business
performance. Although the values of R2 for warehouse operational performance and
business performance are substantial, the distribution performance value at 0.23 is
weak. However, given specific context of this study, the R2 of 0.23 considered
substantial because there are other practices that might affect distribution performance,
but are not covered in the proposed model (Rexhausen et al., 2012).
The R2 value for business performance suggests a substantial inner path structure,
whereas warehouse operational performance and distribution performance suggest a
moderate one. Furthermore, the ƒ² effect size, indicate that business performance,
warehouse operational performance and distribution performance have a large,
moderate and weak effect at the structural model, respectively. In addition, the cross-
validated redundancy measure Q2 is above zero for all inner model variables. Thus, this
indicates that the model has predictive relevance (Hair et al., 2014; Oyewobi et al.,
2017).
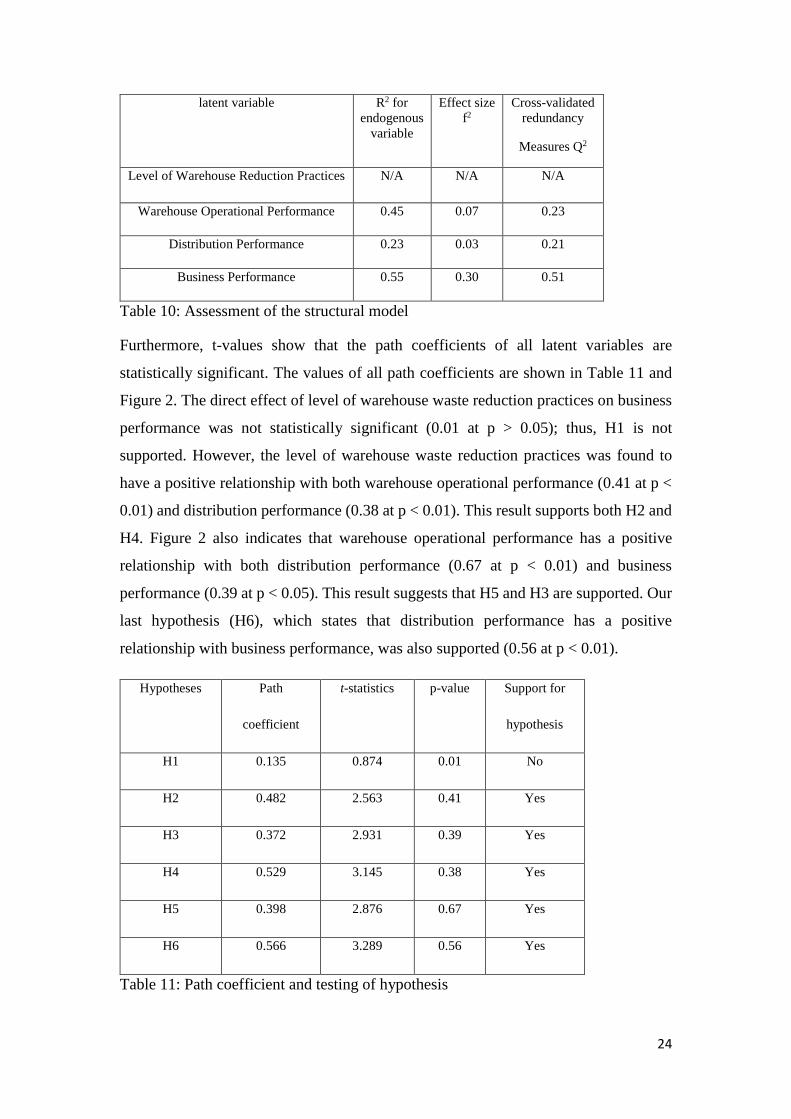
24
latent variable R2 for
endogenous
variable
Effect size
f2
Cross-validated
redundancy
Measures Q2
Level of Warehouse Reduction Practices N/A N/A N/A
Warehouse Operational Performance 0.45 0.07 0.23
Distribution Performance 0.23 0.03 0.21
Business Performance 0.55 0.30 0.51
Table 10: Assessment of the structural model
Furthermore, t-values show that the path coefficients of all latent variables are
statistically significant. The values of all path coefficients are shown in Table 11 and
Figure 2. The direct effect of level of warehouse waste reduction practices on business
performance was not statistically significant (0.01 at p > 0.05); thus, H1 is not
supported. However, the level of warehouse waste reduction practices was found to
have a positive relationship with both warehouse operational performance (0.41 at p <
0.01) and distribution performance (0.38 at p < 0.01). This result supports both H2 and
H4. Figure 2 also indicates that warehouse operational performance has a positive
relationship with both distribution performance (0.67 at p < 0.01) and business
performance (0.39 at p < 0.05). This result suggests that H5 and H3 are supported. Our
last hypothesis (H6), which states that distribution performance has a positive
relationship with business performance, was also supported (0.56 at p < 0.01).
Hypotheses Path
coefficient
t-statistics p-value Support for
hypothesis
H1 0.135 0.874 0.01 No
H2 0.482 2.563 0.41 Yes
H3 0.372 2.931 0.39 Yes
H4 0.529 3.145 0.38 Yes
H5 0.398 2.876 0.67 Yes
H6 0.566 3.289 0.56 Yes
Table 11: Path coefficient and testing of hypothesis
25
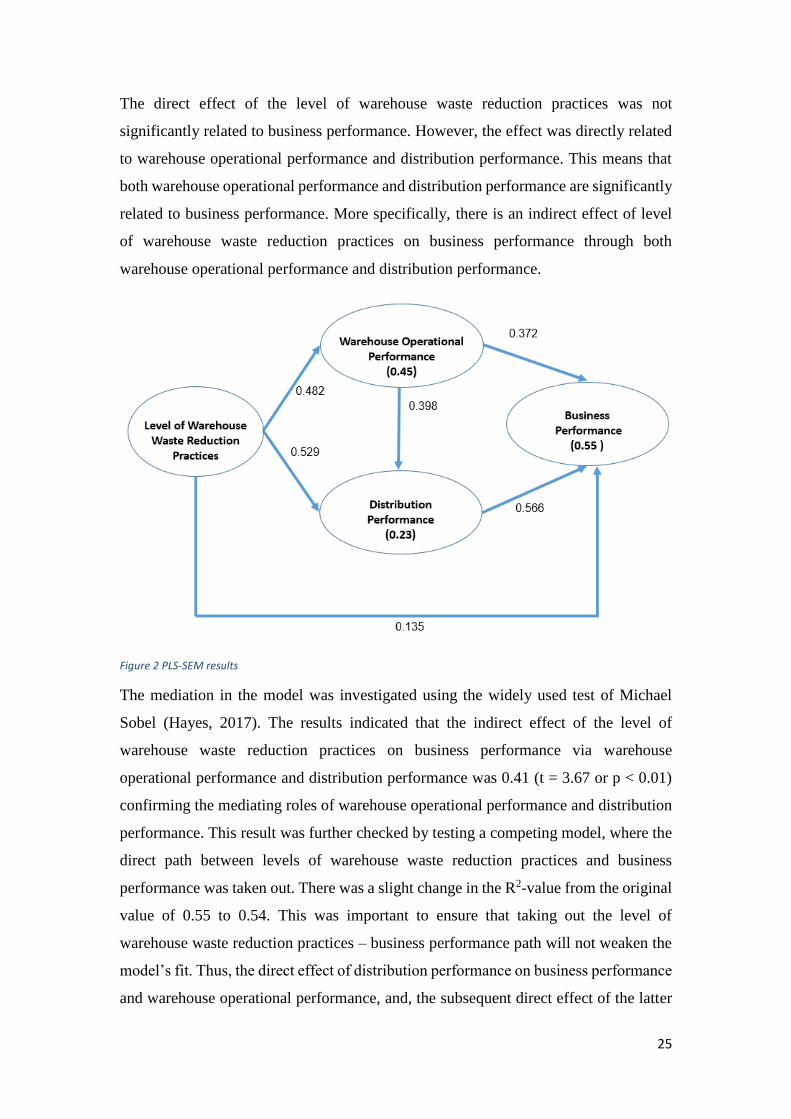
The direct effect of the level of warehouse waste reduction practices was not
significantly related to business performance. However, the effect was directly related
to warehouse operational performance and distribution performance. This means that
both warehouse operational performance and distribution performance are significantly
related to business performance. More specifically, there is an indirect effect of level
of warehouse waste reduction practices on business performance through both
warehouse operational performance and distribution performance.
Figure 2 PLS-SEM results
The mediation in the model was investigated using the widely used test of Michael
Sobel (Hayes, 2017). The results indicated that the indirect effect of the level of
warehouse waste reduction practices on business performance via warehouse
operational performance and distribution performance was 0.41 (t = 3.67 or p < 0.01)
confirming the mediating roles of warehouse operational performance and distribution
performance. This result was further checked by testing a competing model, where the
direct path between levels of warehouse waste reduction practices and business
performance was taken out. There was a slight change in the R2-value from the original
value of 0.55 to 0.54. This was important to ensure that taking out the level of
warehouse waste reduction practices – business performance path will not weaken the
model’s fit. Thus, the direct effect of distribution performance on business performance
and warehouse operational performance, and, the subsequent direct effect of the latter
26
on business performance suggest that warehouse operational performance partially
mediates the relationship between distribution performance and business performance.
In addition, the effect of the level of warehouse waste reduction practices on business
performance is fully mediated by both warehouse operational performance and
distribution performance. The findings are congruent with the previous findings of
(Garcia, 2003; Sharma and Shah, 2016; Shah and Khanzode, 2017), who found a
significant link between lean practices and improving warehouse operational
performance. The study findings are also consistent with previous research who
suggested that improvement in the efficiency of warehouse operations would improve
the overall distribution performance (Rexhausen et al., 2012; Appelqvist et al., 2016).
Our study findings also corroborates with recent literature on waste reduction practices
and its link to logistics activities. In particular, our results align with recent studies on
waste reduction in transportation such as those of Salhieh et al. (2018), and (Villarreal
et al., 2016), who found that waste reduction practices improve the efficiency of road
haulage efficiency.
The general assumption in literature is that waste and lean practices directly affect
business performance (Shah and Ward, 2007; Nawanir et al., 2013). However, this
current study improves our understanding of how waste reduction practices in a
warehousing context could be translated into improved business performance. Thus,
the finding that the effect of the level of warehouse waste reduction practices on
business performance is fully mediated by both warehouse operational performance and
distribution performance is an important contribution to the logistics and distribution
literature. Next section introduces conclusions, including theoretical and managerial
implications.
5. Conclusions
5.1 Theoretical implications
Although recent literature recognizes the role of warehouses in enhancing the overall
efficiency of logistics operations, there is still a dearth of research of how waste
reduction practices relate to the warehouse environment. This study contributes to the
application of lean thinking to reduce waste levels in the warehouse operations. This
has been achieved through translating the original types of wastes to the warehouse
27
environment, but also through developing an instrument for measuring warehouse
waste reduction practices, based on a Delphi study. This is the first scholarly work to
empirically test the relationships among warehouse waste reduction practices,
warehouse operational performance, distribution performance, and business
performance. The importance of studying lean in warehousing and distribution
operations is that any performance improvement in the distribution operations will
ultimately be reflected in the logistics performance of downstream retailers (Pires et
al., 2017; Hübner et al., 2016) and the whole distribution channel (Satyam et al., 2017).
Thus, this study has contributed to existing literature by investigating the links between
the various performance relationships and integrating lean warehousing with
distribution performance.
The study showed that warehouse waste reduction level has a significant positive
impact on warehouse operational performance and distribution performance. The
findings also suggested that firms with high levels of warehouse operational
performance achieved high levels of distribution and business performance. In line with
the RBV, understanding the connection between waste reduction in a warehouse and
the distribution function may produce an internal resource that has the potential to
improve the overall firm's performance (Grant, 1991; Rexhausen et al., 2012; Eng,
2016). In addition, by eliminating waste from the warehouse activities, firms may
enhance their distribution capabilities significantly (Rexhausen et al., 2012). Achieving
high efficiency levels upstream in the warehousing function will lead to improved
delivery performance to retailers (Appelqvist et al., 2016; Pires et al., 2017; Hübner et
al., 2016).
Our study is different from previous studies (e.g. Shah and Ward, 2007; Dotoli et al.,
2015; Faber et al., 2017) in that it provides a full exploration of the underlying
mechanisms between warehouse waste reduction practices and business performance
through understanding the mediating role of warehouse operational performance and
distribution performance in this relationship. Furthermore, the majority of previous
literature on lean warehousing was based on a qualitative case study methodology
employing lean tools and investigating benchmarking improvements before and after
the implementation (Sharma and Shah; 2016; Dotoli et al., 2015). This current study
differs from previous research in that it investigated performance relationships
28
empirically by developing an assessment tool of warehouse waste reduction practices.
Since there are several classifications of warehouses (Frazelle, 2002; Bozer and Britten,
2012; de Leeuw and Wiers, 2015; Pires et al., 2017), and the principles of lean
warehousing do not change by the type of warehouse (Bozer and Britten, 2012), the
results of this study should be applicable to most types of warehouses.
5.2 Managerial implications
This research provides practical implications for logistics and distribution managers.
The developed instrument provides a guide for managers as to understand waste
reduction practices that could be adopted to improve warehouse operational
performance. This guide is seen in the instrument of warehouse waste reduction
practices developed based on the input of academic and professional experts. For
example, it helps them understand the sources of wastes in their warehouses but also
how to optimize any non-value adding activities in the receiving, put-away, picking,
and despatch operations. Efforts to reduce or eliminate waste in the warehouse activities
should lead to improved warehouse operational performance and in turn (directly and
indirectly) improved distribution performance and consequently, higher business
performance. Thus, this suggests that distribution channel members including
distributors and retailers can enhance the performance of their distribution operations
through implementing lean principles upstream in the warehousing function. Such
improvement in the "distribution channel is crucial to succeed in the retail sector across
the globe, especially in the case of emerging economies due to their complex
distribution structure" (Satyam et al., 2017, p1061). As a result, this may lead to
improved logistics performance for retailers (Appelqvist et al., 2016; Pires et al., 2017;
Hübner et al., 2016; Satyam et al., 2017).
6. Limitations and future research
This study has a number of limitations, which makes avenues for future studies in the
warehousing field. Although most previous studies on lean warehousing have been
largely based on an in-depth analysis through lean tools, by conducting a survey-based
research, our study provided findings that are more generalizable. However, our results
derived from only a sample of Middle Eastern companies; thus, future researchers could
carry out a wider international investigation of warehouse waste reduction practices.
29
A more stringent test of the relationships among waste reduction level construct,
warehouse operational performance, distribution performance, and business
performance requires a longitudinal study, or field experiment, which could involve
gathering data over a longer time span. Then, the association between the variation of
independent factors and the variation of performance could be further investigated.
Future researchers also invited to use the developed theoretical model and its instrument
to test its validity, and consequently raise the state of knowledge of lean practices within
the warehousing research area.
References
Appelqvist, P., Babongo, F., Chavez-Demoulin, V., Hameri, A. P. and Niemi, T.
(2016), "Weather and supply chain performance in sport goods distribution",
International Journal of Retail & Distribution Management, Vol. 44 No. 2, pp.
178-202.
Armstrong, J. and Overton, T. (1977), “Estimating nonresponse bias in mail surveys”,
Journal of Marketing Research, Vol. 14 No. 3, pp. 396-402.
Battista, C., Fumi, A., Laura, L. and M. Schiraldi, M. (2014), "Multiproduct slot
allocation heuristic to minimize storage space", International Journal of Retail &
Distribution Management, Vol. 42 No. 3, pp. 172-186.
Belwal, R. and Belwal, S. (2017), "Factors affecting store image and the choice of
hypermarkets in Oman", International Journal of Retail & Distribution
Management, Vol. 45 No. 6, pp. 587-607.
Bollen, K. and Long, J. (1993), Testing Structural Equation Models, Sage Publications,
Newbury Park, CA.
Bozer, Y. A. and Britten, R. (2012), "Developing and Adapting Lean Tools/Techniques
to Build New Curriculum/Training Program in Warehousing and Logistics",
University of Michigan Department of Industrial and Operations Engineering.
Byrne, B. M. (2016), Structural equation modeling with AMOS: Basic concepts,
applications, and programming, Routledge.
Callen, J.L., Fader, C. and Krinsky, I. (2000), “Just-in-time: a cross-sectional plant
analysis”, International Journal of Production Economics, Vol. 63 No. 3, pp. 277-
301.
Carter, C. R., Meschnig, G. and Kaufmann, L. (2015), "Moving to the next level: Why
our discipline needs more multilevel theorization", Journal of Supply Chain
Management, Vol. 51 No. 4, pp. 94-102.
Chau, P. (1997), “Re-examining a model for evaluating information center success
using a structural equation modelling approach”, Decision Sciences, Vol. 28 No.
2, pp. 309-34.
Chin, W.W. (2010), “How to write up and report PLS analyses”, in Esposito Vinzi, V.,
Chin, W.W., Henseler, J. and Wang, H. (Eds.), Handbook of Partial Least
Squares: Concepts, Methods and Applications, Springer-Verlag, Berlin,
Heidelberg, pp. 655-690.
Coakes, S.J. and Steed, L. (2007), SPSS 14.0 for Windows: Analysis without Anguish,
Wiley, Richmond.

30
Collins, T.R., Rossetti, M.D., Nachtmann, H.L. and Oldham, J.R. (2006), “The use of
multi-attribute utility theory to determine the overall best-in-class performer in a
benchmarking study”, Benchmarking, Vol. 13 No. 4, pp. 431–446.
Crawford, K.M., Blackstoe Jr, J.H. and Cox, J.M. (1988), “A study of JIT
implementation and operating problems”, International Journal of Production
Research, Vol. 26 No. 9, pp. 1561-1568.
Cua, K.O., McKone, K.E. and Schroeder, R.G. (2001), “Relationships between
implementation of TQM, JIT, and TPM and manufacturing performance”, Journal
of Operations Management, Vol. 19 No. 6, pp. 675-694.
Dalkey, N. and Helmer, O. (1963), “An experimental application of the DELPHI
method to the use of experts”, Management Science., Vol. 9 No. 3, pp. 458-467.
de Koster, M. D. and Balk, B. M. (2008), "Benchmarking and monitoring international
warehouse operations in Europe", Production and Operations Management, Vol.
17 No. 2, pp. 175-183
de Koster, M.B.M. (2012), "Warehouse assessment in a single tour", In Warehousing
in the Global Supply Chain, pp. 457-473, Springer, London.
de Leeuw, S., and Wiers, V. C. (2015), “Warehouse manpower planning strategies in
times of financial crisis: evidence from logistics service providers and retailers in
the Netherlands”, Production Planning and Control, Vol. 26 No. 4, pp. 328-337.
Diamantopoulos, A. (2006), "The error term in formative measurement models:
interpretation and modeling implications", Journal of Modelling in Management,
Vol. 1 No.1, pp. 7–17.
Dillman, D. (1978), Mail and Telephone Surveys: The Total Design Method, John
Wiley. New York, NY.
Douglas, J., Antony, J. and Douglas, A. (2015), “Waste identification and elimination
in HEIs: the role of Lean thinking”, International Journal of Quality and
Reliability Management, Vol. 32 No. 9, pp. 970-981.
Drake, P. R., Myung Lee, D., and Hussain, M. (2013), "The lean and agile purchasing
portfolio model", Supply Chain Management: An International Journal, Vol. 18
No. 1, pp. 3-20.
Eng, T. Y. (2016), "An empirical study of Chinese SME grocery retailers’ distribution
capabilities", Supply Chain Management: An International Journal, Vol. 21 No.
1, pp. 63-77.
Faber, N., de Koster, M. B. M. and Smidts, A. (2013), "Organizing warehouse
management, International Journal of Operations and Production Management,
Vol. 33 No. 9, pp. 1230-1256.
Faber, N., de Koster, R. B., and Smidts, A. (2017). Survival of the fittest: the impact of
fit between warehouse management structure and warehouse context on warehouse
performance. International Journal of Production Research, 1-20.
Fornell, C. and Larcker, D. (1981), "Evaluating structural equation models with
unobservable variables and measurement error", Journal of Marketing Research,
Vol. 18 No. 1, pp. 39-50.
Frazelle. E. (2002), World-class warehousing and material handling. New York, NY:
McGraw-Hill.
Fullerton, R.R., McWatters, C.S. and Fawson, C. (2003), “An examination of the
relationship between JIT and financial performance”, Journal of Operations
Management, Vol. 21 No. 4, pp. 383-404.
Gagliardi, J.-P., Renaud, J. and Ruiz, A. (2012), “Models for automated storage and
retrieval systems: a literature review”, International Journal of Production
Research, Vol. 50 No. 24, pp. 7110-7125.
31
Garcia, F. C. (2003), Applying Lean Warehouse Operation, Bristol, PA, USA.
Grant, R.M. (1991), “The resource-based theory of competitive advantage:
implications for strategy formulation”, California Management Review, Vol. 33
No. 3, pp. 114-135
Gu, J., Goetschalckx, M. and McGinnis, L.F. (2010), “Research on warehouse design
and performance evaluation: A comprehensive review”, European Journal of
Operational Research, Vol. 203 No. 3, pp. 539-549.
Hackman, S.T., E.H. Frazelle, P.M., Griffin, S.O. Griffin, D.A. Vlatsa (2001),
“Benchmarking Warehousing and Distribution Operations: An Input-Output
Approach”, Journal of Productivity Analysis, Vol. 16 No. 1, pp. 79-100.
Hair, J.F. Jr., Sarstedt, M., Hopkins, L. and Kuppelwieser, V.G. (2014), “Partial least
squares structural equation modelling (PLS-SEM): an emerging tool in business
research”, European Business Review, Vol. 26 No. 2, pp. 106-121.
Hayes, A. F. (2017), Introduction to mediation, moderation, and conditional process
analysis: A regression-based approach, Guilford Publications.
Henseler, J., Ringle, C. M. and Sinkovics, R. R. (2009), "The use of partial least squares
path modeling in international marketing", in Sinkovics, R. R. and Ghauri, P. N.
(Eds.), New challenges to international marketing, Emerald Group Publishing
Limited, pp. 277-319.
Hines, P., Holweg, M. and Rich, N. (2004), “Learning to evolve - a review of
contemporary lean thinking”, International Journal of Operations and Production
Management, Vol. 24 No. 9-10, pp. 994-1011.
Holweg, M. (2007), “The genealogy of lean production”, Journal of Operations
Management, Vol. 25 No. 2, pp. 420-437.
Hübner, A., Kuhn, H. and Wollenburg, J. (2016), "Last mile fulfilment and distribution
in omni-channel grocery retailing: a strategic planning framework", International
Journal of Retail & Distribution Management, Vol. 44 No. 3, pp. 228-247.
Jaca, C., Santos, J., Errasti, A., and Viles, E. (2012), “Lean thinking with improvement
teams in retail distribution: a case study”, Total Quality Management and Business
Excellence, Vol. 23 No. 3-4, pp. 449-465.
Kaiser, H.F. (1974), “An index of factorial simplicity”, Psychometrika, Vol. 39 No. 1,
pp. 31-36.
Kembro, J., Näslund, D., and Olhager, J. (2017), "Information sharing across multiple
supply chain tiers: A Delphi study on antecedents", International Journal of
Production Economics, Vol. 193, pp. 77-86.
Larson, P. D., Poist, R. F. and Halldórsson, Á. (2007), "Perspectives on logistics vs.
SCM: a survey of SCM professionals", Journal of Business Logistics, Vol. 28 No.
1, pp. 1-24.
Laugen, B.T., Acur, N., Boer, H. and Frick, J. (2005), “Best manufacturing practices:
what do the best-performing companies do?”, International Journal of Operations
and Production Management, Vol. 25 No. 2, pp. 131-150.
Ma, Y. (2014), "City Logistics in China–An Empirical Study from An Emerging-
Market-Economy Country", Doctoral dissertation, Technische Universität.
March, J.G. and Sutton, R.I. (1997), “Organizational performance as a dependent
variable” Organizational Science, Vol. 8 No. 6, pp. 698-706.
Melnyk, S.A., Lummus, R.R., Vokurka, R.J., Burns, L.J. and Sandor, J. (2009),
“Mapping the future of supply chain management: a Delphi study”, International
Journal of Production Research, Vol. 47 No. 16, pp. 4629-4653.
Miller, C. C., Washburn, N. T. and Glick, W. H. (2013), “Perspective—the myth of
firm performance”, Organization Science, Vol. 24 No. 3, pp. 948-964.
32
Myerson, P. (2012), Lean supply chain and logistics management, McGraw-Hill, New
York.
Nawanir, G., Kong Teong, L., and Norezam Othman, S. (2013), "Impact of lean
practices on operations performance and business performance: some evidence
from Indonesian manufacturing companies", Journal of Manufacturing
Technology Management, Vol. 24 No. 7, pp1019-1050.
Neely, A., Gregory, M. and Platts, K. (2005), “Performance measurement system
design, a literature review and research agenda”, International Journal of
Operations and Production Management, Vol. 25 No. 12, pp. 1228-1263
Okoli, C. and Pawlowski, S.D. (2004), “The Delphi method as a research tool: an
example, design considerations and applications”, Information and Management,
Vol. 42 No. 1, pp. 15-29.
Oyewobi, L. O., Windapo, A. O. and Rotimi, J. O. B. (2017), "Determinants of
construction organisational performance: A partial least square-path analytic
method", Journal of Financial Management of Property and Construction, Vol.
22 No. 1, pp. 37-61.
Piecyk, M.I. and McKinnon, A.C. (2010), “Forecasting the carbon footprint of road
freight transport in 2020”, International Journal of Production Economics, Vol.
128 No. 1, pp. 31-42.
Piercy, N. and Rich, N. (2009), “Lean transformation in the pure service environment:
the case of the call service center”, International Journal of Operations and
Production Management, Vol. 29 No. 1, pp. 54-76.
Pires, M., Pratas, J., Liz, J. and Amorim, P. (2017), "A framework for designing
backroom areas in grocery stores", International Journal of Retail & Distribution
Management, Vol. 45 No. 3, pp. 230-252.
Rexhausen, D., Pibernik, R. and Kaiser, G. (2012), "Customer-facing supply chain
practices-The impact of demand and distribution management on supply chain
success", Journal of Operations Management, Vol. 30 No. 4, pp. 269-281.
Richard, P.J., Devinney, T.M., Yip, G.S. and Johnson, G. (2009), “Measuring
organizational performance: towards methodological best practice”, Journal of
Management, Vol. 35 No. 5, pp. 718-804.
Rossiter, J. R. (2002), "The C-OAR-SE procedure for scale development in marketing",
International journal of research in marketing, Vol. 19 No. 4, pp. 305-335.
Salhieh, L. and Abushaikha, I. (2016), "Assessing the driving forces for greening
business practices: empirical evidence from the United Arab Emirates' logistics
service industry", South African Journal of Business Management, Vol. 47 No. 4,
pp. 59-69.
Salhieh, L., Abushaikha, I., Atmeh, M. and Mdanat, M. (2018), "Transportation
extended wastes and road haulage efficiency", International Journal of Quality
and Reliability Management, Vol. 35 No. 5, (forthcoming).
Satyam, Aithal, R. K. and Maurya, H. (2017), "Exploring channel conflict in an
emerging economy: the small retailer’s perspective", International Journal of
Retail & Distribution Management, Vol. 45 No. 10, pp. 1061-1078.
Schmidt, R.C. (1997), “Managing Delphi surveys using nonparametric statistical
techniques”, Decision Sciences, Vol. 28 No. 3, pp. 763-74.
Shah, B. and Khanzode, V. (2017), "Storage allocation framework for designing lean
buffers in forward-reserve model: a test case", International Journal of Retail &
Distribution Management, Vol. 45 No. 1, pp. 90-118.
Shah, R. and Ward, P.T. (2007), “Defining and developing measures of lean
production”, Journal of Operations Management, Vol. 25 No. 4, pp. 785-805.
33
Sharma, S. and Shah B. (2015), “A proposed hybrid storage assignment framework: a
case study”, Journal of Operations Management, Vol. 25 No. 4, pp. 785-805
Sharma, S. and Shah, B. (2016), "Towards lean warehouse: transformation and
assessment using RTD and ANP", International Journal of Productivity and
Performance Management, Vol. 65 No. 4, pp. 571-599.
Silvestro, R. (2014), “Performance topology mapping: understanding the drivers of
performance”, International Journal of Production Economics, Vol. 156 No. 1,
pp. 269-282.
Stank, T.P., Rogers, D.S. and Daugherty, P.J. (1994), “Benchmarking: applications by
third party warehousing firms”, Logistics and Transportation Review, Vol. 30 No.
1, pp. 55–72.
Swank, C. K. (2003), “The lean service machine”, Harvard Business Review, Vol. 81
No. 10, pp. 123-130.
Towers, N. and Xu, K. (2016), "The influence of guanxi on physical distribution service
quality availability in e-commerce sourcing fashion garments from China",
Journal of Retailing and Consumer Services, Vol. 28, April, pp. 126-136.
Van den Berg, J.P. and Zijm, J.P. (1999), "Models for warehouse management:
classification and examples”, International Journal of Production Economics,
Vol. 59 No. 1, pp. 519-28.
Venkatraman, N. and Ramanujam, V. (1986), “Measurement of business performance
in strategy research: a comparison of approaches”, Academy of Management
Review, Vol. 11 No. 4, pp. 801-14.
Villarreal, B., Garcia, D., and Rosas, I. (2009), “Eliminating transportation waste in
food distribution: a case study”, Transportation Journal, Vol. 48 No. 4, pp. 72-77.
Villarreal, B., Garza-Reyes, J. A., and Kumar, V. (2016), “Lean road transportation–a
systematic method for the improvement of road transport operations.”, Production
Planning and Control, Vol. 27 No. 11, pp.865-877.
Von der Gracht, H.A. and Darkow, I.-L. (2010), “Scenarios for the logistics services
industry: a Delphi-based analysis for 2025”, International Journal of Production
Economics, Vol. 127 No. 1, pp. 46-59.
Wall, T.D., Michie, J., Patterson, M., Wood, S.J., Sheehan, M., Clegg, C.W. and West,
M. (2004), “On the validity of subjective measures of company performance”,
Personnel Psychology, Vol. 57 No. 1, pp. 95-118.
Womack, J.P. and Jones, D.T. (2005), “Lean consumption”, Harvard Business Review,
Vol. 83 Nol. 3, pp. 58-68.
Womack, J.P., Jones, D.T. (2003), Lean Thinking, 2nd edition. London, Simon and
Schuster.
Yang, C. C. (2016), "Leveraging logistics learning capability to enable logistics service
capabilities and performance for international distribution center operators in
Taiwan", The International Journal of Logistics Management, Vol. 27 No. 2, pp.
284-308.